the influence of financial factors on corporate … influence of financial factors on corporate...
TRANSCRIPT

THE INFLUENCE OF FINANCIAL FACTORS ON CORPORATEINVESTMENT
Karen Mills, Steven Morling and Warren Tease
Research Discussion Paper9402
May 1994
Economic Analysis Department
Reserve Bank of Australia
The authors would like to thank Philip Lowe, Tom Rohling, Geoff Shuetrim, andGlenn Stevens for their thoughtful contributions to the paper. Remaining errors areours. The views expressed in this paper are those of the authors and do notnecessarily reflect the views of the Reserve Bank of Australia

i
ABSTRACT
Recent theoretical developments have shown that cash flows and the structure of afirm’s balance sheet may have an important influence on investment. Establishing alink between cash flows, leverage and investment provides insights into the way thatmonetary policy and cyclical factors more generally influence the corporate sector.If cash flows are an important determinant of investment, then changes in monetarypolicy (by changing interest rates) will influence investment through a cash floweffect as well as through altering the rate at which the returns to investment arediscounted. If this is the case, the higher leverage of the corporate sector implies,other things being equal, that monetary policy may have a larger impact oninvestment than in the past. Furthermore, it suggests that the effects of monetarypolicy will be felt unevenly across the corporate sector. The cash flows of highlygeared firms will be more sensitive to changes in interest rates than cash flows offirms with minimal leverage.
In this paper we use panel-data analysis to examine the impact of financial factorson investment decisions of firms in the Australian corporate sector. We find strongsupport for the influence of financial factors on investment decisions. Leverage,internally-generated cash flows, and the stock of cash and liquid financial assets areall important influences on investment behaviour, particularly for smaller firms,highly leveraged firms, and firms with high retention ratios.

ii
TABLE OF CONTENTS
1. Introduction 1
2. Finance and Investment Theory 2
3. Empirics 6
3.1 An Empirical Model 6
3.2 Estimation 8
3.3 General Results 10
3.4 Other Disaggregated Results 123.4.1 Higher-Leveraged v Lower-Leveraged Companies 123.4.2 Smaller v Larger Companies 143.4.3 Higher v Lower Retention 16
4. Conclusion 18
Appendix: Data Sources and Construction 19
References 21

THE INFLUENCE OF FINANCIAL FACTORS ON CORPORATEINVESTMENT
Karen Mills, Steven Morling and Warren Tease
1. INTRODUCTION
In the past few years there has been a re-emergence of interest in the role thatfinancial factors play in corporate investment decisions. This interest stems fromthe effect that financial factors such as asset prices, gearing and cash flow have hadon shaping the most recent economic cycle. Recent theoretical developments havealso shown that cash flows and the structure of a firm’s balance sheet may have animportant influence on investment.
The potential link between investment and finance implies that some of the changesin the structure of corporate balance sheets in the past decade could havesignificantly altered the dynamics of the economic cycle in Australia. During the1980s, the indebtedness of the corporate sector increased sharply. This could havemade firms more sensitive to the cycle. They may now adjust their expendituresmore quickly in the face of a change in demand to meet their debt obligations.1
Establishing a link between cash flows, leverage and investment also providesinsights into the way in which monetary policy and cyclical factors more generallyinfluence the corporate sector. If cash flows are an important determinant ofinvestment, changes in monetary policy (by changing some interest rates) willinfluence investment of indebted firms through a cash flow effect as well as throughaltering the rate at which the returns to investment are discounted. If this is thecase, the higher leverage of the corporate sector implies, other things being equal,that monetary policy may have a larger impact on investment than in the past.Moreover, it implies that changes in monetary policy may not be transmitted evenlyacross the corporate sector. The cash flows of more highly geared firms will bemore sensitive to changes in interest rates than cash flows of firms with minimalleverage.
1 A discussion of these issues can be found in Bernanke and Campbell (1988), Cantor (1990)
and Friedman (1990).

2
Smaller firms are generally considered to be more sensitive to changes in financialconditions. External funding tends to be relatively more expensive for them becauseproviders of finance have less information about their creditworthiness. Smallerfirms also have limited access to securities or equity markets and are thus morereliant on intermediated funding as a source of external finance. Cash flows are asignificant source of funding for them. Economic shocks that alter cash flows orchange the lending behaviour of intermediaries are thus likely to have a moresignificant influence on the investment decisions of smaller firms.
This paper will explore the link between financial factors and investment in asample of listed non-financial Australian firms.2 First, it will attempt to see if thesefactors are important generally. Next, it will consider whether the importance variesacross firms depending on their financial structure, size or dividend payout policies.The paper finds evidence that financial factors do have a significant influence oninvestment. Investment is positively related to cash flows and the stock of financialassets and negatively related to leverage. Moreover, it appears that investment offirms with higher leverage and smaller firms is more sensitive to financial factorsthan that of other firms. This implies that they could be more sensitive to economicconditions and changes in monetary policy than other firms.
The paper is organised as follows. Section 2 outlines the theoretical links betweenfinance and investment. In Section 3 we present empirical results based on theestimation of a panel-data model. Section 4 concludes the paper.
2. FINANCE AND INVESTMENT THEORY
Financial factors play a limited role in traditional models of investment. Forexample, in the neoclassical model, firms choose inputs of capital (and labour) soas to maximise the present discounted value of their income streams. Financialfactors enter only through the cost of capital which, in turn, is independent of theway the firm finances itself. This independence arises because capital markets areassumed to be perfect. Thus, firms are able to secure external finance for a projectif its expected marginal return exceeds its cost of capital. There is no shortage of
2 McKibbin and Siegloff (1987) incorporate financial factors in a study of aggregate investment
in Australia.
3
funds for firms with value-increasing projects and the marginal costs of debt, equityand internal funds are equal. In this world, the availability of adequate cash flows isnot a constraint on investment and the financial characteristics of the firm do notinfluence its cost of capital. Thus, "interactions between real and financial variablescan be reduced to interactions between real variables and interest rates" (Mauskopf(1990)).
There are a number of reasons to believe that this separation of real and financialfactors would not occur in practice. Some firms (particularly small firms) havelimited access to external sources of funding.3 Cash flows will be their primary, andin some cases, only source of funds.
Even companies with access to external funding will rely more heavily on cashflows as a source of finance. There are direct costs involved in raising externalfunding, such as underwriting and administrative fees.4 There are also potentialfinancial distress costs associated with using external finance. For example, asleverage increases, other things being equal, there may be a higher probability of thefirm facing financial distress. In this case, the firm may incur direct bankruptcycosts such as legal expenses and trustee fees and indirect costs such as thedisruption of operations, loss of suppliers or customers and the imposition offinancial constraints. The present value of these expected costs should be reflectedin current financing costs (whether or not the firm actually enters bankruptcy).Finally, there are issues of taxation, shareholder dilution, control of information, theneed to maintain flexibility and liquidity that may also have an impact on a firm’sfinancing choices. Financial factors may therefore affect the cost and availability ofcapital and so influence the investment decision.
3 Smaller firms have difficulty raising funds from capital markets for a variety of reasons. For
example, Woo and Lange (1992), note that “limited access may arise as a result of prohibitionsor barriers to entry that specifically preclude small firms from gaining funds, either throughregulation or in terms of the costs involved”.
4 Oliner and Rudebusch (1989) find that transaction costs associated with external finance aresignificant in the US. For example, they report that transaction costs account for up to one-quarter of the gross proceeds of small stock issues and one-seventh of the proceeds of smalldebt issues. Although current costs are likely to be considerably lower than this as a result offinancial deregulation and innovation, these costs still remain important (see Allen (1991)).

4
Financial factors are generally introduced to standard investment models throughinformation asymmetries or through agency costs. The introduction of theseassumptions helps explain how a given level of investment will be funded and how afirm's financial position will influence its investment.
Informational asymmetries, where managers have more information about a firmthan potential debt or equity holders, make it difficult for potential creditors andequity holders to evaluate the prospects of different firms. If creditors cannotdistinguish between good quality and poor quality potential borrowers then themarket interest rate is likely to incorporate a premium - good quality borrowerswould be charged more than they would in a perfectly-informed market.5 Similarly,new equity issues may trade at a discount to their value implied by the underlyingprospects of a firm.6 The firm may also incur agency costs - costs borne by ownersof the firm resulting from potential conflicts between managers, debtholders andequityholders.7 For example, the nature of the debt contract may provide anincentive for managers, acting on behalf of equity holders, to pursue riskierinvestment projects than would be pursued under a different financial structure. Ifthe investment is successful, equity holders capture most of the excess gain; if theventure is unsuccessful, both equity holders and debt holders share the burden.Because debtholders anticipate this type of behaviour, they price debt contractsaccordingly.
The effect of these information problems is to boost the cost of external financerelative to internal finance. These cost differentials provide some insight into how agiven level of investment will be funded - cash flows will be preferred to debtwhich, in turn, will be preferred to new equity issues.8 Recent Australian evidence
5 Akerlof (1970) and Stiglitz and Weiss (1981).6 Myers and Majluf (1984).7 There are many types of agency costs discussed in the literature (see Harris and Raviv (1991)).8 This financing hierarchy results because cash flows will be the cheapest source of funds,
followed by debt and then by new equity. Debt will be cheaper than new equity financingbecause the debt contract can be structured in such a way as to minimise the consequences ofthe informational problems. A number of studies confirm the existence of financinghierarchies. Chaplinsky and Niehaus (1990) and Amihud et al. (1990), for example, findevidence that firms prefer internally sourced funds to external securities. Direct managementsurveys such as Allen (1991) and Pinegar and Wilbricht (1989) confirm these findings.
5
(Shuetrim, Lowe, and Morling (1993)) shows that the capital structure of the firmcan be explained in part by these types of informational problems.
The theoretical extent of asymmetric information problems and agency costs can beshown to be a function of the structure of a firm's balance sheet. Accordingly, thestructure of a firm's balance sheet will influence its investment decision and shocksto the balance sheet will alter the evolution of investment over time.9 Firms canalter the cost of funding investment in a number of ways. Higher cash flows directlyreduce the cost of funds because firms will be less reliant on more costly externalfunding. They also help reduce the costs of external funds by increasing thecollateral backing of external finance.10 Recent evidence from the United Statessuggests that firms often "reliquify", that is, build up their stock of financial assetsbefore undertaking large investments (Whited (1991) and Eckstein and Sinai(1986)). They do this either because they have limited access to external finance orbecause it provides them with collateral to obtain external funding at lower cost.Shifts in cash flows, financial assets and leverage may thus influence the dynamicsof investment. Indeed, Bernanke and Gertler (1989) show that shocks to balancesheets can increase the amplitude of the investment cycle in a simple neoclassicalmodel.
Because the degree of asymmetric information and agency costs depends on firmcharacteristics, certain firms may be more sensitive to financial factors than others.For example, investors are likely to be less well-informed about smaller companies.This may hinder their ability to raise funds and boost the costs of external funding.Changes in cash flows may thus be a more important determinant of investment forsmaller companies.11 Also, the investment of firms with higher leverage may bemore sensitive to cash flows than that of firms with lower leverage. The increaseddebt servicing obligations resulting from higher leverage mean that the available 9 Mills, Morling and Tease (1993) provide an analysis of the recent Australian experience.10 Bernanke and Gertler (1989) develop a model in which fluctuations in a firm’s balance sheet
change the agency costs of external funding and induce fluctuations in investment. Agencycosts are assumed to be positively related to collateralisable net worth. This results in acyclical relationship between balance sheets and investment. During an upturn, for example,net worth increases, agency costs are thus reduced and thus investment picks up. Similarly,shocks to net worth independent of the cycle will alter investment. See Lowe and Rohling(1993) for Australian evidence.
11 Gertler (1988) and Fazzari, Hubbard and Peterson (1988).

6
cash flows of higher-geared firms are smaller and thus they have less of a bufferagainst disturbances.
Consideration of these links between investment and the balance sheet position ofthe corporate sector enriches the theoretical representation of the way that monetarypolicy is transmitted. In simple models, monetary policy affects corporateinvestment directly by altering the rate at which the expected returns to investmentare discounted and indirectly through its effects on demand in the economygenerally. Adding financial factors into the analysis means that monetary policywill also affect investment through its effect on the financial position of thecorporate sector. A tightening in policy, for example, will increase interestpayments and reduce cash flow. This will reduce the availability of relatively cheapinternal funds and also increase the cost of external funds. Additionally, asset priceswill fall, reducing the collateral that firms can provide to outside financiers, raisingthe cost of external funding. Investment may be affected through these channels inaddition to the intertemporal substitution effects of standard theory. Because theimportance of these factors will vary across firms depending on their size andfinancial structure, changes in monetary policy will be transmitted unevenly acrossthe corporate sector.
3. EMPIRICS
3.1 An Empirical Model
In this section we present some empirical results on the influence of financial factorson investment. Fazzari et al. (1988) and Devereux and Schiantarelli (1989) deriveempirically tractable investment equations that encompass both standard investmentmodels and the effects of financial constraints.12 Firms are assumed to maximise
12 Fazzari et al. (1988) use a ‘q’ framework extended to include a premium for issuing new
shares. The premium results in a cost differential between internally generated funds and newequity finance. They show that, for certain classes of firms, internal funds may be important,but other firms may behave as if there were only limited capital market imperfections.Devereux and Schiantarelli (1989) use a ‘q’ model extended to include informationalasymmetries and the risk of bankruptcy. The Devereux and Schiantarelli model is a moregeneral form than the Fazzari model. A wider range of financial factors are explicitlyincorporated in the model and it also allows capital market imperfections and the availability ofinternally generated cash flows to possibly influence investment decisions of all companies.

7
the present value of the post-tax dividend stream, adjusted for new share issues,subject to a number of constraints. The expression is modified to include a premiumdemanded by potential equity investors when information problems exist.Agency/financial distress costs are assumed to be a positive function of leverage anda negative function of cash flows, the capital stock and the stock of liquid assets forreasons discussed earlier.13 In these models, investment is therefore a positivefunction of Tobin’s ‘q’, cash flows and the stock of liquid assets and a negativefunction of leverage. Several authors have also argued for the inclusion of sales inthis equation (Fazzari et al. (1988)). This controls for demand effects that are notadequately reflected in ‘q’ and that may be otherwise captured by the cash flowterm.
The estimating equation is14:
IK
qC
KLK
DK
SK
it
itit
it
it
it
it
it
it
it
it−−
−−−
−− −
= + +
+
+
+
1
1 1 21
31
24
1
25
1α β β β β β (1)
where:
I = investment
K = capital stock
q = Tobin’s ‘q’
C = cash flows
L = stock of liquid financial assets
D = stock of outstanding debt
S = sales
13 In the Devereux and Schiantarelli (1989) model, agency/financial distress costs are modelled by
adding an additional cost term in the sources and uses of funds constraint. Agency costs areassumed to be an increasing function of debt and a decreasing function of cash flow and liquid(collateralisable) assets. In the Fazzari model, the reduced form equation is similar, althoughthe financial variables play a slightly different role; retained earnings provide a low cost sourceof funds, debt finance also provides a low cost source of funds but the cost advantage overexternal equity finance declines with increasing leverage, and liquid assets provide a low costsource of funds for investment and a cushion between investment and cash flow fluctuations.
14 For the full derivation of equation (1) see Devereux and Schiantarelli (1989).

8
All variables are expressed in nominal terms and, with the exception of ‘q’, arestandardised by the capital stock. A full description of data sources andconstruction is given in the Appendix.
The cash flow and sales terms in equation (1) are contemporaneous - likeinvestment, these are flows. They reflect current availability of internal funds andcurrent demand pressures. The other terms in equation (1) are lagged one period -these terms are stocks and are measured at the end of the period. Because of this,the lagged value (or starting period value) more accurately reflects the informationset available to firms when the investment decision is made. It also avoids some ofthe problems associated with possible simultaneity in investment and capitalstructure decisions.
3.2 Estimation
Panel-data models are usually estimated using either fixed or random effectstechniques. These two techniques have been developed to handle the systematictendency of individual specific components to be higher for some units than forothers - the random effects estimator is used if the individual specific component isassumed to be random with respect to the explanatory variables. The fixed effectsestimator is used if the individual specific component is not independent withrespect to the explanatory variables.15
Hausman (1978) provides a test for discriminating between the fixed effects andrandom effects estimators. The test is based on comparing the difference betweenthe two estimates of the coefficient vectors, where the random effects estimator isefficient and consistent under the null hypothesis and inconsistent under thealternative hypothesis, and the fixed effects estimator is consistent under both thenull and the alternative hypothesis. If the null is true, the difference between theestimators should be close to zero. The calculation of the test statistic (distributedχ2) requires the computation of the covariance matrix of β1 - β2. In the limit thecovariance matrix simplifies to Var(β1) - Var(β2), where β1 is the fixed effectsestimator. The computed Hausman statistic in our model, however, was negative,reflecting the finite-sample problems in calculating the covariance matrix. Thechoice of estimator is therefore somewhat arbitrary. Our priors are that there is 15 See Keane and Runkle (1992) for a review of the estimation of panel-data models.

9
likely to be correlation between the error term and the regressors in this type of data- in this case the random effects model is efficient but inconsistent and the fixedeffects estimator should be used.16 The fixed effect model is estimated in the form:
it i it i it iY Y B X X e e− = − + −( ) ( ) (2)
where eit is a mean-zero time-varying error and variables without time subscripts arethe individual means. Subtracting individual means removes the need to estimateeach of the individual effects.
A RESET test was performed to test for functional form misspecification and/oromitted variables.17 The F(3,590) statistic of 2.165 indicated that the null hypothesisof no functional misspecification could not be rejected at the 5 per cent level ofsignificance.
Heteroskedasticity is likely to be a significant problem with company data. In theestimation, corrections were made to the covariance matrix to allow for conditionalheteroskedasticity (White (1980)).
3.3 General Results
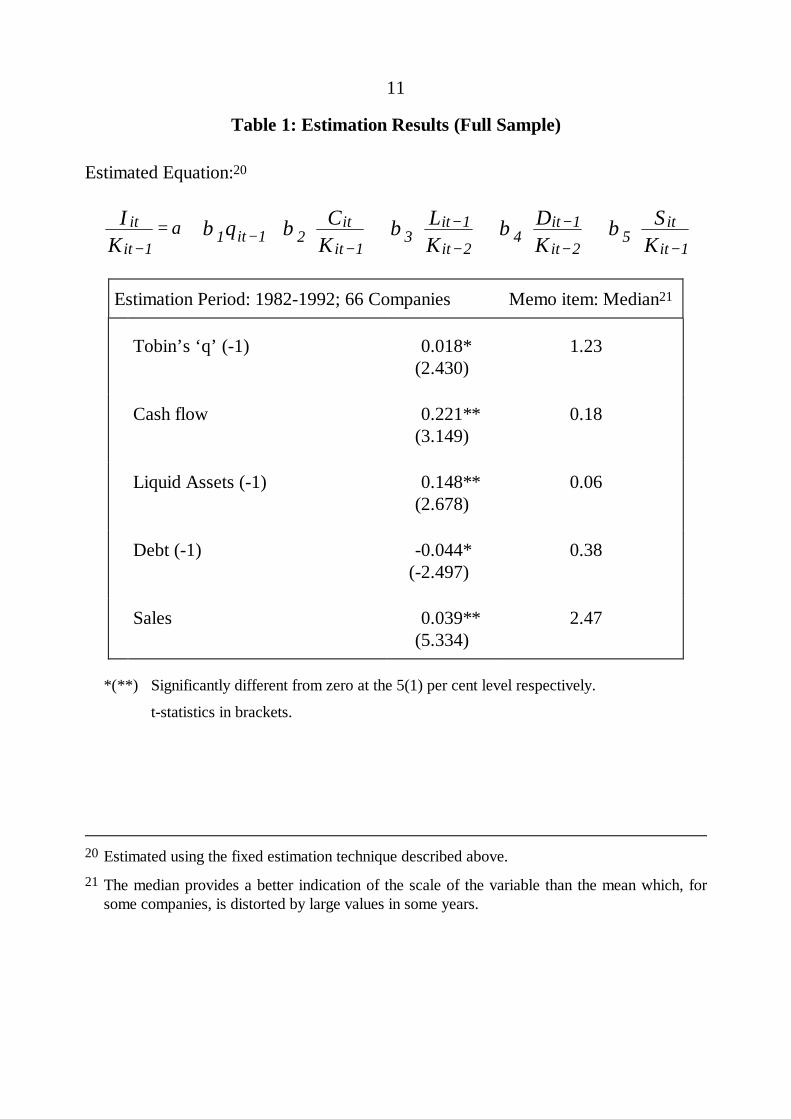
The results of estimating equation (1) are reported in Table 1. The results providesupport for the standard investment models such as Tobin’s ‘q’, and accelerator-type models.18 The coefficients on both Tobin’s ‘q’ and sales have the expectedsigns and they are significant at the five per cent and one per cent levels
16 We also used the procedure suggested in Griliches and Hausman (1986) to check for errors in
variables problems before proceeding with the final estimation.17 The form of the RESET test was:
uI
KI
KI
Kt oit
itit
itit
it= +
FHGG
IKJJ +
FHGG
IKJJ +
FHGG
IKJJ
∧
−
∧
−
∧
−α α α α1
2
2
3
3
4
1 1 1
where ut are the residuals from equation (1) and ∧
−I Kit it/ 1b g are the predicted values ofinvestment.
18 Hayashi (1982) shows that the Tobin’s ‘q’ model of investment is equivalent to theneoclassical model under certain conditions.

10
respectively. Interpreted in conjunction with the scale of the variables (reported asa memo item in Table 1), the results suggest that sales has the greater economicimportance of the two terms. The finding that both terms are significant suggeststhat neither model in itself provides a complete explanation of investment behaviour.
The results support the hypothesis that financial variables also influence investment.The coefficients on cash flow and on the stock of liquid assets have the expectedsigns and are each significant at the one per cent level.19 These coefficients, wheninterpreted in conjunction with the scale of the variables, indicate that cash flow hasan important influence on investment and that the stock of cash and liquid assets,although significant, are probably a less important influence. Note that cash flows(and the stock of liquid assets) are not merely proxies for current or expectedprofitability - these are effectively controlled for by including both ‘q’ and sales inthe equation. Cash flow provides the only source of finance for those firms that areliquidity constrained, and for those firms that do have access to external capitalmarkets, cash flows provide a relatively cheaper form of finance. These findings areconsistent with McKibbin and Siegloff (1987) who find a significant role for cashflow in a study of aggregate investment in Australia.
The debt term is also correctly signed and significant at the five per cent level. Thisresult suggests that capital structure does effect investment behaviour. Higher levelsof debt result in an increased probability of financial distress and the demand forhigher returns by potential suppliers of funds. Although the effect is not large, it ispotentially important for many firms.
19 Equation (1) was also estimated using a working capital variable in the place of the cash and
liquid financial assets variable. Whited (1991) argues that reliquification can be tested byincluding this financial distress variable directly in the regression equation. The coefficient onthis variable had the correct sign and was significant at the 10 per cent level. The variable wasnot significant, however, when the cash and liquid financial assets term was also included in theequation. These variables perform a similar role in the equation and the working capitalvariable was excluded from the final estimating equation.
11
Table 1: Estimation Results (Full Sample)
Estimated Equation:20
it
itit
it
it
it
it
it
it
it
it
IK
q CK
LK
DK
SK−
−−
−−
−− −
= + +
+
+
+
11 1 2
13
1
24
1
25
1α β β β β β
Estimation Period: 1982-1992; 66 Companies Memo item: Median21
Tobin’s ‘q’ (-1) 0.018*(2.430)
1.23
Cash flow 0.221**(3.149)
0.18
Liquid Assets (-1) 0.148**(2.678)
0.06
Debt (-1) -0.044*(-2.497)
0.38
Sales 0.039**(5.334)
2.47
*(**) Significantly different from zero at the 5(1) per cent level respectively.
t-statistics in brackets.
20 Estimated using the fixed estimation technique described above.21 The median provides a better indication of the scale of the variable than the mean which, for
some companies, is distorted by large values in some years.

12
3.4 Other Disaggregated Results22
3.4.1 Higher-Leveraged v Lower-Leveraged Companies
Corporate leverage increased during the 1980s. This, coupled with higher nominalinterest rates, resulted in a sharp decline in interest cover. This may have madefirms’ investment decisions more sensitive to economic conditions. Higher leveragemeans that a greater portion of firms’ cash flows must be used to meet interestpayments on debt. Should cash flows fall, firms may not be easily able to meet theseobligations. To do so, they may need to curtail investment and employment. Recentempirical evidence from the United States shows that the variability of investmentincreases with higher leverage.23
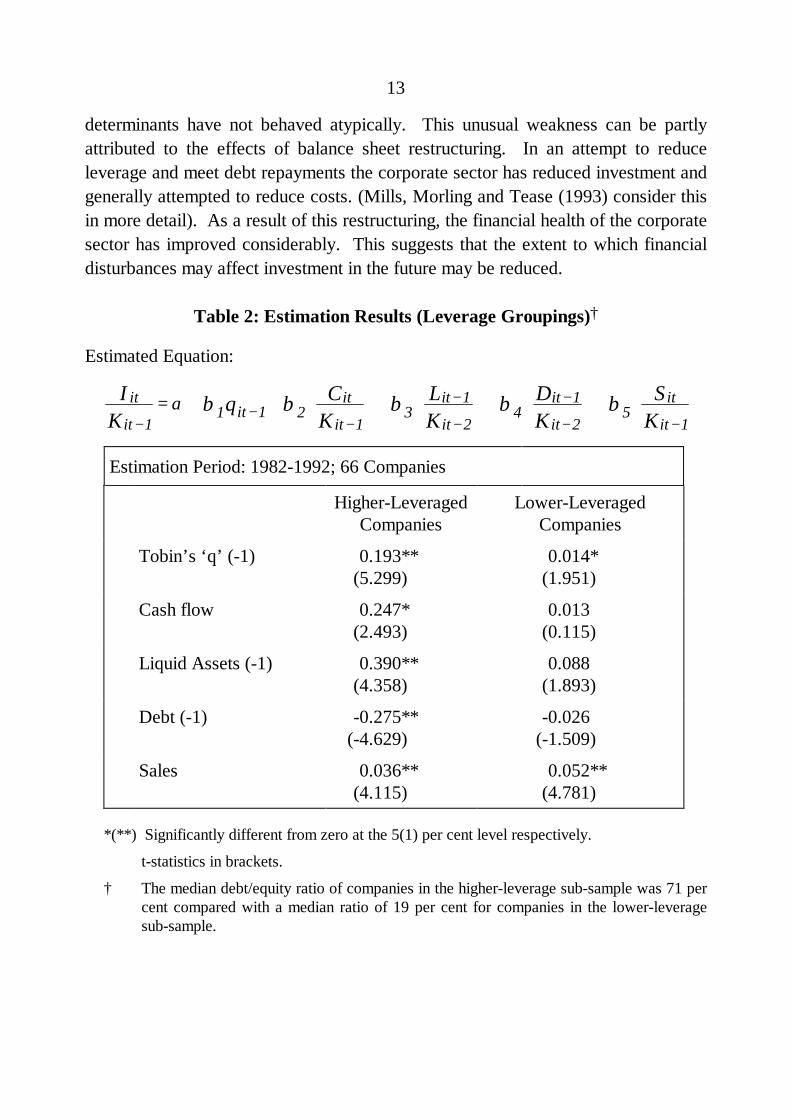
To test for this possibility indirectly, the sample was split into two equal subsamplesbased on firms’ median leverage over the period and the behaviour ofhigher-leveraged firms relative to those with lower leverage was examined. Theresults are presented in Table 2. Higher-geared companies might be expected to bemore sensitive to leverage and the availability of cash flows (and the stock offinancial assets) to service the debt. The results tend to support these priors. Forcompanies with the lower leverage, fundamentals represented by ‘q’ and by thesales term are significant; the financial factors are not. This would suggest thatfinancial factors are not a constraint on firms with low leverage. For the companieswith higher leverage, sales and ‘q’ are important, but so too are the financial factors.The coefficients on each of the financial factors are significant and of the right sign.The coefficients are also larger than those for firms with lower leverage. Financialfactors, therefore, seem to be more economically as well as statistically moreimportant an influence on investment for firms with higher leverage.
These results suggest that investment is more sensitive to financial conditions whenleverage is higher. An examination of the behaviour of investment during the mostrecent cycle supports this conclusion. Business fixed investment has been muchweaker in the past few years than in earlier cycles, even though many of its
22 The full sample is divided into a number of overlapping subsamples. One possible alternative
procedure would be to use the full sample and introduce various dummies to control for firmcharacteristics. However, the latter procedure would not yield the direct comparisons availableusing the subsamples.
23 Bernanke and Gertler (1989).
13
determinants have not behaved atypically. This unusual weakness can be partlyattributed to the effects of balance sheet restructuring. In an attempt to reduceleverage and meet debt repayments the corporate sector has reduced investment andgenerally attempted to reduce costs. (Mills, Morling and Tease (1993) consider thisin more detail). As a result of this restructuring, the financial health of the corporatesector has improved considerably. This suggests that the extent to which financialdisturbances may affect investment in the future may be reduced.
Table 2: Estimation Results (Leverage Groupings)†
Estimated Equation:
it
itit
it
it
it
it
it
it
it
it
IK
q CK
LK
DK
SK−
−−
−−
−− −
= + +
+
+
+
11 1 2
13
1
24
1
25
1α β β β β β
Estimation Period: 1982-1992; 66 Companies
Higher-LeveragedCompanies
Lower-LeveragedCompanies
Tobin’s ‘q’ (-1) 0.193**(5.299)
0.014*(1.951)
Cash flow 0.247*(2.493)
0.013(0.115)
Liquid Assets (-1) 0.390**(4.358)
0.088(1.893)
Debt (-1) -0.275**(-4.629)
-0.026(-1.509)
Sales 0.036**(4.115)
0.052**(4.781)
*(**) Significantly different from zero at the 5(1) per cent level respectively.
t-statistics in brackets.
† The median debt/equity ratio of companies in the higher-leverage sub-sample was 71 percent compared with a median ratio of 19 per cent for companies in the lower-leveragesub-sample.

14
3.4.2 Smaller v Larger Companies
To look at the results a little more closely, we split the original sample of companiesinto a number of other subsamples. In Table 3, we present the results of theestimation of equation (1) on two equal-sized subsamples of companies. The firstsample is comprised of the larger companies (based on average marketcapitalisation over the period). The second sample is comprised of the smallercompanies in the sample. Larger companies might be expected to have greateraccess to external capital markets because of the size of their collateralisable assets,access to alternative sources of finance and lower risk through diversification,stability of cash flows, established operating history and commercial relationshipsand through their recognition in capital markets and credit history. They will be lessreliant on internal funding than smaller firms.
The results presented in Table 3 provide some support for this idea. Although salesare important for both groups, internal cash flow is only significant for the smallerfirms. For smaller firms the coefficient on cash flow is large and significant at theone per cent level. This implies that smaller firms may be more reliant on internalsources of funding than larger firms. Any disruption to cash flow will thus have alarger impact on investment. Debt is significant for larger companies, but not for thesmaller companies. In both cases, however, the coefficient is small. ‘q’ is alsosignificant for smaller companies, but again the coefficient is relatively small.
It is worth noting that the "smaller" companies in our sub-sample are medium-sized,publicly listed companies. They are less likely to be liquidity constrained than themajority of smaller unlisted companies in the economy not included in our sample,and are likely to face lower costs for external funds, lower potential agency costsand also to benefit from market recognition. If cash flows are more important forthis group of companies (compared with the very large companies in our sample) itis likely that the results also apply strongly to smaller companies that are not in oursample.

15
Table 3: Estimation Results (Size Groupings)†
Estimated Equation:
it
itit
it
it
it
it
it
it
it
it
IK
q CK
LK
DK
SK−
−−
−−
−− −
= + +
+
+
+
11 1 2
13
1
24
1
25
1α β β β β β
Estimation Period: 1982-1992; 66 Companies
LargerCompanies
SmallerCompanies
Tobin’s ‘q’ (-1) 0.010(1.106)
0.057**(2.623)
Cash flow 0.155(0.852)
0.238*(2.561)
Liquid Assets (-1) 0.092(1.441)
0.124(1.118)
Debt (-1) -0.065*(-2.327)
-0.038(-0.815)
Sales 0.075**(2.786)
0.028**(3.993)
*(**) Significantly different from zero at the 5(1) per cent level respectively.
t-statistics in brackets.
† The average market capitalisation of the larger companies in the sample was 12 timesthat of the smaller companies.
16
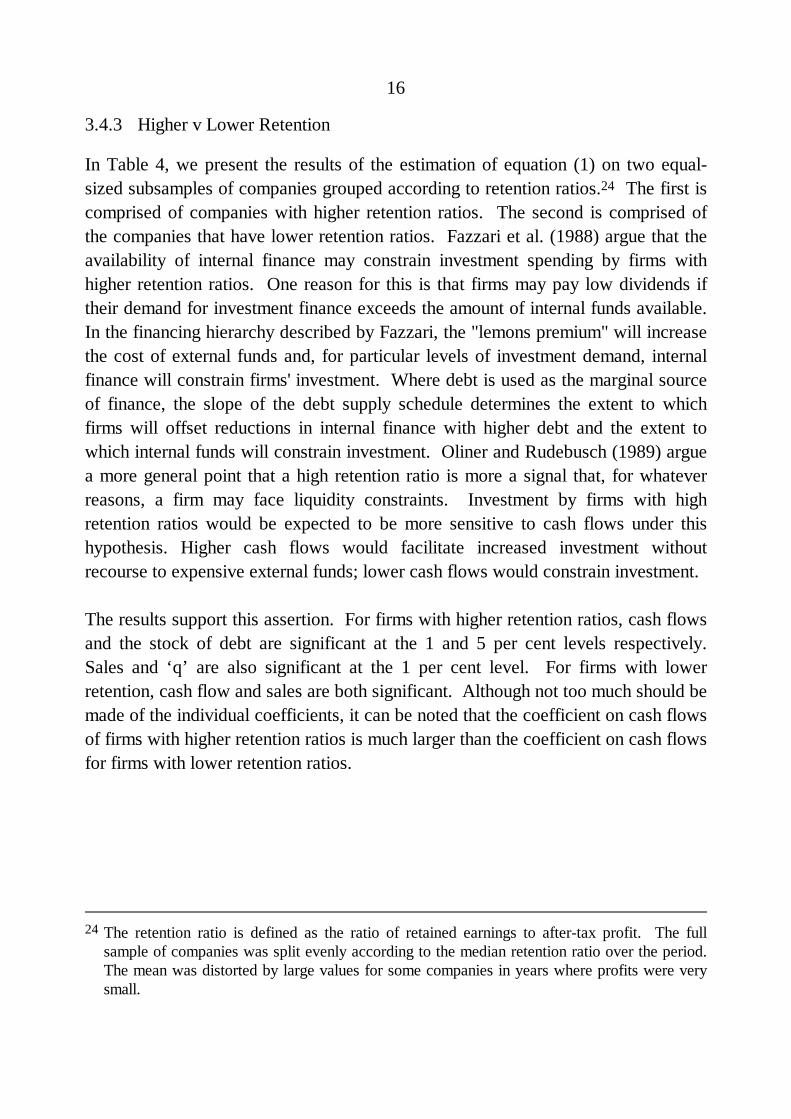
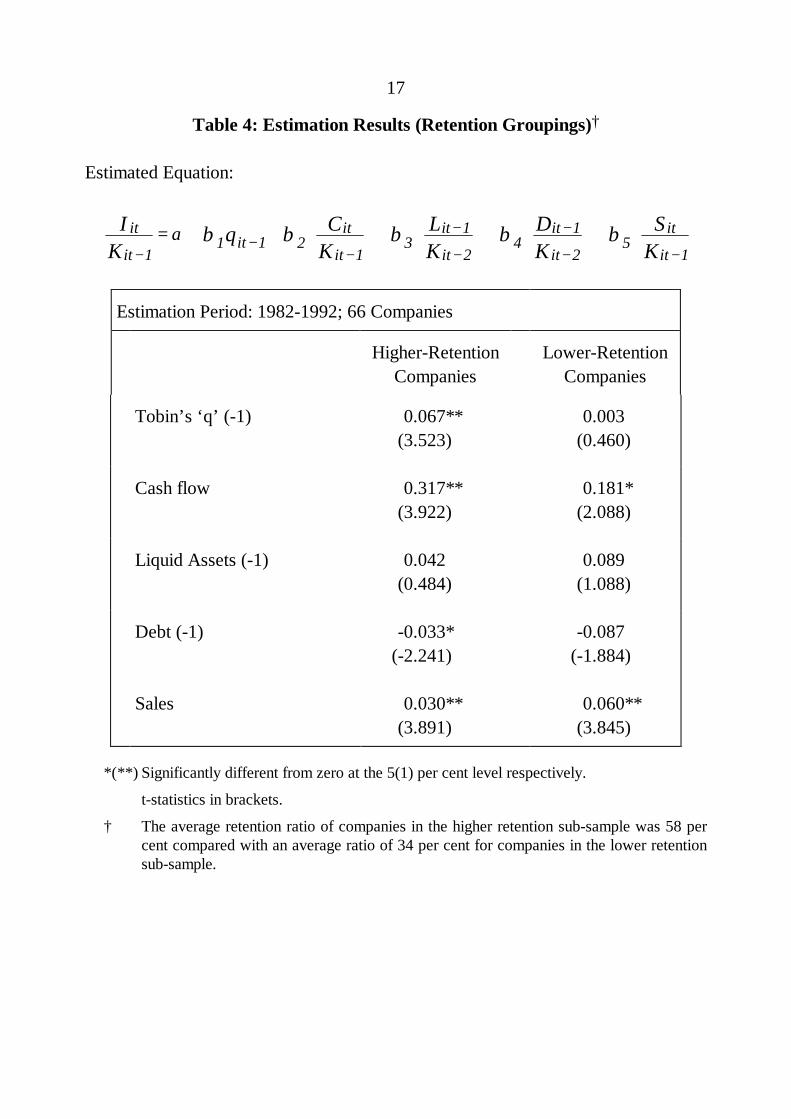
3.4.3 Higher v Lower Retention
In Table 4, we present the results of the estimation of equation (1) on two equal-sized subsamples of companies grouped according to retention ratios.24 The first iscomprised of companies with higher retention ratios. The second is comprised ofthe companies that have lower retention ratios. Fazzari et al. (1988) argue that theavailability of internal finance may constrain investment spending by firms withhigher retention ratios. One reason for this is that firms may pay low dividends iftheir demand for investment finance exceeds the amount of internal funds available.In the financing hierarchy described by Fazzari, the "lemons premium" will increasethe cost of external funds and, for particular levels of investment demand, internalfinance will constrain firms' investment. Where debt is used as the marginal sourceof finance, the slope of the debt supply schedule determines the extent to whichfirms will offset reductions in internal finance with higher debt and the extent towhich internal funds will constrain investment. Oliner and Rudebusch (1989) arguea more general point that a high retention ratio is more a signal that, for whateverreasons, a firm may face liquidity constraints. Investment by firms with highretention ratios would be expected to be more sensitive to cash flows under thishypothesis. Higher cash flows would facilitate increased investment withoutrecourse to expensive external funds; lower cash flows would constrain investment.
The results support this assertion. For firms with higher retention ratios, cash flowsand the stock of debt are significant at the 1 and 5 per cent levels respectively.Sales and ‘q’ are also significant at the 1 per cent level. For firms with lowerretention, cash flow and sales are both significant. Although not too much should bemade of the individual coefficients, it can be noted that the coefficient on cash flowsof firms with higher retention ratios is much larger than the coefficient on cash flowsfor firms with lower retention ratios.
24 The retention ratio is defined as the ratio of retained earnings to after-tax profit. The full
sample of companies was split evenly according to the median retention ratio over the period.The mean was distorted by large values for some companies in years where profits were verysmall.
17
Table 4: Estimation Results (Retention Groupings)†
Estimated Equation:
it
itit
it
it
it
it
it
it
it
it
IK
q CK
LK
DK
SK−
−−
−−
−− −
= + +
+
+
+
11 1 2
13
1
24
1
25
1α β β β β β
Estimation Period: 1982-1992; 66 Companies
Higher-RetentionCompanies
Lower-RetentionCompanies
Tobin’s ‘q’ (-1) 0.067**(3.523)
0.003(0.460)
Cash flow 0.317**(3.922)
0.181*(2.088)
Liquid Assets (-1) 0.042(0.484)
0.089(1.088)
Debt (-1) -0.033*(-2.241)
-0.087(-1.884)
Sales 0.030**(3.891)
0.060**(3.845)
*(**) Significantly different from zero at the 5(1) per cent level respectively.
t-statistics in brackets.
† The average retention ratio of companies in the higher retention sub-sample was 58 percent compared with an average ratio of 34 per cent for companies in the lower retentionsub-sample.

18
4. CONCLUSION
These results provide useful insights into business investment decisions and also onhow monetary policy will affect those decisions.
The structure of a firm’s balance sheet and the availability of adequate internalsources of funds can influence investment. Higher leverage can discourageinvestment by, for example, raising the cost of obtaining further external finance.Higher cash flows will boost investment by providing more, relatively cheap,internal funds and increasing the collateral backing of the firm. While both factorsare statistically significant it appears that the cash flow effect is the moreeconomically important. The extent to which these factors influence investmentdoes, however, appear to vary between firms. The results suggest that internalsources of funding are more important for small firms, highly leveraged firms andfirms that have high retention ratios.
These results have a number of important implications for monetary policy. First,the importance of cash flows as a determinant of investment suggests that monetarypolicy will influence investment through cash flow as well as through influencing thediscount rate applied to investment projects and to overall economic conditions.Second, the impact of monetary policy will fall unevenly across the corporatesector. Smaller firms, firms with higher leverage and firms more reliant on cashflows as a source of funding are likely to be more sensitive to changes in monetarypolicy than others. The results in Tables 2 to 4 show that financial variables ingeneral, and cash flows in particular, are a significant influence on investment ofthese firms. Financial factors appear to be less (if at all) important for larger firmsor for firms with lower gearing.

19
APPENDIX: DATA SOURCES AND CONSTRUCTION
Company data are from the Australian Stock Exchange STATEX database and arefor a sample of 66 non-financial companies for which data are available for the 11year period 1982 to 1992.
Gross Cash Flow is group net profit after tax, plus depreciation.
Sales are sales or trading revenue (excluding other income).
Debt is calculated as the sum of both short and long-term securities and loans, andbank overdrafts. Short-term and long-term debt includes secured and unsecuredloans, mortgages, leases, bills payable but excludes trading debts. Bank overdraftincludes both secured and unsecured overdrafts.
Cash and Liquids are cash and its equivalent, including cash on hand, cash at bank,and short-term deposits.
Tobin’s ‘q’ is calculated as:
' ' ( )( )q V B FK N= + −
+where:
V = market value of equityB = market value of debtF = market value of financial assetsN = market value of inventoriesK = replacement value of the capital stock
The components of ‘q’ are:
(i) Market Value of Equity
The market value of common equity, V, is the number of Equivalent Fully PaidShares multiplied by the end of month price for the month in which the financialyear ends. Equivalent Fully Paid Shares are the number of shares on issue at yearend plus the number of potential fully paid shares (including contributing, new anddeferred shares, and options and convertible notes).25
25 See The STATEX Guide to Ratios, Australian Stock Exchange.

20
(ii) Value of Debt
Debt, B, is defined as the sum of bank overdrafts, debt due in one year and long-term debt. Bank overdrafts include both secured and unsecured overdrafts. Debtdue in one year and long-term debt includes secured and unsecured loans,mortgages, leases and bills payable but does not include trading balances. The bookvalue of debt is taken as a proxy for market value.
(iii) Financial Assets and Inventories
Balance sheet items such as inventories and cash and short-term investments areincluded in the market valuation of the firm, but not in the replacement costs of thefixed capital stock. The value of cash and liquid assets are deducted from thenumerator and inventories are added to the denominator.26
(iv) Replacement Value of the Capital Stock
A recursive formula is used to calculate the replacement value of the capital stock,K:
[ ( )]( )t t t tI
tIK I K P P= + −− −1 1 1 δ
where I is gross capital accumulation, PI is the implicit price deflator for gross fixedprivate non-dwelling investment, and δ is the depreciation rate. The price deflator isfrom the Australian National Accounts, (Table 11), Cat. No. 5206.0, AustralianBureau of Statistics. The initial value of the capital stock is adjusted by multiplyingthe firm’s book value of net capital stock by the aggregate ratio of net capital stockat replacement cost to net capital stock at historical cost for the economy as awhole. The aggregate ratio is calculated using data from Australian NationalAccounts, Capital Stock, (Table 6), Cat. No. 5221.0, Australian Bureau of Statisticsand from historical capital stock data supplied by the Australian Bureau ofStatistics. Depreciation rates were calculated by taking the weighted ratio ofdepreciation to capital stock for non-dwelling construction and plant and equipment.Data are from Australian National Accounts, Capital Stock, (Table 6), Cat. No.5221.0, Australian Bureau of Statistics.
26 See Schaller (1990), Hoshi and Kashyap (1987) and Hayashi and Inoue (1987).

21
REFERENCES
Akerlof, G. A. (1970), "The Market for Lemons: Quality Uncertainty and theMarket Mechanism", Quarterly Journal of Economics, 84, pp. 488-500.
Allen, D.E. (1991), "The Determinants of the Capital Structure of Listed AustralianCompanies: The Financial Manager’s Perspective", Australian Journal ofManagement, 16(2), pp. 103-127.
Amihud, Y. B., B. Lev, and N. G. Travlos (1990), "Corporate Control and theChoice of Investment Financing: The Case of Corporate Acquisitions", Journal ofFinance, 45, pp. 603-616.
Bernanke, B.S. and J.Y. Campbell (1988), "Is There a Corporate Debt Crisis?",Brookings Papers on Economic Activity, 1, pp. 83-139.
Bernanke, B.S. and M. Gertler (1989), "Agency Costs, Net Worth and BusinessFluctuations", American Economic Review, 79, pp. 14-31.
Callen, T. (1991), Investment and Financing Costs: An Investigation UsingCompany Accounts Data, Unpublished Reserve Bank of Australia, mimeo.
Cantor, R. (1990), "Effects of Leverage on Corporate Investment and HiringDecisions", Federal Reserve Bank of New York Quarterly Review, Summer,pp. 31-41.
Chaplinsky, S. and G. Niehaus (1990), The Determinants of Inside Ownership andLeverage, Working Paper, University of Michigan.
Devereux, M. and F. Schiantarelli (1989), Investment, Financial Factors and CashFlow: Evidence from UK Panel Data, NBER Working Paper No. 3116.
Eckstein, O. and A. Sinai (1986), "The Mechanisms of the Business Cycle in thePostwar Era", in R.J. Gordon (eds.), The American Business Cycle: Continuity andChange, University of Chicago Press, Chicago.

22
Fazzari, F.M., R.G. Hubbard and B. C. Petersen (1988), "Financing Constraintsand Corporate Investment", Brookings Papers on Economic Activity, 1,pp. 141-195.
Friedman, B. (1990), "Implications of Increasing Corporate Indebtedness forMonetary Policy", Occasional Papers 29, Group of Thirty, New York.
Gertler, M. (1988), "Financial Structure and Aggregate Economic Activity: AnOverview", Journal of Money Banking and Credit, 20, pp. 559-596.
Griliches, Z. and J. Hausman (1986), "Errors in Variables", Journal ofEconometrics, 31, pp. 93 -118.
Harris, M. and A. Raviv (1991), "The Theory of Capital Structure", Journal ofFinance, 46, pp. 297-355.
Hausman, J. (1978), "Specification Tests in Econometrics", Econometrica, 46(6),pp. 1251-1273.
Hayashi, F. (1982), "Tobin’s Marginal ‘q’ and Average ‘q’: A NeoclassicalInterpretation", Econometrica, 50(1), pp. 213-224.
Hayashi, F. and T. Inoue (1987), "Implementing the Q Theory of Investment inMicro Data: Japanese Manufacturing 1977-1985", Osaka University.
Hoshi, T. and A. Kashyap (1987), Evidence on Q for Japanese Firms, MIT,mimeo.
Keane, M.P. and D.E. Runkle (1992), "On the Estimation of Panel Data ModelsWith Serial Correlation When Instruments Are Not Strictly Exogenous", Journal ofBusiness and Economic Statistics, 10(1), pp. 1-9.
Lowe, P. and T. Rohling (1993), "Agency Costs, Balance Sheets and the BusinessCycle", Reserve Bank of Australia Research Discussion Paper No. 9311.
Mauskopf, E. (1990), "The Transmission Channels of Monetary Policy: How HaveThey Changed?", Federal Reserve Bulletin, December.

23
McKibbin, W. and E.S. Siegloff (1987), "A Note on Aggregate Investment inAustralia", Reserve Bank of Australia Research Discussion Paper No. 8709.
Mills, K., S. Morling, and W. Tease (1993), "Balance Sheet Restructuring andInvestment", Reserve Bank of Australia Research Discussion Paper No. 9308.
Myers, S. C. and N. S. Majluf (1984), "Corporate Financing and InvestmentDecisions When Firms Have Information That Investors Do Not Have", Journal ofFinancial Economics, 13(2), pp. 187-221.
Oliner, S.D. and G.D. Rudebusch (1989), Internal Finance and Investment:Testing the Role of Asymmetric Information and Agency Costs, Board of Governorsof the Federal Reserve System, Working Paper Series No. 101.
Pinegar, J.M. and L. Wilbricht (1989), "What Managers Think of CapitalStructure Theory: A Survey", Financial Management, 18(4), Winter, pp. 82-91.
Ross, S.A. (1977), "The Determination of Financial Structure: The IncentiveSignalling Approach", Bell Journal of Economics, 8, pp. 23-40.
Schaller, H. (1990), "A Re-Examination of the Q Theory of Investment Using U.S.Firm Data", Journal of Applied Econometrics, 5, pp. 309-325.
Shuetrim, G., P. Lowe and S. Morling (1993), "The Determinants of CorporateLeverage: A Panal Data Analysis", Reserve Bank of Australia Research DiscussionPaper No. 9313.
Stiglitz, J.E. and A. Weiss (1981), "Credit Rationing in Markets with ImperfectInformation", American Economic Review, 71, pp. 393-410.
White, H. (1980), "A Heteroskedasticity-Consistent Covariance Matrix Estimatorand Direct Test for Heteroskedasticity", Econometrica, 48, pp. 817-838.
Whited, T.M. (1991), "Investment and Financial Asset Accumulation", Journal ofFinancial Intermediation, 1(4), pp. 307-334.

24
Wizman, T.A. (1992), "What Moves Investment? Cash Flows in a Forward-Looking Model of Capital Expenditures", Federal Reserve Bank of New YorkResearch Paper No. 9201.
Woo, L. and H.P. Lange (1992), Equity Raising by Australian Small Business: AStudy of Access and Survival, Monash University Department of Accounting andFinance Discussion Paper No. 19/92.