the influence of cultural factors on trust in …
TRANSCRIPT

THE INFLUENCE OF CULTURAL FACTORS ON TRUST IN AUTOMATION
by
Shih-Yi (James) Chien
B.A. Management Information Systems, Chung Hwa University, 2004
M.S. Information Science, University of Pittsburgh, 2009
Submitted to the Graduate Faculty of
The School of Information Sciences in partial fulfillment
of the requirements for the degree of
Doctor of Philosophy
University of Pittsburgh
2016

ii
UNIVERSITY OF PITTSBURGH
THE SCHOOL OF INFORMATION SCIENCES
This dissertation was presented
by
Shih-Yi (James) Chien
It was defended on
Dec. 15, 2016
and approved by
Peter Brusilovsky, Professor, School of Information Sciences
Stephen Hirtle, Professor, School of Information Sciences
Michael Spring, Associate Professor, School of Information Sciences
Katia Sycara, Professor, Robotics Institute, Carnegie Mellon University
Dissertation Advisor: Michael Lewis, Professor, School of Information Sciences

iii
Copyright © by Shih-Yi (James) Chien
2016

iv
Human interaction with automation is a complex process that requires both skilled operators and
complex system designs to effectively enhance overall performance. Although automation has
successfully managed complex systems throughout the world for over half a century,
inappropriate reliance on automation can still occur, such as the recent malfunction in Tesla
autopilot mechanisms that resulted in a fatality. Research has shown that trust, as an intervening
variable, is critical to the development of appropriate reliance on automated systems. Because
automation inevitably involves uncertainty, trust in automation is related to a calibration between
a user’s expectations and the capabilities of automation. Prior studies suggest that trust is
dynamic and influenced by both endogenous (e.g., cultural diversity) and exogenous (e.g.,
system reliability) variables. To determine how cultural factors affect various aspects of trust in
and reliance on automation, the present research has developed a cross-cultural trust
questionnaire and an air traffic control simulator that incorporates a variety of scenarios
identified from a review of relevant literature. The measures and tasks have been validated by a
crowdsourcing system (Amazon Mechanical Turk), as well as through experimental studies
conducted in the U.S., Turkey, and Taiwan, with approximately 1000 participants. The results
indicate that the developed trust instrument can effectively measure human trust in automation
across cultures. The findings reveal substantial cultural differences in human trust in automation,
which have a significant impact on the design, implementation, and evaluation of automated
THE INFLUENCE OF CULTURAL FACTORS ON TRUST IN AUTOMATION
Shih-Yi Chien, PhD
University of Pittsburgh, 2016

v
systems to make them more trustworthy in determining the appropriate trust calibration for
optimized reliance across cultures.
vi
TABLE OF CONTENTS
1.0 INTRODUCTION ........................................................................................................ 1
1.1 RESEARCH CHALLENGES ............................................................................ 4
1.2 RESEARCH GOALS .......................................................................................... 5
1.3 RESEARCH STRUCTURE ............................................................................... 6
2.0 RELATED WORK ...................................................................................................... 8
2.1 CONCEPTUALIZATION OF TRUST ............................................................. 8
2.1.1 General and specific trust in automation .................................................... 10
2.2 FACTORS AFFECTING TRUST ................................................................... 12
2.2.1 System properties .......................................................................................... 12
2.2.1.1 System reliability ................................................................................. 13
2.2.1.2 System faults ........................................................................................ 14
2.2.1.3 System transparency ........................................................................... 15
2.2.1.4 Level of automation ............................................................................ 16
2.2.2 Environmental factors ................................................................................... 18
2.2.3 Propensity to trust ......................................................................................... 19
2.2.4 Cultural factors .............................................................................................. 19
2.2.4.1 Hofstede cultural dimensions ............................................................. 20
2.2.4.2 Cultural syndromes............................................................................. 21

vii
3.0 RESEARCH QUESTIONS AND HYPOTHESES ................................................. 25
4.0 INITIAL SCALE DEVELOPMENT ....................................................................... 31
4.1 EMPIRICALLY DERIVED ............................................................................. 32
4.2 HUMAN-COMPUTER TRUST ....................................................................... 32
4.3 SHAPE AUTOMATION TRUST INDEX ...................................................... 33
4.4 CULTURE-TECHNOLOGY FIT .................................................................... 34
4.5 INTERNATIONAL COMPARISON OF TECHNOLOGY ADOPTION ... 34
4.6 ONLINE TRUST BELIEFS ............................................................................. 34
4.7 TECHNOLOGICAL ADOPTIVENESS SCALE ........................................... 35
4.8 TRUST IN SPECIFIC TECHNOLOGY ......................................................... 35
4.9 COLLECTED ITEMS OF THE INITIAL SCALE DEVELOPMENT ....... 35
5.0 STUDY 1 - CLASSIFICATION OF ITEMS PURPOSE ....................................... 37
6.0 STUDY 2: FIRST ROUND OF SCALE DEVELOPMENT .................................. 39
6.1 EXPERIMENTAL METHOD ......................................................................... 39
6.2 RESULTS: EXPLORATORY FACTOR ANALYSIS................................... 40
6.3 MODEL DEVELOPMENT .............................................................................. 42
6.3.1 Performance expectancy ............................................................................... 44
6.3.1.1 Outcome expectation........................................................................... 44
6.3.1.2 Perceived usefulness ............................................................................ 44
6.3.1.3 Relative advantage .............................................................................. 44
6.3.2 Process transparency ..................................................................................... 45
6.3.2.1 Perceived ease of use ........................................................................... 45
6.3.2.2 Quality .................................................................................................. 45

viii
6.3.2.3 Reliability ............................................................................................. 45
6.3.2.4 Understandability................................................................................ 45
6.3.3 Purpose influence ........................................................................................... 46
6.3.3.1 Benevolence.......................................................................................... 46
6.3.3.2 Certification ......................................................................................... 46
6.3.3.3 Faith...................................................................................................... 46
6.3.3.4 Initial trust ........................................................................................... 46
6.3.4 Moderators ..................................................................................................... 47
6.3.4.1 Cultural-technological contexts ......................................................... 47
6.3.4.2 Cultural differences ............................................................................ 48
6.3.4.3 Individual differences ......................................................................... 48
7.0 STUDY 3: SCALE CONSTRUCTS REFINEMENT ............................................. 49
7.1 INSTRUMENT RELIABILITY AND VALIDITY TESTS .......................... 49
8.0 STUDY 4: CROSS CULTURAL VALIDATION: INSTRUMENT PRETEST .. 52
8.1 DATA ANALYSIS ............................................................................................. 52
8.2 SUMMARY ........................................................................................................ 54
9.0 STUDY 5: TASK BASED EMPIRICAL STUDY ................................................... 55
9.1 APPARATUS ..................................................................................................... 55
9.2 EXPERIMENTAL TASKS............................................................................... 58
9.2.1 Experimental Task I – Payload Tasks ......................................................... 58
9.2.2 Experimental Task II – Navigation Tasks ................................................... 59
9.3 AUTOMATED ASSISTANCE ......................................................................... 61
9.3.1 Automated Assistance I – Target Finder ..................................................... 61

ix
9.3.2 Automated Assistance II – Conflict Detector: Path Re-planning ............. 63
9.3.3 Automated Assistance II – Conflict Detector: Highlight ........................... 64
9.4 EXPERIMENTAL DESIGN ............................................................................ 65
9.4.1 Source Reliability ........................................................................................... 65
9.4.2 Automation Transparency ............................................................................ 66
9.4.3 Task Load ....................................................................................................... 66
9.5 EXPERIMENTAL DESIGN AND CONDITIONS ........................................ 67
10.0 FINAL CULTURAL TRUST INSTRUMENT REFINEMENT ........................... 71
10.1 RELIABILITY ................................................................................................... 71
10.2 CFA RESULTS: CONVERGENT AND DISCRIMINANT VALIDITY..... 72
10.3 MEASUREMENT INVARIANCE .................................................................. 75
10.3.1 Results for scale invariance analysis ........................................................... 76
10.4 PREDICTIVE VALIDITY ............................................................................... 78
10.4.1 Cultural Effects on Trust in Target Finder between Reliability
Conditions ................................................................................................................... 78
10.4.2 Correlation for Trust Attitude and Reliance Behaviors on Target Finder
among Three Cultures ............................................................................................... 79
10.4.3 Cultural Effects on Trust in Conflict Detector between System
Transparency .............................................................................................................. 80
10.4.4 Correlation for Trust Attitude and Reliance Behaviors on Conflict
Detector among Three Cultures ............................................................................... 81
10.5 SUMMARY ........................................................................................................ 82
11.0 RESULTS OF THE TASK BASED EMPIRICAL STUDY .................................. 84

x
11.1 SURVEY DATA: GENERAL TRUST ............................................................ 84
11.2 CULTURAL VALUE SCALE.......................................................................... 86
11.3 CORRELATIONS FOR GENERAL TRUST ATTITUDE AND
CULTURAL DIMENSIONS ............................................................................................. 88
11.4 BIG FIVE INVENTORY .................................................................................. 89
11.5 CORRELATIONS FOR GENERAL TRUST AND PERSONALITY
TRAITS 91
11.6 SURVEY DATA: TRUST IN TARGET FINDER AND CONFLICT
DETECTOR BETWEEN TASK LOADS ........................................................................ 93
11.6.1 Survey data: cultural effects on trust in target finder between task load
conditions .................................................................................................................... 94
11.7 SURVEY DATA: TRUST IN TARGET FINDER BETWEEN
RELIABILITY CONDITIONS ......................................................................................... 95
11.7.1 Survey data: cultural effects on trust in target finder between reliability
conditions .................................................................................................................... 96
11.8 SURVEY DATA: TRUST IN CONFLICT DETECTOR AMONG AUTO
TRANSPARENCY ............................................................................................................. 97
11.8.1 Survey data: cultural effects on trust in the conflict detector among auto
transparency conditions ............................................................................................ 99
11.9 PERFORMANCE DATA: TARGET DETECTION IN PAYLOAD TASKS
100
11.10 PERFORMANCE DATA: VEHICLE-VEHICLE AND VEHICLE-
HAZARD DAMAGES IN NAVIGATION TASKS ...................................................... 102

xi
11.11 BEHAVIORAL DATA: CHECKING BEHAVIORS IN PAYLOAD TASKS
105
11.11.1 Behavioral data: checking behaviors in payload tasks between
information uncertainties ........................................................................................ 106
11.11.2 Behavioral data: number of checks in payload tasks between reliability
conditions and information uncertainty ................................................................ 108
11.12 BEHAVIORAL DATA: RELIANCE IN PAYLOAD TASKS .................... 109
11.13 BEHAVIORAL DATA: RELIANCE IN NAVIGATION TASKS ............. 111
11.14 BEHAVIORAL DATA: BEHAVIORS AFTER EXPERIENCING THE
FIRST FAILURE IN PAYLOAD TASKS ..................................................................... 113
11.15 BEHAVIORAL DATA: BEHAVIORS AFTER EXPERIENCING
FAILURES IN PAYLOAD TASKS ................................................................................ 114
12.0 DISCUSSION ........................................................................................................... 116
12.1 GENERAL TRUST ......................................................................................... 116
12.2 EFFECTS OF PERSONALITY TRAITS AND CVSCALE ....................... 117
12.3 EFFECTS OF TASK LOAD .......................................................................... 118
12.4 EFFECTS OF SOURCE RELIABILITY ..................................................... 120
12.5 EFFECTS OF AUTOMATION TRANSPARENCY ................................... 123
13.0 CONCLUSIONS ...................................................................................................... 127
14.0 BIBLIOGRAPHY .................................................................................................... 129
APPENDIX A : STUDIES RELATED TO TRUST IN AUTOMATION ........................... 148
APPENDIX B : TRUST INSTRUMENT DEVELOPMENT: ROOT CONSTRUCTS AND
DEFINITIONS .......................................................................................................................... 153

xii
APPENDIX C : CONVERGENT VALIDITY ....................................................................... 161
APPENDIX D : DISCRIMINANT VALIDITY ..................................................................... 164
APPENDIX E : MEASUREMENT INVARIANCE .............................................................. 166
APPENDIX F.1: ITEMS OF THE CULTURAL TRUST INSTRUMENT (ENGLISH
VERSION) ................................................................................................................................. 165
APPENDIX F.2: ITEMS OF THE CULTURAL TRUST INSTRUMENT (CHINESE
VERSION) ................................................................................................................................. 167
APPENDIX F.3: ITEMS OF THE CULTURAL TRUST INSTRUMENT (TURKISH
VERSION) ................................................................................................................................. 169

xiii
LIST OF TABLES
Table 1. Descriptions of general and specific uses of automation. ............................................... 40
Table 2. Reliability statistics in general and specific automation. ................................................ 41
Table 3. Reliability statistics for general and specific uses of automation. .................................. 50
Table 4. Reliability tests, validity tests, and the results of cover variance of the dominant items.
....................................................................................................................................................... 51
Table 5. Cross-country scale rating comparisons. ........................................................................ 53
Table 6. Experimental designs and conditions. ............................................................................ 67
Table 7. Cross-cultural scale reliability tests. ............................................................................... 72
Table 8. Model fit assessment. ...................................................................................................... 73
Table 9. Item loadings................................................................................................................... 74
Table 10. Structural weights. ........................................................................................................ 75
Table 11. Correlations for trust attitude and reliance behaviors on the target finder. .................. 79
Table 12. Correlations for trust attitude and reliance behaviors in the target finder. ................... 80
Table 13. Correlations for trust attitude and reliance behaviors in the conflict detector. ............. 81
Table 14. Correlations for trust attitude and reliance behaviors in the conflict detector. ............. 82
Table 15. CVSCALE rated scores. ............................................................................................... 87
Table 16. Correlations for trust attitudes and cultural dimensions. .............................................. 88

xiv
Table 17. Correlations for trust attitudes and cultural dimensions in the American, Taiwanese,
and Turkish participants. ............................................................................................................... 89
Table 18. BFI scale rating comparisons. ....................................................................................... 90
Table 19. Correlations for trust attitudes and personality traits. ................................................... 91
Table 20. Correlations of trust attitudes and personality traits in the American, Taiwanese, and
Turkish groups. ............................................................................................................................. 92
Table 21. Trust in payload tasks between workload conditions. .................................................. 93
Table 22. Trust in target finder between reliability conditions. .................................................... 95
Table 23. Trust in the conflict detector among automation transparency conditions. .................. 98
Table 24. Checking behaviors in payload tasks across experimental conditions. ...................... 105

xv
LIST OF FIGURES
Figure 1. Country comparisons shown in Hofstede’s cultural dimensions. The cultural values of
each construct are taken from Hofstede’s cultural study. ............................................................. 26
Figure 2. Classification of item’s purpose .................................................................................... 38
Figure 3. Model of factors of trust development in automation. Performance expectancy, process
transparency, and purpose influence are the constructs (solid lines); individual differences, task
contexts, and cultural differences are the moderators (dotted arrows). ........................................ 43
Figure 4. The RESCHU user interface. The map window shows the numbered UAVs (blue
ovals) with paths to targets (red diamonds); threat areas are marked by the yellow circles. When
a UAV reaches a target, the engage button will be switched on in the UAV status window and
the UAV icon will begin flashing in the mission timeline............................................................ 57
Figure 5. The checking function in target detection tasks. ........................................................... 59
Figure 6. Adding waypoints to avoid collisions. .......................................................................... 60
Figure 7. The likelihood alarm system (LAS) is applied to examine the effects of operators’
uncertainty avoidance. (Wiczorek & Manzey, 2014) ................................................................... 62
Figure 8. Conditions shown in the target finder. .......................................................................... 63
Figure 9. By clicking the auto button, new paths are applied to divert UAVs from a collision
course. ........................................................................................................................................... 64
Figure 10. Highlighting UAVs’ path conflicts or adding dots if paths pass through hazards. ..... 65
xvi
Figure 11. Experimental procedures. ............................................................................................ 69
Figure 12. General levels of trust in automation among three cultures. ....................................... 85
Figure 13. Average trust scores in target finder between task load conditions. Performance,
process, and purpose constructs are each represented by their proportions in each bar in the chart.
....................................................................................................................................................... 94
Figure 14. Average trust scores in target finder between system reliability conditions.
Performance, process, and purpose constructs are represented by their proportions in each bar of
the chart. ........................................................................................................................................ 96
Figure 15. Average trust scores in the conflict detector between auto transparency conditions.
Performance, process, and purpose constructs are represented by their proportions in each bar of
the chart. ........................................................................................................................................ 99
Figure 16. Ratio of correct target detection between workload and reliability conditions. ........ 101
Figure 17. Ratio of correct target detection in different information uncertainty conditions. .... 102
Figure 18. Vehicle-to-vehicle damage levels between auto transparency conditions. ............... 104
Figure 19. Levels of vehicle-to-hazard damage between auto transparency conditions. ........... 105
Figure 20. Checking behaviors in payload tasks between information uncertainty conditions.. 107
Figure 21. Checking behaviors in payload tasks under low reliability between information
uncertainty conditions. ................................................................................................................ 108
Figure 22. Checking behaviors in payload tasks between information uncertainty conditions.. 109
Figure 23. Following and over-/appropriate/under-reliance behaviors in payload tasks. ........... 111
Figure 24. Number of accepted auto waypoints in path re-plan and path re-plan x highlight
conditions. ................................................................................................................................... 112

xvii
Figure 25. Following and reliance behaviors after experiencing the first auto failure in payload
tasks............................................................................................................................................. 113
Figure 26. Following and reliance behaviors after experiencing auto failures in payload tasks. 115

1
1.0 INTRODUCTION
The use of automation has been greatly increasing in recent decades. Due to the rapid growth in
overall task complexity, which involves a variety of information types and source leads,
conventional stable procedure-oriented operations are no longer efficient. As a result, more
flexible and agile automated systems have been developed to increase competitiveness. Although
automation can enhance a system’s efficiency, it also generates more uncertain and complicated
states during computational processes. Because sophisticated automated applications consist of
various complex features, operators may have insufficient knowledge of existing automated
procedures, and may therefore perceive extensive difficulties in retaining needed situation
awareness (SA), which may inadvertently violate critical assumptions and worsen the
consequences of failures, such as in the Three Mile Island nuclear accident. Additionally,
because of a lack of SA, when expected results are violated, operators are less likely to retain
their previous levels of reliance on automation. The beneficial effects of using automation (e.g.,
delivering more accurate information, lowering operator workload, or allowing the operator to
make faster decisions) may not be fully realized, due to maladaptive use of the automation.
Parasuraman and Riley (1997) show that operators’ reliance behaviors could significantly affect
the human-automation relationship. For instance, it has been observed that human operators may
fail to use automation in situations when it would be advantageous. This has been called disuse
(underutilization or under-reliance) of the automation (Parasuraman & Riley, 1997). On the other

2
hand, people have been observed to fail to monitor a system properly (e.g., turning off alarms)
when the automation is in use, or to accept automated recommendations in situations when they
are inappropriate (Lyons, Stokes, Eschleman, Alarcon, & Barelka, 2011). This has been called
misuse, complacency, over-reliance, or automation bias. Both misuse and disuse are associated
with an improper calibration of trust and have contributed to accidents. Misuse has led to
mishaps in aviation and marine navigation (Funk et al., 1999), while disuse has been shown to
damage performance through various behaviors, such as ignoring safety alarms in air traffic
control scenarios (Parasuraman & Riley, 1997). A growing body of literature suggests that trust
significantly contributes to human decisions about the use of automation (Hoff & Bashir, 2015;
Kuo, 2011; Lyons et al., 2016; Martelaro, Nneji, Ju, & Hinds, 2016; Wang, Pynadath, & Hill,
2016). For example, trust has been frequently cited (Lee & Moray, 1992; Muir, 1994) as a
contributor to human decisions about monitoring and using automation. In other words, people
tend to rely on automation that they trust and not to use automation that they do not trust. For
optimal performance of a human-automation system, human trust in automation should be well-
calibrated so that appropriate reliance can be achieved.
Lee and See (2004) note that “trust (in automation) can be defined as the attitude that an
agent will help achieve an individual’s goals in a situation [that is] characterized by uncertainty
and vulnerability.” Human intentions and willingness to act alongside automation are highly
related to the trust that has been derived from the expectancy of favorable responses, which
translates beliefs into behaviors in various uncertain situations. For example, Lyons and Stokes
(2012) observe that participants reduce their reliance on human aids when faced with high-risk
missions, which indicates an increased reliance on automated recommendations in dangerous
situations. Due to the complexities of contexts that may not work perfectly under all situations

3
(despite the best design efforts), placing the same degree of trust in automation across all
automated systems is improper and may be questionable. Inappropriate trust calibration (i.e.,
over-reliance or under-reliance) occurs due to less attentive cross-checking behaviors, rather than
from a complete lack of automation verification (Manzey, Reichenbach, & Onnasch, 2008),
which indicates that trust guides reliance either when the automation is too complex to
understand or when the procedures fail to guide the operator to appropriate behaviors.
Trust in automation has been indirectly studied through its purported influences on
reliance behaviors. Prior studies have showed that cultural differences greatly affect the
development of trust attitudes and reliance behaviors on automated systems (Chien, Lewis,
Hergeth, Semnani-Azad, & Sycara, 2015; Li, Rau, & Li, 2010; Rau, Li, & Li, 2009; Wang, Rau,
Evers, Robinson, & Hinds, 2010). For instance, Merritt (2000) measures pilots’ attitude and
behaviors with respect to the use of automated systems across countries. The results suggest that,
even in a highly specialized and regulated profession, national culture still exerts a meaningful
influence on attitude and behavior, over and above any occupational context. A recent study
(Kachouie, Sedighadeli, Khosla, & Chu, 2014) also indicates that participants’ cultural
backgrounds can significantly affect their attitudes toward intelligent agents.
Since the perception of automation attributes (e.g., perceived ease of use) and
interpretation of aids (e.g., information transparency) may differ considerably across populations,
cultural values and norms are the important factors that influence an individual’s trust attitudes
and reliance behaviors. However, while much of current research has focused on the effects of
system-related variables (e.g., source reliability), little attention has been paid to studying the
joint effects between cultural influences and trust in automation. In addition, most of the limited
work in this field has been both abstract and suggestive, and has been derived from performing

4
statistical modeling approaches (such as meta-analysis or path analysis) without empirical
validation. Given the influence of culture-sensitive interactions on the willingness of adopting an
information technology that involves various factors, the overall objective of this research is to
develop a fundamental understanding of general principles and factors pertaining to trust in
automation and determine the ways in which trust mediates reliance on automation across
cultures.
1.1 RESEARCH CHALLENGES
Various factors, such as perceived ease of use, automation reliability, severity of faults, level of
automation, operator workload, and operator’s propensity to trust have been studied in the
literature as factors that affect trust in automation. However, the majority of research has focused
on the relation between system reliability and operator usage, and scant attention has been paid
to the ways in which culture may influence human trust in automation. Moreover, most of the
existing studies on trust in automation were performed within Western cultures. As the use of
technology becomes increasingly globalized, there is an urgent need to study factors that would
aid in determining how users in different cultures will adopt and use technologies, as well as how
trust in automation functions in different cultures. The current literature has two significant
limitations. First, most of the work on cultural influences on trust has been done in the context of
interpersonal trust (Fulmer & Gelfand, 2010; Gunia, Brett, Nandkeolyar, & Kamdar, 2011).
Second, most of the work studying culture and trust in automation has either been suggestive
(without empirical evidence to support) or has focused mainly on the Western cultures. To
examine the interrelations and commonalities of concepts that involve trust in automation,

5
empirical research is needed to integrate divergent manifestations of trust within a single task
and test population. However, cognitive measures, such as NASA-TLX (Hart & Staveland,
1988) for workload that examine the influences of cultural factors on trust in automation have
yet to be developed, which exacerbates the difficulties in measuring trust attitudes and reliance
behaviors in automation across cultures. Wasti, Tan, Brower, and Onder (2007), for example,
found the widely used Mayer and Davis' (1999) Ability-Benevolence-Integrity trust scale to have
“poor psychometric properties across the board” when attempting to assess measurement
invariance across samples from the U.S., Turkey, and Singapore. Principled cross-cultural
studies of trust in automation will require developing reliable and valid measures of trust that can
allow for accurate comparisons across cultures.
1.2 RESEARCH GOALS
Measuring the effects of cultural dynamics on trust in automation is a difficult challenge, which
involves many different facets of automation and factors that affect the use of automation
(especially in critical circumstances, such as aviation, military, and crisis response). Despite the
plethora of existing research in examining trust and culture relations, to investigate the factors
that influence trust in automation across cultures, this research has the following goals:
Objective 1: Develop a reliable psychometric instrument that captures the nature and
antecedents of trust in automation across cultures. While a large body of work on trust in
automation has developed over the past two decades, standard measures have remained elusive,
with research relying on short, idiosyncratically-worded questionnaires. These challenges are

6
exacerbated when examined in the context of measuring the effects of culture in trust in
automation.
Objective 2: Develop a trust-sensitive task (TST) and its associated computational and
simulation infrastructure. Current literature on trust in automation has used a variety of both
tasks and types of automation. To validate cultural influences on trust in automation, the
proposed TST and the testbed system combine the characteristics of important task categories
and variable manipulations to enable replication studies of known effects to allow for valid
cross-cultural comparisons.
Objective 3: Conduct theoretically guided experimental studies to determine how cultural
factors affect the various aspects of trust and reliance on automation. The studies will encompass
the propensity to trust, information transparency, source reliability, workload, and trust
dynamics; namely, the processes of trust formation, dissolution after trust violations and
restoration. Most crucially, the proposed study focuses on examining whether cultural factors
have large effects on trust attenuation or amplification, which may contribute to automation bias,
misuse, or disuse.
1.3 RESEARCH STRUCTURE
The remainder of this thesis is structured as follows: related work is described in Chapter 2.
Chapter 3 introduces the research questions and hypotheses. Chapter 4 describes the initial scale
development. Chapter 5 delineates the classification of instrument items purposes. Chapters 6
and 7 describe the scale development via the online crowdsourcing system (Amazon Mechanical

7
Turk). Chapter 8 presents the first round of cross-cultural instrument validation. Chapter 9 shows
the cross-cultural task based empirical studies. Chapter 10 presents the details of the cross-
cultural scale refinement. Chapter 11 shows the overall results, including survey and behavioral
data. Discussion and conclusions are included in Chapters 12 and 13, respectively.

8
2.0 RELATED WORK
Trust has been studied in a variety of disciplines (including social psychology, human factors,
robotics, and industrial engineering), and these wide contexts have led to various definitions and
theories of trust. A brief overview of the extant literature on the conceptualization of trust and
factors that influence trust in automation are included in this section, which involve system-
related factors, human-related properties, and environmental variables. Although automation has
a wide variety of definitions, the following definition will be used throughout this study:
“Automation is any sensing, detection, information processing, decision making, or control
action that could be performed by humans but is actually performed by machine” (Moray,
Inagaki, & Itoh, 2000).
2.1 CONCEPTUALIZATION OF TRUST
Trust (in automation) refers to a cognitive state or attitude, yet it has most often been studied
indirectly through its purported effects on behaviors, without any direct cognitive measurement.
The nature and complexity of these tasks have varied greatly and have ranged from simple
automatic target recognition classification (Dzindolet, Pierce, Beck, & Dawe, 2002) to erratic
responses of a controller embedded within a complex automated system (Lee & Moray, 1992).

9
The variety of reported effects (automation bias, complacency, reliance, compliance, and so
forth) mirrors these differences in tasks and scenarios.
Trust has been defined as an attitude, an intention, or a behavior (Madsen & Gregor,
2000; Mayer, Davis, & Schoorman, 1995; Moray & Inagaki, 1999). Both within existing inter-
personal literature and human-automation trust literature, a widely accepted definition of trust is
lacking (Adams & Webb, 2002). However, it is generally agreed that trust is best conceptualized
as a multidimensional psychological attitude that involves beliefs and expectations about the
trustee’s trustworthiness that are derived from experience and interactions with the trustee (Jones
& George, 1998). In both interpersonal trust literature and automation trust literature, trust has
been said to have both cognitive and affective features. In interpersonal literature, trust is seen to
involve affective processes, since trust development requires seeing others as personally
motivated by care and concern to protect the trustor’s interests (Lewis & Weigert, 1985). In
automation literature, cognitive processes, rather than affective processes, may play a dominant
role in the determination of trustworthiness; i.e., the extent to which automation is expected to do
the task that it was designed to do (Muir, 1994). In trust in automation literature, it has been
argued that trust is best conceptualized as an attitude (Lee & See, 2004) and a relatively well-
accepted definition of trust is: “an attitude which includes the belief that the collaborator will
perform as expected, and can, within the limits of the designer’s intentions, be relied on to
achieve the design goals” (Moray & Inagaki, 1999). The conceptualization of trust as an attitude
that has both cognitive and relational aspects is especially relevant to the proposed research on
how culture may modulate a trust construal and dimensions of trustworthiness.

10
2.1.1 General and specific trust in automation
Early research, such as that of Driscoll (1978) and Scott (1980), suggests that human trust
attitudes are composed of both global and specific components. Global components are largely
related to early experiences with human machine systems, which convert prior understandings to
stable traits and translate to an individual’s initial attitude to trust or distrust in other similar
applications (Merritt & Ilgen, 2008). Specific components are based on the ongoing interactions
with and feedback from a machine, and the analytic processes regarding the perception of system
capabilities contribute to an individual’s trust beliefs about specific machines. In addition,
Mcknight and Carter (2011) investigate various types of trust constructs, which differentiate trust
propensities into both general and specific attributes. The proposed general and specific trust
traits in McKnight’s study are consistent with the aforementioned global and specific
components, respectively.
Mayer et al., (1995) define general trust in automation as “the general tendency to be
willing to depend on technology across a broad spectrum of situations and technologies.” Lee
and See (2004) identify three systematical dimensions (performance, process, and purpose) as
the general base for trust, which significantly involve the development of general trust attitudes
in automation. For instance, an individual with a high general trust level might assume that
automated systems are usually reliable, dependable, and offer the needed assistance. As a result,
the individual tends to rely on automated aids to achieve better outcomes across task situations
and information technologies.
Specific trust in automation reflects an individual’s beliefs that a specific system has
suitable features for performing the task and resolving the potential issues in a specific condition
(Mayer et al., 1995). Hancock et al., (2011) proposes a three-factor model to measure human-

11
robot trust, which categorizes the trust attitudes into human-related, robot-related, and
environment-related factors. Several researchers advocate for the relevance of situational trust in
specific automated aids, and suggest that increased specific beliefs and motivations (e.g.,
purposes of systems) could enhance the process of adoption of new technologies (Dabholkar,
1996; Davis, Bagozzi, & Warshaw, 1989). In other words, through direct interactions with an
automated system, operators continuously evaluate the machine’s characteristics and
(re)calibrate their trust in automation.
As trust has been suggested to have both cognitive and affective features in the areas of
interpersonal trust literature and automation trust literature (Lewis & Weigert, 1985; Moray &
Inagaki, 1999; Muir, 1994), Lee and See (2004) conclude that general trust is greatly related to
both attitudinal and affective processes, while specific trust is heavily influenced by situational
and cognitive processes. In addition, both automation and interpersonal trust studies suggest that
trust should be measured multiple times to study its changes (establishment, dissolution, and
restoration) throughout different phases. Since general trust indicates an individual’s trust beliefs
in relying on automated assistance, it should be examined before exposure to a specific system
(i.e., pre-experiment). Specific trust identifies participants’ beliefs in a specific automated system
and should be measured after experiencing a specific system (i.e., post-experiment). Therefore,
to reliably measure the changes in trust attitudes and accurately study the development of trust
beliefs, it is essential to evaluate trust perceptions through both its general and specific
characteristics in different situations.

12
2.2 FACTORS AFFECTING TRUST
Lee and See (2004) have provided a thorough review on trust in automation, which indicates that
the factors that are likely to affect trust in and reliance on automation have generally occurred at
the intersection of human operators, information technologies, and task contexts. Research
suggests that human-related variables, such as personality traits or cultural characteristics;
system-related variables, such as system reliability or information transparency, and task-related
variables, such as task complexity or task load, have all significantly influenced the use and trust
calibration of automation (Hancock et al., 2011). Here is a summary of the relevant work on
these important variables.
2.2.1 System properties
As manual control may lead to excessive operator workload and manual intervention has a
limited probability to manage rapid failures in time, while automation is being performed, an
operator may need to spend extra time monitoring the various types of automation, and as a
result, little attention will be allocated to highly trusted systems (Muir & Moray, 1996). The most
important correlations to the use of automation have been the levels of system reliability and the
effects of system faults. Reliability typically refers to automation that has some error rates (such
as misclassifying targets). This rate is generally constant, and data is analyzed using session
means. System faults are typically single events that are studied as a time series, such as if an
automated controller fails to function properly and makes the whole system behave erratically as
a result. In addition, when the level of automation is increased, providing appropriate system
transparency is critical, which can enhance the use of automated applications. The relevant work

13
on important system-related factors is summarized as follows (for a more detailed overview of
these factors, please see Appendix A).
2.2.1.1 System reliability
Prior literature has provided empirical evidence that changing the reliability of automation has
influenced people’s use of autonomy and their trust in the system (Desai et al., 2012; Hancock et
al., 2011; Kaniarasu & Steinfeld, 2012; Moray & Inagaki, 1999; Parasuraman & Manzey, 2010;
Parasuraman & Riley, 1997; Rovira & Parasuraman, 2010; Ericka Rovira, McGarry, &
Parasuraman, 2007; Visser & Parasuraman, 2011). For example, Moray et al., (2000) concluded
that there was little difference in trust and self-confidence while system reliability was above
90%; however, a significant effect was observed with system reliability between 70% and 90%
in both aspects. A follow-up study (Rovira & Parasuraman, 2010) suggested that automation
reliability that was lower than a threshold of approximately 70% led to worse overall
performance than having no automation. However, Visser and Parasuraman (2011) found that
even when the system reliability was as low as 30%, overall performance was still improved.
Bagheri and Jamieson (2004) investigated user reliance behaviors under constant and
variable reliability conditions in automated monitoring systems. While little effect was found on
the low-reliability conditions, the results showed that performance was significantly worse in a
constant high-reliability condition. In other words, the detection of automation failures was
significantly worse for constant-reliability automation than for variable-reliability automation.
Research also revealed that the timing of dropped reliability appeared to have an impact on trust
and influences different trusting behaviors. When the reliability drops occurred in the middle of
or late in the processes, they led to immense increases of operators switching away from
autonomy, while early drops in reliability only slightly affected the operators’ switching

14
behaviors (Desai et al., 2012; Kaniarasu & Steinfeld, 2012). However, although users’ trust
decreased during system reliability drops (for example, users switching away from autonomy),
the subjective measure found that users’ self-confidence increased as reliability decreased
(Visser & Parasuraman, 2011).
2.2.1.2 System faults
System faults affect system reliability, but are treated separately because they concern discrete
system events and involve different experimental designs. Because of their dynamic nature,
various aspects of faults have a different influence on trust in automation, in which trust attitudes
and resulting reliance behaviors depend not only on the progress of the current system, but also
on recent values of system performance and the presence of fault size (Lee & Moray, 1992; Lee
& See, 2004). Lee and Moray (1992) showed that in the presence of continual system faults, trust
in the automated application significantly decreased after the failure happened, but gradually
recovered, even as faults continued. The results also indicated that faults of varying magnitude
diminished trust more than constant faults. The magnitude of system faults had differential
effects on trust, in which smaller faults had a minimal effect on trust, while large faults
negatively affected trust and resulted in slower trust recovery. Muir and Moray (1996) found that
chronic faults led to slower recovery of trust in automated aids, whereas little lasting effect was
observed in the transient errors. Additionally, the study also found that when faults occurred in a
subsystem, the corresponding distrust spread to other functions controlled by the same
subsystem; however, the distrust did not spread to independent or similar subsystems.
An early study showed that when autonomy provided inaccurate recommendations,
participants in the non-automation condition performed better on the same events than those in
the automation condition (Skitka, Mosier, Burdick, State, & Ames, 1999). Different types of

15
faulty automation, such as false-alarm prone (FAP) vs. miss-prone (MP) automation, led to
significant differences in task performance, attention allocation, trust attitude, and reliance
behaviors (Chen, Barnes, & Kenny, 2011; Dixon, Wickens, & McCarley, 2007; Rovira et al.,
2007; Wickens, Dixon, Goh, Hammer, & Savoy, 2005). Research showed that MP failures
degraded concurrent task performance, in which a lack of faith in the automated system led the
operator to devote more attention to managing the automated tasks. On the contrary, in the FAP
condition, as operators reduced their compliance on the automated suggestions, ignoring or
terminating the alerted messages resulted in a degradation of the response to system failures
(Dixon et al., 2007; Meyer, 2004; Wickens et al., 2005). Chen et al., (2011) found that
participants’ SA was significantly better in the MP than in the FAP condition. Although
participants reported that the FAP condition was more deceptive than the MP condition, higher
trust was rated in the FAP than the MP condition. Dixon et al., (2007) concluded that FAP
appeared to be more damaging to overall performance than MP (in which FAP affected both
operator compliance and reliance), whereas MP appeared to affect only operator reliance.
2.2.1.3 System transparency
It has been suggested that system understandability is an important factor for trust development
(Muir, 1994). Research has shown that revealing system vulnerabilities (such as weaknesses)
increased user trust, and that when people have appropriate knowledge of faults, these flaws do
not necessarily diminish trust in the system (Lewandowsky, Mundy, & Tan, 2000; Martelaro,
Nneji, Ju, & Hinds, 2016; Parasuraman & Riley, 1997). A plausible explanation for these
findings is that knowing the limitation in automation reduces the uncertainty and the consequent
risk associated with the use of automated aids. In other words, operators may calibrate trust and
develop efficient strategies to work with faulty automation. To facilitate the processes and

16
provide the operator with sufficient SA, systems that can explain their reasoning processes and
ongoing progresses will be more likely to be trusted, since users would more easily be able to
understand any problems that they encounter (Lewis, 1998; Simpson & Brander, 1995; Sycara &
Lewis, 1998). Such explanatory facilities may also allow the operator to query the system during
periods of low system operation in order to incrementally acquire and increase trust (Clare,
Maere, & Cummings, 2012). To synchronize the mutual understanding between human operators
and automated aids, system transparency is a critical factor that affects perceived difficulty in
reasoning with provided automated suggestions. Research has shown that self-reported trust in
the system’s ability is highly correlated with the understanding of the system’s decision-making
processes (Wang et al., 2016). Increasing information transparency contributes to higher trust in
and better use of complex automated systems (Lyons et al., 2016).
2.2.1.4 Level of automation
Another factor that may influence trust in automated systems is the level of automation (LOA).
Sheridan and Verpank (1978) developed the first LOA taxonomy, which classified autonomy
into ten levels that are based on the range of control that an operator could manipulate. Operators
must (partially) manually control the machines and make decisions in low LOA conditions,
while fully autonomous systems are used under high LOA conditions, with operators and
automation sharing controls and collaborating closely to make decisions in middle LOA
conditions. However, during shared control processes, operators and automation may perform
similar operations with different purposes. These contradictory intentions may mislead the
operator to automate the tasks and may provide unexpected results (Inagaki, 2003). LOA has
been found to affect trust and use of automation (Moray et al., 2000; Ruff, Narayanan, & Draper,
2002; Walliser, 2011), in which most comparisons have involved either the monitoring of

17
automation (e.g., management by exception) or interaction with decision aids (e.g., management
by consent). Thus, the degree of functional allocation between the human operator and the
automated system has greatly affected the use of automation and its resulting behaviors. Sheridan
and Hennessy (1984) indicated that an operator would interact with automation as an extension
of trust; otherwise, the operator would choose manual control, because of the low level of trust in
the automated device. However, due to the complexity of real-world problems and other factors,
LOA depends strongly on the characteristics of the system being controlled, as well as upon the
characteristics of task contexts. Research shows that shifting from a system with a higher LOA to
one with a lower LOA led to decreased performance, but when shifting from higher LOA
systems back to manual control, the lack of SA resulted in poor performance (Nocera, Lorenz, &
Parasuraman, 2005). Systems with a high LOA are generally more complex, in which
sophisticated features are more opaque to the operator and may engender less trust. Placing the
same amount of trust in systems with different LOA is improper and questionable, because of the
complexity of involved context. Moray et al. (2000) investigated trust in different degrees of
automation and found diverse results between systems with high and low LOA, which suggested
that systems with a different LOA may have different implications for trust and its resulting
behaviors. Recent studies showed that an operator took longer to switch between different tasks
when supervising a system at a high LOA, as compared to one at a low LOA (Squire &
Parasuraman, 2010), and waited longer to switch back to autonomous mode than to switch away
(Kaniarasu & Steinfeld, 2012).

18
2.2.2 Environmental factors
Manual control of complex tasks may result in an excessive workload and decreased
performance. These decreases in performance can exacerbate users’ perceived workload and
self-confidence, which in turn can lead to higher acceptance of aided information (Donmez,
Boyle, Lee, & McGehee, 2006). Research shows that an unbalanced task workload could
increase reliance on automation to decrease stresses on cognitive capacity (Bailey, 2004).
However, inappropriate trust in automated systems (such as under-reliance) could increase a
user’s perceived difficulties in concentrating on tasks and may lead users to become overly
reliant on automated aids. For example, environmental variables such as high system complexity
and heavy task workload can cause operators to over-trust automated aids and may cause them to
be inclined to automation complacency (Dixon & Wickens, 2006; McFadden, Vimalachandran,
& Blackmore, 2004). The negative relationship between trust and workload was found in a
variety of contexts (Rajaonah, Tricot, Anceaux, & Millot, 2008; Scott, Mercier, Cummings, &
Wang, 2006; Spain & Bliss, 2008), which suggested that the increases of task workload lead to
degradations of trust in automated applications. In other words, a lower workload contributed to
a higher level of trust in the automation (Wang, Jamieson, & Hollands, 2011) as well as
satisfaction with automated aids (Goddard, Roudsari, & Wyatt, 2012). Although higher task
workloads tended to have negative influences on trust in automation, Xu, Wickens and Rantanen
(2007) found a contrasting result, in which higher workloads (increased task difficulty) led to a
thorough inspection of the raw data, which decreased the effects of automation complacency.
Reagan and Bliss (2013) concluded that the amount of processing information and users’
attention allocation strategies may vary, either increasing (Rovira & Parasuraman, 2010) or
decreasing (Xu et al., 2007) the effects of perceived task workloads, in which different workload

19
components may participate in diverse effects on trust in automation. In other words, the trade-
off between trust and workload might only exist in a certain type of (sub) task contexts.
2.2.3 Propensity to trust
Individual differences in personality traits can significantly affect operators’ trust attitudes and
reliance behaviors on automated systems. Self-confidence is a factor of individual differences
and is one of the few operator characteristics that have been studied in existing trust in
automation literature. Lee and Moray's (1992) work suggested that when trust was higher than
self-confidence, automation (rather than manual control) would be used, and vice versa (when
trust was lower than self-confidence). However, later work (Moray et al., 2000), which was
conducted with a higher LOA than that of previous studies (Lee & Moray, 1992) did not obtain
similar results. Instead, it was found that trust was influenced by system properties (such as real
or apparent false diagnoses), while self-confidence was influenced by operators’ own personality
traits and experiences. An interesting finding from Moray et al. (2000) indicates that if an
operator takes the manual mode first, the operator would have higher self-confidence. It was also
found that self-confidence was not affected by system reliability, in which Lewandowsky et al.
(2000) suggested that self-confidence was not influenced by shifts in automation reliability.
2.2.4 Cultural factors
Cultural differences have been observed in various contexts. For example, Chua, Boland and
Nisbett (2005) reported that Western participants focused on focal objects, such as brightly
colored or rapidly moving stimuli, whereas Eastern participants’ judgments were more

20
dependent on contextual factors, such as background colors and details. In recent decades, there
has been an increase in interest in measuring the effects of cultural factors on trust in automated
systems. Although cultural factors can greatly influence an individual’s levels of trust and
reliance, little is known about the ways in which cultural differences affect trust in automation.
To identify how cultural diversity may affect trust in and reliance on automation, Hofstede’s
cultural dimensions (Hofstede, 1991) and cultural syndromes (Triandis, 1996) were adopted to
guide our research hypotheses and examine overall cultural effects.
2.2.4.1 Hofstede cultural dimensions
To measure the cultural differences on trust in automation, three of Hofstede’s cultural
dimensions (power distance, individualism/collectivism, and uncertainty avoidance) were used in
our studies, which have been well studied in prior research.
• Power distance (PD) is defined as “the extent to which the less powerful accept and
expect that power is distributed unequally” (Hofstede, 1991). In societies with high PD, a
less powerful person must accept instructions given by more senior or powerful members
of the organization. People in societies with a large PD expect authority figures to be
benign, competent, and of high integrity, and therefore engage in less vigilance and
monitoring for possible violations by authority figures (House, Hanges, &Javidan, 2004).
This factor may affect the extent to which an individual from PD cultures perceives the
automation as authoritative, and as a result, the operator will be quick to establish trust in
the automated suggestions.
• Individualism/Collectivism (IDV) is “the degree of interdependence a society maintains
among its members” (Hofstede, 1991). It represents an individual’s self-image between
“I” or “We” in a society. People from an individualistic culture tend to take care of only

21
themselves and direct family members, while an individual from a collectivist society
will take care of others in exchange for unquestioning loyalty. In addition, an individual
from a high IDV society focuses more on their own achievements, rather than on group
goals. Nishishiba and Ritchie (2000) found that in a conceptualization of trustworthiness,
Japanese businessmen emphasize organizational commitment, while Americans
emphasize personal integrity. Prior studies suggested that collectivists will have high
levels of trust of in-group members (Semnani-Azad, Sycara, Lewis, & Adair, 2012;
Triandis, 1995); however, Fulmer and Gelfand (2010) found a “black sheep” effect in
collectivist societies, in which operators from this culture became less trusting after
experiencing violations from in-group rather than out-group members.
• Uncertainty avoidance (UA) is defined as “the extent to which the members of a culture
feel threatened by uncertain or unknown situations” (Hofstede, 1991). People in greater
UA cultures look for structured formats and clear instructions to shun ambiguous
conditions and make events more interpretable and predictable. Prior studies (Li, Rau, &
Li, 2010; Li et al., 2014; Rau, Li, & Li, 2009) found cultural differences in people’s
reactions and preferences regarding both implicit and explicit communication styles, in
which an individual from an Eastern country preferred an implicit communication style,
while people from a Western country favored an explicit communication style. Thus,
participants’ evaluations of the automated systems and their acceptance of the aided
recommendations may greatly depend on how the information is presented to them.
2.2.4.2 Cultural syndromes
Although Hofstede’s cultural dimensions have been well studied in the literature and continue to
be relevant when examining the general effects of cross-cultural differences, recent research

22
(Leung & Cohen, 2011) has indicated that Hofstede’s metrics have failed to measure an
individual’s behaviors in terms of adherence to cultural norms in their interactions with various
situations, and consequently, the influence on their values by a particular member. To address
the gaps, cultural syndromes (Triandis, 1996) were also included in our study, which provide
complementary approaches to measuring individual diversities among cultural differences.
Cultural syndromes encompass cultures of dignity, cultures of honor, and cultures of face, which
contrast with the meaning and importance that are given to norms of exchange, reciprocity,
punishment, honesty, and trustworthiness. Recently, interest in the cultural syndromes of dignity,
honor, and face has resurfaced (Aslani, Ramirez-Marin, Semnani-Azad, Brett, & Tinsley, 2013;
Aslani et al., 2016; Leung & Cohen, 2011) with particular significance for antecedents of trust.
For example, Bohnet and Zeckhauser (2004) suggested that it is betrayal aversion (people’s
aversion toward risk caused by other people) and not simply risk aversion that affects people’s
trust decisions. A betrayal-averse individual would be more likely not to trust another individual
at the beginning of a trust relation, would be more likely to monitor for trust violations, and
would be more likely to make negative attributions if trust violations do occur. Betrayal aversion
is relevant in the honor cultures that are prevalent in Middle Eastern and Arab countries. Indeed,
Bohnet, Herrmann, and Zeckhauser (2009) found that people in the Persian Gulf required a
higher level of trustworthiness before they were willing to trust other individuals than either
Americans or Swiss. The socio-cultural factors of distrust include surveillance and monitoring
(Sitkin & Roth, 1993), cultures of honor (Nisbett & Cohen, 1997), and collectivism (Triandis,
1995). In particular, surveillance and monitoring have been shown to be relevant to misuse and
disuse of automation, and the cultural characteristics that may be linked to them will be the
subject of careful study in our research.

23
• Dignity cultures are prevalent in Western Europe and North America. In dignity cultures,
self-worth is generally associated with independence and focusing on personal and
individual goals (Schwartz, 1992), which are evaluated by the individual’s own criteria,
rather than by other people’s values (Leung & Cohen, 2011). Research shows that people
from dignity societies tend to make a “swift trust” assumption, in which others deserve to
be trusted until they prove otherwise (Dirks, Lewicki, & Zaheer, 2009).
• Face cultures are usually observed in East Asia. In cultures like these, self-worth is
extrinsically derived, based on social interactions with other members in the society
(Leung & Cohen, 2011). In other words, individuals from face cultures cherish the view
that others have of them. For example, people may lose face if another person or group of
people believes they have acted out, and other people may lose face because of your own
views of their behavior. Thus, power and status in face cultures is relatively hierarchical
and generally stable. Social interaction in face cultures is governed by norms that are
provided by social institutions, like religion, family, community, or the state, and
people’s conformity to those norms is monitored and, if necessary, managed by
institutional sanctioning (Gunia et al., 2011; Takahashi et al., 2008; Yamagishi, Cook, &
Watabe, 1998). Research suggests that the presence of institutional monitoring and
sanctioning reduces a society’s need for interpersonal trust by affording a reliable
external guarantor of behavior (Takahashi et al., 2008; Yamagishi & Yamagishi, 1994).
• Honor cultures are widespread in the Middle East, Latin America, and Mediterranean
countries, along with the southern United States. Due to unstable social hierarchies,
people from honor cultures tend to have a reputation for toughness in protecting
themselves, and direct family members not to let others take advantage of them (Nisbett

24
& Cohen, 1997). In other words, honor must be claimed as well as paid to others (Leung
& Cohen, 2011). Consequently, members of honor cultures tend to have relatively low
levels of both institutional and interpersonal trust.
• The defining characteristics of cultural syndromes (dignity, honor, and face cultures)
have elements that are also examined by Hofstede’s dimensions, especially in PD, IDV,
and UA. Thus, cultural syndromes can bring relevant elements in addition to Hofstede’s
dimensions, which can contribute to a basis for greater discriminatory power. An
interesting observation we made is in the dimension of IDV: dignity cultures are high on
IDV, honor cultures are medium, and face cultures are low. For example, since people in
face cultures are high on collectivism, they would have high in-group trust, which can
relate to the use of automation (autonomous-self vs. relational-self). Therefore, cultural
syndromes could bring relevant elements, in addition to Hofstede’s dimensions, that may
provide a basis for greater discriminatory power.
As the hypotheses based on Hofstede's dimensions (1991) and a more recent theory of
cultural syndromes (Leung & Cohen, 2011; Triandis, 1994) suggest, it is reasonable to expect an
individual’s culture to affect trust and use of automation in a variety of ways. These cultural
characteristics that have been identified as influencing levels of inter-personal trust will guide the
proposed research on how cultural factors may influence trust and use of automation, and will
help formulate research hypotheses.

25
3.0 RESEARCH QUESTIONS AND HYPOTHESES
As these hypotheses are fused with Hofstede’s cultural dimensions and with a more recent theory
of cultural syndromes, we expect cultural dynamics to affect trust and use of automation in a
variety of ways. To examine the influences of cultural factors on trust in automation, we select
the U.S. as a prototypical dignity culture, Taiwan as a prototypical face culture, and Turkey as a
prototypical honor culture. In addition, the contrasts that these countries provide on Hofstede’s
dimensions (Fig. 1) reveal some substantial cultural differences. For instance, Turkey is high on
power distance (PD) and uncertainty avoidance (UA), but low on individualism (IDV); the US is
high on IDV but low on PD and UA, and Taiwan is in the middle among these three constructs.

26
Figure 1. Country comparisons shown in Hofstede’s cultural dimensions. The cultural values of each
construct are taken from Hofstede’s cultural study.
There are three general research questions we examine in our studies:
(a) Do the effects of trust that have been observed in prior research on Western cultures
apply universally in all three cultural syndromes? Such effects include an increase in
trust in automation with an increase in reliability, as well as an increase in reliance
with an increase in task load.
(b) Even if trust effects are universal across all cultural syndromes, do they differ in terms
of magnitude in different cultures?
(c) Do some of the effects work in one way in one culture and in a different way in
another? In other words, are there interactions between the various cultural effects?
Based on the cultural characteristics of the three syndromes, along with Hofstede’s
dimensions, we form the following research hypotheses to answer the research questions above.
With respect to the effects of cultural factors on initial trust, we hypothesize:
Power Distance(PD)
UncertaintyAvoidance
(UA)
Individualism(IDV)
U.S. 40 46 91
Taiwan 58 69 17
Turkey 66 85 37
0102030405060708090
100
Ho
fste
de
's C
ult
ura
l Sco
re (
0~
10
0)

27
H1: Individuals from dignity cultures are more likely to have a higher level of initial trust
in automation than those from honor and face cultures.
- This is because dignity cultures make a swift trust assumption.
In terms of the cultural influences on trust establishment, we hypothesize:
H2: If use of automation was encouraged by the user’s organization, face culture
operators will have higher ratings of trust and reliance than operators from honor
and dignity cultures.
- This is because of the high PD values in face cultures.
H3: Honor culture operators will require a longer interaction time than operators from
dignity and face cultures to develop an equal degree of trust.
- Operators from honor cultures are more distrustful than those from either face or
dignity cultures, due to their lower level of initial trust.
H4: Operators from dignity and honor cultures will be more self-confident, and would
therefore be less likely to rely on automation than operators from face cultures.
- Dignity cultures are characterized by high IDV and self-reliance, hence their
members will be more self-confident. In honor cultures, self-worth is derived both
internally and externally. Therefore, members of honor cultures will be more self-
confident than those from face cultures, where self-worth is derived externally.
Since providing perfectly reliable automated systems is infeasible in reality, for trust
restoration, we hypothesize:
H5: Honor operators will either stop using automation or will take longer to regain trust
after a failure occurs and may not recover trust at their original level

28
(miscalibrate), as compared to operators from face and dignity cultures. The
dynamic relation between use and trust may magnify these effects.
- Honor cultures have high level of UA, which subjects their members to the betrayal
effect, and as a result, causes them to be more mistrustful than operators from face
and dignity cultures.
H6: Face culture operators will recover their trust in automation after failure more
quickly than honor and dignity culture operators. Honor culture operators would be
slowest in recovering trust.
- Because the social context of honor cultures results from unstable social
hierarchies, members of those cultures would be the slowest to exhibit trust and
equally slow to regain it once lost.
Studies have shown that a decrease in system reliability will decrease operators’ trust in
and reliance on automation (Chien, Mehrotra, Lewis, & Sycara, 2013; Rovira et al., 2007; Visser
& Parasuraman, 2011). Therefore, in terms of system reliability, we hypothesize:
H7: Face culture operators will be more influenced by the purpose of automation than
either honor or dignity culture operators.
- Since the social context of face cultures is based on stable hierarchies, the purpose
of the automation will engender relatively higher levels of trust.
H8: Unreliable automation will lower trust ratings of operators from all cultures, but
face culture operators will continue to rely on unreliable automation.
- Prior research suggests that low trust is positively correlated with unreliable
automation. Face cultures have a higher PD and therefore will be more likely to
continue relying on automation, regardless of its reliability.

29
Research in trust in automation suggests that system transparency significantly influences
the use of automation (Chen et al., 2014; Cramer et al., 2008; Mercado et al., 2016). For
instance, knowing the failure behaviors of the automation in advance may modify the perception
of risk, and therefore, the overall level of trust in the automated system will not be affected by
the system failures (Parasuraman & Riley, 1997). In other words, it is not only the system
performance (history of interaction) that has an evident influence, but also that the automation
process transparency and its perceived purpose are involved in the development of trust. For
example, a system with high LOA prescribes actions to reduce operator authority and may
contribute to better performance; however, such a scenario may decrease system transparency
and provide little knowledge of SA to the operators. Therefore, with respect to automation
transparency, we hypothesize:
H9: Face culture operators will trust and exhibit automation bias and accept
recommendations even if their basis is not well understood, while dignity and honor
culture operators will be less likely to trust or accept recommendations on this basis.
- This is because dignity cultures have high levels of IDV, and honor cultures
require automated aids to have a structured formation.
H10: Dignity and honor culture operators will be less likely to comply with high LOA
than face culture operators, who, as a result, will be more likely to exhibit
complacency and automation bias. There will be no difference in the use of low
LOA.
- This hypothesis relies on the rationale for H9 above. A high LOA contains little
system transparency, while in low LOA, operators have more chances to interact

30
with the automated systems and gain better knowledge to calibrate their trust in
automation.
H11: Honor operators will require a greater support of trust from knowledge of process
and/or purpose than dignity and face cultures, and will be prone to disuse.
- This is due to the high level of UA in honor cultures.
Some effects associated with trust (such as over-reliance) have been found to occur only
under multitasking or heavy workload conditions (Visser & Parasuraman, 2011). Because fewer
resources were available for secondary tasks in high workload situations, participants may have a
higher tendency to rely on automated assistance when they are experiencing heavy task loads.
H12: Operators will have higher levels of trust and accept more automated
recommendations or exhibit fewer checking behaviors on automation while
perceiving high workload conditions.
- We hypothesize that this will be a general finding that is valid across all cultures.
While monitoring automated systems, operators may check the provided automated aids
to verify the system’s accuracy, as well as maintaining efficient SA. With respect to the vigilance
behaviors, we hypothesized:
H13: Honor and face culture operators will exhibit more vigilance and more monitoring
behavior than operators from dignity cultures.
- Honor culture operators tend to be more distrustful, and the social interactions of
face culture operators are managed by institutional sanctioning.
The above hypotheses will be evaluated through cross-cultural experimental studies. In
the experiments, participants’ levels of trust will be measured using the trust instruments that we
developed in prior research.

31
4.0 INITIAL SCALE DEVELOPMENT
Attempts to measure trust in automation have emphasized specific contexts, such as e-commerce
systems (Kim, Ferrin, & Rao, 2008; Mcknight & Carter, 2011; McKnight, Choudhury, &
Kacmar, 2002) or intelligent agents (Li et al., 2010; Wang et al., 2010); and as a result, its
applications have not contributed to a well-defined framework for studying the relationship
between cultural dynamics and attitudes toward trust in automated aids. To develop a
psychometrically grounded measure that can be used to measure trust attitudes across cultures,
the proposed culture trust instrument collected relevant items from existing research studies and
examined the items through various rounds of reliability and validity tests in different countries
to retrieve the potential factors that influence trust attitudes.
The initial phase seeks to construct a reliable psychometric instrument that captures the
nature and antecedents of trust in automation across cultures, which begins with a pool of items
from the empirically derived, human-computer trust, and SHAPE Automation Trust Index
instruments, as well as augmented items from five existing studies, to increase the reliability of
the discovered dimensions. A brief summary of the adopted eight instruments is as follows.

32
4.1 EMPIRICALLY DERIVED
Jian, Bisantz, and Drury (2000) developed an empirically derived (ED) scale in three phases,
beginning with a word elicitation task. Participants were asked to describe their concepts of trust
and distrust towards people, automation, and trust in general. The participants then rated 138
words involving trust for their association with these concepts. They rated the words again for
their association with trust and distrust to determine whether the poles could safely be treated as
a continuum. Participants were finally required to compare and rate 30 positively and negatively
trust-related words for use in future analyses. The extracted 12-factor structure was then used to
develop a 12-item scale based on the examination of clusters of words, in which the 12-factor
extracted items roughly correspond to the classic three dimensions: ability-performance,
integrity-process, and benevolence-purpose. The result was a collection of items (such as “The
system is deceptive,” “I am wary of the system,” or “I can trust the system”) that examined
automated systems in a general fashion, rather than in specific instances.
4.2 HUMAN-COMPUTER TRUST
Madsen and Gregor's (2000) human-computer trust (HCT) instrument demonstrated construct
validity and high reliability within their validation sample, and has subsequently been used to
assess automation in a variety of simulations (Luz, 2009). In the development of the HCT scale,
subjects initially identified constructs that they believed would affect their level of trust in a
decision aid. Following refinement and modification of the constructs and potential items, the
instrument was reduced to five constructs (reliability, technical competence, understandability,

33
faith, and personal attachment). A subsequent principal components analysis limited to five
factors found that most scale items were related to their proposed factor. The resulting
instrument was comprised of 25 items that were focused on decision aiding, such as: “The
system analyzes problems consistently.”
4.3 SHAPE AUTOMATION TRUST INDEX
The SHAPE automation trust index (SATI), which was developed by the European Organization
for the Safety of Air Navigation (Goillau & Kelly, 2003), is the most pragmatically oriented of
the three measures (ED, HCT, and SATI). Preliminary measures of trust in air traffic control
(ATC) systems were constructed, based on literature review and a model of the task. This
resulted in a seven-dimensional scale (reliability, accuracy, understanding, faith, liking,
familiarity, and robustness). The measure was then refined through work with focus groups, with
air traffic controllers from different cultures rating two ATC simulations. Scale usability
evaluations and construct validity judgments were also collected. Because the items were refined
to reduce ambiguities and the constructs were selected for appropriateness by multicultural
groups of air traffic controllers, these scales had the highest face validity of the measures
considered. For example, a representative item from the SATI: “Do you understand the behavior
and displayed intent of the automation?”

34
4.4 CULTURE-TECHNOLOGY FIT
Culture-technology fit (CTF) investigates the trustworthy relationship between cultural contexts
and post-adoption beliefs in the use of mobile devices (Lee, Choi, Kim, & Hong, 2007). CTF
includes 30 items within 10 factors (3 items for each), in which two of the cultural profiles,
individualism and uncertainty avoidance, were selected for our initial scale-development phase
(i.e., our study adopted 6 items within 2 constructors).
4.5 INTERNATIONAL COMPARISON OF TECHNOLOGY ADOPTION
The international comparison of technology adoption (ICTA) examined the cultural effects of
user intentions on information technologies (Im, Hong, & Kang, 2011) via the UTAUT
instrument (Venkatesh, Morris, Davis, & Davis, 2003). The UTAUT questionnaire comprised 14
items within 5 factors, in which 11 items within 4 factors were chosen for our study.
4.6 ONLINE TRUST BELIEFS
Online trust beliefs (OTB) examines the moderating role of uncertainty avoidance in online trust
beliefs between subjective norms, integrity, and ability dimensions (Hwang & Lee, 2012). OTB
includes 16 items within 6 factors, in which 12 items within 5 constructs were selected for
inclusion in our study.

35
4.7 TECHNOLOGICAL ADOPTIVENESS SCALE
The technological adoptiveness scale (TAS) was a 12-item measure that examined a person’s
relative openness to adopting and using new technology (Halpert, Horvath, Preston, Somerville,
& Semnani-azad, 2008), in which 9 items were chosen for our initial scale-development phase.
4.8 TRUST IN SPECIFIC TECHNOLOGY
The measure of trust in specific technology (TIST) examined different types of trust attitudes
across task contexts and information technologies, from specific (e.g., Excel or spreadsheet
products) to general uses in various automated tools (Mcknight & Carter, 2011). The scale
comprised 26 items within 7 factors, in which 19 items within 6 constructs were selected for our
study.
4.9 COLLECTED ITEMS OF THE INITIAL SCALE DEVELOPMENT
The collected items of the initial instrument development were based on questions about human
participants’ trust attitudes in a variety of contexts:
(a) General trust attitudes toward automation without reference to any specific uses of
automated applications—these items involved predisposition to trust and were
adapted from ED, TAS, and TIST (e.g., I am confident in an automation/ I believe
that most automations are effective at what they are designed to do).
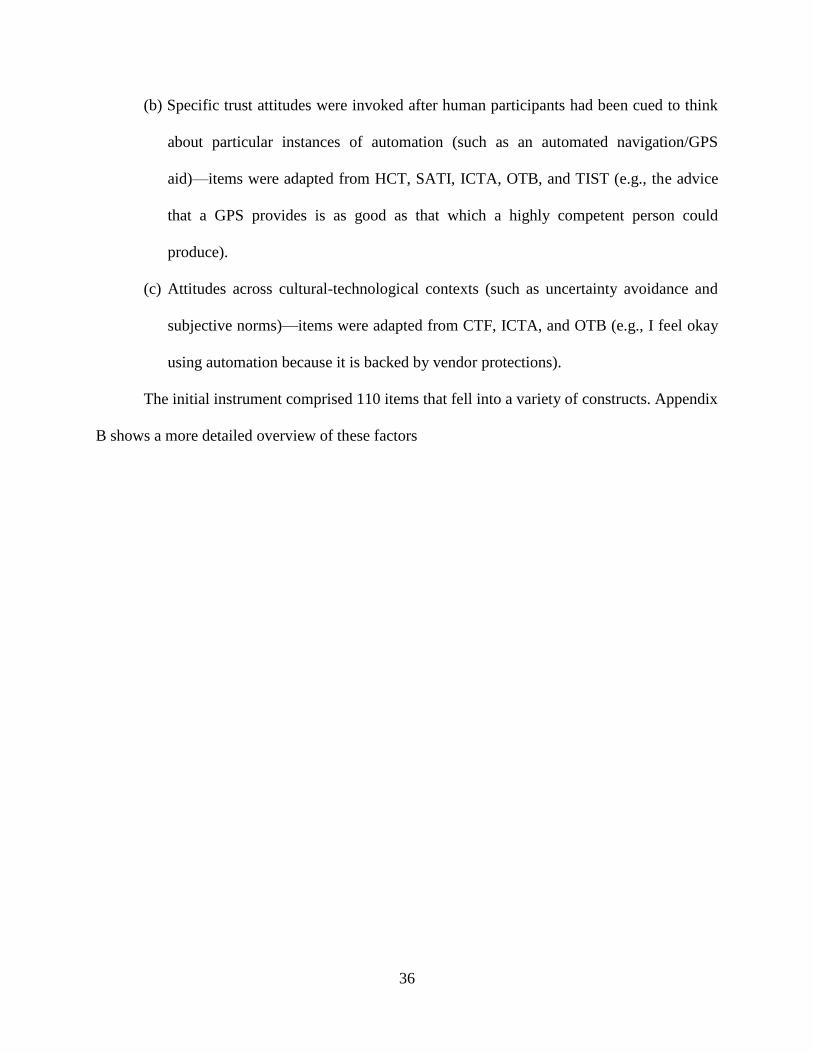
36
(b) Specific trust attitudes were invoked after human participants had been cued to think
about particular instances of automation (such as an automated navigation/GPS
aid)—items were adapted from HCT, SATI, ICTA, OTB, and TIST (e.g., the advice
that a GPS provides is as good as that which a highly competent person could
produce).
(c) Attitudes across cultural-technological contexts (such as uncertainty avoidance and
subjective norms)—items were adapted from CTF, ICTA, and OTB (e.g., I feel okay
using automation because it is backed by vendor protections).
The initial instrument comprised 110 items that fell into a variety of constructs. Appendix
B shows a more detailed overview of these factors

37
5.0 STUDY 1 - CLASSIFICATION OF ITEMS PURPOSE
Due to the variety of automated systems and the fact that relationships between attitudes involve
both general and specific uses of automation (e.g., smartphone apps vs. cockpit automated aids),
trusting beliefs were significantly affected with respect to the purpose of automated aids. Rather
than being a unitary concept, the antecedents of trust in automation and subsequent automation
uses include a number of facets with at least two common elements: namely, the general and
domain-specific uses of applications. To develop an instrument that is capable of reliably
assessing trust in automation, the initial step was to categorize the characteristics of the items
into either a general or a specific purpose. 45 student participants were recruited from the
University of Pittsburgh community to identify the referents of the selected items, and most of
the participants were frequent computer users. To classify each item’s purpose, the participants
were given the following instructions:
“Please respond to the following statements about your trust in automation. By automation, we
mean any technology or service that you have used before, including apps, devices,
functions, or systems. Based on your experience, use the following scale to rate the extent to
which you disagree (1) or agree (5) with the statements below. Note: there are no wrong
responses to any of the statements: the most critical need is to record your own true opinion
on each item. If you think the provided instruction is not sufficient to answer a question,
please rate it as having insufficient information.”

38
Figure 2. Classification of item’s purpose
A 5-point Likert scale, which ranged from strongly disagree (1) to strongly agree (5), was
adopted in the initial test; however, participants were allowed to rate an item as insufficient if
they felt the item was too closely associated with a specific automated system for general use
(Fig. 2). If an item was rated as insufficient more than once or more than one-third of the ratings
fell into the neutral characteristic, the item was categorized to measure the specific use of
automation. Among 110 selected items, 70 items were identified as addressing automation in
general, whereas 40 items involved judgments about particular instances of automation. The
results were consistent with prior research and suggested that trust attitudes had different
attributes (i.e., either a general or a specific trust in automation) that were critical and necessary
to include for classifying human trust development and the uses of automated applications. These
classified items were used in the next round of data collection.

39
6.0 STUDY 2: FIRST ROUND OF SCALE DEVELOPMENT
To examine the relationship between the measured items, the second study focused on grouping
the collected items and identifying latent constructs. An empirical study was conducted through
Amazon Mechanical Turk (MTurk). MTurk is an online crowdsourcing system that enables
researchers to post a variety of tasks and collect data in efficient and inexpensive ways. The
collected responses were used to examine the underlying relationships between measured
variables, as well as to refine our scale by rewording or identifying problematic items.
6.1 EXPERIMENTAL METHOD
A total of 110 items, along with 2 perceptions (general vs. specific use of automation), were used
in the second study and were tested by 65 MTurk participants. The instrument was measured on
a 5-point Likert scale, in which respondents were asked to rate their trust beliefs in automated
systems based on the description shown in Table 1. In general automation, instead of pointing
out a targeted system, the participants were able to name any automated applications that they
have experienced, while GPS navigation devices were introduced as a specific use of
automation.

40
Table 1. Descriptions of general and specific uses of automation
Type Description
General
Automation
By “Automation,” we mean any technologies or service that takes actions
automatically and that you have used, including apps, devices, functions, or
systems.
Specific
Automation
By “Automation,” we focus mainly on GPS navigation systems, including all
types of navigation devices that you have used, such as an automotive
navigation system (e.g., Garmin) or smartphone navigation apps (e.g., Google
maps).
6.2 RESULTS: EXPLORATORY FACTOR ANALYSIS
To refine the instrument, exploratory factor analysis (EFA) was used to determine the
dimensionality of the data and item loadings among constructs. A principal components analysis
with varimax rotation was performed to examine the number of factors that were produced. A
five-factor model was returned that explained 52.4% of the variance in general automation, while
70.2% of the variance of the specific automation was represented by another five-factor model.
The overall item reliability was examined, and if the resulting Cronbach's alpha was lower than
0.7, the factor was eliminated (as with Factor 4 under specific automation in Table 2).
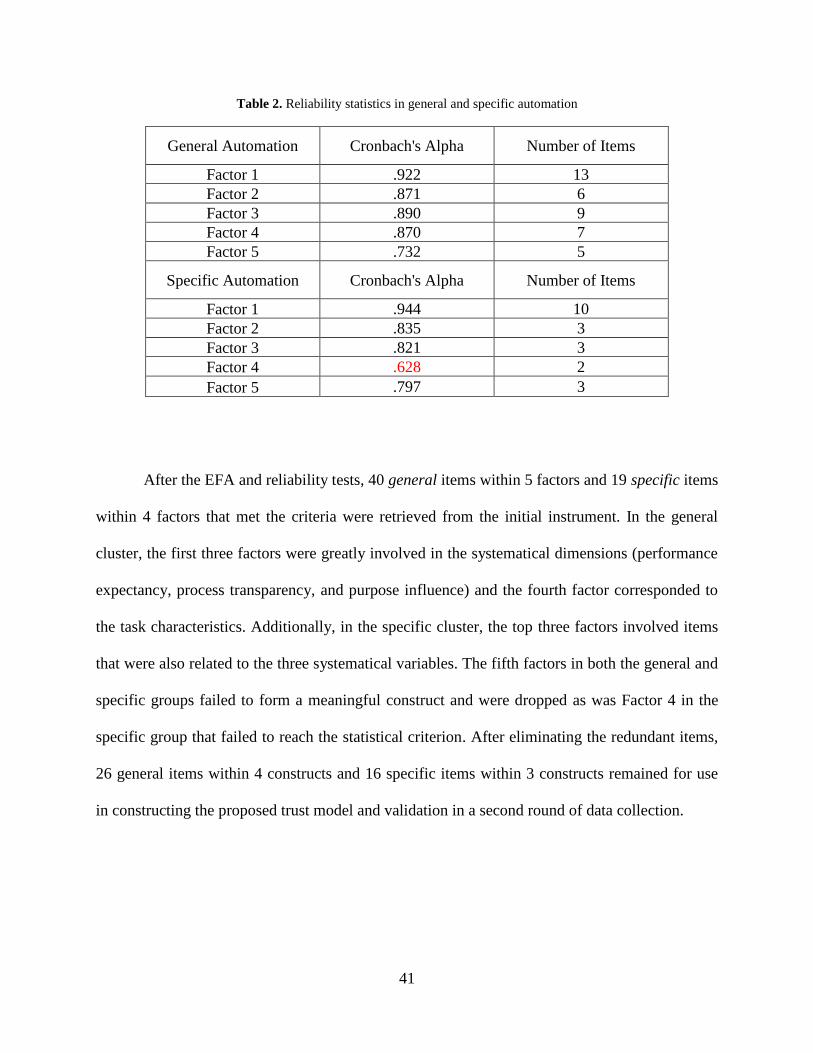
41
Table 2. Reliability statistics in general and specific automation
General Automation Cronbach's Alpha Number of Items
Factor 1 .922 13
Factor 2 .871 6
Factor 3 .890 9
Factor 4 .870 7
Factor 5 .732 5
Specific Automation Cronbach's Alpha Number of Items
Factor 1 .944 10
Factor 2 .835 3
Factor 3 .821 3
Factor 4 .628 2
Factor 5 .797 3
After the EFA and reliability tests, 40 general items within 5 factors and 19 specific items
within 4 factors that met the criteria were retrieved from the initial instrument. In the general
cluster, the first three factors were greatly involved in the systematical dimensions (performance
expectancy, process transparency, and purpose influence) and the fourth factor corresponded to
the task characteristics. Additionally, in the specific cluster, the top three factors involved items
that were also related to the three systematical variables. The fifth factors in both the general and
specific groups failed to form a meaningful construct and were dropped as was Factor 4 in the
specific group that failed to reach the statistical criterion. After eliminating the redundant items,
26 general items within 4 constructs and 16 specific items within 3 constructs remained for use
in constructing the proposed trust model and validation in a second round of data collection.
42
6.3 MODEL DEVELOPMENT
To capture the direct and indirect effects of trust on various situations, the proposed model (Fig.
3) includes three systematic constructs (performance expectancy, process transparency, and
purpose influence) that closely resemble those of Lee and See’s model (Lee & See, 2004), in
which they compared fourteen relevant measures and found that most involved only two to three
dimensions. This three-dimensional structure fits nicely with the ability definition from Mayer et
al., (1995) of ability (performance), integrity (process), and benevolence (purpose), which has
been widely adopted in social psychological studies of trust and suggests that candidate items for
an instrument measuring trust in automation should contain at least these dimensions.

43
Figure 3. Model of factors of trust development in automation. Performance expectancy, process
transparency, and purpose influence are the constructs (solid lines); individual differences, task contexts, and
cultural differences are the moderators (dotted arrows).
These three main constructs, along with three types of moderators, are expected to
interact in complex ways to produce trust mediated behaviors. The following sections describe
the model’s constructs and moderators in greater detail.

44
6.3.1 Performance expectancy
Performance expectancy is defined as an individual’s belief that applying automation will help
enhance overall job performance. The degree of trust will be affected by the past results and
consequences of system performance. Eight general and four specific items are involved this
cluster, along with three dimensions: outcome expectancy, perceived usefulness, and relative
advantage.
6.3.1.1 Outcome expectation
Outcome expectancy relates to the belief that by receiving assistance from a system, an
individual believes the job performance would be enhanced.
6.3.1.2 Perceived usefulness
Perceived usefulness refers to the degree to which a person believes that using an automated
system would enhance the job performance. For example, an individual may feel that automation
is useful on her tasks or that using automation makes her tasks easier.
6.3.1.3 Relative advantage
Relative advantage compares the differences in a user’s preferences between interacting with
another individual and relying on a particular instance of automation. For instance, a person may
accept system predictions, rather than the recommendations from a group of consultants.

45
6.3.2 Process transparency
The transparency of automation may affect an individual’s degree of perceived difficulty in
using it (i.e., how it functions). Twelve items (five general and seven specific) were adopted,
distributed among four constructs: perceived ease of use, quality, reliability, and
understandability.
6.3.2.1 Perceived ease of use
Perceived ease of use reports an individual’s perceived cost or effort in learning and using an
instance of automation to perform a job.
6.3.2.2 Quality
The quality of provided information might affect a person’s trust in automation. For example, if
the automation fails to provide sufficient information, an individual may ignore
recommendations and switch off the automation.
6.3.2.3 Reliability
The reliability of assistance may directly influence the decision to use automation. The failure
rate, for example, may influence an individual’s willingness to rely on a particular type of
automation.
6.3.2.4 Understandability
Understandability refers to difficulties in comprehending how automation performs tasks and in
predicting the outcomes and consequences.

46
6.3.3 Purpose influence
Purpose influence relates to a person’s knowledge of what the automation is supposed to do.
Seven general and five specific items from the conducted study were involved in this cluster and
cover four dimensions: benevolence, certification, faith, and initial trust.
6.3.3.1 Benevolence
Benevolence refers to an individual’s beliefs that automation is designed with good intentions
and will not diminish their performance.
6.3.3.2 Certification
The presence of a certification or product guarantee may lead to less worry about its potential
flaws. For example, a third-party seal would be critical for online banking systems.
6.3.3.3 Faith
Faith refers to an individual’s belief in future behavior of an instance of automation. For
instance, people may rely on the recommendation from automation rather than themselves when
they are unsure about a decision.
6.3.3.4 Initial trust
Initial trust refers to a person’s instinctive tendency of trust when using an innovation. An
individual may give a particular type of automation the benefit of doubt when they first use it.

47
6.3.4 Moderators
It is generally believed that trust is dynamic and that it interacts with a variety of other influences
to determine behaviors. For example, a self-confident operator may operate a system manually
because the operator believes she can do a better job, while an operator from a culture with high
levels of uncertainty avoidance may choose manual operation to avoid the slight possibility of
automation error. Although the observed disuse of automation is the same in both of these cases,
its cause and any potentially effective interventions are significantly different. To ensure that the
measurement instruments are reliable across various contexts, so as to avoid confounding,
investigating the role of trust in the use of automation requires pairing subjective measurements
of the intervening variable, trust, with observations of behavior.
To enhance the explanatory power, three types of moderators are included in the
proposed model to study how task contexts affect trust intention and consequence behaviors and
to capture both individual and cultural differences for better predicting trust behaviors. It’s
hypothesized that these moderators will affect the main constructs and will therefore indirectly
influence changes in trust behaviors. An individual’s trust could influence the resulting reliance
on automation, as well as the task performance. Despite the system outcome, an individual might
reevaluate her strategies for interacting with the automation.
6.3.4.1 Cultural-technological contexts
Cultural-technological contexts represent the distinct situations of the involved task complexity,
and facilitate conditions, risk, voluntariness of use, and workload.

48
6.3.4.2 Cultural differences
Cultural differences contain Hofstede’s cultural dimensions (power distance,
individualism/collectivism, and uncertainty avoidance) and cultural syndromes (cultures of
dignity, cultures of face, and cultures of honor).
6.3.4.3 Individual differences
Individual differences refer to an individual’s background, including age, instinctive cognitive
capacity, education, prior experience, gender, and personality traits.
49
7.0 STUDY 3: SCALE CONSTRUCTS REFINEMENT
To strengthen item quality and further examine the external validity of the instrument, before
conducting another round of data collection, items that fulfilled the concept of the general and
specific constructs were pooled from twelve reputable measurements to create the instrument.
Details of the root constructs and definitions are also shown in Appendix B. A total of 76 items,
26 (1st MTurk) + 50 (new), and 33 items, 16 (1st MTurk) + 17 (new), were included in the lists of
general and specific automation, respectively. The collected 109 items, along with two
perceptions (76 items in the general group and 33 items in the specific group), were used in the
second round of scale refinement. Smartphones were chosen as a general use of automation and
GPS navigation systems were chosen as an instance of specific automation. After eliminating the
invalid samples (i.e., those where the participants failed to answer the verifiable questions
correctly), 107 responses were collected from MTurk.
7.1 INSTRUMENT RELIABILITY AND VALIDITY TESTS
The results of reliability tests (in Table 3) showed that the instrument was robust, as observed in
the measures of Cronbach’s alpha values, in which the range from 0.785 to 0.915 exceeded the
suggested criteria of 0.70 (Venkatesh et al., 2003). To capture the dominant items under each
latent construct, as recommended by Bentler and Chou (1987) each latent variable should be

50
measured by at least three observable indicators. The top eight loading items (loading range
0.69~0.86) in the general cluster and the top six loading items (loading range 0.77~0.89) in the
specific group were remained for constructing the cultural trust instrument (CTI). In other
words, a total of 50 dominant items (32 general and 18 specific) were retrieved.
Table 3. Reliability statistics for general and specific uses of automation
General Automation (suggested Cronbach’s alpha > 0.7)
Performance
expectancy
Process
transparency
Purpose
influence
Task
contexts
.908 .897 .915 .871
Specific Automation (Cronbach’s alpha)
Performance expectancy Process transparency Purpose influence
.879 .873 .785
The reliability and validity tests were performed again on these dominant items. In
addition, to ensure that the retrieved items can well represent their designated factors, the cover
variances were also examined. The results revealed that the items succeeded in both reliability
(Cronbach’s alpha value: 0.890~0.929, threshold value of 0.7) and validity tests (average
variance extracted (AVE): 0.567~0.738, threshold value of 0.5) along with a high cover variance
(0.946~0.987), as shown in Table 4.

51
Table 4. Reliability tests, validity tests, and the results of cover variance of the dominant items
General Automation Cronbach's Alpha AVE Cover Variance
Performance expectancy .928 .667 .966
Process transparency .929 .668 .962
Purpose influence .899 .585 .946
Task contexts .890 .567 .948
Specific Automation Cronbach's Alpha AVE Cover Variance
Performance expectancy .929 .738 .987
Process transparency .921 .718 .962
Purpose influence .899 .664 .979
Through the empirical validation, a total of 50 items (32 general and 18 specific) were
retrieved. To further examine the external validity of the instrument, another round of data
collection was conducted across three different countries to cross-validate the instrument.

52
8.0 STUDY 4: CROSS CULTURAL VALIDATION: INSTRUMENT PRETEST
To investigate how cultural diversity may affect trust in automation, another round of data
collection was conducted in the U.S., Taiwan, and Turkey to validate the instrument across
cultures. Student populations were used in Taiwan and Turkey, due to less widespread
participants in MTurk in these countries. Taiwanese participants were recruited from Chengchi
University and Turkish participants were recruited from Özyeğin University. In order to increase
the diversity of the sample, U.S. army war college students were also recruited. For the
Taiwanese and Turkish participants, smartphones were introduced as a context for considering
the general use of automation, while GPS was used as the specific use of automation. However,
due to a particular style that is peculiar to the U.S. group, participants were allowed to name all
the types of automation that they may have previously encountered in military service as the
general purpose of automation; while an iPad, as a course device issued by the college, was
chosen as the specific use of automation.
8.1 DATA ANALYSIS
After eliminating the unengaged responses (i.e., participants failed to answer the verifiable
questions correctly), a total of 311 student responses were collected and used to refine the CTI.
Reliability and validity tests were conducted to ensure the item’s consistency.

53
Table 5. Cross-country scale rating comparisons
(Suggested threshold values: Cronbach’s α>0.7 and AVE>0.5)
General Automation
(number of responses)
United States
(100)
Taiwan
(120)
Turkey
(91)
α AVE α AVE α AVE
Performance expectancy 0.888 0.619 0.862 0.527 0.878 0.552
Process transparency 0.869 0.546 0.856 0.503 0.855 0.513
Purpose influence 0.844 0.500 0.777 0.409 0.85 0.491
Task contexts 0.704 0.432 0.743 0.415 0.8 0.440
Specific Automation United States Taiwan Turkey
α AVE α AVE α AVE
Performance expectancy 0.847 0.587 0.859 0.594 0.903 0.675
Process transparency 0.813 0.531 0.824 0.539 0.886 0.639
Purpose influence 0.809 0.516 0.84 0.56 0.887 0.642
The results (Table 5) satisfied the reliability tests (i.e., the Cronbach’s alpha values were
higher than the threshold value of 0.7 in all dimensions). However, some of the constructs failed
to pass the validity tests (i.e., AVE<0.5), such as purpose influence and task contexts, and will be
further validated in the next round of study.

54
8.2 SUMMARY
The preliminary results largely confirmed the adopted tripartite constructs (performance, process,
and purpose). Items were empirically categorized into two types (either a general or specific use
of automation) and were then tested through an online crowdsourcing platform (Amazon MTurk)
and cross-cultural empirical validation. After eliminating inappropriate items, 50 items were
extracted to refine the instrument, with 32 items falling into the general cluster and 18 items
involving specific uses of automation. To further examine whether the developed 50-item
instrument was able to capture users’ initial levels of trust, as well as instantaneous trust after
experiencing a certain type of automated system, another round of cross-cultural validation was
conducted in the U.S., Taiwan, and Turkey.

55
9.0 STUDY 5: TASK BASED EMPIRICAL STUDY
Existing literature on trust in automation has invariably acknowledged the richness and
multiplicity of influences. To study both the theoretical and empirical effects of cultural and
individual contexts on trust in automation, task-based empirical studies were conducted in the
U.S., Taiwan, and Turkey. We used an air traffic control system to incorporate various types of
tasks identified from the area of trust in automation literature. Through experimental studies, we
further validated the instrument, and investigated trust in automation and its effect on automation
reliance in different cultural populations.
9.1 APPARATUS
These experimental studies were developed by modifying an existing air traffic control (ATC)
system, RESCHU (Boussemart & Cummings, 2008), to simulate a traffic control scenario with
multiple unmanned air vehicles (UAVs). RESCHU provided multiagent search and attack
environments by performing both UAV navigation tasks and target identification tasks, in which
the simulated multitasking environment was essential for observing the effects of over-trust and
overreliance on automated aids. RESCHU provided a payload window (shown in the top left in
Fig. 4) for target detection tasks, map display for UAVs routes for navigation tasks, a message
box for assigned enemy targets in payload tasks, status panels for each of the UAV’s current

56
states, and a mission timeline for both ongoing and upcoming tasks. Task results were included
in the message box and a real-time feedback panel (yellow text at the top right in Fig. 4)
provided instant feedback to support task awareness, as well as assisting the operator in
optimizing their multitasking strategy.

57
Figure 4. The RESCHU user interface. The map window shows the numbered UAVs (blue ovals) with paths to
targets (red diamonds); threat areas are marked by the yellow circles. When a UAV reaches a target, the engage
button will be switched on in the UAV status window and the UAV icon will begin flashing in the mission timeline.

58
9.2 EXPERIMENTAL TASKS
Five UAVs were assigned in the experiments, along with two experimental tasks, in which
payload tasks involved identifying enemy targets and navigation tasks required participants to
reroute the UAVs’ paths to avoid possible path conflicts and threat areas (which are shown as
yellow dots in Fig. 4).
9.2.1 Experimental Task I – Payload Tasks
As soon as a UAV reached a target area (shown as red squares in Fig. 4), a series of actions
needed to be performed to accomplish the payload tasks. Upon reaching a target, the operator
was presented with a panorama in the payload window and was asked to search for a specific
target (the assigned enemy object was revealed in the message box). The operator first observed
a low-resolution image in the payload window (Fig. 5a), along with three options: Check, Hit,
and Safe. By clicking the “Check” button, after a three-second delay, the system provided the
operator with a picture at higher resolution to further identify the existence of the assigned target
(Fig. 5b).
If an operator believed that the assigned hostile target was not in the panorama, the
operator could select “Safe” mode to terminate the attack; otherwise, the “Hit” mode would be
chosen to launch a strike on the enemy target. Following a payload submission (of either Hit or
Safe mode), the UAV was assigned to another available target and the process was repeated. In
addition, the message box and real-time feedback panel informed the operator as to whether the
submitted decision was correct or not.

59
(5a) Before checking (5b) After checking
Figure 5. The checking function in target detection tasks
9.2.2 Experimental Task II – Navigation Tasks
An autonomous path planner was used to generate the UAV paths by following a shortest-
distance criterion. As each of the UAVs was randomly assigned to a new target, the operator
needed to coordinate UAVs to keep them from interfering each other (i.e., to avoid conflicting
paths between UAVs). Meanwhile, the navigation tasks required the operator to monitor the
UAVs’ paths (Fig. 6a) and avoid passing through the hazard areas (shown as yellow dots in Fig.
6b). The need for assistance arose when the UAVs found themselves in the above risky
conditions, such as path conflicts or threat areas; and as a result, the operators needed to add
waypoints either to avoid collisions or to navigate around the threats.

60
(6a) Adding waypoints to avoid path conflicts
(6b) Adding waypoints to avoid threat areas
Figure 6. Adding waypoints to avoid collisions

61
9.3 AUTOMATED ASSISTANCE
To assist operators, two types of autonomy were included in the experimental tasks. A target finder was
used in the payload tasks, whereas a conflict detector was used in the navigation tasks.
9.3.1 Automated Assistance I – Target Finder
A target finder is used in the payload tasks to assist operators in locating enemy targets. A
likelihood alarm system (LAS) is introduced to the target finder to measure participants’ attitude
on uncertain information (Fig. 7), in which the LAS generates three types of automated
suggestions to provide information about the likelihood of suspicious events occurring (Wickens
& Colcombe, 2007; Wiczorek & Manzey, 2014). Based on the automated diagnosis, the target
finder provides a bounding box on top of the suspicious hostile target and highlights the payload
window in different colors (a red box/border in Fig. 8a, a yellow box/border in Fig. 8b). The
alarm condition is represented by the red box/border (Fig. 8a), which suggests that there is a
good possibility that the bounding box indicates the assigned target, while the yellow box/border
specifies a warning condition (Fig. 8b) that is associated with a higher level of information
uncertainty, which suggests that the assigned hostile target might be located by the bounding
box. A green border suggests a non-alert event (Fig. 8c), which presents a low possibility that the
assigned enemy target is included in the picture.

62
Figure 7. The likelihood alarm system (LAS) is applied to examine the effects of operators’ uncertainty avoidance
(Wiczorek & Manzey, 2014)
In the alarm and warning conditions, instead of searching for the assigned target, the
operator is asked to determine whether the bounding box precisely indicates the assigned target
or not. Hit mode will be chosen when the operator believes that the box has located the target
correctly; otherwise Safe mode will be selected. With the green cue (the non-alert condition), if
an operator detects a target, the operator must manually add a bounding box on the suspected
target to proceed to Hit mode.

63
(8a) Alarm condition (8b) Warning condition (8c) Non-alert condition
Figure 8. Conditions shown in the target finder
9.3.2 Automated Assistance II – Conflict Detector: Path Re-planning
One of the common problems in performing multi-UAV tasks is conflicting paths between
vehicles. A conflict detector is used in the navigation tasks, which provides alternative paths to
resolve collisions. Based on the planned route information, the path re-planning algorithm
suggests new paths to keep an UAV at the appropriate distance from another UAV to reduce the
risk of the aircraft colliding. By selecting the Auto button (Fig. 9), the suggested new paths are
applied to the involved UAVs in order to prevent the minimum separation from being violated.
In other words, instead of following the shortest-distance discipline, after activating the path re-
plan function, the UAVs reach the desired destinations with additional costs (in both traveling
distance and time) to meet the constraints of collision avoidance.

64
Figure 9. By clicking the auto button, new paths are applied to divert UAVs from a collision course
9.3.3 Automated Assistance II – Conflict Detector: Highlight
Automation transparency substantially affects an operator’s perceived difficulties in either
following or rejecting the automated recommendations. To enhance an operator’s understanding
of the autonomy, based on the path information used in the path re-plan mechanism, the
highlighting application indicates path conflicts by placing a red square on the map (Fig. 10a) or
adding red dots (Fig. 10b) if the UAV has travelled through hazardous areas.
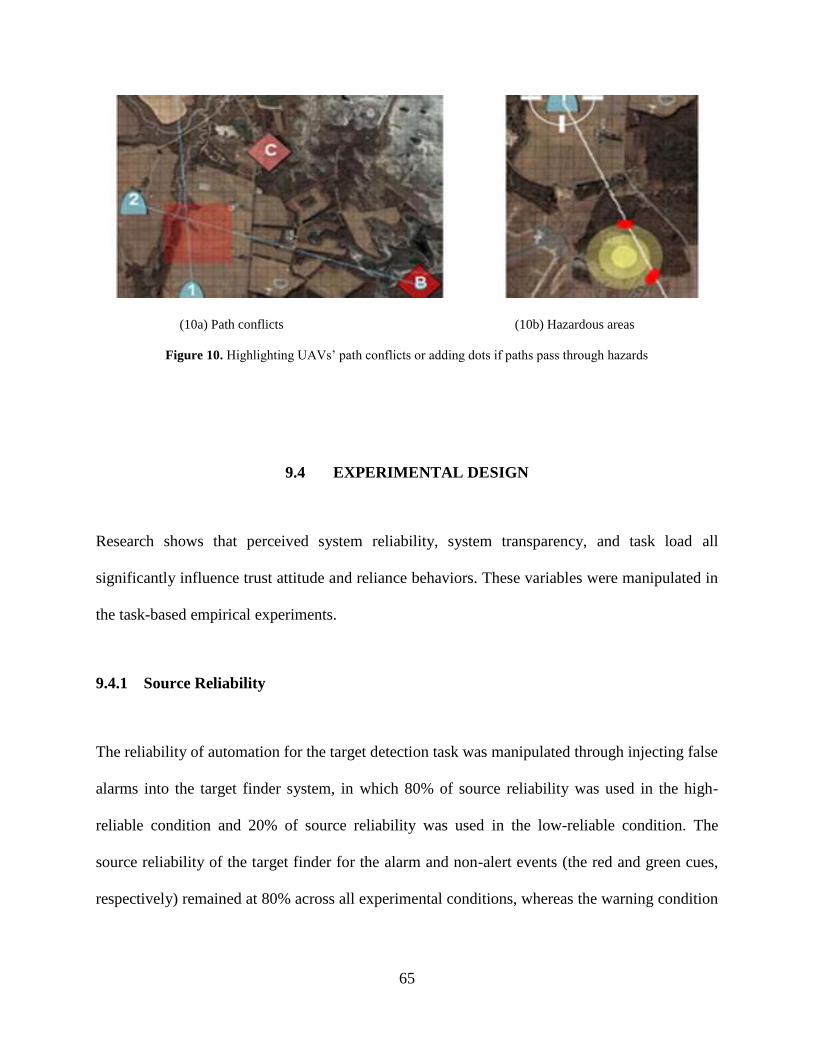
65
(10a) Path conflicts (10b) Hazardous areas
Figure 10. Highlighting UAVs’ path conflicts or adding dots if paths pass through hazards
9.4 EXPERIMENTAL DESIGN
Research shows that perceived system reliability, system transparency, and task load all
significantly influence trust attitude and reliance behaviors. These variables were manipulated in
the task-based empirical experiments.
9.4.1 Source Reliability
The reliability of automation for the target detection task was manipulated through injecting false
alarms into the target finder system, in which 80% of source reliability was used in the high-
reliable condition and 20% of source reliability was used in the low-reliable condition. The
source reliability of the target finder for the alarm and non-alert events (the red and green cues,
respectively) remained at 80% across all experimental conditions, whereas the warning condition

66
(the yellow border) is set at 80% in the high-reliability condition and at 20% in the low-
reliability condition.
9.4.2 Automation Transparency
The operators were provided with three types of system transparency in the conflict detector. In
the highlight condition, the system highlighted the potential collisions (as in the red square/dots
shown in Fig. 10) and then the operator manually revised the involved UAVs’ routes to avoid
conflicts. In the path re-plan condition, once a collision was detected, the system generated
alternate routes for the UAVs and the operator needed to click the Auto button (Fig. 9) to apply
the new routes; however, no explanations (i.e., highlights) were included in this condition. The
third condition included both highlighted and path re-planning applications, which showed the
operators alternate paths with appropriate highlighting on the potential UAVs’ collisions. To
better examine the effect of system transparency on subtasks, a control condition was also
included, which served as a baseline comparison and provided no assistance for the navigation
tasks (i.e., an operator was required to detect the collisions and develop new routes on their
own).
9.4.3 Task Load
Prior research showed that adding the number of controlled agents may merely increase the
perception of workload (Visser & Parasuraman, 2011). To examine the relationship among
workload, trust, and reliance, the task load is manipulated through the changes of the UAVs’
moving speed, in which the vehicles move at 5.0 pixels/second in the high task load condition

67
and 2.5 pixels/second in the low task load condition. Increasing the UAVs’ travelling speed
resulted in more frequent payload requests for the target detection tasks, as well as a higher
chance for potential collisions between UAVs in the navigation tasks.
9.5 EXPERIMENTAL DESIGN AND CONDITIONS
The empirical study follows a mixed repeated-measures design, with countries (U.S., Taiwan,
and Turkey), automation reliability (high: 80% or low: 20%), information transparency (control
condition, path re-plan, highlight, and path re-plan x highlight) as the between-subject factors;
and task load (UAVs' speed doubled between conditions) as the within-subject variable.
Table 6. Experimental designs and conditions
Conflict Detector
Between Variables Control
Condition
(C)
Path
Re-plan
(PR)
Highlight
(HL)
Path Re-plan
x Highlight
(PRHL)
High
Reliability
HRC
HRPR
HRHL
HRPRHL
Low
Reliability
LRC
LRPR
LRHL
LRPRHL
The experiments were composed of eight conditions (Table 6), and each cell included 15
participants. 120 student participants were recruited in each of the three countries, and a total of
Target Finder
Within Variables
(High and Low Task Loads)

68
360 responses (120*3=360) were collected for the study. The U.S. participants were recruited
from the University of Pittsburgh; Taiwanese participants were recruited from National
Chengchi University; and Turkish participants were recruited from Özyeğin University. None of
the participants had prior experience with ATC systems. Additionally, to better capture cultural
characteristics, a qualified participant must have attended K–12 schooling in the represented
country.
Fig. 11 shows the experimental procedures. After providing demographic data,
participants were asked to rate their initial level of trust in automation through the cultural trust
instrument (CTI) that we had developed. Because of the variety of automated systems (e.g.,
smartphone apps vs. self-driving cars), trusting attitudes varied significantly with respect to the
use of the automation. To measure a general level of trust in automated systems, participants
were asked to rate their general trust attitudes, based on their beliefs about smartphones. After
finishing the pre-experiment phase, in the following 20-minute training sessions, based on a
randomly assigned condition, participants took an interactive training tutorial to learn control
operations with the automated applications (target finder and/or conflict detector). Participants
were informed that the goal was to avoid UAV path conflicts and threat areas, as well as to
identify and attack as many enemy targets as possible.

69
Figure 11. Experimental procedures
After the training tasks, participants began their first 10-minute experimental session, in
which they performed the target classification tasks by controlling five UAVs. At the conclusion
of the session, participants were asked to complete the trust instrument to evaluate their levels of
trust in the specific uses of the automated applications. After a brief break, the other task load
condition was run, accompanied by a repeated trust questionnaire. Conditions were fully

70
counterbalanced for source reliability in the target finder and automation transparency in the
conflict detector with different task load levels.
To avoid any language issues, before conducting the study, the CTI as well as system
aids in the testbed (RESCHU) system were translated into Chinese by two instructors in the
Department of East Asian Languages and Literatures at the University of Pittsburgh, and into
Turkish by our collaborators at Özyeğin University. In addition, the Chinese and Turkish
versions of BFI scales were adopted from (Leung, Wong, Chan, & Lam, 2012) and (Vazsonyi,
Ksinan, Mikuška, & Jiskrova, 2015) respectively; the Chinese version of CVSCALE was
retrieved from (Yoo, Donthu, & Lenartowicz, 2011) and the Turkish version was also translated
by our collaborators at Özyeğin University.
71
10.0 FINAL CULTURAL TRUST INSTRUMENT REFINEMENT
To further refine the instrument, exploratory factor analysis (EFA) was performed again to
determine the factor structures and the loading of items. Principal component analysis (PCA)
with orthogonal rotation (varimax) is the most frequently reported extraction approach in EFA
(Hinkin, 1995) and was adopted for our analysis as a result. However, the resulting pattern
matrix revealed unexpected cross-loading problems among the items, which represented some
items that shared excessive variances between the constructs. To solve the cross-loading issue
(i.e., the violation of convergent validity), any items that failed to relate more strongly to the
designated construct (Boudreau, Gefen, & Straub, 2001), or where the loading differences
between intended and unintended factors were less than 0.200 (Asparouhov, Muthén, & Morin,
2015) were dropped. After another round of scale refinement, a total of 21 items (12 general
items, along with 4 constructs and 9 specific items that fell into 3 constructs) were retrieved from
the original pool of 50 items.
10.1 RELIABILITY
To measure the scale’s reliability, each item’s internal consistency was tested. As in the
reliability results in Table 7, the alpha value of the purpose construct in general automation failed
to satisfy the suggested threshold (α-value>0.7), and was therefore eliminated. Therefore, after

72
eliminating the purpose construct, only 3 general constructs (9 items) and 3 specific constructs (9
items), a total of 18 items, were included in our final CTI.
Table 7. Cross-cultural scale reliability tests
Reliability tests (suggestive threshold values: Cronbach’s α > 0.7)
General Automation ALL US TW TK
Performance expectancy 0.805 0.857 0.781 0.775
Process transparency 0.816 0.799 0.766 0.775
Purpose influence 0.668 0.572 0.695 0.657
Task context 0.748 0.695 0.788 0.723
Specific Automation ALL US TW TK
Performance expectancy 0.863 0.853 0.858 0.869
Process transparency 0.778 0.700 0.800 0.790
Purpose influence 0.844 0.840 0.838 0.860
10.2 CFA RESULTS: CONVERGENT AND DISCRIMINANT VALIDITY
Due to construct elimination, to ensure the consistency of the items, factor structures and item
loadings were examined again. The resulting pattern matrix in both the general and specific
clusters satisfied the convergent validity and accounted for the high percentage of total variance
with sufficient Kaiser-Meyer-Olkin (KMO) values (see Appendix C for more information).

73
Discriminant validity was examined, based on the shared variance between the construct
and its measures, in which the square roots of the shared variance must be larger than the
correlations across constructs in the matrix (see Appendix D). The results revealed that most of
the constructs in both general and specific automation supported the discriminant validity.
Table 8. Model fit assessment
General Automation
χ2 df
CFI
>0.90
RMSEA
<0.08
TLI
>0.90
US (n=120) 22.793 24 1.00 0.00 1.01
TW (n=120) 38.379 24 0.96 0.07 0.95
TK (n=120) 43.78 24 0.94 0.08 0.91
Specific Automation
US (n=420) 112.199 24 0.96 0.09 0.94
TW (n=420) 103.708 24 0.96 0.09 0.94
TK (n=420) 45.689 24 0.99 0.05 0.99
Target finder (n=720) 131.015 24 0.97 0.08 0.95
Conflict detector (n=540) 91.639 24 0.98 0.07 0.97
Table 8 shows chi-square statistics (χ2) and subjective goodness-of-fit indices for each of
the cultures, as well as automated aids. The resulting comparative fit index (CFI) and Tucker-
Lewis index (TLI) scores satisfied the suggested threshold values; however, two slight violations
in the root mean square error of approximation (RMSEA) were observed in both the American
and Taiwanese participants.

74
Table 9. Item loadings
General Performance Process Context
Perform2 Perform3 Perform4 Process2 Process4 Process5 Context1 Context2 Context6
US 0.82 0.89 0.89 0.76 0.85 0.88 0.86 0.73 0.65
TW 0.81 0.81 0.65 0.77 0.80 0.75 0.87 0.79 0.60
TK 0.81 0.79 0.79 0.69 0.86 0.85 0.72 0.89 0.67
Specific Performance Process Purpose
Perform2 Perform3 Perform4 Process3 Process4 Process5 Purpose3 Purpose4 Purpose5
US 0.80 0.87 0.83 0.76 0.86 0.56 0.74 0.84 0.86
TW 0.64 0.87 0.84 0.84 0.86 0.62 0.81 0.72 0.83
TK 0.84 0.84 0.82 0.77 0.76 0.75 0.69 0.80 0.87
Target
finder 0.81 0.86 0.84 0.82 0.85 0.63 0.72 0.80 0.86
Conflict
detector 0.74 0.83 0.81 0.73 0.84 0.71 0.69 0.83 0.84
The item loading matrix (Table 9) indicated that the items were good measures of the
intended latent factors, in which only one loading item was below 0.60 (item process-5 in the
specific cluster in the U.S. group: 0.56). Thus, we concluded that the proposed measurement
model adequately fits the data for each culture.

75
Table 10. Structural weights
General Automation Performance Process Context
US 0.57 0.58 0.84
TW 0.88 0.80 0.88
TK 0.74 0.56 0.85
Specific Automation Performance Process Purpose
US 0.77 0.94 0.78
TW 0.86 0.86 0.86
TK 0.84 0.93 0.88
The results of structural weights (Table 10) indicate how the model constructs affect the
overall level of trust in automation. The results of initial trust reveal that the context variable
largely influences the overall levels of trust across three cultures, whereas similar weights are
observed in the specific dimension.
10.3 MEASUREMENT INVARIANCE
Measurement invariance (MI) tests were performed to assure that the proposed constructs were
measuring the same trait in all of the cultural groups. If the developed CTI scale succeeds at the
MI tests, then the comparisons of the trust ratings across cultures were acceptable and yielded
meaningful interpretations. The overview of invariance analysis results is shown in Appendix E,
including the tested invariance model 1~12, the model description, and the corresponding fit
statistical indices (χ2, degree of freedom, p-value, and CFI). Configural invariance (as in model

76
1) imposed no equality constraints, which evaluated whether the factors and patterns of the
structure were similar across all groups; while measurement and structural invariance (as in
model 2) focused on examining the loadings in the measurement and structural variables of the
model were equivalent across the subgroups. The equal item-factor loading model (namely,
configural invariance) served as a baseline model to compare the differences of the nested
models (as in models 2 and 3).
10.3.1 Results for scale invariance analysis
To determine whether the items used in investigating general attitudes about automation had
similar patterns on the corresponding factor loadings, the differences in χ2 and the degree of
freedom between the baseline and nested models were examined. The results showed significant
differences (p=.024) between the factor loading invariance (model 2) and baseline (model 1)
models. By examining the loading values shown in Table 9, the item loading of performance_4
on the performance construct in the Taiwanese subgroup stood out, which was substantially
lower than the other two subgroups (US:0.89, TW:0.65, TK:0.79). To identify whether this item
alone accounted for the statistical variance, we measured whether the remaining eight items
(exempting performance_4) had similar patterns and loadings on the corresponding factors
across three cultures. The results (model 3) indicate that differences in the 8-item scale were not
significant across cultures. The test of model 3 provided some evidence that performance_4 in
the Taiwanese subgroup might be a major contributor to the failure of the invariance test of the
measurement items across three subgroups. As a result, we measured whether the scale invariant
existed in the U.S. and Turkish subgroups, with the Taiwanese group excluded. The results
(models 4–6) indicate that the measurement model with all nine items passes both the factor

77
loading and structural weights invariance tests in the American and Turkish cultural groups,
which suggests that the instrument can effectively measure the differences in initial trust
attitudes across cultures.
The aforementioned approaches were also applied to examine the items used to measure
trust attitudes on specific uses of automation. The scale invariance was violated (p=.020) in
model 8 and the possible problematic item (S_Process5) was excluded for further examination in
model 9. The remaining 8-item structure (model 9) showed no statistical differences across three
cultures, which suggested that S_Process5 was the main cause of the failure of the invariance
test. Because the lowest loading value of S_Process5 was observed in the U.S. group (US:0.56,
TW:0.62, TK:0.75), we therefore exempted the American data and conducted the scale
invariance tests on both the Taiwanese and Turkish data (models 10–12). The results succeeded
at both the factor loading and structural weights invariance tests and showed no statistical
differences between the baseline (model 10) and nested models (model 12), which indicates that
the developed scale was able to identify the differences between trust attitudes in the specific use
of automation across cultures.
This is worth noting because the χ2 value is highly sensitive to the sample size and the
significant results often reject the model that fits the data. Prior research (Cheung & Rensvold,
2002; Milfont, Duckitt, & Wagner, 2010) suggests that, from a practical perspective, it is more
reasonable to base the invariance decision on a difference in comparative fit index (∆CFI) rather
on ∆χ2 values (suggested value: ∆χ2 < 0.01). The differences of CFI (∆CFI) again confirmed
that the developed scale is able to accurately measure the trust attitudes toward automation
across cultures.

78
10.4 PREDICTIVE VALIDITY
To assess how well the CTI can predict system variables and the resulting trust attitudes,
correlation analyses were performed to examine the relationship between the operators’ level of
trust and acceptance of the automated aids, in which a significant correlation between reliance
behaviors on automation and trust scores on the scale would support the predictive validity of the
developed CTI. For example, we might theorize that an operator who exhibited high reliance
behaviors on system aids would rate a higher trust score in CTI than the ratings from an operator
who is less inclined to follow the automated recommendations. Thus, if there was a change in an
operator’s reliance behaviors, the trust score in CTI should reflect those differences.
10.4.1 Cultural Effects on Trust in Target Finder between Reliability Conditions
Operators’ reliance behaviors in payload tasks were measured by the ratio of following behaviors
(i.e., accepted recommendations) to the total number of automated suggestions made by the
target finder. Since appropriate levels of reliance are critical to human-automation interaction, to
measure the appropriate use of automation, the overall following behaviors were further
categorized into over-reliance, appropriate reliance, and under-reliance groups. Over-reliance
was defined as when the autonomy (target finder) provided a false alarm and the operator
believed that the recommendation was correct and submitted a Hit decision; in contrast, under-
reliance was defined as an operator rejecting a correct suggestion and submitting a Safe decision
instead. A higher ratio of appropriate reliance represented the operators appropriately calibrating
their trust in automation.

79
10.4.2 Correlation for Trust Attitude and Reliance Behaviors on Target Finder among
Three Cultures
Pearson correlation analysis (Table 11) for the results of reliance and trust ratings in target finder
(average score was computed by the mean value of the three constructs) showed highly
significant differences between specific trust and following as well as reliance behaviors, which
suggested that the developed CTI could appropriately predict the relation between operators’
reliance behaviors and trust attitude in automated aids under various system capabilities.
Table 11. Correlations for trust attitude and reliance behaviors on the target finder
*. Correlation is significant at the 0.05 level (2-tailed)
**. Correlation is significant at the 0.01 level (2-tailed)
Average Specific Trust Finder
(average score was computed by the mean value of the three constructs)
Following Behaviors
Pearson correlation .138**
Significant difference .000
Appropriate Reliance
Pearson correlation .158**
Significant difference .000
Over-Reliance
Pearson correlation -.140**
Significant difference .000
Under-Reliance
Pearson correlation -.076*
Significant difference .042

80
Further analysis (Table 12) confirmed a positive correlation between following behaviors
and trust ratings, and between appropriate reliance and trust values in the U.S. and Taiwanese
populations. However, no significant difference was observed in the Turkish group, which
suggests that system reliability may not be the most dominant factor that affects the relationship
between trust and reliance in the Turkish population.
Table 12. Correlations for trust attitude and reliance behaviors in the target finder
*. Correlation is significant at the 0.05 level (2-tailed)
**. Correlation is significant at the 0.01 level (2-tailed)
Correlation Results Following
Behaviors
Appropriate
Reliance
Over-
Reliance
Under-
Reliance
Trust
US group
Pearson correlation .176** .120 -.065 .-130*
Sig. (2-tailed) .006 .063 .317 .044
Trust
TW group
Pearson correlation .193** .207** -.186** -.081
Sig. (2-tailed) .003 .001 .004 .212
Trust
TK group
Pearson correlation .061 .061 -.103 .053
Sig. (2-tailed) .349 .345 .110 .410
10.4.3 Cultural Effects on Trust in Conflict Detector between System Transparency
An operator’s reliance on navigation tasks was determined by the ratio of accepted new paths
proposed by the conflict detector. Therefore, the analysis only included the path re-plan (PR) and

81
path re-plan x highlight (PRHL) conditions. The results (Table 13) showed significant
correlation in the PR condition but not in the PRHL condition, which revealed that while little
SA was provided by the automation, the operator’s trust attitude significantly guided their
reliance behaviors in the automated aids; however, when the transparency of the information
increased, this relationship was not observed.
Table 13. Correlations for trust attitude and reliance behaviors in the conflict detector
**. Correlation is significant at the 0.01 level (2-tailed)
Num of Accepted Automated Waypoints in Conflict Detector
Path Re-plan
(PR)
Pearson correlation .300**
Significant difference .000
Path Re-plan x
Highlight
(PRHL)
Pearson correlation .092
Significant difference .218
10.4.4 Correlation for Trust Attitude and Reliance Behaviors on Conflict Detector among
Three Cultures
Pearson correlation analysis (Table 14) for trust in conflict detectors and acceptance of proposed
new paths in the PR condition showed significant differences in the American as well as the
Turkish populations, but no significant difference was observed in the Taiwanese population.

82
Table 14. Correlations for trust attitude and reliance behaviors in the conflict detector
*. Correlation is significant at the 0.05 level (2-tailed)
**. Correlation is significant at the 0.01 level (2-tailed)
Correlation Results Path Re-plan (PR)
Trust
US group
Pearson correlation .274*
Sig. (2-tailed) .034
Trust
TW group
Pearson correlation .171
Sig. (2-tailed) .193
Trust
TK group
Pearson correlation .442**
Sig. (2-tailed) .000
10.5 SUMMARY
Over various phases of statistical examinations, the final 18-item CTI satisfies the stringent
(reliability and validity) tests, which suggests that the CTI is robust across national cultures and
can be used to capture trust differences in both general and specific uses of automation. The final
18-item CTI is included in Appendix F, including the English, Chinese, and Turkish versions.
Researchers should be cautious when using the items, as the general items measure participants’
initial trust in automation and must be examined before the training or experimental sessions,
while the specific items identify participants’ trust attitude in a specific automated system and
therefore should be used after experiencing the experimental sessions. In Appendix F,
smartphones and GPS systems are assigned as the targeted systems for general and specific
automation, respectively; however, researchers may switch these systems to work with their

83
desired applications. To examine the trust ratings, the results of the invariance measurement
indicate that CTI appears to be equivalent across cultures, which suggest that both the summed
scale values and factor scores can be used to make comparisons between cultural samples on
levels of trust in automation.

84
11.0 RESULTS OF THE TASK BASED EMPIRICAL STUDY
To evaluate the influences of cultural factors on trust in the specific use of automated systems
under various conditions, the effects of system reliability for the target finder, automation
transparency in the conflict detector, and perceived task loads were investigated. Data were
analyzed using a mixed-model ANOVA analysis method with source reliability (high: 80% vs.
low: 20%) in the target finder, automation transparency (control condition, path re-plan,
highlight, and path re-plan x highlight) in the conflict detector, countries (U.S., Taiwan, and
Turkey) as the between-subject factors, and task load (high vs. low) as the within-subject
variable. While conducting multiple comparisons, the following results applied the Bonferroni
correction for p<.05 rule to protect against Alpha inflation (i.e., family-wise error rate). In other
words, a Type I error across the pairwise comparisons was adjusted to be less than a 5% chance,
which was accomplished by dividing .05 by the number of comparisons.
11.1 SURVEY DATA: GENERAL TRUST
The analyses found significant cultural effects on initial levels of trust of automation in
performance (F2,357=2.969, p=.053), process (F2,357=66.225, p<.001), and task context
(F2,357=18.697, p<.001). Post-hoc analysis revealed cultural effects on performance constructs

85
(TW>TK, p=.066), process dimensions (US>TW, p=.065; US>TK, p<.001; TW>TK, p<.001),
and task context factors (US>TW, p<.001; US>TK, p=.011; TK>TW, p=.005).
To measure the overall effect, the average score was computed by the mean value of the
three constructs (F2,357=16.225, p<.001). T-tests revealed significant differences between the U.S.
and Turkey (p<.001), the U.S. and Taiwan (p=.022), and Taiwan and Turkey (p=.009), in which
the American participants had the highest score in general trust and the Turkish participants had
the lowest, with the Taiwanese rates falling in between (Fig. 12).
Figure 12. General levels of trust in automation among three cultures
Perform Process Task context All
U.S. 3.58 4.02 3.46 3.69
Taiwan 3.77 3.82 2.86 3.48
Turkey 3.53 3.07 3.18 3.26
1.00
1.50
2.00
2.50
3.00
3.50
4.00
4.50
Su
rvey
Rate
d S
core
s (1
~5)
General Trust in Automation

86
11.2 CULTURAL VALUE SCALE
The results of the CVSCALE showed significant differences in all three cultural constructs, in
which the American participants was higher in UA and IDV, and the Taiwanese participants was
higher in PD (Table 15). The results also revealed the differences between Hofstede’s original
data, which was collected from IBM employees between 1967 and 1973, and our collected data,
where the samples were drawn from student participants.
The results from Hofstede’s original data suggested that the American participants had
the lowest UA and that the Turkish participants had the highest PD score among these three
countries. However, our data showed the reverse results, in which the American participants now
had the highest score in UA and the Turkish participants had the lowest score in PD.

87
Table 15. CVSCALE rated scores
Measures US TW TK F-value,
p-value Post-hoc
Power distance (PD) 1.73 1.96 1.56 F2,357=18.617
p<.001
TW>US (p=.002)
TW>TK (p<.001)
US>TK (p=.032)
Uncertainty
avoidance (UA) 4.18 3.55 3.92
F2,357=45.024
p<.001
US>TK (p<.001)
US>TW (p<.001)
TK>TW (p<.001)
Individualism (IDV) 3.48 3.21 3.25 F2,357=5.162
p=.006
US>TK (p=.036)
US>TW (p=.009)
TK≈TW (N.S.)
1.00
1.50
2.00
2.50
3.00
3.50
4.00
4.50
Power Distance Uncertainty Avoidance Individualism
CV
SC
AL
E R
ate
d S
core
s (1
~5
)
CVSCALE rated scores
U.S.
Taiwan
Turkey

88
11.3 CORRELATIONS FOR GENERAL TRUST ATTITUDE AND CULTURAL
DIMENSIONS
Pearson correlation analysis (Table 16) for the cultural dimension and initial trust in automation
showed significant differences between general levels of trust and UA, and between general
levels of trust and IDV, which suggested that an individual’s initial trust was positively
correlated to both UA and IDV.
Table 16. Correlations for trust attitudes and cultural dimensions
General Trust
Power distance
(PD)
Pearson correlation .052
Significant difference .325
Uncertainty avoidance
(UA)
Pearson correlation .128
Significant difference .015
Individualism
(IDV)
Pearson correlation .179
Significant difference .001
Further analysis confirmed a positive correlation between UA and general trust, and
between IDV and general trust in the American participants; however, no significant difference
was observed in the Taiwanese and Turkish participants (Table 17).

89
Table 17. Correlations for trust attitudes and cultural dimensions in the American, Taiwanese, and Turkish
participants
Measures Trust PD UA IDV
Trust
US group
Pearson correlation 1 .014 .212 .223
Sig. (2-tailed) .877 .020 .014
Trust
TW group
Pearson correlation 1 -.119 -.076 .149
Sig. (2-tailed) .196 .408 .105
Trust
TK group
Pearson correlation 1 .122 .122 .087
Sig. (2-tailed) .184 .183 .344
11.4 BIG FIVE INVENTORY
A big-five inventory (BFI) was used to measure differences in personality traits. An ANOVA
analysis showed significant differences between participants in all five measures (Table 18):
extraversion (E), agreeableness (A), conscientiousness (C), neuroticism (N), and openness (O).

90
Table 18. BFI scale rating comparisons
Measures US TW TK F-value,
p-value Post-hoc
Extraversion 3.27 3.30 3.64 F2,357=9.489
p<.001
TK>TW (p<.001)
TK>US (p=.001)
TW≈US (N.S.)
Agreeableness 3.84 3.65 3.59 F2,357=6.303
p=.002
US>TW (p=.034)
US>TK (p=.002)
TW≈TK (N.S.)
Conscientiousness 3.63 3.40 3.45 F2,357=4.830
p=.009
US>TK (p=.070)
US>TW (p=.010)
TK≈TW (N.S.)
Neuroticism 2.90 2.88 3.09 F2,357=3.012
p=.050
TK>TW (p=.080)
US≈TK (N.S.)
US≈TW (N.S.)
Openness 3.66 3.47 3.95 F2,357=21.164
p<.001
TK>US (p<.001)
TK>TW (p<.001)
US>TW (p=.032)
1.00
1.50
2.00
2.50
3.00
3.50
4.00
4.50
Extraversion Agreeableness Conscientiousness Neuroticism Openness
BF
I sc
ore
(1
~5
)
BFI Scale Rated Scores
U.S.
Taiwan
Turkey

91
11.5 CORRELATIONS FOR GENERAL TRUST AND PERSONALITY TRAITS
A Pearson correlation analysis showed that only two dimensions, agreeableness and
conscientiousness, significantly correlated to an individual’s initial level of trust. The results
indicated that higher agreeableness or conscientiousness values in an individual’s personality
traits resulted in higher initial trust in automation, as shown in Table 19.
Table 19. Correlations for trust attitudes and personality traits
General Trust
Extroversion (E)
Pearson correlation .124
Significant difference .019
Agreeableness (A)
Pearson correlation .215
Significant difference <.001
Conscientiousness (C)
Pearson correlation .149
Significant difference .005
Neuroticism (N)
Pearson correlation -.150
Significant difference .004
Openness (O)
Pearson correlation -.044
Significant difference .400

92
Further analysis confirmed the correlation effects between the personality traits and
general trust ratings in three selected countries (Table 20). The results showed positive
correlations between extroversion and initial trust in the American as well as the Taiwanese
participants, positive correlation between agreeableness and initial trust across all three cultures,
and a positive correlation between conscientiousness and initial trust in the Taiwanese
participants. A negative correlation was found between neuroticism and initial trust in the
American, as well as in the Taiwanese participants.
Table 20. Correlations of trust attitudes and personality traits in the American, Taiwanese, and Turkish groups
Measures Trust E A C N O
Trust
US group
Pearson
correlation 1 .178 .155 .080 -.196 .109
Sig. (2-tailed) .052 .091 .385 .032 .237
Trust
TW group
Pearson
correlation 1 .345 .209 .226 -.158 .043
Sig. (2-tailed) <.001 .022 .013 .086 .638
Trust
TK group
Pearson
correlation 1 .098 .177 .065 -.034 -.124
Sig. (2-tailed) .286 .053 .480 .713 .177

93
11.6 SURVEY DATA: TRUST IN TARGET FINDER AND CONFLICT DETECTOR
BETWEEN TASK LOADS
While increasing the task load (i.e., doubling the UAVs’ travelling speed), no statistical difference
was found on trust in the conflict detector between workload conditions. However, statistical
differences were observed on trust in the target finder (Table 21), in which participants rated a
higher trust in a high workload (HW) condition rather than in a low workload (LW) condition in
performance, process, and overall trust.
Table 21. Trust in payload tasks between workload conditions
Payload Tasks: Trust in Target Finder between Task Load conditions
Measures F1,672 p-value Post-hoc
S_Performance 3.831 .051 HW>LW
S_Process 2.748 .098 HW>LW
S_Purpose 0.710 .400 N.S.
Overall (average value) 3.089 .079 HW>LW

94
11.6.1 Survey data: cultural effects on trust in target finder between task load conditions
Figure 13. Average trust scores in target finder between task load conditions. Performance, process, and purpose
constructs are each represented by their proportions in each bar in the chart
To identify the relationship between cultural contexts and task load conditions, two levels of task
loads were examined for the target finder across cultures. The analysis (Fig. 13) found a main
effect on overall trust values in the target finder under both HW (F2,357=3.668, p=.027) and LW
(F2,357=9.339, p<.001). T-tests revealed similar trust attitudes in the American and Taiwanese
participants, which were significantly higher than those of the Turkish participants in HW
(US>TK, p=.066; TW>TK, p=.052) and LW (US>TK, p<.001; TW>TK, p=.012).
Further analysis showed that an increased task load affected participants’ trust about the
purpose of automation in the target finder (F2,357=2.350, p=.097); in the HW condition, Taiwanese
participants had higher levels of trust in the purpose factor than American participants (p=.095),
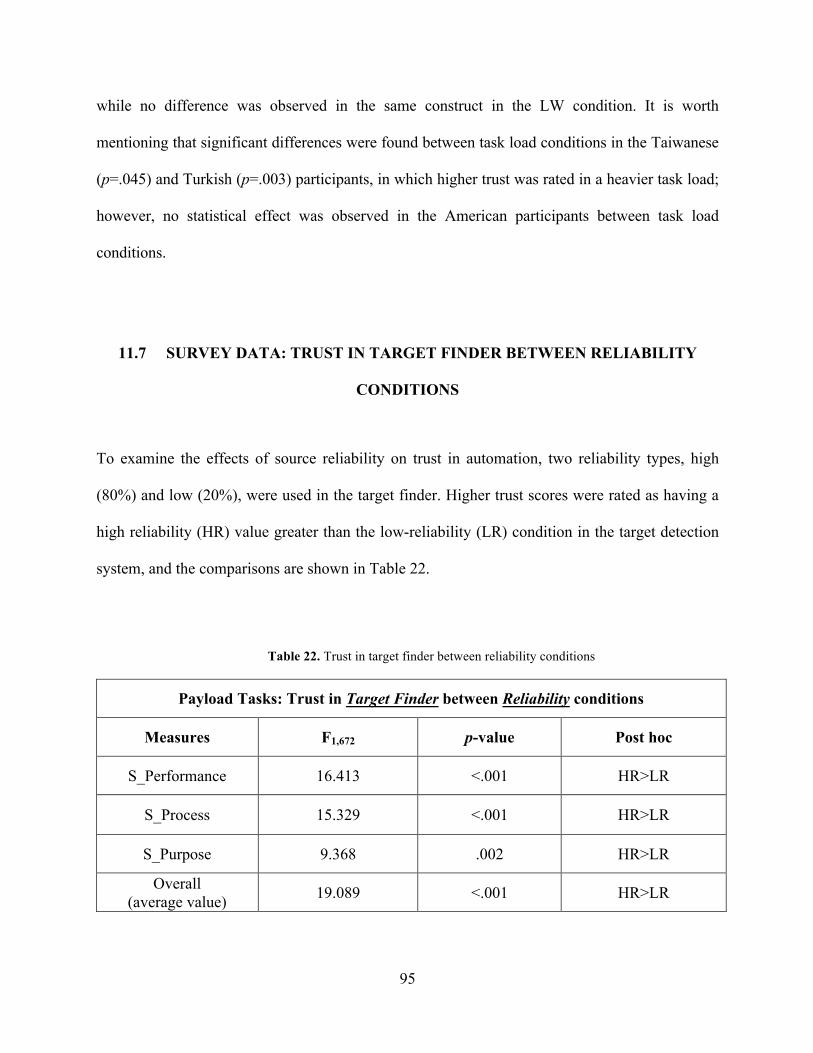
95
while no difference was observed in the same construct in the LW condition. It is worth
mentioning that significant differences were found between task load conditions in the Taiwanese
(p=.045) and Turkish (p=.003) participants, in which higher trust was rated in a heavier task load;
however, no statistical effect was observed in the American participants between task load
conditions.
11.7 SURVEY DATA: TRUST IN TARGET FINDER BETWEEN RELIABILITY
CONDITIONS
To examine the effects of source reliability on trust in automation, two reliability types, high
(80%) and low (20%), were used in the target finder. Higher trust scores were rated as having a
high reliability (HR) value greater than the low-reliability (LR) condition in the target detection
system, and the comparisons are shown in Table 22.
Table 22. Trust in target finder between reliability conditions
Payload Tasks: Trust in Target Finder between Reliability conditions
Measures F1,672 p-value Post hoc
S_Performance 16.413 <.001 HR>LR
S_Process 15.329 <.001 HR>LR
S_Purpose 9.368 .002 HR>LR
Overall (average value) 19.089 <.001 HR>LR

96
11.7.1 Survey data: cultural effects on trust in target finder between reliability conditions
Figure 14. Average trust scores in target finder between system reliability conditions. Performance, process, and
purpose constructs are represented by their proportions in each bar of the chart
Two levels of automation reliability were tested to investigate the relation between source
reliability and cultural contexts (Fig. 14). The analysis revealed significant differences between
the American and Turkish participants in both the HR (p=.001) and LR (p=.006) conditions, as
well as a significant difference between Taiwanese and Turkish participants in the HR condition
(p=.001). No statistical difference was observed between the American and Taiwanese
participants. The results suggested that an increase in system reliability contributed to higher trust
in autonomy. In general, participants from the American and Taiwanese cultures had similar
levels of overall trust in the target finder, regardless of the reliability conditions, and Turkish
participants again showed the least amount of trust in the automated aids.

97
11.8 SURVEY DATA: TRUST IN CONFLICT DETECTOR AMONG AUTO
TRANSPARENCY
A conflict detector was designed to assist operators in identifying possible path conflicts between
UAVs and to avoid hazardous areas by proposing alternative UAV paths. To determine how the
system’s overall transparency may affect the use of automation, three types of conflict detectors
were manipulated: path re-plan (PR), highlight (HL), and path re-plan with highlight (PRHL).
The ANOVA analysis revealed a main effect for country (F2,504=13.072, p<.001) and
automation transparency (F2,504=18.221, p<.001); however, no statistical difference was observed
between workload conditions. The American and Taiwanese participants reached similar overall
trust ratings in the conflict detector, and both overall ratings were significantly higher than those
of the Turkish participants (US>TK, p=.002; TW>TK, p<.001).
The trust ratings of the conflict detector in different levels of automation transparency are
included in Table 23, in which the highest trust was observed in the HL condition and the lowest
score was found in the PR condition, with PRHL in the middle. T-tests showed that both HL and
PRHL were significantly higher than the PR condition across all the comparisons. Little
difference was observed between the HL and PRHL conditions in both performance and process
constructs, and the effects were especially obvious in the purpose construct (HL>PRHL, p=.007).

98
Table 23. Trust in the conflict detector among automation transparency conditions
Navigation Tasks: Trust in Conflict Detector among Automation Transparency conditions
Measures F2,504 p-value Post hoc
S_Performance 14.019 <.001
HL>PR (p<.001)
PRHL>PR (p<.001)
HL≈PRHL (N.S.)
S_Process 8.674 <.001
HL>PR (p<.001)
PRHL>PR (p=.008)
HL≈PRHL (N.S.)
S_Purpose 20.415 <.001
HL>PR (p<.001)
PRHL>PR (p=.003)
HL>PRHL (p=.007)
Overall
(average value) 18.221 <.001
HL>PR (p<.001)
PRHL>PR (p<.001)
HL>PRHL (N.S.)

99
11.8.1 Survey data: cultural effects on trust in the conflict detector among auto
transparency conditions
Figure 15. Average trust scores in the conflict detector between auto transparency conditions. Performance, process,
and purpose constructs are represented by their proportions in each bar of the chart
Further analysis (Fig. 15) revealed significant cultural differences between the U.S. and Turkey
and Taiwan and Turkey in both the PR (p=.064 and p=.001, respectively) and PRHL conditions
(p=.002 and p=.001, respectively), while the trust rates in the American and Taiwanese
participants were consistently higher than in the Turkish participants; however, no statistical
difference was found in the HL condition between the three cultural groups.
Although similar levels of trust in the HL and PRHL conditions were found in the
American and Taiwanese participants, it is worth mentioning that the trust scores between HL and
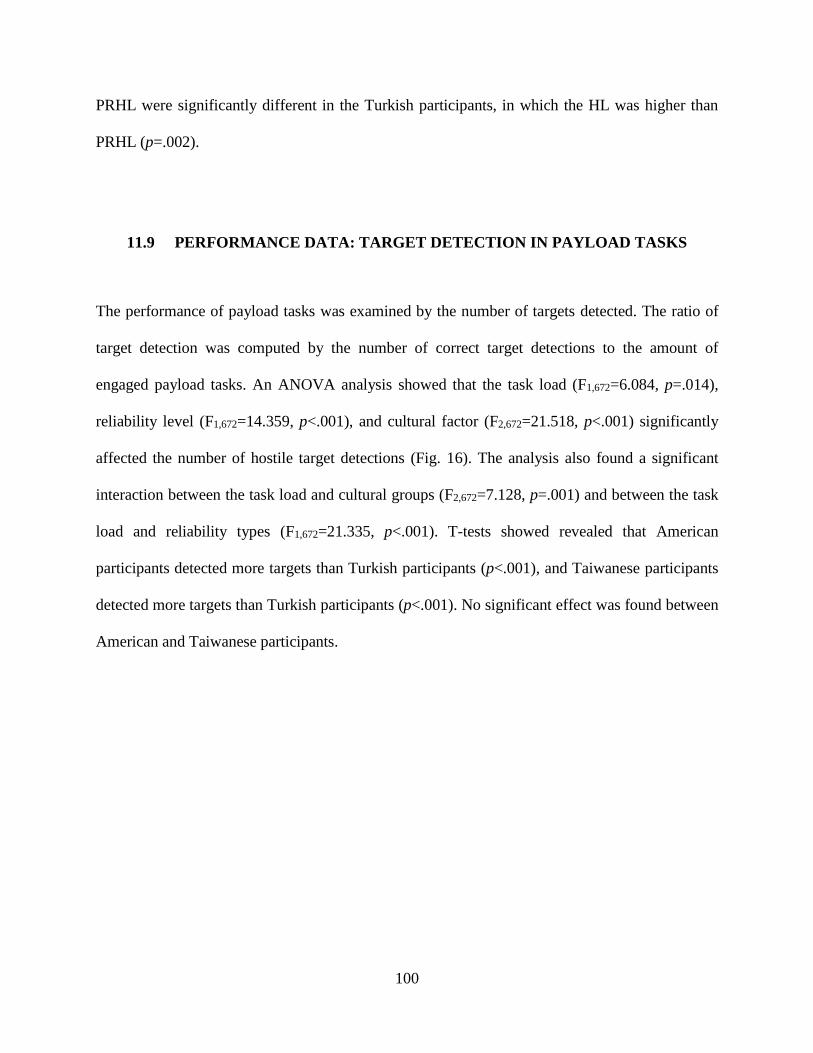
100
PRHL were significantly different in the Turkish participants, in which the HL was higher than
PRHL (p=.002).
11.9 PERFORMANCE DATA: TARGET DETECTION IN PAYLOAD TASKS
The performance of payload tasks was examined by the number of targets detected. The ratio of
target detection was computed by the number of correct target detections to the amount of
engaged payload tasks. An ANOVA analysis showed that the task load (F1,672=6.084, p=.014),
reliability level (F1,672=14.359, p<.001), and cultural factor (F2,672=21.518, p<.001) significantly
affected the number of hostile target detections (Fig. 16). The analysis also found a significant
interaction between the task load and cultural groups (F2,672=7.128, p=.001) and between the task
load and reliability types (F1,672=21.335, p<.001). T-tests showed revealed that American
participants detected more targets than Turkish participants (p<.001), and Taiwanese participants
detected more targets than Turkish participants (p<.001). No significant effect was found between
American and Taiwanese participants.

101
Figure 16. Ratio of correct target detection between workload and reliability conditions
To examine the effects of information uncertainty on performance in target detection
tasks, the results were categorized by the level of uncertainties (Fig. 17). The analysis revealed
significant cultural differences in non-alert (F2,672=8.699, p<.001), warning (F2,672=16.380,
p<.001), and alarm (F2,672=8.005, p<.001) conditions, as well as on the overall performance
(F2,672=21.518, p<.001).
Post-hoc results showed that American participants verified more targets than Taiwanese
(p=.001) and Turkish (p=.002) participants in the non-alert group; a similar number of targets
were detected by both American and Taiwanese participants in the rest of the conditions, which
were significantly greater than Turkish participants in both warning (US>TK, p<.001; TW>TK,
CorrectTarget_LW
CorrectTarget_HW
CorrectTarget_LR
CorrectTarget_HR
U.S. 0.83 0.81 0.80 0.84
Taiwan 0.78 0.82 0.79 0.81
Turkey 0.74 0.78 0.75 0.78
0.50
0.55
0.60
0.65
0.70
0.75
0.80
0.85
0.90
Co
rrec
t T
arg
ets/
En
ga
ged
Ta
rget
s
Ratio of Correct Target Detection b/t Worklaod and Reliability

102
p<.001) and alarm (US>TK, p<.001, TW>TK, p=.011) groups, as well as overall comparisons
(US>TK, p<.001; TW>TK, p<.001).
Figure 17. Ratio of correct target detection in different information uncertainty conditions
11.10 PERFORMANCE DATA: VEHICLE-VEHICLE AND VEHICLE-HAZARD
DAMAGES IN NAVIGATION TASKS
Preventing UAV path conflicts and avoiding threat areas are vital to multi-UAV tasks, in which a
failure to detect collisions might result from heavy task load or opaque system transparency. The
Non-alert Warning Alarm Overall
US 0.91 0.79 0.81 0.82
TW 0.86 0.77 0.79 0.80
TK 0.87 0.73 0.74 0.76
0.50
0.55
0.60
0.65
0.70
0.75
0.80
0.85
0.90
0.95
1.00
Corr
ect
Targ
ets/
En
gaged
Targ
ets
Ratio of Correct Target Detection in Different Info Uncertainty

103
ANOVA analysis for vehicle-vehicle (V-V) damage (i.e., path conflicts) found a main effect for
task loads (F1,672=8.288, p=.004), auto transparency (F3,672=15.925, p<.001), cultural variables
(F2,672=13.126, p<.001), and an interaction between task loads and auto transparency
(F3,672=3.214, p=.023), and is shown in Fig. 18. The results showed that an increasing task load
led to a higher level of V-V damages. The lowest level of V-V damage was found in the PRHL
approach, and not surprisingly, the highest level was found in the control condition, with no
difference between the PR and the HL groups. Post-hoc analysis observed higher level of V-V
damage with Turkish participants than with American (p<.001) and Taiwanese participants
(p<.001), and no difference was found between the American and Taiwanese participants. To
better measure the relationship between cultural factors and information transparency in
navigation tasks, data were categorized based on their transparency types. While no difference
was observed in the PRHL group, the analysis showed significant cultural differences in control
(F2,177=3.031, p=.051), PR (F2,177=6.860, p=.001), and HL (F2,177=4.821, p=.009) conditions in the
V-V damage levels, in which significantly higher damage was found with Turkish participants
than with American and Taiwanese participants in these three conditions.

104
Figure 18. Vehicle-to-vehicle damage levels between auto transparency conditions
The related measure of vehicle-hazard (V-H) damage (i.e., threat areas) revealed
significant differences in task load (F1,672=21.366, p<.001), auto transparency (F3,672=75.703,
p<.001), and country (F2,672=5.768, p=.003). Significant differences were also found for the
interactions between task loads and system transparency (F3,672=196.628, p<.001), as shown in
Fig. 19. Higher levels of V-H damage were found in the LW than in the HW conditions. The
lowest level of V-H damage was found in the control condition, while the highest values were
found in the HL approach, with higher levels of damage in the PRHL condition than in the PR
condition.
ControlPath Replan
(PR)Highlight
(HL)
Path Replan xHighlight(PRHL)
US 16.30 14.19 11.91 9.44
TW 16.39 12.46 13.03 8.88
TK 22.05 21.42 17.50 10.39
0.00
5.00
10.00
15.00
20.00
25.00D
am
ag
e L
evel
Vehicle-Vehicle Damage

105
Figure 19. Levels of vehicle-to-hazard damage between auto transparency conditions
11.11 BEHAVIORAL DATA: CHECKING BEHAVIORS IN PAYLOAD TASKS
While participants enjoyed the automated assistance (target finder) in payload tasks, before
accepting or rejecting the automated suggestions, the participants could verify the provided aids
by selecting “check” mode to see a picture with better resolution in order to further identify the
target’s existence and the accuracy of the provided recommendation. The results of these
checking behaviors are shown in Table 24. Post-hoc analysis found significant cultural differences
between American and Turkish participants (p=.018) and between Taiwanese and Turkish
participants (p<.001).
Table 24. Checking behaviors in payload tasks across experimental conditions
ControlPath Replan
(PR)Highlight
(HL)
Path Replan xHighlight(PRHL)
US 1.33 1.97 3.46 2.63
TW 1.35 2.17 3.80 2.72
TK 1.67 2.73 4.20 2.65
0.00
0.50
1.00
1.50
2.00
2.50
3.00
3.50
4.00
4.50
5.00
Da
ma
ge
Lev
el
Vehicle-Hazard Damage
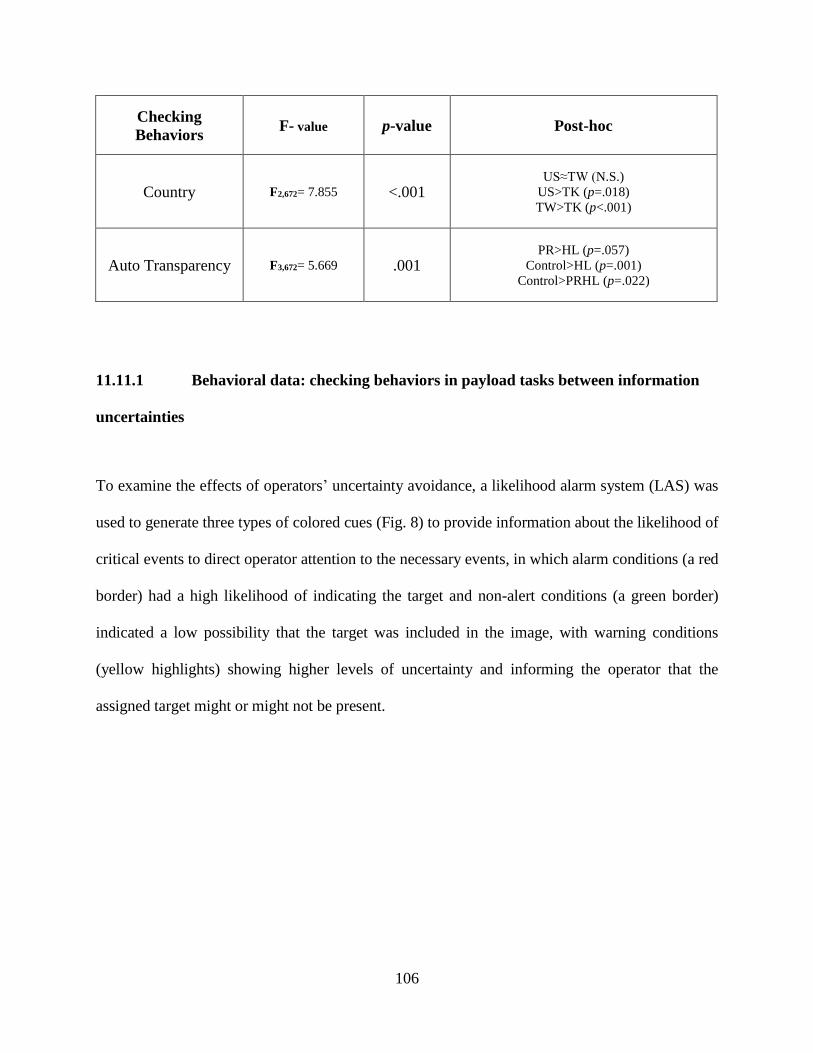
106
Checking
Behaviors F- value p-value Post-hoc
Country F2,672= 7.855 <.001 US≈TW (N.S.)
US>TK (p=.018)
TW>TK (p<.001)
Auto Transparency F3,672= 5.669 .001 PR>HL (p=.057)
Control>HL (p=.001)
Control>PRHL (p=.022)
11.11.1 Behavioral data: checking behaviors in payload tasks between information
uncertainties
To examine the effects of operators’ uncertainty avoidance, a likelihood alarm system (LAS) was
used to generate three types of colored cues (Fig. 8) to provide information about the likelihood of
critical events to direct operator attention to the necessary events, in which alarm conditions (a red
border) had a high likelihood of indicating the target and non-alert conditions (a green border)
indicated a low possibility that the target was included in the image, with warning conditions
(yellow highlights) showing higher levels of uncertainty and informing the operator that the
assigned target might or might not be present.

107
Figure 20. Checking behaviors in payload tasks between information uncertainty conditions
The ratio of checks was calculated by dividing the number of checks in each of the colored
cluster by the overall amount of checks. Statistical differences were found in the overall
comparison (F2,672=7.855, p<.001), as well as in three colored cue conditions (Red: F2,672=4.205,
p=.015; Green: F2,672=3.099, p=.046; Yellow: F2,672=9.141, p<.001), as shown in Fig. 20. The
results also indicated that the number of checks in the alarm condition (i.e., red border) were
significantly higher than in the warning condition (i.e., yellow highlights), p<.001, as well as the
non-alert (i.e., green highlights), p<.001, condition, and that the checking pattern in the warning
situation was higher than in the non-alert (p<.001) condition. Post-hoc analysis showed that the
American and Taiwanese participants had significantly higher checking behaviors than the
Turkish participants in both the (yellow) warning condition (US>TK, p=.003; TW>TK, p<.001)
and the overall conditions (US>TK, p=.018; TW>TK, p<.001). In addition, the Taiwanese
Overall Green Yellow Red
U.S. 0.48 0.32 0.50 0.59
Taiwan 0.51 0.33 0.52 0.65
Turkey 0.42 0.27 0.42 0.56
0.00
0.10
0.20
0.30
0.40
0.50
0.60
0.70
0.80R
ati
o o
f C
hec
ks
Checking Behaviors in Payload Tasks between Info Uncertainty

108
participants had more frequently checked patterns than Turkish participants in both the non-alert
(p=.065) and alarm conditions (p=.016).
11.11.2 Behavioral data: number of checks in payload tasks between reliability
conditions and information uncertainty
Source reliability may drastically influence operators’ checking behaviors. To examine the
possibility, we measured the number of checks between reliability types and the overall level of
information uncertainty. In the low-reliability condition, the ANOVA analysis showed no
significant cultural differences (Fig. 21); however, the T-test revealed a marginal difference
between the American and Turkish cultures in the (yellow color) warning condition (p=.071).
Figure 21. Checking behaviors in payload tasks under low reliability between information uncertainty conditions
Overall Green Yellow Red
U.S. 0.50 0.34 0.53 0.55
Taiwan 0.47 0.30 0.49 0.57
Turkey 0.43 0.27 0.44 0.54
0.00
0.10
0.20
0.30
0.40
0.50
0.60
0.70
Rati
o o
f C
hec
ks
Checking Behaviors in Payload Tasks Under Low Reliability
between Info Uncertainty

109
In the high-reliability condition, the ANOVA analysis (Fig. 22) showed a significant
cultural effect across all the comparisons (Red: F2,336=6.224, p=.002; Green: F2,336=2.627, p=.074;
Yellow: F2,336=10.393, p<.001; Overall: F2,336=9.730, p<.001). The results showed that Taiwanese
participants exhibited significant higher checking patterns than those of the other two cultures
(including overall checking behaviors as well as across three different levels of information
uncertainty), and that the fewest checking behaviors were observed in the Turkish participants,
with the American participants falling in between.
Figure 22. Checking behaviors in payload tasks between information uncertainty conditions
11.12 BEHAVIORAL DATA: RELIANCE IN PAYLOAD TASKS
Operators’ reliance behaviors in payload tasks were measured by the ratio of following behaviors
(namely, the number of accepted recommendations) to the total number of automated suggestions
made by the target finder. The analysis revealed a main effect on the task load (F1,672=33.965,
Overall Green Yellow Red
U.S. 0.47 0.30 0.48 0.62
Taiwan 0.55 0.36 0.55 0.72
Turkey 0.41 0.27 0.39 0.59
0.00
0.10
0.20
0.30
0.40
0.50
0.60
0.70
0.80
Rati
o o
f C
hec
ks
Checking Behaviors in Payload Tasks Under High Reliability
between Info Uncertainty

110
p<.001) and reliability (F1,672=2236.715, p<.001), in which operators followed significantly more
target aids in the LW condition than in the HW condition, as well as in the HR condition rather
than in the LR conditions (Fig. 23).
Appropriate levels of reliance are critical to human-automation interaction. To measure
the appropriate use of automation, the overall following behaviors were further categorized into
over-reliance, appropriate reliance, and under-reliance groups. Over-reliance was defined as when
the autonomy (target finder) provided a false alarm, but the operator believed that the
recommendation was correct and submitted a Hit decision; whereas under-reliance was defined as
an operator rejecting a correct suggestion and submitting a Safe decision. A higher ratio of
appropriate reliance represented the operators appropriately calibrating their trust in automation.
The results revealed substantial cultural effects on over-reliance (F2,672=11.015, p<.001),
appropriate reliance (F2,672=21.911, p<.001), and under-reliance (F2,672=16.806, p<.001)
comparisons. Higher over-reliance (TK>US, p<.001; TK>TW, p=.012) and under-reliance
(TK>US, p<.001; TK>TW, p<.001) behaviors were observed in Turkish participants. In addition,
both the American and Taiwanese participants exhibited better levels of reliance than the Turkish
participants (US>TK, p<.001; TW>TK, p<.001); however, no statistical difference was found
between American and Taiwanese participants.

111
Figure 23. Following and over-/appropriate/under-reliance behaviors in payload tasks
11.13 BEHAVIORAL DATA: RELIANCE IN NAVIGATION TASKS
An operator’s reliance on navigation tasks were determined by the ratio of accepted new paths
proposed by the conflict detector. Therefore, the analysis only included path re-plan (PR) and path
re-plan x highlight (PRHL) conditions (Fig. 24). The results showed a main effect on the task load
(HW>LW, F1,336=4.602, p=.033), reliability (LR>HR, F1,336=5.090, p=.025), auto transparency
(PRHL>PR, F1,336=32.384, p<.001), and country (F2,336=5.350, p=.005). Post-hoc analysis showed
that the Taiwanese participants had the highest reliance on the automated recommendations made
by the conflict detector in navigation tasks (TW>US, p=.089; TW>TK, p=.004), but that no
significant difference was observed between the American and Turkish participants.
Follow Over App Under
U.S. 0.66 0.12 0.82 0.06
Taiwan 0.67 0.14 0.80 0.06
Turkey 0.66 0.16 0.76 0.08
0.00
0.10
0.20
0.30
0.40
0.50
0.60
0.70
0.80
0.90
1.00R
ati
o o
f fo
llo
ws
an
d r
elia
nce
beh
av
iors
Overall following and reliance behaviors in payload
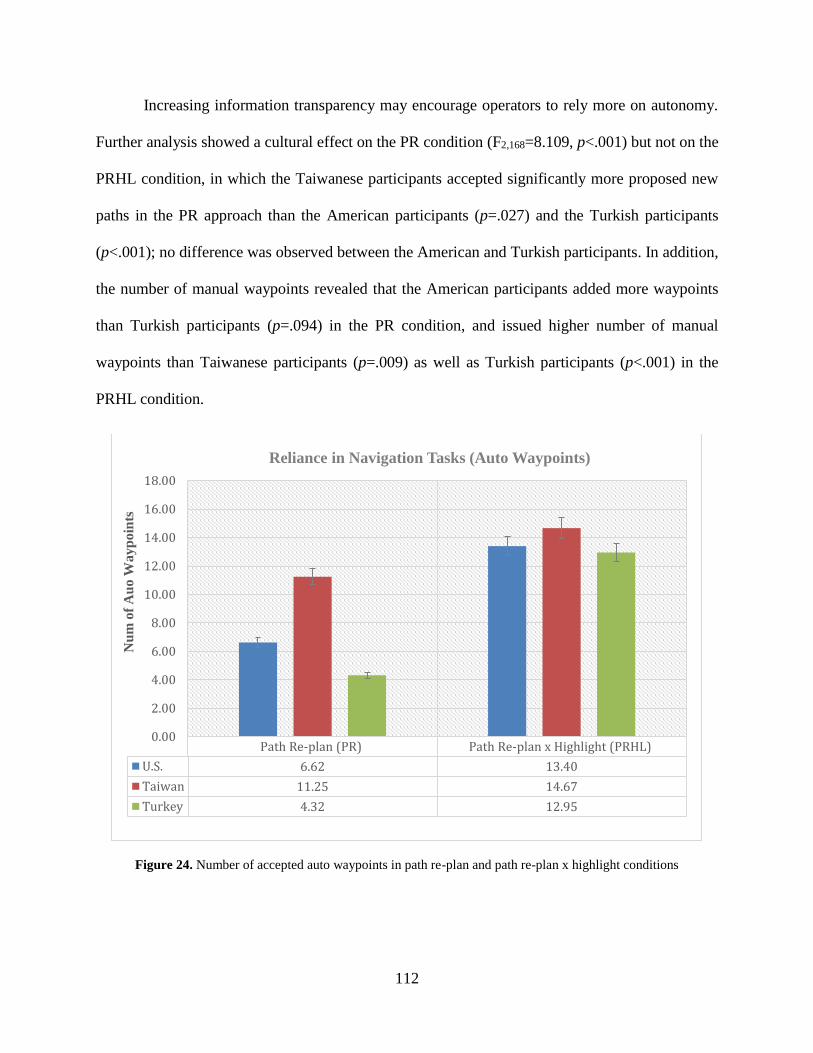
112
Increasing information transparency may encourage operators to rely more on autonomy.
Further analysis showed a cultural effect on the PR condition (F2,168=8.109, p<.001) but not on the
PRHL condition, in which the Taiwanese participants accepted significantly more proposed new
paths in the PR approach than the American participants (p=.027) and the Turkish participants
(p<.001); no difference was observed between the American and Turkish participants. In addition,
the number of manual waypoints revealed that the American participants added more waypoints
than Turkish participants (p=.094) in the PR condition, and issued higher number of manual
waypoints than Taiwanese participants (p=.009) as well as Turkish participants (p<.001) in the
PRHL condition.
Figure 24. Number of accepted auto waypoints in path re-plan and path re-plan x highlight conditions
Path Re-plan (PR) Path Re-plan x Highlight (PRHL)
U.S. 6.62 13.40
Taiwan 11.25 14.67
Turkey 4.32 12.95
0.00
2.00
4.00
6.00
8.00
10.00
12.00
14.00
16.00
18.00
Nu
m o
f A
uo W
ayp
oin
ts
Reliance in Navigation Tasks (Auto Waypoints)

113
11.14 BEHAVIORAL DATA: BEHAVIORS AFTER EXPERIENCING THE FIRST
FAILURE IN PAYLOAD TASKS
Prior research suggested that operators may stop using automation after a failure happens. To
measure this effect, we examined the resulting following and reliance behaviors in payload tasks
after an operator experiences their first automation failure (Fig. 25).
Figure 25. Following and reliance behaviors after experiencing the first auto failure in payload tasks
The ANOVA analysis found a marginal cultural effect in following behaviors
(F2,672=2.509, p=.082), and T-tests revealed that Taiwanese participants had significantly higher
following rates than the American participants (p=.082) after experiencing the first failure.
Significant cultural differences were observed in over-reliance (F2,672=7.113, p=.001) and
appropriate-reliance (F2,672=8.359, p<.001), in which Turkish participants had significantly higher
over-reliance (TK>US, p=.003; TK>TW, p=.004) and lower appropriate reliance (US>TK,
Follow Over App Under
U.S. 0.56 0.33 0.53 0.11
Taiwan 0.65 0.34 0.55 0.11
Turkey 0.62 0.45 0.39 0.15
0.00
0.10
0.20
0.30
0.40
0.50
0.60
0.70
0.80
Rati
o o
f fo
llow
an
d r
elia
nce
beh
av
ior
Behaviors after experiencing first auto failure in payload
114
p=.002; TW>TK, p=.001) than the American and Taiwanese participants. However, no difference
was observed in the under-reliance comparisons.
11.15 BEHAVIORAL DATA: BEHAVIORS AFTER EXPERIENCING FAILURES IN
PAYLOAD TASKS
To further investigate operators’ reliance on automation after automation failures, we examined
the overall following and reliance behaviors in the context of the payload tasks (Fig. 26).
Although no statistical cultural difference was found for the overall following rates after
experiencing system failures, significant cultural effects were found in appropriate reliance
(F2,672=8.272, p<.001) and under-reliance (F2,672=8.594, p<.001), while a marginal difference was
found in over-reliance (F2,672=2.795, p=.062). Post-hoc analysis showed that the Taiwanese
participants better calibrated their reliance than American and Turkish participants after system
failures (TW>US, p=.040; TW>TK, p<.001). T-tests also observed higher levels of under-reliance
between the Turkish participants and the other two cultures (TK>US, p=.001; TK>TW, p=.002).

115
Figure 26. Following and reliance behaviors after experiencing auto failures in payload tasks
Follow Over App Under
U.S. 0.66 0.20 0.71 0.07
Taiwan 0.68 0.16 0.76 0.07
Turkey 0.66 0.20 0.67 0.12
0.00
0.10
0.20
0.30
0.40
0.50
0.60
0.70
0.80
0.90R
ati
o o
f fo
llo
ws
an
d r
elia
nce
beh
av
iors Behaviors after experiencing auto failures in payload

116
12.0 DISCUSSION
The present study investigated the impact of cultural factors and personality traits on trust in
automation, in which theoretically guided experiments were conducted in the U.S., Taiwan and
Turkey, and 120 student participants were recruited in each of the countries (in total, 360
responses were collected). Participants’ trust attitudes were measured by our developed cultural
trust instrument (CTI), personality traits were categorized by big five inventory (BFI), cultural
values were identified by CVSCALE, and the resulting reliance was examined through
operators’ interactive behaviors in RESCHU, a multi-UAV air traffic control system, under
various experimental tasks and scenarios.
12.1 GENERAL TRUST
According to cultural syndromes, an individual from a dignity culture (e.g., America) has a
higher level of general trust, whereas an individual from an honor culture (e.g., Turkey) has a
lower level of initial trust. Our first hypothesis assumed that individuals from dignity cultures are
more likely to have higher levels of initial trust in automation than those from both honor and
face cultures. These cultural effects were confirmed, in which Turkish participants had the
lowest trust scores in general attitude toward automation and the American participants had the
highest initial trust scores in their general attitude toward automation, with those participants

117
from a face culture (namely, Taiwan) in between. The findings revealed that American
participants had the strongest faith in automated systems optimizing outcomes, whereas Turkish
participants held opposite views on the use of automation. Interestingly, it was observed that
Taiwanese participants had the highest trust ratings in the performance factor, but the lowest
ratings in the task context construct. This showed that an individual from a face culture may
believe that automation can significantly increase task performance, but that automation might
be unable to satisfy all needs in a variety of diverse situations.
12.2 EFFECTS OF PERSONALITY TRAITS AND CVSCALE
Evaluations of the inter-relational aspects of personality and general trust showed that an
individual with high trait of extraversion, agreeableness, or conscientiousness had increased trust
in automation, whereas an increased trait of neuroticism lessened the initial trust ratings.
CVSCALE was used to measure the cultural values along Hofstede’s cultural dimensions
at the individual level. The mismatch between Hofstede’s original data and our collected data
may be due to differences in an individual’s background, including age, education, and gender
differences (Chien, Semnani-azad, Lewis, & Sycara, 2014).
Since automation is increasingly being used in all aspects of our daily life (e.g.,
smartphones), this finding could significantly change beliefs about the use of automation. The
correlation analysis suggested that an individual will tend to rely on automated assistance when
uncertainty is increased, especially in American populations (Table 17, UA in the American
participants). As predicted by the cultural syndromes theory, as IDV increased, so did an initial
willingness to trust in automation (Table 17, IDV in the American participants).

118
12.3 EFFECTS OF TASK LOAD
Increasing task load demanded more cognitive resources and required the operators to allocate
more attention to the navigation tasks, which led to fewer resources being available for payload
tasks. Although increases in UAV travelling speeds directly affected operators’ perceived
workload in navigation tasks, the checking patterns in payload tasks were not influenced by the
differences in task load conditions (as shown in results section 11.11). In other words, the ratio
of checking behaviors remained the same between the HW and LW groups. Interestingly, the
task load conditions had little effect on the level of trust in the conflict detector, but largely
influenced the level of trust in the target detector, in which higher trust ratings in the target finder
was found in the high task load group. Research (Hoff & Bashir, 2015) concluded that (sub)tasks
can be influential, but that the effects largely depended on the degree of interference with the
task demand. For example, Phillips and Madhavan (2011) found the subtasks actually increased
trust in automated applications, whereas Lees and Lee (2007) concluded that the distracted
variable caused few effects on trust in their collision warning system.
This indirect relationship could have resulted because little attention was reserved for the
aided suggestions from the target finder, which may have caused the operators to fail to
scrutinize the correctness of automation estimations. However, as a similar checking ratio was
observed in both task load conditions, this was not the case for our data. While increased UAV
travelling speeds led to a higher number of target engagements as well as checking behaviors, the
additional interaction time that is required may facilitate human-automation collaboration
processes and contribute to better trust in automation. Since more enemy targets were found in
the HW condition, another potential cause for the higher degree of trust in heavy task-load
scenarios could be explained by the positive feedback. Research concludes that feedback greatly

119
altered the level of trust in intelligent systems (Hancock et al., 2011). The testbed system
RESCHU indicated the accumulated feedback from interaction, which provides an opportunity
for the operators to improve system performance, as well as calibrate trust. As an increased
number of targets are detected in HW, the provided feedback might greatly enhance an
operator’s trust in automated aids.
With respect to the task load differences, we hypothesized that (Hypothesis-12) operators
will accept more automated recommendations or exhibit fewer checking behaviors on
automation while perceiving high workload conditions. These effects have been partially
confirmed, in which increased task load contributed a higher reliance to the navigation tasks (as
shown in results section 11.13), but indicated a reversed result for the payload tasks (as shown in
results section 11.12). In other words, operators had strong reliance in the target finder in low
task-load situations. Both the American and Taiwanese participants had higher trust ratings in the
target finder than Turkish participants, regardless of workload conditions (as shown in results
section 11.6). In addition, both Taiwanese and Turkish participants had higher levels of trust in
the target finder in HW than in LW conditions, but this effect was not observed in American
participants. Recent studies suggested that face (e.g., Taiwan) and honor (e.g., Turkey) cultures
are closely related, which may provide an explanation for the non-significant difference (Aslani
et al., 2013; Aslani et al., 2016). Another potential reason may result from an insufficient amount
of increased task load. Since participants from dignity cultures achieved the best performance on
both payload and navigation tasks, the assigned task load conditions may fail to adequately
increase the workload for the American participants. Therefore, the changes to UAV speed failed
to exert similar influences on participants from dignity cultures, which led to little difference in
the trust ratings between task load conditions.

120
12.4 EFFECTS OF SOURCE RELIABILITY
With increased reliability, as expected, participants verified more hostile targets, as well as rated
higher trust scores in the automated aids (target finder), which suggests that the operators were
able to differentiate changes in the source reliability conditions. With respect to cultural
differences (as shown in results section 11.7), both American and Taiwanese participants reached
similar levels of overall trust in the target finder in both high reliability (HR) and low reliability
(LR) conditions, and the scores were much higher than those of Turkish participants across
reliability conditions. Therefore, our hypothesis, (Hypothesis-3) honor culture operators will
take longer interaction times than operators from dignity and face cultures to develop equal
degrees of trust, was confirmed.
As in (Hypothesis-7) the trust of face culture operators will be relatively more influenced by
information about the purpose of automation than honor or dignity culture operators, the
differences in system reliability may greatly affect the operators’ perceived purpose of
automation. However, this hypothesis was not supported, in which increased source reliability
failed to strengthen the Taiwanese participants’ trust attitudes in the designed purpose of
automation, rather than the other two cultures.
To validate the aided suggestions in payload tasks, participants were able to check the
pictures before accepting or rejecting the recommendations, in which the checking patterns could
fluctuate according to the source reliability. The most frequent checking pattern was observed in
the alarm condition and the lowest was in the non-alert condition, with the warning condition in
between, which suggests that information uncertainty greatly affected operators’ reliance and
resultant checking behaviors (as shown in results section 11.11). American and Taiwanese
participants had higher checking patterns than the Turkish participants, including the results of

121
overall checks, as well as in the warning conditions. Although the results showed little difference
on the number of checks between reliability types, distinguishable cultural effects were found in
the frequency of checking behaviors, in which American and Taiwanese participants were more
inclined to verify the pictures than Turkish participants. This finding partially confirmed
Hypothesis-13, honor and face culture operators will exhibit more vigilance and more
monitoring behavior than operators from dignity cultures. The results revealed that participants
from dignity (U.S.) and face (Taiwan) cultures were more vigilant and had higher monitoring
behaviors.
The observed checking patterns represented operators’ reliance on automation. American
operators detected an identical number of targets to Taiwanese operators with fewer checks,
which indicates that a higher number of checks might not necessarily guarantee better
performance in payload tasks. The results (as shown in section 11.12) also revealed that
American participants were significantly better in calibrating their trust in the target finder than
participants from the other two cultures, whereas higher over-reliance and under-reliance
behaviors were found in Turkish participants rather than in American and Taiwanese
participants. Based on the results of trust ratings and checking patterns, as compared with
Turkish participants, American and Taiwanese participants had higher levels of trust and a higher
number of checks, which indicated a positive relationship between these two factors, as a higher
number of checks contributes to a greater level of trust in automated assistance. The findings
revealed that participants developed trust in the provided automation through the checking
processes, which suggested that the motivation behind the checks was users’ suspicions of the
aided recommendations, rather than an inherent distrust of the autonomy itself.

122
As the effects of trust were observed, humans either switched away from autonomy or
ignored the aids when reliability dropped (Desai et al., 2012). While experiencing a payload task
failure, either from accepting an incorrect suggestion (over-reliance) or rejecting a correct aid
(under-reliance), Taiwanese participants tended to follow the next recommendations after the
first failure, while American participants had the lowest tendencies to accept the following
suggestions; however, no statistical difference was observed between Taiwanese and Turkish
participants or American and Turkish participants. This finding confirms Hypothesis-8,
unreliable automation will lower ratings of trust of operators from all cultures (both low- and
high-PD) operators, but face culture operators will be more likely to continue relying on
automation, and partially confirms Hypothesis-6, face culture operators will recover their trust
in automation after failure more quickly than honor and dignity culture operators. Honor culture
operators were generally slowest in recovering trust. The results concluded that participants from
face cultures relied on the automated suggestions when they first encountered a payload task
failure; in contrast, operators from dignity cultures followed their own decisions and went
against the aided information. Due to little experience with faulty automation, as well as placing
a low value on individualism, the (resulting) insufficient self-confidence guided face culture
operators to follow the provided aided information, instead of their own decisions. However, the
difference found between Taiwanese and Turkish cultures was not significant.
However, as a consequence of exposure to faulty automation, after gaining a fair amount
of experience on the unreliable automated system by committing payload task failures,
operators’ overall restored reliance showed little difference among the three cultures (as shown
in results section 11.15). The first assumption of Hypothesis-5, honor operators will either disuse
or take longer to regain trust after a failure occurs and may not recover trust to the original

123
level (miscalibrate), as compared with face and dignity operators. The dynamic relation between
use and trust may magnify these effects, was denied, in which the regaining trust patterns showed
negligible differences between these three cultures. However, a mixed phenomenon between
trust attitude and the use of automation was observed in Turkish participants, in which the level
of trust attitude failed to influence the reliance behaviors. This finding confirmed part of
Hypothesis-5, the dynamic relation between use and trust may magnify these effects.
12.5 EFFECTS OF AUTOMATION TRANSPARENCY
Research shows that information transparency greatly affected perceived difficulty in autonomy,
while increasing system transparency contributed to better trust in automation (Lyons et al.,
2016; Martelaro et al., 2016). Three types of conflict detectors were designed in our study to
support operators in identifying UAV path conflicts and avoiding threat areas. The path re-plan
(PR) condition, which proposed alternative paths with little SA, had the lowest trust scores,
while the highlight (HL) approach, which highlighted possible collisions on the map and
required the operators to manually add waypoints to solve hazardous situations, was rated as
having the highest level of trust, with the integrated method of path re-plan with highlight
(PRHL) reaching the middle level of trust. These results (as shown in section 11.8) greatly
suggested that increased automation transparency contributed to higher levels of trust in
autonomy.
With respect to system transparency, there should be little difference between the HL and
PRHL conditions. Trust ratings showed non-significant differences in these two conditions for
American and Taiwanese operators; however, Turkish participants had higher levels of trust in

124
the HL than in the PRHL condition. As the HL method included the human-automation shared
control mechanism, this type of interaction allowed operators to have a longer interaction time to
facilitate human-machine collaboration. Since participants from honor cultures generally have
lower levels of trust and require better knowledge of automation to develop trust, the shared
control interaction was especially beneficial to the participants from honor cultures. This finding
confirmed Hypothesis-11, Honor operators will require greater support of trust from knowledge
of process and/or purpose than dignity and face cultures, and will be prone to disuse. In
addition, the American and Taiwanese participants had similar levels of trust in the PR and
PRHL conditions, which were higher than those of the Turkish participants; however, no
difference was observed in the HL conditions across all participants. The results concluded that
allowing both operators and automation to play an active role and share responsibility for the
tasks could not only effectively enhance human trust, but could also reduce the cultural
differences in reliance behaviors.
The lowest level of vehicle-vehicle (V-V) damage was found in the PRHL approach (as
shown in section 11.10), and not surprisingly, the highest was found in the control condition,
with little difference between the PR and HL groups. If an operator strictly followed the
proposed new paths and applied them to the UAVs, there should be negligible variance between
the PR and PRHL conditions and they should, at least, should outperform the HL condition,
which provided no suggestions for new paths. However, the performance disparity again
emphasized the importance of automation transparency, which led to profound effects on
operators’ reliance behaviors.
A higher reliance on the conflict detector (i.e., an operator accepted more proposed new
paths) was observed in the PRHL condition, rather than in the PR condition (as shown in section

125
11.13). The results suggest that the American and Turkish participants were less likely to comply
with automation when little SA was available. With limited information about automation,
Taiwanese PR participants had higher reliance than either the American or Turkish participants.
This confirms Hypothesis-9, Face culture operators will trust and exhibit automation bias and
accept recommendations even if their basis is not well understood, while dignity and honor
culture operators will be less likely to trust or accept recommendations on this basis. However,
the cultural effect was not found in the PRHL group, which leads to an opposite view on
Hypothesis-10, Dignity and honor culture operators will be less likely to comply with high LOA
than face culture operators, who, as a result, will be more likely to exhibit complacency and
automation bias. There will be no difference in the use of low LOA. The results of trust ratings
and reliance patterns showed that the Taiwanese participants had the highest reliance behaviors,
with similar trust scores as American participants. This joint finding confirmed Hypothesis-2, if
using automation was encouraged by the user’s organization, face culture operators will have
higher ratings of trust and reliance than those from honor and dignity cultures.
Prior studies suggested that when self-confidence was higher than trust in automation,
manual commands would be used to control the system (Moray et al., 2000). Although a similar
amount of proposed new paths was adopted across three cultures in the PRHL condition, the
number of manual waypoints in the navigation tasks revealed that American participants issued
more waypoints than the participants from the other two cultures. The result partially confirmed
Hypothesis-4, operators from dignity and honor cultures will be more self-confident and
therefore are less likely to rely on or ignore the automation than face culture operators.
Operators from dignity cultures exhibited more self-confidence (as shown by a higher number of

126
manual waypoints) than those from face and honor cultures; however, the reliance on automation
remained the same across three cultures, rather than ignoring the recommended paths.

127
13.0 CONCLUSIONS
Trust is conceived as an intervening variable between user intention and actions that involve
reliance on automation. To improve human-automation interaction, there is a need to study
factors that would aid in determining how users from different cultures will adopt and use
technology. The overall goal of this research is to study both theoretically and empirically the
effect of cultural and individual contexts on trust antecedents, trust establishment, trust
dissolution after the occurrence of faults, and trust restoration in human interaction with
automation. To examine how trust mediates human-automation relationships across cultures, we
developed a cross-cultural trust instrument to examine trust factors as well as its antecedents, and
conducted theoretically guided large sample empirical studies in the U.S., Taiwan, and Turkey to
identify the influence of cultural dynamics in various aspects of trust in automation.
This work provides several significant contributions. First, the developed trust sensitivity
task, which incorporates a variety of task types and scenarios identified from the review of trust
in automation literature, allows researchers to effectively examine the variances of trust in
automation and determine whether these effects are universal or specific to a specific culture.
Second, the developed instrument provides a reliable measure to examine trust in automation
across cultures. Third, the studies (cultural trust instrument) investigated not only the effect of
system performance, as with most studies in the literature on trust in automation, but also the
process and task context. Fourth, this is the first set of studies that examine cultural factors based

128
on the characteristics of the three major cultural syndromes, along with Hofstede’s cultural
dimensions. Fifth, to the best of our knowledge, our experiments are the first to study the
dynamics of trust in automation across cultures. These contributions provide critical implications
and insights for enhancing human trust in intelligent automation systems across cultures.

129
14.0 BIBLIOGRAPHY
Adams, B., & Webb, R. (2002). Trust in small military teams. In 7th International Command
and Control Technology Symposium.
Aslani, S., Ramirez-Marin, J., Brett, J., Yao, J., Semnani-Azad, Z., Zhang, Z.-X., …Adair, W.
(2016). Dignity, face, and honor cultures: A study of negotiation strategy and outcomes in
three cultures. Journal of Organizational Behavior, 37(8), 1178–1201.
http://doi.org/10.1002/job.2095
Aslani, S., Ramirez-Marin, J., Semnani-Azad, Z., Brett, J. M., & Tinsley, C. (2013). Dignity
Face and Honor cultures implications for negotiation and conflict management.
Asparouhov, T., Muthén, B., & Morin, A. J. S. (2015). Bayesian Structural Equation Modeling
With Cross-Loadings and Residual Covariances: Comments on Stromeyer et al. . Journal of
Management , 41(6), 1561–1577. http://doi.org/10.1177/0149206315591075
Bagheri, N., & Jamieson, G. A. (2004). Considering subjective trust and monitoring behavior in
assessing automation-induced “complacency.” Human Performance, Situation Awareness
and Automation: Current Research and Trends, Vol 2, (1993), 54–59.
Bahner, J. E., Hüper, A. D., & Manzey, D. (2008). Misuse of automated decision aids:
Complacency, automation bias and the impact of training experience. International Journal
of Human Computer Studies, 66(9), 688–699. http://doi.org/10.1016/j.ijhcs.2008.06.001
Bailey, N. R. (2004). The effects of operator trust, complacency potential, and task complexity
on monitoring a highly reliable automated system.
Bentler, P. M., & Chou, C. P. (1987). Practical issues in structural modeling. Sociological
Methods and Research. http://doi.org/10.1177/0049124187016001004
Bohnet, I., Herrmann, B., & Zeckhauser, R. (2009). The Requirements for Trust in Gulf and
Western Countries. Quarterly Journal of Economics, 2005. Retrieved from
http://www.hks.harvard.edu/fs/ibohnet/researchpdf/Final.QJE.2.19.08.pdf
Bohnet, I., & Zeckhauser, R. (2004). Trust, risk and betrayal. Journal of Economic Behavior &

130
Organization, 55(4), 467–484. http://doi.org/10.1016/j.jebo.2003.11.004
Boudreau, M.-C., Gefen, D., & Straub, D. W. (2001). Validation in Information Systems
Research: a State-of-the-Art Assessment. MIS Quarterly, 25(1), 1–16.
http://doi.org/10.2307/3250956
Boussemart, Y., & Cummings, M. (2008). Behavioral recognition and prediction of an operator
supervising multiple heterogeneous unmanned vehicles. Humans Operating Unmanned ….
Chen, J. (2009). Concurrent performance of military tasks and robotics tasks: Effects of
automation unreliability and individual differences. Proceedings of the 4th ACM/IEEE
International HRI, 181–188. Retrieved from http://dl.acm.org/citation.cfm?id=1514128
Chen, J. Y. C., Barnes, M. J., & Kenny, C. (2011). Effects of Unreliable Automation and
Individual Differences on Supervisory Control of Multiple Ground Robots. In Human robot
interaction (HRI) (pp. 371–378). ACM.
Chen, J. Y. C., Procci, K., Boyce, M., Wright, J., Garcia, A., & Barnes, M. J. (2014). Situation
Awareness – Based Agent Transparency, (April), 1–29.
Cheung, G. W., & Rensvold, R. B. (2002). Evaluating Goodness-of-Fit Indexes for Testing
Measurement Invariance. Structural Equation Modeling: A Multidisciplinary Journal, 9(2),
233–255. http://doi.org/10.1207/S15328007SEM0902_5
Chien, S., Semnani-azad, Z., Lewis, M., & Sycara, K. (2014). Towards the Development of an
Inter-cultural Scale (pp. 35–46). Springer International Publishing.
Chien, S. Y., Mehrotra, S., Lewis, M., & Sycara, K. (2013). Imperfect Automation in Scheduling
Operator Attention on Control of Multi-Robots. In Proceedings of the Human Factors and
Ergonomics Society Annual Meeting.
Chua, H. F., Boland, J. E., & Nisbett, R. E. (2005). Cultural variation in eye movements during
scene perception. Proceedings of the National Academy of Sciences of the United States of
America, 102(35), 12629–12633. http://doi.org/10.1073/pnas.0506162102
Clare, A. S., Maere, P. C. P., & Cummings, M. L. (2012). Assessing operator strategies for real-
time replanning of multiple unmanned vehicles. Intelligent Decision Technologies, 6(3),
221–231. http://doi.org/10.3233/IDT-2012-0138
Cramer, H., Evers, V., Ramlal, S., Someren, M., Rutledge, L., Stash, N., & Wielinga, B. (2008).
The effects of transparency on trust in and acceptance of a content-based art recommender.
User Modeling and User-Adapted Interaction (Vol. 18). http://doi.org/10.1007/s11257-008-
9051-3
Dabholkar, P. A. (1996). Consumer evaluations of new technology-based self-service options:
An investigation of alternative models of service quality. International Journal of Research
in Marketing, 13(1), 29–51. http://doi.org/10.1016/0167-8116(95)00027-5

131
Davis, F., Bagozzi, R., & Warshaw, P. (1989). User acceptance of computer technology: a
comparison of two theoretical models. Management Science, 35(8), 982–1003.
Desai, M., Medvedev, M., Vázquez, M., McSheehy, S., Gadea-Omelchenko, S., Bruggeman, C.,
& Yanco, H. (2012). Effects of changing reliability on trust of robot systems. Proceedings
of the Seventh Annual ACM/IEEE International Conference on Human-Robot Interaction -
HRI ’12, 73. http://doi.org/10.1145/2157689.2157702
Dirks, K., Lewicki, R., & Zaheer, A. (2009). Reparing Relationships Within and Between
Organizations: Building A Conceptual Foundation. Academy of Management Review, 34(1),
68–84. Retrieved from http://amr.aom.org/content/34/1/68.short
Dixon, S. R., & Wickens, C. D. (2006). Automation reliability in unmanned aerial vehicle
control: a reliance-compliance model of automation dependence in high workload. Human
Factors, 48(3), 474–486. http://doi.org/10.1518/001872006778606822
Dixon, S. R., Wickens, C. D., & McCarley, J. S. (2007). On the independence of compliance and
reliance: are automation false alarms worse than misses? Human Factors, 49(4), 564–572.
Retrieved from http://hfs.sagepub.com/cgi/doi/10.1518/001872007X215656
Donmez, B., Boyle, L. N., Lee, J. D., & McGehee, D.V. (2006). Drivers’ attitudes toward
imperfect distraction mitigation strategies. Transportation Research Part F: Traffic
Psychology and Behaviour, 9(6), 387–398. http://doi.org/10.1016/j.trf.2006.02.001
Driscoll, J. W. (1978). Trust and Participation in Organizational Decision Making as Predictors
of Satisfactiont. Academy of Management Journal, 21(1), 44–56.
http://doi.org/10.2307/255661
Dzindolet, M. T., Pierce, L. G., Beck, H. P., & Dawe, L. a. (2002). The Perceived Utility of
Human and Automated Aids in a Visual Detection Task. Human Factors: The Journal of
the Human Factors and Ergonomics Society, 44(1), 79–94.
http://doi.org/10.1518/0018720024494856
Fulmer, C. A., & Gelfand, M. J. (2010). Dynamic Trust Processes: Trust Dissolution and
Restoration, 1–32.
Funk, K., Lyall, B., Wilson, J., Vint, R., Niemczyk, M., Suroteguh, C., & Owen, G. (1999).
Flight Deck Automation. The International Journal of Aviation Psychology, 109–123.
Retrieved from http://www.tandfonline.com/doi/abs/10.1207/s15327108ijap0902_2
Goddard, K., Roudsari, A., & Wyatt, J. C. (2012). Automation bias: a systematic review of
frequency, effect mediators, and mitigators. Journal of the American Medical Informatics
Association, 19(1), 121–127. http://doi.org/10.1136/amiajnl-2011-000089
Goillau, P., &Kelly, C. (2003). Guidelines for trust in future ATM systems: Measures. 0
Gunia, B. C., Brett, J. M., Nandkeolyar, A. K., & Kamdar, D. (2011). Paying a price: culture,
trust, and negotiation consequences. The Journal of Applied Psychology, 96(4), 774–89.

132
http://doi.org/10.1037/a0021986
Halpert, A., Horvath, A., Preston, F., Somerville, K., & Semnani-azad, Z. (2008). Technological
Adoptiveness Scale (TAS): Internal Properties and Construct Validity.
Hancock, P. A., Billings, D. R., Schaefer, K. E., Chen, J. Y. C., deVisser, E. J., &Parasuraman,
R. (2011). A Meta-Analysis of Factors Affecting Trust in Human-Robot Interaction. Human
Factors: The Journal of the Human Factors and Ergonomics Society, 53(5), 517–527.
http://doi.org/10.1177/0018720811417254
Hart, S. G., & Staveland, L. E. (1988). Development of NASA-TLX (Task Load Index): Results
of empirical and theoretical research. In P. A.Hancock &N.Meshkati (Eds.),Human Mental
Workload (Vol. 1, pp. 139–183). North-Holland. http://doi.org/10.1016/S0166-
4115(08)62386-9
Hinkin, T. R. (1995). A Review of Scale Development Practices in the Study of Organizations.
Journal of Management, 21(5), 967–988. http://doi.org/10.1177/014920639502100509
Hoff, K. A., & Bashir, M. (2015). Trust in Automation: Integrating Empirical Evidence on
Factors That Influence Trust . Human Factors: The Journal of the Human Factors and
Ergonomics Society , 57(3), 407–434. http://doi.org/10.1177/0018720814547570
Hofstede. (1991). Cultures And Organizations - Software of the Mind. Development, 1–29.
Retrieved from http://westwood.wikispaces.com/file/view/Hofstede.pdf
House, R., Hanges, P., & Javidan, M. (2004). Culture, leadership, and organizations. Retrieved
from http://www.ulb.tu-darmstadt.de/tocs/188761179.pdf
Hwang, Y., & Lee, K. C. (2012). Investigating the moderating role of uncertainty avoidance
cultural values on multidimensional online trust. Information & Management, 49(3–4),
171–176. http://doi.org/10.1016/j.im.2012.02.003
Im, I., Hong, S., & Kang, M. S. (2011). An international comparison of technology adoption.
Information & Management, 48(1), 1–8. http://doi.org/10.1016/j.im.2010.09.001
Inagaki, T. (2003). Adaptive Automation : Sharing and Trading of control. In E.Hollnagel
(Ed.),Handbook of Cognitive Task Design (pp. 147–169).
Jian, J., Bisantz, A., & Drury, C. (2000). Foundations for an empirically determined scale of trust
in automated systems. International Journal of Cognitive …, (April 1996). Retrieved from
http://www.tandfonline.com/doi/abs/10.1207/S15327566IJCE0401_04
Jones, G. R., & George, J. M. (1998). The Experience and Evolution of Trust: Implications for
Cooperation and Teamwork. The Academy of Management Review, 23(3), 531.
http://doi.org/10.2307/259293
Kaniarasu, P., & Steinfeld, A. (2012). Potential Measures for Detecting Trust Changes.
Robotics.cs.uml.edu, 5–6. Retrieved from

133
http://robotics.cs.uml.edu/fileadmin/content/publications/2012/hri182-kaniarasu.pdf
Kim, D. J., Ferrin, D. L., & Rao, H. R. (2008). A trust-based consumer decision-making model
in electronic commerce: The role of trust, perceived risk, and their antecedents. Decision
Support Systems, 44(2), 544–564. http://doi.org/10.1016/j.dss.2007.07.001
Kuo, L.-Y. (2011). An Investigation of Customers ’ Perceptions in Taiwan Online Group-buying
Market Declaration of Academic Integrity. University of Leeds.
Lee, I., Choi, B., Kim, J., &Hong, S. (2007). Culture-technology fit: effects of cultural
characteristics on the post-adoption beliefs of mobile internet users. International Journal of
Electronic …, 11(4), 11–51. http://doi.org/10.2753/JEC1086-4415110401
Lee, J., & Moray, N. (1992). Trust, control strategies and allocation of function in human-
machine systems. Ergonomics, 35(10), 1243–1270. Retrieved from
http://www.tandfonline.com/doi/abs/10.1080/00140139208967392
Lee, J., & See, K. (2004). Trust in automation: designing for appropriate reliance. Human
Factors, 46(1), 50–80.
Lees, M. N., & Lee, J. D. (2007). The influence of distraction and driving context on driver
response to imperfect collision warning systems. Ergonomics, 50(January 2015), 1264–
1286. http://doi.org/10.1080/00140130701318749
Leung, A. K. Y., & Cohen, D. (2011). Within-and between-culture variation: Individual
differences and the cultural logics of honor, face, and dignity cultures. Journal of
Personality and Social Psychology, 100(3), 507–526.
Leung, D. Y., Wong, E. M., Chan, S. S., & Lam, T. (2012). Psychometric properties of the Big
Five Inventory in a Chinese sample of smokers receiving cessation treatment: A validation
study. Journal of Nursing Education and Practice, 3(6), 1–10.
http://doi.org/10.5430/jnep.v3n6p1
Lewandowsky, S., Mundy, M., & Tan, G. P. (2000). The dynamics of trust: comparing humans
to automation. Journal of Experimental Psychology. Applied, 6(2), 104–23. Retrieved from
http://www.ncbi.nlm.nih.gov/pubmed/10937315
Lewis, J., & Weigert, A. (1985). Trust as a social reality. Social Forces, 63(4), 967–985.
Retrieved from http://sf.oxfordjournals.org/content/63/4/967.short
Lewis, M. (1998). Designing for human-agent interaction. AI Magazine. Retrieved from
http://www.aaai.org/ojs/index.php/aimagazine/article/viewArticle/1369
Li, D., Rau, P. L., & Li, Y. (2010). A Cross-cultural Study: Effect of Robot Appearance and
Task. International Journal of Social Robotics, 2(2), 175–186.
http://doi.org/10.1007/s12369-010-0056-9
Li, H., Rau, P.-L., Salvendy, G., Chen, C., Huebner, D., &Frey, D. (2014). Effects of

134
communication styles on acceptance of recommendations in intercultural collaboration.
Journal of International Business and Cultural Studies, 9(9), 1–19. Retrieved from
http://www.aabri.com/copyright.html.
Limayem, M., Khalifa, M., & Frini, A. (2000). What makes consumers buy from Internet? A
longitudinal study of online shopping. Systems, Man and Cybernetics, …, 30(4), 421–432.
http://doi.org/10.1109/3468.852436
Luz, M. (2009). Validation of a Trust survey on example of MTCD in real time simulation with
Irish controllers.
Lyons, J. B., Koltai, K. S., Ho, N. T., Johnson, W. B., Smith, D. E., & Shively, R. J. (2016).
Engineering Trust in Complex Automated Systems. Ergonomics in Design, (January), 13–
17. http://doi.org/10.1177/1064804615611272
Lyons, J. B., & Stokes, C. K. (2012). Human-Human Reliance in the Context of Automation.
Human Factors The Journal of the Human Factors and Ergonomics Society, 54(1), 112–
121. http://doi.org/10.1177/0018720811427034
Lyons, J., Stokes, C. K., Eschleman, K. J., Alarcon, G. M., & Barelka, a. J. (2011).
Trustworthiness and IT Suspicion: An Evaluation of the Nomological Network. Human
Factors: The Journal of the Human Factors and Ergonomics Society, 53(3), 219–229.
http://doi.org/10.1177/0018720811406726
Madsen, M., & Gregor, S. (2000). Measuring human-computer trust. 11th Australasian
Conference on Information Systems, 53, 6–8. Retrieved from
http://citeseerx.ist.psu.edu/viewdoc/summary?doi=10.1.1.93.3874
Manzey, D., Reichenbach, J., & Onnasch, L. (2008). Performance consequences of automated
aids in supervisory control: The impact of function allocation. 52nd Human Factors and
Ergonomics Society Annual Meeting, HFES 2008, September 22, 2008 - September 26,
2008, 1, 297–301. http://doi.org/10.1177/154193120805200421
Martelaro, N., Nneji, V. C., Ju, W., & Hinds, P. (2016). Tell me more: Designing HRI to
encourage more trust, disclosure, and companionship. ACM/IEEE International Conference
on Human-Robot Interaction, 2016–April, 181–188.
http://doi.org/10.1109/HRI.2016.7451750
Mayer, R. C., & Davis, J. H. (1999). The effect of the performance appraisal system on trust for
management: A field quasi-experiment. Journal of Applied Psychology, 84(1), 123–136.
Retrieved from http://www.apa.org
Mayer, R. C., Davis, J. H., & Schoorman, F. D. (1995). An integrative model of organizational
trust. Academy of Management Review, 20(3), 709–734.
McFadden, S. M., Vimalachandran, A., & Blackmore, E. (2004). Factors affecting performance
on a target monitoring task employing an automatic tracker. Ergonomics, 47(November),
257–280. http://doi.org/10.1080/00140130310001629748

135
Mcknight, D., & Carter, M. (2011). Trust in a specific technology: An investigation of its
components and measures. ACM Transactions on Management Information Systems, 2(2).
http://doi.org/10.1145/1985347.1985353
McKnight, D. H., Choudhury, V., & Kacmar, C. (2002). Developing and Validating Trust
Measures for e-Commerce: An Integrative Typology. Information Systems Research, 13(3),
334–359. http://doi.org/10.1287/isre.13.3.334.81
Mercado, J. E., Rupp, M. a., Chen, J. Y. C., Barnes, M. J., Barber, D., & Procci, K. (2016).
Intelligent Agent Transparency in Human-Agent Teaming for Multi-UxV Management.
Human Factors: The Journal of the Human Factors and Ergonomics Society.
http://doi.org/10.1177/0018720815621206
Merritt, S., & Ilgen, D. (2008). Not All Trust Is Created Equal: Dispositional and History-Based
Trust in Human-Automation Interactions. Human Factors: The Journal of the Human
Factors and Ergonomics Society, 50(2), 194–210.
http://doi.org/10.1518/001872008X288574
Meyer, J. (2004). Conceptual issues in the study of dynamic hazard warnings. Human Factors,
46(2), 196–204. Retrieved from http://www.ncbi.nlm.nih.gov/pubmed/15359670
Milfont, T. L., Duckitt, J., & Wagner, C. (2010). A Cross-Cultural Test of the Value-Attitude-
Behavior Hierarchy. Journal of Applied Social Psychology, 40(11), 2791–2813.
http://doi.org/10.1111/j.1559-1816.2010.00681.x
Miller, J. E., & Perkins, L. (2010). Development of Metrics for Trust in Automation. Human
Performance.
Moray, N., & Inagaki, T. (1999). Laboratory studies of trust between humans and machines in
automated systems. Transactions of the Institute of Measurement and Control, 21(4–5),
203–211. http://doi.org/10.1177/014233129902100408
Moray, N., Inagaki, T., & Itoh, M. (2000). Adaptive Automation , Trust , and Self-Confidence in
Fault Management of Time-Critical Tasks. Experimental Psychology: Applieed, 6(1), 44–
58.
Muir, B. (1994). Trust in automation: Part I. Theoretical issues in the study of trust and human
intervention in automated systems. Ergonomics, 37(11), 1905–1922.
http://doi.org/10.1080/00140139408964957
Muir, B., & Moray, N. (1996). Trust in automation. Part II. Experimental studies of trust and
human intervention in a process control simulation. Ergonomics, 39(3), 429–460. Retrieved
from http://www.tandfonline.com/doi/abs/10.1080/00140139608964474
Nisbett, J., & Cohen, D. (1997). Culture of Honor The Psychology of Violence in the South.
Southern Cultures, 3(1), 80–83. http://doi.org/10.1353/scu.1997.0033
Nishishiba, M., & Ritchie, L. (2000). The concept of trustworthiness: A cross‐cultural

136
comparison between Japanese and US business people. Journal of Applied Communication
Research, 28(4), 347–367. http://doi.org/10.1080/00909880009365581
Nocera, F.Di, Lorenz, B., & Parasuraman, R. (2005). Consequences of shifting from one level of
automation to another : main effects and their stability. Human Factors, 363–376.
Parasuraman, R., & Manzey, D. H. (2010). Complacency and Bias in Human Use of
Automation: An Attentional Integration. Human Factors: The Journal of the Human
Factors and Ergonomics Society, 52(3), 381–410.
http://doi.org/10.1177/0018720810376055
Parasuraman, R., & Riley, V. (1997, June 1). Humans and Automation: Use, Misuse, Disuse,
Abuse. Human Factors: The Journal of the Human Factors and Ergonomics Society.
http://doi.org/10.1518/001872097778543886
Phillips, R., & Madhavan, P. (2013). The Role of Affective Valence and Task Uncertainty in
Human-Automation Interaction. Proceedings of the Human Factors and Ergonomics
Society Annual Meeting, 57(1), 354–358. http://doi.org/10.1177/1541931213571077
Phillips, R. R., & Madhavan, P. (2011). The effect of distractor modality and processing code on
human-automation interaction. Cognition, Technology and Work, 13(4), 233–244.
http://doi.org/10.1007/s10111-010-0163-2
Rajaonah, B., Tricot, N., Anceaux, F., & Millot, P. (2008). The role of intervening variables in
driver-ACC cooperation. International Journal of Human Computer Studies, 66(3), 185–
197. http://doi.org/10.1016/j.ijhcs.2007.09.002
Rau, P. L., Li, Y., & Li, D. (2009). Effects of communication style and culture on ability to
accept recommendations from robots. Computers in Human Behavior, 25(2), 587–595.
http://doi.org/10.1016/j.chb.2008.12.025
Reagan, I. J., & Bliss, J. P. (2013). Perceived mental workload, trust, and acceptance resulting
from exposure to advisory and incentive based intelligent speed adaptation systems.
Transportation Research Part F: Traffic Psychology and Behaviour, 21, 14–29.
http://doi.org/10.1016/j.trf.2013.07.005
Rovira, E., McGarry, K., & Parasuraman, R. (2007). Effects of imperfect automation on decision
making in a simulated command and control task. Human Factors, 49(1), 76–87. Retrieved
from http://www.ncbi.nlm.nih.gov/pubmed/17315845
Rovira, E., & Parasuraman, R. (2010). Transitioning to Future Air Traffic Management: Effects
of Imperfect Automation on Controller Attention and Performance. Human Factors: The
Journal of the Human Factors and Ergonomics Society, 52(3), 411–425.
http://doi.org/10.1177/0018720810375692
Ruff, H. A., Narayanan, S., & Draper, M. H. (2002). Human interaction with levels of
automation and decision-aid fidelity in the supervisory control of multiple simulation
unmanned air vehicles. Presence, 11(4), 335–351.

137
Salem, M., Lakatos, G., Amirabdollahian, F., & Dautenhahn, K. (2015). Would You Trust a
(Faulty) Robot?: Effects of Error, Task Type and Personality on Human-Robot Cooperation
and Trust. Proceedings of the Tenth Annual ACM/IEEE International Conference on
Human-Robot Interaction, 141–148. http://doi.org/10.1145/2696454.2696497
Schwartz, S. (1992). Universals in the content and structure of values: Theoretical advances and
empirical tests in 20 countries. Advances in Experimental Social Psychology, 3.
Scott, C. L. (1980). Interpersonal Trust: A Comparison of Attitudinal and Situational Factors.
Human Relations. http://doi.org/10.1177/001872678003301103
Scott, S. D., Mercier, S., Cummings, M., & Wang, E. (2006). Assisting interruption recovery in
supervisory control of multiple UAVs. In Proceedings of the Human Factors and
Ergonomics Society Annual Meeting (Vol. 50, pp. 699–703). SAGE Publications. Retrieved
from http://pro.sagepub.com/content/50/5/699.short
Semnani-Azad, Z., Sycara, K., Lewis, M., & Adair, W. L. (2012). Stereotype and Perception
Change in Intercultural Negotiation. 2012 45th Hawaii International Conference on System
Sciences, 899–908. http://doi.org/10.1109/HICSS.2012.547
Sheridan, T. B., & Verpank, W. L. (1978). Human and computer control of undersea
teleoperators. Distribution.
Sheridan, & Hennessy, R. (1984). Research and Modeling of Supervisory Control Behavior.
Human Factors.
Simpson, A., & Brander, G. (1995). Seaworthy trust: Confidence in automated data fusion. …
Crew: Can We Trust the …, 298(704). Retrieved from http://www.dtic.mil/cgi-
bin/GetTRDoc?AD=ADA340601#page=86
Sitkin, S., & Roth, N. (1993). Explaining the limited effectiveness of legalistic “remedies” for
trust/distrust. Organization Science, 4(3), 367–393. Retrieved from
http://pubsonline.informs.org/doi/abs/10.1287/orsc.4.3.367
Skitka, L. J., Mosier, K. L., Burdick, M., State, S. J., & Ames, N. (1999). Does automation bias
decision-making? International Journal of Human-Computer Studies, 51(5), 991–1006.
http://doi.org/10.1006/ijhc.1999.0252
Spain, R. D., & Bliss, J. P. (2008). The effect of sonification display pulse rate and reliability on
operator trust and perceived workload during a simulated patient monitoring task.
Ergonomics, 51(9), 1320–1337. http://doi.org/10.1080/00140130802120234
Squire, P. N., & Parasuraman, R. (2010). Effects of automation and task load on task switching
during human supervision of multiple semi-autonomous robots in a dynamic environment.
Ergonomics, 53(8), 951–61. http://doi.org/10.1080/00140139.2010.489969
Srite, M., & Karahanna, E. (2006). The role of espoused national cultural values in technology
acceptance. MIS Quarterly, 30(3), 679–704. Retrieved from

138
http://dl.acm.org/citation.cfm?id=2017303
Sycara, K. P., & Lewis, M. (1998). Calibrating trust to integrate intelligent agents into human
teams. System Sciences, 1998., …, 1, 263–268. http://doi.org/10.1109/HICSS.1998.653107
Takahashi, C., Yamagishi, T., Liu, J. H., Wang, F., Lin, Y., & Yu, S. (2008). The intercultural
trust paradigm: Studying joint cultural interaction and social exchange in real time over the
Internet. International Journal of Intercultural Relations, 32(3), 215–228.
http://doi.org/10.1016/j.ijintrel.2007.11.003
Triandis, H. (1994). Culture and Social Behavior. New York, New York, USA: McGraw-Hill.
Triandis, H. (1995). Individualism and collectivism. Boulder, CO: Westview Press.
Triandis, H. (1996). The psychological measurement of cultural syndromes. American
Psychologist, 51(4), 407–415. http://doi.org/10.1037//0003-066X.51.4.407
Vazsonyi, A. T., Ksinan, A., Mikuška, J., & Jiskrova, G. (2015). The Big Five and adolescent
adjustment: An empirical test across six cultures. Personality and Individual Differences,
83, 234–244. http://doi.org/10.1016/j.paid.2015.03.049
Venkatesh, V., Morris, M., Davis, G., & Davis, F. (2003). User acceptance of information
technology: Toward a unified view. MIS Quarterly, 27(3), 425–478. Retrieved from
http://www.jstor.org/stable/10.2307/30036540
Visser, E.De, &Parasuraman, R. (2011). Adaptive Aiding of Human-Robot Teaming : Effects of
Imperfect Automation on Performance , Trust , and Workload. Human Factors, 5(2), 209–
231. http://doi.org/10.1177/1555343411410160.
Walliser, J. C. (2011). Trust In Automated Systems: The Effect of Automation Level On Trust
Calibration.
Wang, L., Jamieson, G. A., & Hollands, J. G. (2011). The effects of design features on users’
trust in and reliance on a combat identification system. Proceedings of the Human Factors
and Ergonomics Society Annual Meeting, 55(1), 375–379.
http://doi.org/10.1177/1071181311551077
Wang, L., Rau, P.-L., Evers, V., Robinson, B. K., & Hinds, P. (2010). When in Rome: The role
of culture & context in adherence to robot recommendations. In 2010 5th ACMIEEE
International Conference on HumanRobot Interaction HRI (pp. 359–366). ACM.
http://doi.org/10.1145/1734454.1734578
Wang, N., Pynadath, D.V., & Hill, S. G. (2016). Trust calibration within a human-robot team:
Comparing automatically generated explanations. ACM/IEEE International Conference on
Human-Robot Interaction, 2016–April, 109–116. http://doi.org/10.1109/HRI.2016.7451741
Wasti, S., Tan, H., Brower, H., & Onder, C. (2007). Cross-cultural measurement of supervisor
trustworthiness: An assessment of measurement invariance across three cultures. The

139
Leadership Quarterly, 18(5), 477–489. http://doi.org/10.1016/j.leaqua.2007.07.004
Wickens, C., & Colcombe, A. (2007). Dual-task performance consequences of imperfect alerting
associated with a cockpit display of traffic information. Human Factors, 49(5), 839–850.
http://doi.org/10.1518/001872007X230217
Wickens, C. D., Dixon, S., Goh, J., Hammer, B., & Savoy, I. U. A. U. (2005). Pilot dependence
on imperfect diagnostic automation in simulated UAV flights: An attentional visual
scanning analysis. International Symposium on Aviation Psychology, 13(March), 0–18.
Wiczorek, R., & Manzey, D. (2014). Supporting Attention Allocation in Multitask
Environments: Effects of Likelihood Alarm Systems on Trust, Behavior, and Performance.
Human Factors: The Journal of the Human Factors and Ergonomics Society, 56, 1209–
1221. http://doi.org/10.1177/0018720814528534
Xu, X., Wickens, C. D., & Rantanen, E. M. (2007). Effects of conflict alerting system reliability
and task difficulty on pilots’ conflict detection with cockpit display of traffic information.
Ergonomics, 50(1), 112–130. http://doi.org/10.1080/00140130601002658
Yamagishi, T., Cook, K., & Watabe, M. (1998). Uncertainty, Trust, and Commitment Formation
in the United States and Japan 1. American Journal of Sociology, 104(1), 165–194.
Retrieved from http://www.jstor.org/stable/10.1086/210005
Yamagishi, T., & Yamagishi, M. (1994). Trust and commitment in the United States and Japan.
Motivation and Emotion, 18(2). Retrieved from
http://link.springer.com/article/10.1007/BF02249397
Yoo, B., Donthu, N., & Lenartowicz, T. (2011). Yoo, B., Donthu, N., & Lenartowicz, T. (2011).
Measuring Hofstede's five dimensions of cultural values at the individual level:
Development and validation of CVSCALE. Journal of International Consumer Marketing,
23(August 2011), 193–210. http://doi.org/10.1080/08961530.2011.578059

148
APPENDIX A: STUDIES RELATED TO TRUST IN AUTOMATION
System-related factors: source reliability
Study Trust
Constructs Purpose Method Finding
(Visser & Parasuraman,
2011).
Adaptive aiding of human-
robot teaming effects of
imperfect automation on
performance, trust, and
workload.
Self-confidence
Examined the effects of
system reliability and
adaptive automation on
human-robot performance
with different levels of task
load
Participants performed target
verification tasks with an aided target
recognition system at various levels
of reliability or different types of
automation (static or adaptive).
Adaptive automation was invoked in
the context of the mission, rather than
on users' performance.
Higher trust and self-confidence
ratings were found in adaptive
automation, rather than in the
conventional static automation
approaches.
(Chen et al., 2011).
Effects of unreliable
automation and individual
differences on supervisory
control of multiple ground
robots.
Reliance
Deceptive
Examined the effects of
unreliable automation types
and levels (60% or 90%) on
the performance of robotics
operators
Participants detected target
appearances and planned new paths to
avoid hostile areas. An imperfect
automated path planner was used to
recommend route revisions for the
robots.
Higher trust was rated in the false
alarm than in the miss-prone
conditions. Participants also perceived
the false alarm conditions to be more
deceptive than the miss-prone
conditions. Less reliance was rated in
the low reliability condition.
(Desai et al., 2012).
Effects of changing reliability
on trust of robot systems.
Distrust
Regain trust
Examined how changes in
autonomy reliability affect
trust and use of automation
Participants drove a robot to search
for victims and were asked to freely
choose one of two provided robot
autonomy scenarios: either the robot
The timing of reliability drops result
in different trusting behaviors,
especially when decreases in
reliability occurred in the middle of or

149
ignored a user's inputs and followed
the predesigned paths, or the
participants could control and
overwrite the robot's movements.
Timing of automation failures was
manipulated.
later on in the tasks. Operators
switched away from autonomy
(distrust) during a reliability drop
much faster than returning to
autonomy (regain trust) after a
reliability increase.
(Salem, Lakatos,
Amirabdollahian, &
Dautenhahn, 2015).
Would You Trust a (Faulty)
Robot? Effects of Error, Task
Type and Personality on
Human-Robot Cooperation
and Trust
Reliance
Compliance
Examined how the faulty
robot behaviors influenced
human choices and
willingness to cooperate
with the robot by following
its unusual requests.
Participants received requests from
the robot and decided whether to
perform the requested tasks.
Two types of robot reliability (correct
or faulty) were applied to execute user
responses. The robot also sent unusual
requests to the operators to examine
user trust in automation.
Faulty automation affected operators'
perception of system reliability and
trustworthiness; however, compliance
with the robot's faulty requests
depended on the cause of lasting
damage by doing so.
System-related factors: automation faults (false-alarm prone vs. miss-prone)
(Dixon & Wickens, 2006).
Automation reliability in
unmanned aerial vehicle
control: A reliance-
compliance model of
automation dependence in
high workload
Compliance
Reliance
Examined the effects of
automation false alarms and
miss prones, as related to
human compliance and
reliance, respectively
Imperfect auditory auto-alerts were
provided for possible system failures.
Participants were instructed to cross-
checking with the raw data, in order
to skip the warning (false alarm) or
catch the failure (miss prone).
Compliance and reliance were
independent of each other, in which
compliance was affected by false
alarms, while reliance was influenced
by miss prones.
(Dixon et al., 2007).
On the Independence of
Compliance and Reliance:
Are Automation False Alarms
Worse Than Misses
Compliance
Reliance
Examined the influence of
automation failures on
operator compliance and
reliance in order to clarify
the independence between
these two factors.
Participants were asked to monitor
system failures with unreliable
automated aids (false alarms or
misses). Regardless of whether a
failure actually occurred or was
detected, participants were allowed to
make only one un-retractable
response during each trial.
False alarms correlated with operator
compliance and reliance, whereas miss
prones appeared to affect reliance
only.

150
(Chen, 2009).
Concurrent Performance of
Military Tasks and Robotics
Tasks: Effects of Automation
Unreliability and Individual
Differences
Self-confidence
Reliance
Examined how an
unreliable target recognition
system (false alarms or
misses) affected operators’
perceived workload and
performance on the
automated and concurrent
tasks.
Participants performed hostile target
detection tasks, as well as robotic
control tasks. An unreliable aided
target recognition system was used to
assist operators in locating targets.
Self-confidence is a critical factor in
moderating trust in and reliance on
automation. The relation between self-
confidence and reliance is also
affected by an operator’s ability in
attentional control.
(Rovira & Parasuraman,
2010).
Transitioning to Future Air
Traffic Management: Effects
of Imperfect Automation on
Controller Attention and
Performance.
Self-confidence
Examined the influences of
imperfect automation (false
alarm vs. miss) on operator
performance and attention
allocation.
Participants were instructed to
perform air traffic control tasks with
an automated conflict probe tool on
four different levels (manual, reliable
automation, miss, and false alarm).
Operators reported higher self-
confidence in performing the tasks
without the automation when they
were supported with unreliable
automation, as compared to reliable
automation.
(Bahner, Hüper, & Manzey,
2008).
Misuse of automated decision
aids: Complacency,
automation bias and the
impact of training experience.
Complacency
Automation Bias
Examined automation
misuse with regard to
complacency and
automation bias in
interacting with decision
automation.
Operators were asked to supervisory
control a process control system. An
automated diagnosis system was
provided to alert for possible system
faults. Operators may access all
relevant information about the state of
the systems to verify fault diagnoses.
Commission errors were associated
with inappropriate level of
complacency, which reflected in
insufficient verifications of the
proposed decisions. Exposing
participants to automation failures
during training session effectively
decreased their complacency
System-related factors: automation transparency
Study Trust
Constructs Purpose Method Finding
(Manzey et al., 2008).
Performance consequences of
automated aids in supervisory
control: The impact of
function allocation.
Reliance
Examined the positive and
negative performance
consequences in the use of
automated decision aids.
Participants were instructed to operate
a life-support system, including
monitoring various system parameters
and fixing system faults, if any. An
automated detection system was used
to diagnose system faults and provide
solutions, in which the operators can
The number of system parameters
accessed did not necessarily contribute
to the commission of errors. Instead of
a complete lack of verification, the
brevity of attention allocation in cross-
checking behaviors may be the cause
of commission errors.

151
veto proposed recommendations after
checking the relevant system
variables.
(Martelaro et al., 2016).
Designing HRI to Encourage
More Trust, Disclosure, and
Companionship
Vulnerability
Expressivity
Examined the effect of
increased agent
transparency (expressivity
and vulnerability of a robot)
on trust in intelligent
agents.
Participants were guided by a robot
through a circuit-building task. The
robot's vulnerability and expressivity
were manipulated, in which operators
perceived that different content came
from the robot during the assisting
processes.
Vulnerability was associated with
higher trust and companionship,
whereas expressivity increased
disclosure.
(Wang et al., 2016).
Trust Calibration within a
Human-Robot Team:
Comparing Automatically
Generated Explanations
Compliance
Examined how different
automatically generated
system explanations impact
on trust (with probability,
no probability, and no
explanation).
Participants received reports from
robots and then decided whether to
trust the findings (safe vs. dangerous).
Three types of information
uncertainty were provided
(explanation containing a
probabilistic assessment; explanation
with non-numeric information about
the report; or no explanation).
Higher trust was found in a system
that provided more explanations (both
probabilistic and non-numeric
information). However, compliance
was not affected by the explanation.
(Lyons et al., 2016).
Engineering Trust in Complex
Automated Systems
Reliance
Examined how information
transparency affected the
use of automated
recommendations.
Participants performed path-planning
tasks with the aids from different
types of automated planners. Three
levels of automation transparency
were provided (control, probability of
success, and logic behind the
statement).
The highest trust was found in the
logic condition (providing the logic
behind the risk statements) and the
lowest was found in the control
condition, which suggested that
automated recommendations should
be accompanied by the logic form.
System-related factors: level of automation (decision aids)
Study Trust
Constructs Purpose Method Finding

152
(Rovira et al., 2007).
Effects of imperfect
automation on decision
making in a simulated
command and control task
Reliance
Distrust
Examined the relation
between unreliable
automation and different
types of decision support
systems
Participants were instructed to
perform enemy-friendly engagement
selection tasks. To identify the most
dangerous enemy targets, varieties of
decision automations with different
prioritizing mechanisms were used.
Highly reliable yet imperfect
automation led to greater detrimental
effects when failures happened.
Prioritizing tasks in decision
automation effectively increased the
operators' levels of trust; however, the
variance of automation reliability did
not affect their trust ratings.
(Merritt & Ilgen, 2008).
Not all trust is created equal:
Dispositional and history-
based trust in human-
automation interactions
Competence
Responsibility
Dependability
Examined the effects of
individual differences
between the examination of
trust and automation use.
Participants were instructed to
visually search for weapons in X-ray
images of luggage with the aid of an
automatic weapon detector that
provided recommendations.
When the machine characteristics
(competence, responsibility,
predictability, and dependability) were
high, participants with a high
propensity to trust had higher levels of
post-task trust than participants with
initial trust; in contrast, when the
machine functioned less well, the
relationship was reversed, in which
high initial trust participants rated
lower post-task levels of trust than the
high initial trust group.
(Miller & Perkins, 2010).
Development of metrics for
trust in automation.
Competence
Dependability
Consistency
Confidence
Developed a five-factor
metric (competence,
predictability,
dependability, consistency,
and confidence) to model
trust in an automated
decision system.
Participants performed path-planning
tasks. The operators had to choose
either to adopt the automated
suggested route, or to create a manual
path under time constraint and
different risk conditions.
Competence, predictability,
dependability, consistency, and
confidence factors were all highly
correlated to human trust in
automation.
(Lyons & Stokes, 2012).
Human-human reliance in the
context of automation
Reliance
Automation Bias
Examined the reliance on
conflicting information
sources between human
aids and automated tools.
Participants were instructed to choose
the safest route for convoy tasks
under different risk conditions. Two
types of decision-making tools
(human aids vs. automated planner)
were included, and the levels of
conflict information (low to high)
between the two sources were
manipulated.
Automation bias was observed, in
which lower reliance was placed on
human aids when receiving conflicting
information between human and
automated aids. Automation bias was
increased as risk increased (i.e., higher
reliance was found on automation than
human aids in higher risk conditions).

153
(Phillips & Madhavan, 2013).
The role of affective valence
and task uncertainty in
human-automation interaction
Confidence
Mood
Examined the interaction
between information
uncertainty, received mood,
and aided target detector in
terms of impact on
confidence and trust in
automation.
Participants received and rated
positive or negative pictures before
the visual search tasks. An imperfect
automated target detector was used to
indicate the foe’s presence or absence.
Participants with a positive mood
were more susceptible to the
automated suggestions, and were more
confident than those with a negative
mood when using the automation.

153
APPENDIX B: TRUST INSTRUMENT DEVELOPMENT: ROOT CONSTRUCTS AND
DEFINITIONS
Empirically Derived (ED) Constructs Definitions
ED incorporates a three-phase experiment,
comprised of a word elicitation study, a
questionnaire study, and a paired
comparison study; and was performed to
empirically develop a scale to measure trust
between people and automated systems.
Twelve items falling into two factors (trust
and distrust), are incorporated in the
instrument. All the items are selected for
our test.
Trust
The trust factor comprises seven main items:
confidence, security, integrity, dependability,
reliability, trust, and familiarity.
Distrust
The distrust factor comprises five main items:
deceptiveness, underhandedness,
suspiciousness, wariness, and harm.
Human-Computer Trust (HCT) Constructs Definitions*
HCT scale is designed to examine trust in
intelligence systems (a taxi dispatch system
was used in their study). HCT instrument
comprises 25 items (five constructs, each
with five items to reflect the concept). All
the items are adapted to our test.
*All definitions are from (Madsen &
Gregor, 2000).
Perceived
Reliability
“Reliability of the system, in the usual sense of
repeated, consistent functioning.”
Perceived
Technical
Competence
“A system is perceived to perform tasks
accurately and correctly based on the
information that is input.”
Perceived
Understandability
“A human supervisor or observer can form a
mental model and predict future system
behavior.”
Faith
“A user has faith in the future ability of the
system to perform even in situations in which it
is untried.”
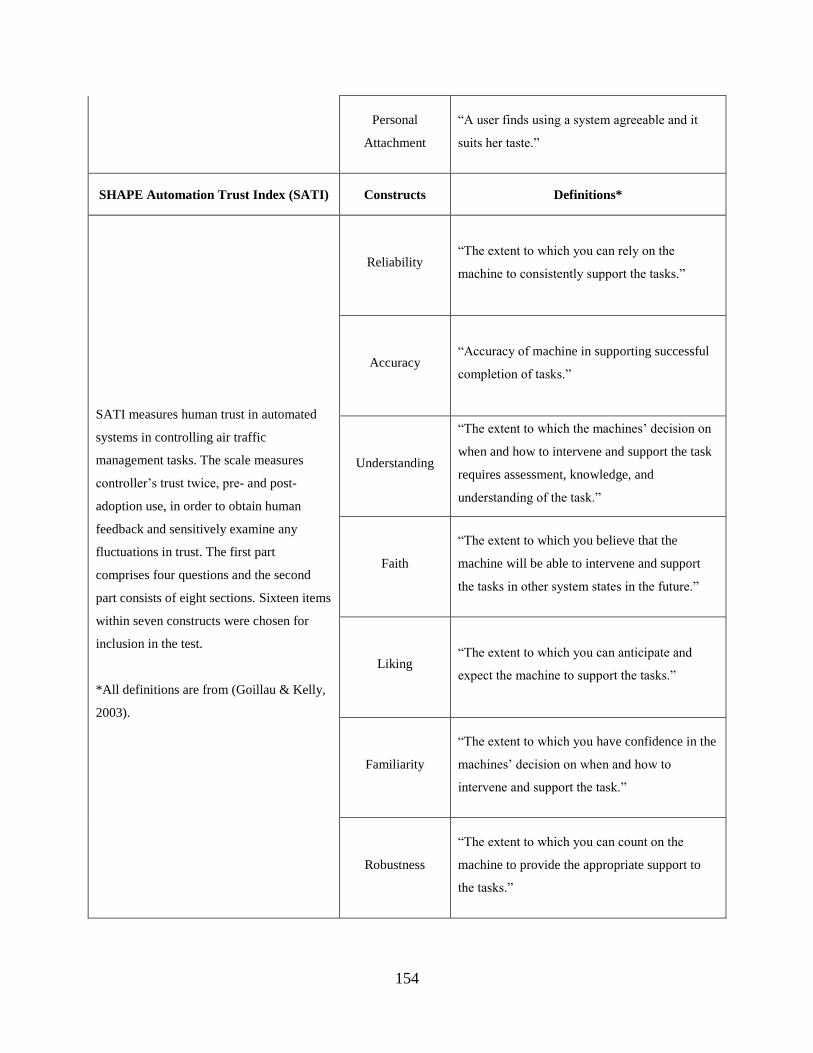
154
Personal
Attachment
“A user finds using a system agreeable and it
suits her taste.”
SHAPE Automation Trust Index (SATI) Constructs Definitions*
SATI measures human trust in automated
systems in controlling air traffic
management tasks. The scale measures
controller’s trust twice, pre- and post-
adoption use, in order to obtain human
feedback and sensitively examine any
fluctuations in trust. The first part
comprises four questions and the second
part consists of eight sections. Sixteen items
within seven constructs were chosen for
inclusion in the test.
*All definitions are from (Goillau & Kelly,
2003).
Reliability “The extent to which you can rely on the
machine to consistently support the tasks.”
Accuracy “Accuracy of machine in supporting successful
completion of tasks.”
Understanding
“The extent to which the machines’ decision on
when and how to intervene and support the task
requires assessment, knowledge, and
understanding of the task.”
Faith
“The extent to which you believe that the
machine will be able to intervene and support
the tasks in other system states in the future.”
Liking “The extent to which you can anticipate and
expect the machine to support the tasks.”
Familiarity
“The extent to which you have confidence in the
machines’ decision on when and how to
intervene and support the task.”
Robustness
“The extent to which you can count on the
machine to provide the appropriate support to
the tasks.”

155
Culture-Technology Fit (CTF) Constructs Definitions*
CTF investigates the trustworthy
relationship between cultural contexts and
post-adoption beliefs in the use of the
mobile Internet. CTF includes 30 items
within 10 factors (three items for each). The
cultural profiles (uncertainty avoidance and
individualism) were selected for our test.
*All definitions are from (Lee et al., 2007).
Uncertainty
Avoidance
“The extent to which the members of a culture
feel threatened by uncertain or unknown
situations.”
Individualism
“Individualism represents a preference for a
loosely knit social framework in which people
are expected to take care of themselves and to
look after their own interests.”
International Comparison of Technology
Adoption (ICTA) Constructs Definitions*
The ICTA compared the usage intention of
information technologies across different
cultural contexts. The UTAUT instrument
(Venkatesh et al., 2003) was selected to
examine the cultural effects. The survey
comprised fourteen items within five
factors, of which eleven items within four
factors were chosen for our test.
*All definitions are from (Venkatesh et al.,
2003).
Performance
expectancy
“An individual believes that using the system
will help him or her to attain gains in job
performance.”
Effort expectancy “The degree of ease associated with the use of
the system.”
Social influence
“The degree to which an individual perceives
that important others believe she should use the
new system.”
Facilitating
conditions
“The degree to which an individual believes that
an organizational and technical infrastructure
exists to support use of the system.”
Online Trust Beliefs (OTB) Constructs Definitions
OTB examined the moderating role of
uncertainty avoidance in online trust beliefs
between subjective norms and the integrity
& ability dimensions. OTB adopted sixteen
Uncertainty
Avoidance
“Uncertainty avoidance is the level of risk
accepted by the individual. This dimension
examines the extent to which one feels
threatened by ambiguous situations.” (Srite &
Karahanna, 2006)

156
items within six factors from (Srite &
Karahanna, 2006) and (Limayem, Khalifa,
&Frini, 2000), of which twelve items within
five constructs were selected for inclusion
in our test.
Subjective
Norms
“Social factors that are likely to influence the
online shopping intentions/behavior.” (Limayem
et al., 2000)
Benevolence
“The belief that the trusted party, while hoping
to make a profit, wants to do good to the
customer.” (Hwang & Lee, 2012)
Integrity
“A trusted party adheres to accepted rules of
conduct, such as honesty and keeping
promises.” (Hwang & Lee, 2012)
Intention “The behavioral intent of a buyer to precede the
act of purchasing.” (Hwang & Lee, 2012)
Technological Adoptiveness Scale (TAS) Constructs Definitions
TAS is a twelve-item measure that examines a
person’s relative openness to adopting and
using new technology. Nine items were
chosen for inclusion in our test.
General
Technology-
Adoptiveness
The attitude of openness in adopting any
technology that has been released recently and is
unfamiliar to a user.
Trust in Specific Technology (TIST) Constructs Definitions*
TIST examines different kinds of trust
across contexts and technologies, from
specific (e.g., Excel or spreadsheet
Specific
Technology-
Reliability
“The belief that the specific technology will
consistently operate properly.”

157
products) to general uses of automated
tools. The scale comprises 26 items within
seven factors, of which nineteen items
within six constructs are adapted to our test.
*All definitions are from (Mcknight &
Carter, 2011).
Specific
Technology-
Functionality
“The belief that the specific technology has the
capability, functionality, or features to do for
one what one needs to be done.”
Situational
Normality-
Technology
“One feels comfortable when one uses the
general type of technology of which a specific
technology may be an instance.”
Structural
Assurance-
Technology
“One believes structural conditions like
guarantees, contracts, support, or other
safeguards exist in the general type of
technology that make success likely.”
Faith in General
Technology
“One assumes technologies are usually
consistent, reliable, functional, and provide the
help needed.”
Trusting Stance-
General
Technology
“One presumes that one will achieve better
outcomes by assuming the technology can be
relied on.”
Individual Reaction to Computing
Technology (IRCT) Constructs Definitions
IRCT measures the users' reactions to
computing technology. IRCT includes 34
items within six factors, of which one
construct was adopted for our test.
Performance
Outcome
"Performance-related outcomes are those
associated with improvements in job
performance (efficiency and effectiveness)
associated with using computers."
Uses of a Specific Web Site (USWS) Constructs Definitions
USWS investigates the relational and
psychological factors that affect users'
propensities to stick with a website. USWS
includes 37 items within eight factors, of
which one construct was adopted.
Communication
Quality
"Communication quality refers to the timely
sharing of meaningful information between Web
site and users by means of formal and informal
channels."

158
Decision-making in Electronic Commerce
(DEC) Constructs Definitions
DEC examines users' trust-based decision-
based process with regard to online
purchasing decisions. DEC includes 49
items within eleven factors, of which two
factors were adopted in our study.
Information
Quality
"Information quality refers to a consumer’s
general perception of the accuracy and
completeness of Website information as it
relates to products and transactions."
Presence of a
third-party seal
"The Presence of a Third-Party Seal (TPS)
refers to an assurance of an Internet vendor
provided by a third-party certifying body such
as a bank, accountant, consumer union, or
computer company."
Appraisal System on Trust for Management
(ASTM) Constructs Definitions
ASTM examines the relationship between
trust and perceptions of the appraisal
system. ASTM comprises seven factors and
41 items, of which one factor was included
in our study.
Benevolence
"Benevolence is the extent to which a trustee is
believed to want to do good to the trustor, aside
from an egocentric profit motive."
Trust in Specific Technology (TIST) Constructs Definitions
TIST investigates trust across a variety of
contexts and technologies. TIST includes
26 items within seven factors, of which one
construct was included in our study.
Specific
Technology-
Helpfulness
"The belief that the specific technology provides
adequate and responsive help for users."
Trust Measures for E-commerce (TME) Constructs Definitions
TME investigates trust in e-commerce in
multidimensional contexts. TME includes
59 items within nineteen factors, of which
three constructs were included in our study.
Trusting Beliefs-
Competence
"Trusting beliefs means the confident truster
perception that the trustee has attributes that are
beneficial to the truster; Competence (is defined
as the) ability of the trustee to do what the
truster needs."

159
Trusting
Intentions-
Willingness to
Depend
"Trusting intentions means the truster is
securely willing to depend, or intends to depend,
on the trustee; Willingness to depend (is defined
as the) volitional preparedness to make oneself
vulnerable to the trustee."
Trusting
Intentions-
Subjective
Probability of
Depending
"The perceived likelihood that one will depend
on the other."
Adopting an Information Technology
Innovation (AITI) Constructs Definitions
AITI measures the users' adoption with
regard to information technology
innovation. AITI comprises 26 items within
seven factors, of which one dimension was
included in our study.
Ease of Use
"The degree to which an individual believes that
using a particular system would be free of
physical and mental effort."
Understanding Information Technology
Usage (UITU) Constructs Definitions
UITU measures users' intentions on the use
of information technology. UIUT includes
seven factors and 35 items, of which two
factors were included in our study.
Perceived
Behavioral
Control
"Perceived Behavioral Control reflects beliefs
regarding access to the resources and
opportunities needed to perform a behavior, or
alternatively, to the internal and external factors
that may impede performance of the behavior. "
Compatibility
"Compatibility is the degree to which the
innovation fits with the potential adopter's
existing values, previous experiences and
current needs."
Personal Computing (PC) Constructs Definitions

160
PC investigates the factors that affect the
use of personal computer technology. PC
comprises 30 items within seven
dimensions, of which one construct was
included in our study.
Facilitating
Conditions
Facilitating Conditions are defined as the
"objective factors, out there in the environment,
that several judges or observers can agree make
an act easy to do."
Technology Acceptance and Usage
Behavior (TAUB) Constructs Definitions
TAUB measures user reactions and usage
behaviors when interacting with new
information systems. The survey comprised
twelve items within four factors, of which
one dimension was included in our study.
Perceived Ease of
Use
"Perceived ease of use is defined as the degree
to which a person believes that using a
technology will be free from effort."

161
APPENDIX C: CONVERGENT VALIDITY
FACTOR LOADINGS, KMO VALUES, AND TOTAL VARIANCE EXPLAINED IN
SPECIFIC AUTOMATION
Pattern Matrix- General Automation
Construct Item Group Performance Process Context
Performance
Using a smart phone
increases my
effectiveness on my jobs.
All 0.810 -0.006 0.232
US 0.817 0.052 0.236
TW 0.811 0.209 0.212
TK 0.814 0.008 0.134
Using a smart phone will
improve my output
quality.
All 0.831 0.175 0.111
US 0.892 0.078 0.034
TW 0.814 0.117 0.255
TK 0.788 0.200 0.117
Using a smart phone will
increase my chances of
achieving a higher level
of performance.
All 0.820 0.224 0.148
US 0.887 0.057 0.202
TW 0.650 0.392 0.233
TK 0.793 0.207 0.229
Process
The information that a
smart phone provides is
of high quality.
All 0.228 0.785 0.096
US 0.143 0.762 0.154
TW 0.272 0.774 0.115
TK 0.253 0.689 0.226
A smart phone provides
sufficient information.
All 0.033 0.839 0.215
US 0.015 0.845 0.175
TW 0.038 0.802 0.292
TK 0.052 0.861 0.106
I am satisfied with the
information that a smart
phone provides.
All 0.118 0.873 0.098
US 0.021 0.876 0.112
TW 0.313 0.751 0.149
TK 0.116 0.850 0.132

162
Context
I prefer to use a smart
phone to make decisions
under high workload
situations.
All 0.034 0.161 0.828
US 0.059 0.028 0.855
TW 0.121 0.222 0.869
TK 0.260 0.182 0.721
Using a smart phone
helps me to expend less
effort to accomplish
tasks.
All 0.144 0.123 0.842
US 0.311 0.215 0.729
TW 0.216 0.205 0.787
TK -0.011 0.106 0.888
Using a smart phone
helps me accomplish
tasks with lower risk.
All 0.354 0.242 0.650
US 0.144 0.288 0.654
TW 0.350 0.388 0.601
TK 0.339 0.186 0.674
KMO
(suggested threshold: 0.7)
All 0.808
US 0.761
TW 0.850
TK 0.768
Total Variance Explained
(suggested threshold: 60)
All 71.839
US 71.682
TW 70.876
TK 68.897
Pattern Matrix- Specific Automation
Construct Item Group S_Performance S_Process S_Purpose
S_Performance
GPS improves my
performance.
All 0.810 0.293 0.231
US 0.801 0.377 0.173
TW 0.768 0.217 0.261
TK 0.864 0.217 0.279
GPS enables me to
accomplish tasks more
quickly.
All 0.861 0.178 0.233
US 0.906 0.105 0.151
TW 0.823 0.226 0.215
TK 0.837 0.233 0.303
GPS increases my
productivity.
All 0.836 0.220 0.282
US 0.850 0.204 0.275
TW 0.839 0.185 0.243
TK 0.817 0.264 0.302
S_Process
My interaction with
GPS is clear and
understandable.
All 0.201 0.824 0.189
US 0.168 0.799 0.211
TW 0.139 0.852 0.207
TK 0.232 0.794 0.244

163
GPS is user-friendly.
All 0.256 0.851 0.072
US 0.194 0.846 0.004
TW 0.219 0.869 0.097
TK 0.383 0.715 0.248
GPS uses appropriate
methods to reach
decisions.
All 0.300 0.631 0.390
US 0.214 0.518 0.513
TW 0.361 0.632 0.321
TK 0.363 0.703 0.325
S_Purpose
I am confident about
the performance of
GPS.
All 0.250 0.350 0.718
US 0.279 0.335 0.702
TW 0.260 0.246 0.775
TK 0.215 0.385 0.752
When an emergent
issue or problem
arises, I would feel
comfortable depending
on the information
provided by GPS.
All 0.241 0.207 0.801
US 0.272 0.070 0.835
TW 0.253 0.375 0.699
TK 0.208 0.330 0.781
I can always rely on
GPS to ensure my
performance.
All 0.158 0.038 0.857
US 0.074 0.041 0.858
TW 0.215 0.045 0.826
TK 0.250 0.119 0.859
KMO
(suggested threshold: 0.7)
All 0.882
US 0.850
TW 0.872
TK 0.912
Total Variance Explained
(suggested threshold: 60)
All 76.026
US 75.046
TW 73.996
TK 78.633

164
APPENDIX D: DISCRIMINANT VALIDITY
Diagonal elements (the values in parentheses) are the square root of the shared variance
between the constructs and their measures; off-diagonal elements are correlations between
constructs
General Automation
ALL
(N=360) CR Mean SD Perform Process Context
Perform 0.81 3.63 0.80 (0.76)
Process 0.82 3.63 0.79 0.40 (0.78)
Context 0.75 3.17 0.79 0.53 0.49 (0.71)
US
(N=120) CR Mean SD Perform Process Context
Perform 0.86 3.58 0.86 (0.82)
Process 0.81 4.02 0.65 0.17 (0.77)
Context 0.71 3.46 0.76 0.52 0.48 (0.67)
TW
(N=120) CR Mean SD Perform Process Context
Perform 0.79 3.77 0.77 (0.74)
Process 0.77 3.82 0.58 0.71 (0.73)
Context 0.79 2.86 0.74 0.77 0.69 (0.74)
TK
(N=120) CR Mean SD Perform Process Context
Perform 0.78 3.53 0.75 (0.74)
Process 0.78 3.07 0.77 0.45 (0.74)
Context 0.73 3.18 0.76 0.61 0.52 (0.68)

165
Specific Automation
ALL
(N=1260) CR Mean SD S_Perform S_Process S_Purpose
S_Perform 0.88 3.80 0.81 (0.85)
S_Process 0.81 3.79 0.74 0.76 (0.77)
S_Purpose 0.84 3.26 0.89 0.70 0.74 (0.80)
US
(N=420) CR Mean SD S_Perform S_Process S_Purpose
S_Perform 0.89 3.90 0.89 (0.85)
S_Process 0.75 4.02 0.69 0.76 (0.71)
S_Purpose 0.84 3.17 0.95 0.67 0.71 (0.80)
TW
(N=420) CR Mean SD S_Perform S_Process S_Purpose
S_Perform 0.84 3.85 0.75 (0.80)
S_Process 0.82 3.84 0.71 0.70 (0.78)
S_Purpose 0.84 3.44 0.87 0.75 0.76 (0.80)
TK
(N=420) CR Mean SD S_Perform S_Process S_Purpose
S_Perform 0.91 3.63 0.78 (0.88)
S_Process 0.84 3.51 0.73 0.80 (0.80)
S_Purpose 0.86 3.18 0.82 0.69 0.83 (0.82)

166
APPENDIX E: MEASUREMENT INVARIANCE
FIT INDICES FOR INVARIANCE TESTS (SUGGESTIVE THRESHOLD VALUES:
∆CFI < 0.01)
General automation
Model Model Description χ2 (∆χ2) df ∆df p-value CFI ∆CFI
Three groups: US, Taiwan, and Turkey
1 Configural model
(equal pattern) 104.951 _ 72 _ _ 0.971 _
2 Factor Loading Invariance 128.474 23.523 84 12 0.024 0.961 -0.01
3
Factor Loading Invariance
above except
Performance_4 free
113.574 8.623 82 10 0.568 0.972 0.001
Two groups: US and Turkey
4 Configural model
(equal pattern) 66.572 _ 48 _ _ 0.974 _
5 Factor Loading Invariance 73.557 6.985 54 6 0.322 0.973 0.001
6
Factor Loading and
Structural Weights
Invariance
82.453 15.881 60 12 0.197 0.969 0.005

167
Specific automation
Model Model Description χ2 (∆χ2) df ∆df p-value CFI ∆CFI
7 Configural model
(equal pattern) 261.596 _ 72 _ _ 0.971 _
8 Factor Loading Invariance 285.586 23.991 84 12 0.020 0.969 0.002
9
Factor Loading Invariance
above except S_Process5
free 279.905 18.309 82 10 0.050 0.970 0.001
Two groups: Taiwan and Turkey
10 Configural model
(equal pattern) 149.397 _ 48 _ _ 0.978 _
11 Factor Loading Invariance 151.878 2.482 54 6 0.871 0.979 0.001
12
Factor Loading and
Structural Weights
Invariance
163.786 14.389 56 8 0.072 0.976 0.002

165
APPENDIX F.1: ITEMS OF THE CULTURAL TRUST INSTRUMENT (ENGLISH VERSION)
Culture Trust Instrument (English Version)
Dimension Survey Items Disagree strongly
Disagree Neither
agree nor disagree
Agree Agree
strongly
General Automation Performance Expectancy
Using a smart phone increases my effectiveness on my jobs. 1 2 3 4 5
Using a smart phone will improve my output quality. 1 2 3 4 5
Using a smart phone will increase my chances of achieving a higher level of performance.
1 2 3 4 5
General Automation
Process Transparency
The information that a smart phone provides is of high quality. 1 2 3 4 5
A smart phone provides sufficient information. 1 2 3 4 5
I am satisfied with the information that a smart phone provides. 1 2 3 4 5
General Automation
Cultural-Technological
Context
I prefer to use a smart phone to make decisions under high workload situations.
1 2 3 4 5
Using a smart phone helps me to expend less effort to accomplish tasks.
1 2 3 4 5
Using a smart phone helps me accomplish tasks with lower risk. 1 2 3 4 5

166
Specific Automation Performance Expectancy
GPS improves my performance. 1 2 3 4 5
GPS enables me to accomplish tasks more quickly. 1 2 3 4 5
GPS increases my productivity. 1 2 3 4 5
Specific Automation
Process Transparency
My interaction with GPS is clearly understandable. 1 2 3 4 5
GPS is user-friendly. 1 2 3 4 5
GPS uses appropriate methods to reach decisions. 1 2 3 4 5
Specific Automation
Purpose Influence
I am confident about the performance of GPS. 1 2 3 4 5
When an emergent issue or problem arises, I would feel comfortable depending on the information provided by GPS.
1 2 3 4 5
I can always rely on GPS to ensure my performance. 1 2 3 4 5

167
APPENDIX F.2: ITEMS OF THE CULTURAL TRUST INSTRUMENT (CHINESE VERSION)
Culture Trust Instrument (Chinese Version)
Dimension Survey Items 非常不同意 不同意 中立 同意 非常同意
General Automation Performance Expectancy
使用智慧型手機能增加我工作上的效能 1 2 3 4 5
使用智慧型手機時,我的成果品質將會有所改善 1 2 3 4 5
使用智慧型手機將有機會提高我的工作表現 1 2 3 4 5
General Automation Process
Transparency
智慧型手機所提供的資訊品質很高 1 2 3 4 5
智慧型手機能提供充足的資訊 1 2 3 4 5
我對於智慧型手機所提供的資訊感到滿意 1 2 3 4 5
General Automation Cultural-
Technological Context
當工作量(workload)大的時候,我更傾向使用智慧型手機去作決策 1 2 3 4 5
使用智慧型手機可以幫助我以較少的精力去完成工作 1 2 3 4 5

168
使用智慧型手機能幫助我在較低的風險下完成工作(task) 1 2 3 4 5
Specific Automation Performance Expectancy
衛星定位系統(GPS)能改進我的表現 1 2 3 4 5
衛星定位系統(GPS)能使我更快地完成工作 1 2 3 4 5
衛星定位系統(GPS)能提升我的生產力 1 2 3 4 5
Specific Automation Process
Transparency
我與衛星定位系統(GPS)的互動過程(interaction)是清晰易懂的 1 2 3 4 5
衛星定位系統(GPS)的設計是人性化(user-friendly)的 1 2 3 4 5
衛星定位系統(GPS)能運用適當的方式做出決策 1 2 3 4 5
Specific Automation Purpose Influence
我對衛星定位系統(GPS)的表現有信心 1 2 3 4 5
當有緊急事件發生時,我能依賴衛星定位系統(GPS)所提供的資訊 1 2 3 4 5
我總是可以依賴衛星定位系統(GPS)來確保我的表現 1 2 3 4 5

169
APPENDIX F.3: ITEMS OF THE CULTURAL TRUST INSTRUMENT (TURKISH VERSION)
Culture Trust Instrument (Turkish Version)
Dimension Survey Items Tamamen
Katılmıyorum Katılmıyorum
Ne katılıyorum ne katılmıyorum
Katılıyorum Tamamen
katılıyorum
General Automation Performance Expectancy
Cep telefonu kullanmam işlerimdeki etkinliğimi artıracaktır.
1 2 3 4 5
Cep telefonu kullanmam işle ilgili çıktılarımın kalitesini artıracaktır.
1 2 3 4 5
Cep telefonu kullanmam daha yüksek düzeyde iş performansı çıkarma şansımı artıracaktır.
1 2 3 4 5
General Automation
Process Transparency
Cep telefonun sağladığı bilgi yüksek kalitededir. 1 2 3 4 5
Cep telefonu yeterli bilgi sağlar. 1 2 3 4 5
Cep telefonumun sağladığı bilgi benim için yeterlidir.
1 2 3 4 5
General Automation
Cultural-Technological
Context
Çok yoğun işim olduğu zamanlarda karar almada cep telefonu kullanmayı tercih ederim.
1 2 3 4 5
Cep telefonu kullanımım, daha az emek vererek işleri tamamlamamda yardımcı olur.
1 2 3 4 5

170
Cep telefonu kullanarak işleri tamamlamak daha az risk içerir.
1 2 3 4 5
Specific Automation Performance Expectancy
GPS benim performansımı artırır. 1 2 3 4 5
GPS işleri daha hızlı şekilde tamamlamamı sağlar. 1 2 3 4 5
GPS verimliliğimi artırır. 1 2 3 4 5
Specific Automation
Process Transparency
Benim GPS'le etkileşimim net şekilde anlaşılabilir. 1 2 3 4 5
GPS kullanıcı-dostudur. 1 2 3 4 5
GPS kararlara ulaşmak için uygun yöntemleri kullanır.
1 2 3 4 5
Specific Automation
Purpose Influence
GPS'in performansına güvenirim. 1 2 3 4 5
Acil bir durum veya problem oluştuğunda, GPS'ten elde ettiğim bilgiye güvenirim.
1 2 3 4 5
Her zaman performansımı korumak için GPS bilgisine güvenebilirim.
1 2 3 4 5