the indoor climate and energy consumption of educational ... · the indoor climate and energy...
TRANSCRIPT

The indoor climate and energy consumption of educational buildings
Teet-Andrus Koiv, Alo Mikola, Ulli-Kaisa Karro Department of Environmental Engineering
Tallinn Technical University Ehitajate tee 5, 19086 Tallinn
ESTONIA [email protected] http://www.ttu.ee
Abstract: - The indoor climate of classrooms influences both students' comfort as well as learning performance. Four renovated schoolhouses with mechanical ventilation and a kindergarten with natural ventilation have been investigated. The study paid special attention to the carbon dioxide concentration in classrooms and the indoor air quality in group rooms in the kindergarten. The cumulative duration graph clearly shows high levels of carbon dioxide in the classrooms and in the kindergarten playrooms. Also data on the energy consumption of the school buildings and its reduction potential are presented. Air change in classrooms was determined by the change in carbon dioxide levels. The survey showed that in most classrooms the carbon dioxide level at the end of a class exceeds the normal level several times. At the same time, ventilation in classrooms is very much lower than normal. The situation is due to the poor economic situation of schools, as well as the modest level and bad adjustability of HVAC. In naturally ventilated kindergarten playrooms the CO2 concentration ranges to 2,500 ppm. Key-Words: - Indoor climate, CO2 level in classrooms and kindergartens, cumulative graph, air change, specific energy consumption 1 Introduction Poor indoor air quality (IAQ) in indoor spaces such as classrooms can have adverse effects on the students’ and teachers’ comfort and pupils’ learning performance. Over short time scales (hours), poor IAQ causes discomfort, loss of attention and learning ability problems. On the ohter hand, sufficient ventilation rates in classrooms have been shown to improve the performance of students, e.g. in maths and reading tests (Fig. 1). Over a longer term (days and weeks), epidemiological studies have shown a link between poor IAQ and the frequency of asthmatic symptoms in school children [1]. Several studies have revealed poor IAQ in many schools and kindergartens worldwide as indicated by: - The air change rate (ACR) is not sufficient and generally much lower than mandatory design requirements. - Indoor concentrations of a number of volatile compounds (e.g. formaldehyde, toluene, benzene, etc.) are much higher than the corresponding outdoor concentrations (Fig. 2) [3],
- During classroom occupation, the indoor concentrations of carbon dioxide (CO2) can rapidly reach the recommended limit values, and this is caused by an inadequate level of ventilation [4]. A study in the UK found that building and decorating activities caused concentrations of some VOCs to exceed the recommended air quality guidelines [3].
Fig. 1. Performance of students in primary schools according to ventilation rates (l/s) (based on [2] the results of maths and reading tests
WSEAS TRANSACTIONS on ENVIRONMENT and DEVELOPMENT Teet-Andrus Koiv, Alo Mikola, Ulli-Kaisa Karro
E-ISSN: 2224-3496 366 Volume 10, 2014

Fig. 2. Weekly mean concentrations of formaldehyde (µg.m-3) outdoors and indoors in Rhône-Alpes kindergartens and primary schools, France and in French dwellings [6] In the Netherlands several studies in primary schools showed that the CO2 concentration exceeded 1000 ppm more than 80% of the time [5]. The school provides a major indoor environment for children away or apart from their home as they may spend about 10 hours per day at school [7]. Indoor air pollutants might increase the chance of both long and short term health problems among pupils and staff, reduce teachers’ productivity and degrade pupils’ learning environment and comfort [8]. Studies done in the United States [9] indicated that good air quality in schools has enhanced attendance and reduced health problems among pupils. Research conducted on five classrooms in Hong Kong has indicated that with inadequate ventilation the maximum CO2 level may reach 5900 µl/l during a class [10]. Many factors affect indoor air pollution levels, such as maintenance activities, the presence of contaminant sources (e.g. building materials, furnishings and equipment), the levels of contamination outdoors, the season, indoor humidity and temperature, and ventilation rates [11]. IAQ problems can be attributed to various phases of the building process, including poor site selection, choice of materials, roof design, poor construction quality, improper installation or any number or combination of other factors [12]. Poor ventilation was another common issue that affected school occupants. Low ventilation rates generally increase the risk between health symptoms and ventilation rates or CO2 concentrations. Seppanen et al. [13] found that some increases in ventilation rates up to 20 L/s per person decreased the prevalence of SBS symptoms or improved the perception of IAQ. Wargocki et al. [14] found that air-conditioned buildings may increase the risk of SBS systems compared to those that are naturally ventilated.
ASHRAE [15] recommends a minimum ventilation rate of 8 L/s-person for classrooms. Provided the typical occupant density is 33 per 90 m2 and the ceiling height is 3m, the current ASHRAE standard would require an air change rate of about 3 air changes per hour (ACH) for a classroom. Clements-Croome et al. [16] in their research of eight primary schools in the United Kingdom revealed that pupils’ work and performance increased by 7% due to the intervention of fresh air supply from 0.3-0.5 to 16 L/s per person. This is supported by [17], in which small ventilation air flow rates will reduce not only comfort, but also schoolchildren’s learning performance in classrooms. Improving classroom conditions can substantially improve the performance of school work by children [18]. Carbon dioxide concentrations are often used as a surrogate of the rate of outside supply air per occupant. Indoor CO2 concentrations above 1000 ppm are generally regarded as indicative of ventilation rates that are unacceptable with respect to body odors. Concentrations of CO2 below 1000 ppm do not always guarantee that the ventilation rate is adequate for removing air pollutants from other indoor sources [16].
It is difficult to adequately characterize indoor CO2 concentrations since they are a function of occupancy and ventilation rate, both varying similarly to the function of time. Grab samples or other short-term measurements may be inadequate to provide information on the long-term ventilation conditions in schools. The most common building factors associated with indoor environmental complaints are related to Heating Ventilation and Air Conditioning (HVAC) systems. The recommended ventilation rate for a classroom is 8 L/s /person with a specified maximum occupancy of 50 persons per 1000 ft2 for schools [19]. Thermal comfort in kindergarten was studied by Fabri [20]. Children sensitivity to indoor environmental pollution is dealt with Roda et al [21]. The paper presents the results of the study of the indoor climate and energy consumption in four renovated school buildings, which show significant shortcomings in the indoor air quality of the educational buildings.
2 Method
WSEAS TRANSACTIONS on ENVIRONMENT and DEVELOPMENT Teet-Andrus Koiv, Alo Mikola, Ulli-Kaisa Karro
E-ISSN: 2224-3496 367 Volume 10, 2014
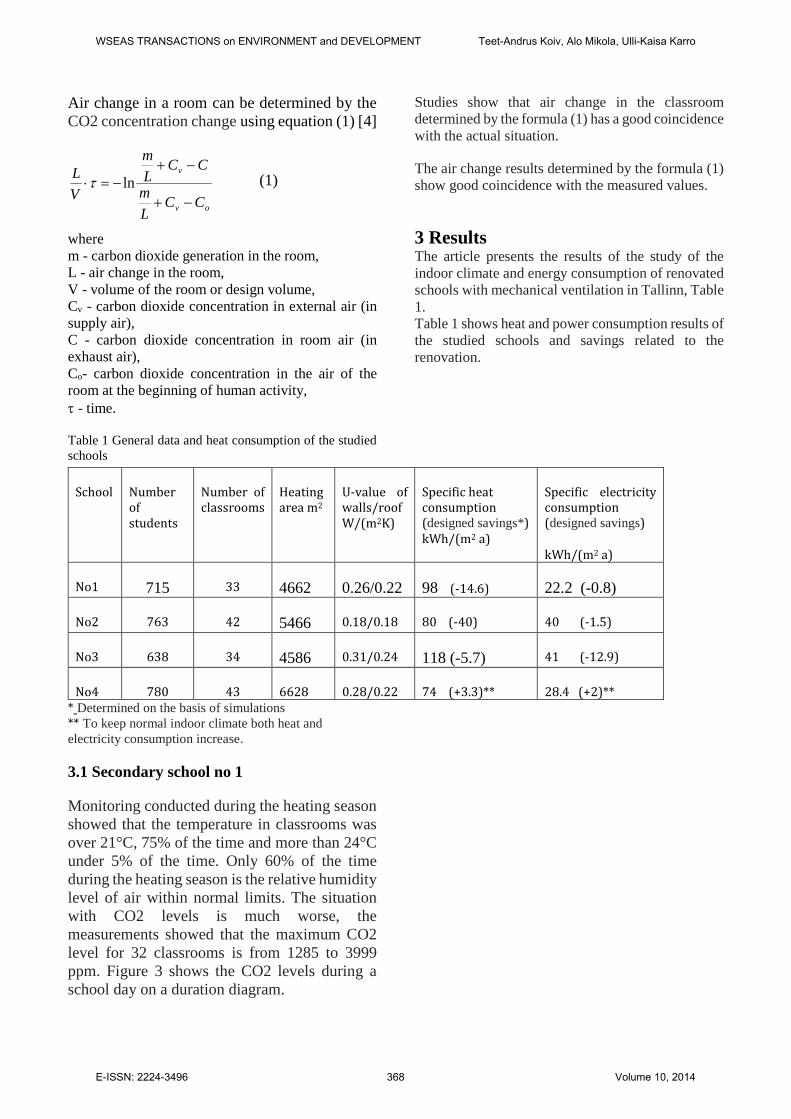
Air change in a room can be determined by the CO2 concentration change using equation (1) [4]
ov
v
CCL
m
CCL
m
V
L
−+
−+
−=⋅ lnτ (1)
where m - carbon dioxide generation in the room, L - air change in the room, V - volume of the room or design volume, Cv - carbon dioxide concentration in external air (in supply air), C - carbon dioxide concentration in room air (in exhaust air), Co- carbon dioxide concentration in the air of the room at the beginning of human activity, τ - time.
Table 1 General data and heat consumption of the studied schools
* Determined on the basis of simulations
** To keep normal indoor climate both heat and electricity consumption increase.
3.1 Secondary school no 1
Monitoring conducted during the heating season showed that the temperature in classrooms was over 21°C, 75% of the time and more than 24°C under 5% of the time. Only 60% of the time during the heating season is the relative humidity level of air within normal limits. The situation with CO2 levels is much worse, the measurements showed that the maximum CO2 level for 32 classrooms is from 1285 to 3999 ppm. Figure 3 shows the CO2 levels during a school day on a duration diagram.
Studies show that air change in the classroom determined by the formula (1) has a good coincidence with the actual situation.
The air change results determined by the formula (1) show good coincidence with the measured values.
3 Results The article presents the results of the study of the indoor climate and energy consumption of renovated schools with mechanical ventilation in Tallinn, Table 1. Table 1 shows heat and power consumption results of the studied schools and savings related to the renovation.
School Number
of
students
Number of
classrooms
Heating
area m2
U-value of
walls/roof
W/(m2K)
Specific heat
consumption
(designed savings*)
kWh/(m2 a)
Specific electricity
consumption
(designed savings)
kWh/(m2 a)
No1 715 33 4662 0.26/0.22 98 (-14.6) 22.2 (-0.8)
No2 763 42 5466 0.18/0.18 80 (-40) 40 (-1.5)
No3 638 34 4586 0.31/0.24 118 (-5.7) 41 (-12.9)
No4 780 43 6628 0.28/0.22 74 (+3.3)** 28.4 (+2)**
WSEAS TRANSACTIONS on ENVIRONMENT and DEVELOPMENT Teet-Andrus Koiv, Alo Mikola, Ulli-Kaisa Karro
E-ISSN: 2224-3496 368 Volume 10, 2014

Fig.3. Cumulative graph of the CO2 level in
classrooms
In all the studied classrooms the final concentration of carbon dioxide was higher than the required threshold exceeding it by 375-3100 ppm, despite the fact that the school has a mechanical ventilation system, which works from 6:00 to 14:00 on weekdays. Figure 3 shows that during 50% of the study time the concentration of CO2 in the indoor climate exceeds class III requirement - 1,200 ppm. Thus it can be concluded that the ventilation system does not work according to the designed air flow rates. The study showed that the ventilation air flow rates were 1.5 to 2 times lower than the design value - 3 l /(s·m²).
3.2 Basic school no 2
Fig.4 Cumulative graph of CO2 concentration in classrooms
Indoor climate measurements in 46 rooms showed that the internal temperature meets the requirements 90% of the time. Prolonged exposure measurements showed that the indoor temperature is not significantly affected by the change in external temperature. In winter (January, February), the measurements showed that the relative humidity is below 25% over 50% of time. The cumulative duration graph of carbon dioxide concentration is shown in Fig.4. The figure shows that the CO2 level was below 1000 ppm 65% of the time on average. However, in many classrooms this level was exceeded considerably. In 30% of the classrooms the CO2 level was approximately 900 ppm already at the beginning of the school day, which refers to insufficient air change. This is confirmed by the comparison of the designed and measured air flow rates, Fig. 4.
Fig. 5 Measured and designed air flow rates l/s in different classrooms Fig. 5 shows that the measured air flow is generally less than 50% of the design value, which causes high concentrations of CO2 in classes. 3.3 Secondary school no3 The 3D view of the school building is presented in Figure 6.
0
500
1000
1500
2000
2500
3000
3500C
O2
co
nce
ntr
ati
on
of
ind
oo
r
air
, p
pm
Relative time, %
0
50
100
150
200
250
300
350
106 108 207 203 216 224 322 305 312 314 320
Measured Designed
0
500
1000
1500
2000
2500
3000
3500
0,010,020,030,040,050,060,070,080,090,0100,0
Indo
or a
ir C
O2
cont
ent,
ppm
Relative time, %Average Single classroom
WSEAS TRANSACTIONS on ENVIRONMENT and DEVELOPMENT Teet-Andrus Koiv, Alo Mikola, Ulli-Kaisa Karro
E-ISSN: 2224-3496 369 Volume 10, 2014

Fig.6. 3D view of the school building
The air temperature corresponded to standard EVS-EN 15251 Class II 90% of the time. The relative humidity was within the limits of 25 ... 45% 80% of the time. CO2 measurement results show that the CO2 concentration in classrooms was more than 1000 ppm over 70% of the time. Table 2 shows the determined and designed air change data in different classrooms.
Table 2. Calculated and designed air change in classrooms
Class Air change l/(s·m2)
Air change per student l/(s· in)
Designed air change
l/(s·m2)
103 0.5 1.5 3.0
104 0.5 1.6 3.0
106 0.5 1.5 3.4
107 0.4 1.1 2.8
111 0.4 1.3 2.8
202 1.8 4.7 2.0
205 1.3 4.5 3.8
209 1.0 4.0 3.2
225 1.7 4.4 3.9
226 1.3 3.2 4.0
302 1.3 4.5 3.1
304 1.6 4.1 3.95
Table 2 shows that in most rooms the air change is significantly lower than the design value and does not ensure the required indoor climate.
3.4 Secondary school no 4 This is a typical school building built in the 1970s, which was renovated 6 years ago. The air temperature corresponds to standard EVS-EN 15251 Class II 77% of the time. The relative humidity is within the limits of 25 ... 45% 85% of the time. The CO2 concentration in classrooms is below 1,000 ppm 60% of the time, but most of it is the time outside classes. During the classes the peak CO2 level is from 2000 to 4000 ppm and the CO2 level is more than 1000 ppm as a rule. The air flow rates in classes are on average 2.4 times lower than the design value of 3 l/(s m2). This is the reason for very high CO2 concentration during classes.
Fig.7. Cumulative graph of CO2 concentration in classrooms (Secondary school no 4), the red line is the average value
3.5 Kindergartens It is known that many kindergartens are located in 30-40-year old partially renovated (windows, roof, heating system) buildings. In the children's playrooms, there is no mechanical ventilation. The kitchens have mechanical ventilation. These are typical buildings, which usually have 12 groups, see Fig. 8.
0250500750
1000125015001750200022502500275030003250350037504000
0% 20% 40% 60% 80% 100%CO
2co
nte
nt
in c
lass
es,
pp
m
Relative time
WSEAS TRANSACTIONS on ENVIRONMENT and DEVELOPMENT Teet-Andrus Koiv, Alo Mikola, Ulli-Kaisa Karro
E-ISSN: 2224-3496 370 Volume 10, 2014

Fig.8 Kindergarten “Child“
The survey results are presented for kindergarten “Child“ (262 children, heated area 2142 m2, 12 groups), where the special heat energy consumption is 183 kWh/m2. The proposed savings potential is about 50%.
The cumulative curves of the indoor climate parameters in the kindergarten - the air temperature, relative humidity and carbon dioxide concentration - are shown in Figures 9, 10, 11.
Fig.9. Cumulative graph of indoor temperature during the heating period: dark line - average value
Generally satisfactory, with the exception of a few group rooms where the temperature should be higher in the morning.
Fig.10 Cumulative graph of relative humidity during the heating period: dark line - average value
Mostly satisfactory, with the exception of low frost.
Fig.11 Cumulative graph of CO2 concentration: dark line - average value
The figure shows that nearly 70% of the working time the CO2 level in the playrooms exceeds the normal level - 1000 ppm. Similar high CO2 concentration is typical of the majority of the nurseries where the ventilation has not been renovated.
In some kindergartens, in some areas, there are problems with radon, Fig.12.
15
17
19
21
23
25
27
0 10 20 30 40 50 60 70 80 90 100
Tem
pera
ture
, °C
Time, %
0
20
40
60
80
100
0 10 20 30 40 50 60 70 80 90 100Rel
ativ
e hu
mid
ity,
%
Time, %
0
500
1000
1500
2000
2500
0 10 20 30 40 50 60 70 80 90 100
CO
2, p
pm
Time, %
WSEAS TRANSACTIONS on ENVIRONMENT and DEVELOPMENT Teet-Andrus Koiv, Alo Mikola, Ulli-Kaisa Karro
E-ISSN: 2224-3496 371 Volume 10, 2014

Fig.12. Radon concentration in the kindergarten (February 2013)
Fig.13 Simulations of energy consumption before and after the renovation have been carried out in the kindergarten 4 Conclusion The studied schools have been renovated and the energy consumption has significantly reduced, but the indoor air CO2 levels exceed the required levels, even several times. At the same time, the indoor air temperature is satisfactory. The reason for this is the poor performance of mechanical ventilation. On the one hand, this is due to the poor economic situation, schools will seek cost savings by reducing the air flow rates and the operating time of the ventilation. On the other hand, the level of renovation is less than optimal. There are particular weaknesses in utility management. To improve this situation it is necessary to raise the quality of renovation and the operational level of HVAC.
The indoor air climate in the playrooms and bedrooms of the kindergarten needs rapid improvement, especially in the areas with cold
climate. One possibility here is to use a low-noise room AHU to raise the air change to the necessary level.
In the current situation, the indoor climate during the classes in the studied schools and in the kindergarten playrooms does not meet the requirements EN 15251:2007, to a larger or smaller extent.
Acknowledgement The research was supported by the Estonian Research Council, with Institutional research funding grant IUT1−15 and with the project “Development of efficient technologies for air change and ventilation necessary for the increase of energy efficiency of buildings, AR12045”, financed by SA Archimedes.
References: [1] Indoor Air Quality in Schools - Improving Child Health and Learning Performance. https://www.google.com/search?q=google&sourceid=ie7&rls=com.microsoft:et:IE-Address&ie=&oe=#q=Indoor+Air+Quality+in+Schools+-+Improving+Child+Health+and+Learning+Performance&rls=com.microsoft:et%3AIE-Address 19.09.13 [2] Shaughnessy R., Haverinen-Shaughnessy U. Moschandreas D., 2008. The relationship between ventilation rates in classrooms and the prevalence of students scoring satisfactory in math and reading. Proc. of Indoor Air 2008, pp.17-22, Copenhagen, Denmark, paper ID 605. [3] Crump D., Squire R., Brown V., Yu C., Coward Aizlewood C., 2005. Investigation of volatile organic compounds in the indoor air of a school over a one year period following refurbishment. Proceedings of Indoor Air 2005, pp.4-9, Beijing, China,pp. 659-663. [4] T.-A.Koiv. Indoor climate and ventilation in Tallinn school buildings. Proc. Estonian Acad. Sci.Eng., 2007, 13, 1, pp.17-25. [5] Dijken, F., Bronswijk, J.E.M.H. van, Sundell, J., 2006, Indoor environment in Dutch primary schools and health of the pupils, Building Research and information, 34(5), pp.437-446. [6] N. M. Salleh , S. N. Kamaruzzaman, R. Sulaiman , N. S. Mahbob. 2011. Indoor Air Quality at School: Ventilation Rates and It Impacts Towards Children-A review. 2nd International Conference on Environmental Science and Technology IPCBEE vol.6 (2011), IACSIT Press, Singapore. [7] Zhang G, Spickett J, Rumchev K, Lee AH, Stick S. 2006. Indoor ‘Environmental quality in a “low
050
100150200250300350400
Bq/
m3
WSEAS TRANSACTIONS on ENVIRONMENT and DEVELOPMENT Teet-Andrus Koiv, Alo Mikola, Ulli-Kaisa Karro
E-ISSN: 2224-3496 372 Volume 10, 2014

allergen” school and three standard primary schools in Western Australia”. Indoor Air, 16, pp. 74-80. [8] Soughnessy, R.J., Soughnessy, U.H, Nevalainen, A., Moschandreas, D. (2006). “A preliminary study on Association between ventilation rates in classrooms and students performance”. Indoor Air 16, pp.465-468. [9] Kats, G. (Dec 2005). “National Review of Green Schools. A Report for the Massachusetts Technology Collaborative”, pp.32-45. [10] Lee, S., and Chang, M. (1999). "Indoor air quality investigations at five classrooms." Indoor Air, 9, pp. 134 - 138. [11] Hall, R., Hardin, T., and Ellis, R. (1995). "School indoor air quality best practices manual." Washington State Department of Health, Olympia, Washington. [12] Research Triangle Institute International. (2003). "California Portable Classrooms Study Project Executive Summary." California Air Resources Board, California Department of Health Services. [13] Seppänen, O.A., Fisk, W.J., and Mendell, M.J. (1999) “Association of ventilation rates and CO2 concentrations with health and other responses in commercial and institutional buildings,” Indoor Air, 9, pp. 226-252. [14] Wargocki, P., Sundell, J., Bischof, W., Brundrett, G., Fanger, P. O., Gyntelberg, F., Hanssen, S. O., Harrison, P., Pickering, A., Seppanen, O., Wouters, A. (2002). "Ventilation and health in non-industrial indoor environments: report from a European Multidisciplinary Scientific Consensus Meeting (EUROVENT)." Indoor Air, 12, pp. 113-128. [15] ASHRAE (2007) “Ventilation for acceptable indoor air quality, standard 62-2007, American Society for Heating, Refrigerating and Air Conditioning Engineers, Atlanta, GA. [16] D.J Clements-Croome et al. (2008). “Ventilation rates in schools”. Building and Environment, 43, pp. 362-367 [17] Mendell, M., Heath, G. (2005). "Do indoor pollutants and thermal conditions in schools influence student performance? A critical review of the literature." Indoor Air, 15, pp. 27 - 52. [18] Wargocki et al. (2005). “The effects of classroom air temperature and outdoor air supply rate on the performance of school work by children”. Indoor Air proceeding. Danish Technical Research. [19] Sahlberg, B., Smedge, G., Norback, D. (2002). "Sick Building Syndrome (SBS) Among School Employees in the County of Uppsala, Sweden." In: Indoor Air 2002, Monterey, California.
[20] K. Fabri. 2013. Thermal comfort evaluation in kindergarten: PMV and PPD measurement through datalogger and questionnaire, Building and Environment, Vol. 68, 2013, 202–214. [21] Roda, C., Barral, S., Ravelomanantsoa, H., Dusséaux, M., Tribout, M., Moullec, Y., Momas, I. 2011. Assessment of indoor environment in Paris child day care centers. Environmental Research, Vol.111, 8, 1010–1017.
WSEAS TRANSACTIONS on ENVIRONMENT and DEVELOPMENT Teet-Andrus Koiv, Alo Mikola, Ulli-Kaisa Karro
E-ISSN: 2224-3496 373 Volume 10, 2014