the indian tractor industry : buckle up for more rough...
TRANSCRIPT

The Indian Tractor Industry : Buckle up for more rough weather ahead
BSE Auto vs. Sensex
Performance (%)
1m 3m 12m
Sensex 6.6% -1.8% -10.5%
BSE Auto 5.4% -4.2% -8.6%
Market data
BSE SENSEX 25285
Nifty 7704
BSE Autos 17541
Tractor Sector Update
Date 22nd Mar’ 2016
MUKESH SARAF [email protected] +91 44 4344 0041
RAMAKRISHNAN SESHAN [email protected] +91 44 4344 0020Find Spark Research on Bloomberg (SPAK <go>),
Thomson First Call, Reuters Knowledge and Factset
As part of our periodic dealer channel check exercise, between Mar 15 – Mar 21, 2016, we interacted with around 75
tractor dealers (across OEMs) operating in key states across India. The objective of the exercise was to gauge thedealer sentiments on the back of the seemingly bottomless spiral the tractor industry finds itself in. We enquired of
the dealers the impact of recent trends and data-points having a bearing on near-term tractor demand including
1) unseasonal rains/hail impacting North and Central India 2) near record-low reservoir levels across the country3) rocketing dealer inventory and discounting levels, juxtaposed against 4) positives of increasing MSPs and
5) improving prospects of non-agri. demand led by increasing investments in the rural sector. Additionally, we also
interacted with industry experts and managements of leading OEMs to the same end. Our findings are as under
No let up in demand weakness expected over the near term: Tractor demand for Mar’16 is expected to be weak,
conforming with trends seen through FY16, capping what has been the worst year for the tractor industry since FY11
Dealers in major tractor markets were pessimistic about prospects of a meaningful pick up in demand over the near term aswell on the back of a combination of factors (covered in greater detail on pages 8-9 of this report) including payment
arrears/stagnant state-advised-prices for sugarcane in UP, unseasonal rain/hail impacting standing rabi crops (importantly,
wheat) in major North and Central Indian states, sustained drought conditions in Maharashtra, lower demand for gaur (gum)in Rajasthan due to fall in crude prices, crash in basmati prices impacting Punjab and Haryana, and true to form, lack of
decisive policy making (potato procurement prices not yet announced) impacting farmers in Orissa.
On the positive side, a relatively better monsoon in UP (the largest tractor market) favorably impacting produce of all majorcrops, increase in procurement of rice by FCI, increase in MSPs, and investments in road projects are bright spots, that
could favorably impact demand, however, these are not expected to nullify impact of the negative demand drivers.
Dealers plagued by elevated channel inventory levels/retail cycles and discounting levels: Dealers inventory levelshave increased from an average of ~40 days to around 60 days currently, driven by increasing push by the OEMs. High
inventory issues were highlighted specifically by dealers in Maharashtra and MP. With sluggish demand, farmers’ bargaining
strength has improved, leading to average discounting levels increasing compared to ~3 years back. Also, the farmers aredemanding a higher credit period from the dealers, elongating the retail cycle which at times goes upto 180 days against an
avg. of ~40 days.
Bright prospects for the small tractor segment (<30HP): Industry experts indicated promising demand for <30Hpsegment due to the following) on an average a 25HP tractor is sufficient for most agri-operations; 2) the haulage capacity of
such a tractor would be around 2.5T-3T, which is the typical load for non-agri operations and the rate per day for 8 hours of
non-agri-operations (Rs.700) is not dependent on tractor HP 3) major OEMs including M&M and International Tractors arelooking to expand their presence in the segment sensing the potential
International Tractors and TAFE said to be the most aggressively growth focused: Dealers of all major OEMs
identified International Tractors and TAFE as the major competitors, characterized by a robust product portfolio andaggressive marketing force. Dealers also indicated that when the imminent launch of lower HP tractors of John Deere takes
place, it could pose a tough competition to the existing players.
Stock Calls: Retain positive stance on VSTT (BUY: TP: Rs. 1,780), basis 15x FY18 EPS; given that it is perfectly poisedto benefit from the increasing demand for <30HP tractors. Reaffirm our call on M&M (ADD; TP: Rs. 1,325), based on SOTP
valuation. We believe that the slowdown will impact volumes of its farm equipments; and auto segment will drive growth.
Pan-India dealer checks across OEMs indicate a weak near demand outlook; expect pain to continue till 1HFY17, at least
Page 1
-20%
-15%
-10%
-5%
0%
5%
Mar-15 Jun-15 Sep-15 Dec-15 Mar-16
BSE Auto Sensex
B
The Indian Tractor Industry : Buckle up for more rough weather ahead
Non-applicability of scrappage scheme to tractors continues to be an impediment to replacement sales
Industry experts indicate that if the proposed scrappage norms of CVs more than 10 years old is made applicable to tractors as well, the replacement marketfor tractors would be enhanced by ~ 1.5mn units with immediate effect, providing a boost to tractor volumes, besides curbing pollution. However, OEMs havebeen opposed to classification of tractors as “ Commercial Automobiles”, so as not to lose eligibility for subsidies and other sops, losing out on this significantdemand trigger in the bargain.
Major tractor OEMs face intense competition (particularly in the Western and Northern regions) from the semi-organized, but significant tractorindustry in Rajkot and Saurashtra
Tractor industry in Rajkot is home to around 10-12 players with annual volumes of 12,000 units (primarily sub-20HP). Sources indicate that ~90% of the partsused in manufacturing by these units are sourced locally, which in combination with easy availability of skilled labour reduced the cost of production MajorOEMs including M&M (for mfg. the Yuvraj brand) Escorts (for mfg. the Steeltrac brand) have tied up with these local manufacturers in order to reduce thecost of production.
The net price of the tractor becoming the most (and in some cases, the only) important criterion in the tractor buying process
Dealers indicated that Intense competition, characterized by the entry and growing prominence of several new entrants in the market, coupled with sluggishdemand conditions has meant that farmers are increasingly going bargaining hunting in search of the best deals and add-on, including pressurising thedealer to throw in cash discounts, give higher value for the old tractor, free agricultural implements including trolleys, extended credit periods and so on.
Dealers indicated the concept of brand loyalty is surely disappearing, and given that all OEMs find it equally challenging to provide after sales service(primarily required on-site, in the farms), the same is not a major criterion in the tractor buying process.
Growing trend of farmer loan repayments being mapped to cash flows could ease burden on farmers significantly.
Dealers in UP indicated that a few banks in the region have restructured the loan repayment cycles of farmer loans to coincide with the harvest season,thereby ensuring that he is not strained due to a cash-flow mis-match. In other words, an EMI is converted into a yearly or half yearly repayment of principal(along with interest). Dealers indicated that this trend could spur confidence in farmers in taking up loans to purchase tractors.
Dealer attrition on the rise
Basis our interactions with dealers on the intra-OEM competitive scenario, dealers across states indicated that since it is becoming increasingly unviable tofunction as a tractor dealer, they are witnessing higher instances of dealer attrition
Replacement cycles the best in Punjab and Haryana; followed by UP; augurs well for a pick up in replacement demand in these major markets withdecent monsoon
Dealers in Punjab and Haryana indicated that the replacement cycle is the lowest in India at ~2-3 years, followed by UP at around 3-4 years. We believe thathigh probability of a good monsoon in FY17 coupled with short replacement cycles in major states augurs well for a pick up in demand.
Other takeaways
Despite official figures of ~30% of tractor used for non-agri purposes, dealers indicated that deploying of tractors for non-agri use is not an option, but anecessity if the farmer were to repay his loans. The rate for non-agri use are ~Rs.700/ day (assuming the tractor is driven by the owner). The registrationcosts for agri-use is Rs. 5,500 for a period of 15 years vs. Rs. 36,000 p.a. to register for non-agri use. Hence, farmers register for agri-use and the tractor isused for non-agri purposes for nine months is a year
Pan-India dealer checks across OEMs indicate a weak near demand outlook; expect pain to continue till 1HFY17, at least
Page 2

The Indian Tractor Industry : Buckle up for more rough weather ahead
Tractor volumes at their five year nadir in FY16; demand revival overwhelmingly dependent on normal - good monsoons
Page 3
Water levels of major Indian river basins plummet, reflective of the sub-par monsoons in the past two years; hearteningly, India has seldom
experienced three sub-par monsoons on the trot, historically, raising hopes of a normal monsoon in FY17
Source: Central Water Commission, Spark Capital
Tractor volumes at their lowest 5 year ebb in FY16E; demand revival hinges overwhelmingly on favorable monsoon in FY17
233 265
314 303 305
403
482 537 528
634
551
487
-20%
-10%
0%
10%
20%
30%
40%
-
100
200
300
400
500
600
700
FY05 FY06 FY07 FY08 FY09 FY10 FY11 FY12 FY13 FY14 FY15 FY16E
Volumes (000's nos) Yoy growth (%)
72.6%67.2%
93.3%
44.3%
87.9%
35.9%67.2%47.5%
26.9%
69.9%
30.7% 33.8%
13.3%
77.2%
42.3%
60.0%
30.6%
0%
20%
40%
60%
80%
100%
Jul14 Oct14 Jan15 Mar15 Jul15 Oct15 Jan16 Mar16
Ganga Narmada Godavari Krishna Overall
Source: Industry, Spark Capital

The Indian Tractor Industry : Buckle up for more rough weather ahead
The Government has raised the MSPs in 2016 in a bid to revive flagging rural incomes
Source: GoI, Spark Capital
Reservoir levels especially in West & South a cause of concern; increasing MSPs a positive sign
Page 4
1,7101,762
1,886
2,134
2,7222,850 2,892 2,968
1,5571,668
1,784
2,164
2,4472,538 2,589
2,76546.7%
3.1%7.0%
13.2%
27.5%
4.7%1.5% 2.6%
4.5% 7.2% 7.0%
21.2%
13.1%
3.7% 2.0%
6.8%
0%
10%
20%
30%
40%
50%
1,500
1,800
2,100
2,400
2,700
3,000
2009 2010 2011 2012 2013 2014 2015 2016
Avg. Kharif MSP (Rs. Quintal) Avg. Rabi MSP (Rs. Quintal) YoY growth in Kharif MSP % YoY growth in Rabi MSP %
RegionNo. of
reservoirs
Filling position of 91 reservoirs w.r.t. Full reservoir levels as at 10, Mar 2016
100% 91%-99% 81%-90% 71%-80% 61%-70% 51%-60% 41%-50%40% &
belowDeparture from normal levels
North
(HP,Punjab & Rajasthan)6 - - - - - - - 6
HP: -19%; Punjab: -29%, Rajasthan: -
12%East
(Jharkhand,Odisha, Tripura &
W.Bengal)
15 - - - - - 4 3 8Jharkhand: -39%, Orissa: -10%, W.
Bengal:-21%
West
(Guj.& Mah.)27 - - - - - - 5 22 Gujarat: -39%, Maharashtra: -57%
Central
(MP,UP,Uttarakhand & Chh.)12 - - - - - 2 2 8
UP: -15%, Uttarakhand:-46%, MP: 33%
and Chattisgarh: -29%
South
(Karnataka,TN,AP & Kerala),31 - 1 - 1 - 1 2 26
AP: -1%; Telangana:-74%, Karnataka:-
34%, Kerala:-4% and TN: -42%
Overall 91 0 1 0 1 0 7 12 70

The Indian Tractor Industry : Buckle up for more rough weather ahead
Evaluating major factors related to Rural India
1. Monsoon
3. Minimum Support Price
4. FCI’s policy on foodgrains
5. Agri Exports
2. Agri Production
6. Rural wage growth
The worst Monsoon season in six years
with 14% rain deficit
El Nino is weakening; International
climate models suggest neutral 2H 2016
Rabi output fell 9.1% from last year
while Kharif output was down 3%
Rabi output to increase 4% while Kharif
output is likely to rise 3%
Only ~2% increase in MSP of Kharif and
Rabi crops
6.8% hike in MSP for Rabi - highest in 3
yrs, expect 5-8% hike in MSP for Kharif
FCI off-loaded rice and wheat in the
open markets to curb food inflation
Stopped offloading foodgrain stocks in
open markets
Agri exports contracted 27% during
Apr-Dec 2015
Given lower global food prices, agri
exports may continue to suffer in 2016
Rural nominal wage growth has been
muted at ~4% in 2015
No significant change vs. 2015; Rural
wage growth likely to be ~5% in 2016E
2015 2016
7. Govt rural spendMuted govt rural spend at 3.4% during
Apr-Dec 2015
Budget focus on more rural spend,
Expect 20% increase in FY17
8. Cheaper agri importsGlobal food prices fell 20% leading to
cheaper food imports in India
Govt twice hiked custom duty on wheat
after 8 yrs to protect Indian farmers
9. Construction activitiesWeak construction activities as new
home launches fell 30% in Dec quarter
Weak real estate related activities to be
a drag on non-farm rural economy
10. Wealth effect Negative wealth effect at the play as
land prices fell ~20% from the peak
Recent 20% surge in gold prices may
partially offset the -ve wealth effect
Page 5

The Indian Tractor Industry : Buckle up for more rough weather ahead
Zone% of volumes
YTD16FY11 FY12 FY13 FY14 FY15 FY16E
CAGR
(FY11-FY16)
North 24.0% 133,687 140,658 147,626 168,853 155,263 116,264 -2.8%
East 18.7% 74,696 75,933 83,989 103,907 91,492 91,155 4.1%
West 39.1% 178,175 217,670 221,627 275,137 224,504 188,496 1.1%
South 18.2% 93,821 100,420 73,650 85,034 79,126 90,287 -0.8%
Total 100% 480,379 534,681 526,892 632,931 550,385 486,202 0.2%
East and West Zone increase their share in volumes led by Bihar and Rajasthan, resp.; North and South dragged down by U.P. and T.N., resp.
Source: Industry, Spark Capital
27.8% 26.3% 28.0% 26.7% 28.2% 24.0% 23.9%
15.5% 14.2% 15.9% 16.4% 16.6% 18.7% 18.7%
37.1% 40.7%42.1% 43.5% 40.8% 39.1% 38.8%
19.5% 18.8% 14.0% 13.4% 14.4% 18.2% 18.6%
0%
10%
20%
30%
40%
50%
60%
70%
80%
90%
100%
FY11 FY12 FY13 FY14 FY15 YTD16 FY16E
North East West South
Tractor growth in East and West Zone has outperformed the rest of the country over the last 5 years
Page 6
Source: Industry, Spark Capital

The Indian Tractor Industry : Buckle up for more rough weather ahead
State Zone
% of
volumes
YTD16
FY11 FY12 FY13 FY14 FY15 FY16ECAGR
(FY11-FY16)
U.P. North 14.5% 76,981 82,613 84,553 95,660 92,235 70,507 -1.7%
Rajasthan West 12.7% 35,173 53,175 63,275 74,920 64,565 60,530 11.5%
M.P West 9.8% 48,435 50,640 70,815 87,835 63,763 47,203 -0.5%
A.P South 8.5% 44,110 41,958 30,784 44,163 37,028 42,640 -0.7%
Maharashtra West 8.5% 53,616 57,191 44,405 65,631 49,840 41,191 -5.1%
Gujarat West 8.1% 40,951 56,664 43,132 46,751 46,336 39,572 -0.7%
Bihar East 7.3% 27,244 29,162 34,857 40,437 36,092 34,979 5.1%
Karnataka South 6.6% 28,403 31,533 23,745 30,601 33,758 32,695 2.9%
Haryana North 4.5% 24,124 26,040 27,902 35,290 30,626 21,902 -1.9%
Punjab North 3.6% 26,620 25,987 28,234 30,187 26,077 17,545 -8.0%
Chhattisgarh East 3.5% 12,861 13,277 15,815 24,271 20,011 16,930 5.7%
Tamil Nadu South 3.0% 20,638 26,298 18,533 9,886 8,072 14,634 -6.6%
West Bengal East 2.6% 13,045 12,187 12,751 13,760 12,779 12,842 -0.3%
Orissa East 2.6% 11,134 9,233 9,210 12,125 10,878 12,677 2.6%
Others NA 4.3% 18,944 20,895 19,757 22,634 19,403 21,342 2.4%
Total 100% 482,279 536,853 527,768 634,151 551,463 487,189 0.2%
Amongst major states, Rajasthan, Bihar and Karnataka outperform; UP, Mah. and Punjab impacted the most
Page 7
Source: Industry, Spark Capital

The Indian Tractor Industry : Buckle up for more rough weather ahead
State
% of
volumes
YTD16
Major CropsSnippets of dealer interactions on recent happenings
and its impact on near term demand
Uttar
Pradesh 14.5%
Paddy, sugarcane, and
wheat
No hike in state-administered prices for sugarcane (stagnant at Rs.280/quintal), coupled with increasing
arrears of dues to be paid to farmers continue to act as constraints on cash flows. Also, the unseasonal
rains/hail in early March 2016 has flattened wheat crops (due for harvesting).
However, increase in paddy procurement by the FCI in the recent months is a positive sign.
Rajasthan 12.7%Wheat, gaur, soybean
and other pulses
Demand for gaur has significantly suffered on the back of fall in crude prices. (Gaur gum is used as a
thickening agent in the fracking process). Unseasonal rains in early March 2016 have damaged pulses
crops, particularly chana and standing wheat crops
M.P 9.8%
Wheat, soybean,
sugarcane, rice, maize
and cotton
The major produce of wheat and gram, as has been the case with most Northern and Central states has
been severely impacted on account of the unseasonal rains. Few dealers indicated vociferous agitations by
farmers in their networks demanding for government assistance to tide over the damages.
Maharashtra 8.5%Cotton, sugarcane,
groundnut and sunflower
Dealers in Maharashtra were particularly gloomy about demand prospects as compared to their pan-India
counterparts. Maharashtra faces its second consecutive year of drought with 278 out of 355 talukas
declared drought hit. Dealers in the sugarcane belt indicated that demand has worsened; however, the
demand indicators from dealers in the Vidarbha region was slightly more encouraging as the district was
impacted to a lesser degree by the drought. (Cotton production for the year is expected to register an
increase over the previous year.
Bihar 7.3%Rice, wheat, maize,
potato and pulses
Unseasonal rain and hail storm have caused extensive damage to standing rabi crops, particularly wheat.
masoor (lentils), khesari, pea, mustard and wheat. On a lighter vein, a few dealers indicated that the
government’s decision to classify the “Nilgais’’ as vermin and allow the culling of the same could afford
relife to farmers, on account of major damages done by the animal.
Haryana 4.5%Rice, jowar, bajra, maize,
wheat, and sugarcane
In addition to the common issue of unseasonal rains damaging wheat crop, dealers indicated an
improvement in mining activity on the back of e-auction of mineral mining licences in FY16. Though,
recently, the NGT has issued a notice issued notice to Haryana Govt to take action against illegal sand
mining in the Yamuna Belt. Dealers felt that the impact of the same on demand would not be significant.
Unseasonal rains/hail across major North and Central Indian states have expected to dampen near term tractor demand
Page 8
Source: Industry, Spark Capital

The Indian Tractor Industry : Buckle up for more rough weather ahead
State
% of
volumes
YTD16
Major CropsSnippets of dealer interactions on recent happenings
and its impact on near term demand
Orissa 2.6%Rice, pulses, and
potato
Dealers indicated lack of decisive policy making as an impediment with potato procurement prices not fixed as
yet even though the crop is ready for harvesting
A.P 8.5%
Rice, jowar, bajra,
maize, pulses,
castor, tobacco,
cotton and
sugarcane.
The unseasonal rain led to weaker food grains production in the region. Dealers indicated that unfavorable
prices in addition to rains impacted cotton produce 2015-16. However, tobacco production was supported by
higher global demand and increasing prices (over Rs.140 per kg) due to launch of e-auctioning facility. The AP
govt.’s initiative to interlink rivers and increasing farm ponds under the MNREGA are few positive takeaways to
which could improve the sentiment of farmers.
Punjab 3.6%
Barley, wheat, rice,
maize and
sugarcane.
In addition to the common issue of unseasonal rains damaging wheat crop, dealers indicated that crash in
prices of Basmati due to supply from other non-traditional basmati states impacted prices and farm income.
However, to the positive side, the below par potato crop in other parts of the country have boosted demand for
the rabi potato crop in Punjab, and is expected to favourably impact sentiment.
Gujarat 8.1%
Tobacco, cotton,
groundnuts, rice,
wheat, jowar, bajra
and maize
Attack of pink bollworms coupled with erratic rainfall has reduced cotton yield significantly in 2015-16, lowest in
last 10 years. Consecutive failures have led to decrease in cultivation area leading to fall in Y-o-Y produce of
cotton (8.6% decline), groundnut(4.2%), wheat(15.2%), jowar(58.3%), bajra(4.8%) and rice(31.6%).
Karnataka 6.6%
Rice, ragi, jowar,
maize, pulses,
cashews and
coconut,
Paddy suffered heavy losses in the last two years owing to crop destruction caused by floods and other climatic
fluctuations. Relative absence of mechanisation in jowar cultivation and harvest, coupled with shortage of
labour are also adding to the decline in cultivation. 64 sugar mills have produced 3.6 mt – about 0.2 mt higher
than the corresponding period last year.
West Bengal 2.6% Rice, Potato, Jute The paddy production was impacted by floods, while the rabi potato crop was impacted by unseasonal rains.
Tamil Nadu 3.0%
Paddy, maize,
sugarcane,
groundnut
Two consecutive droughts and the vagaries of the weather have added to the agrarian distress. Lower than
expected cane pricing and increasing acreage of cane production in neighbouring states is expected to reduce
acreage.
Unseasonal rains/hail across major North and Central Indian states have expected to dampen near term tractor demand
Page 9
Source: Industry, Spark Capital

The Indian Tractor Industry : Buckle up for more rough weather ahead
State
% of
volumes
YTD16
Irrigation
Intensity
% of
medium
and large
farmers Soil Type
% of
commercial
usage
% of > 40
HP
Punjab 4% 98% 91% Alluvial 15-20 86%
T.N. 3% 58% 39% Red & Yellow, Alluvial 35-40 87%
A.P. 9% 49% 45% Black, Red & Yellow, Alluvial 40-45 67%
Maharashtra 9% 20% 55% Black, Red & Yellow 30-35 57%
W. Bengal 3% 58% 19% Red & Yellow, Alluvial 60-65 76%
Karnataka 7% 33% 60% Black, Red & Yellow 25-30 59%
Haryana 5% 85% 77% Alluvial 25-30 57%
M.P 10% 34% 66% Black 15-20 59%
Rajasthan 13% 32% 84% Sandy, Alluvial & Black 30-35 44%
U.P. 15% 76% 36% Alluvial 25-30 49%
Orissa 3% 35% 30% Red & Yellow, Alluvial 70-75 48%
Chattisgarh 4% 28% 58% Red & Yellow 35-40 35%
Gujarat 8% 46% 71% Black, Alluvial 10-15 32%
Bihar 7% 62% 24% Alluvial 35-40 27%
Northern states most decoupled from monsoon vagaries ; good monsoon capable of sustaining farm incomes for a longer time
Snippets of interactions with dealers
Industry experts called for an increasing
penetration of irrigation facilities across India,
as a solution to the ills plaguing the tractor
industry. They indicate that irrigation intensity is
the only criterion that differentiates a farmer in
Punjab and UP from the rest of the country.
With assured farm income, a farmer in these
states
In states like Orissa and Bihar, characterised by
more than average land fragmentation, the
prevalence of higher HP tractors is on the back
of greater usage for non-agri purposes.
Dealers in Punjab, Haryana and UP indicated
that given the high irrigation intensity, a good
monsoon will sustain agricultural activities for a
longer period (recharging of ground water and
replenishment of reservoirs) compared to other
states on the back of the highly penetrate
irrigation network in these states.
Dealers explained the prevalence of higher HP
tractors in these states despite presence of
softer soil as being on account of greater
income certainty on the back of the irrigation
network.
Page 10
Source: Industry, Spark Capital

The Indian Tractor Industry : Buckle up for more rough weather ahead
India lags far behind globally in tractor penetration; wide disparity between states in tractor penetration
Country wise penetration of tractors (HP/hectare)
Source: Industry, Spark Capital
State wise penetration of tractors (HP/hectare)
Source: Industry, Spark Capital
9.8
8.27.6
7.0
4.5 4.1 4.1 3.7
2.0 1.9 1.6 1.61.1
0
2
4
6
8
10
12
W. G
erm
any
Italy
UK
Jap
an
Fra
nce
So
uth
Kore
a
Chin
a
Po
lan
d
US
A
Tu
rkey
Th
aila
nd
Vie
tnam
India
1.21.0
0.8
1.3
0.7
0.40.6
1.1
0.8
0.5
2.8
0.8
1.5
2.7
1.3
0.0
0.5
1.0
1.5
2.0
2.5
3.0
T.N
A.P
.
Ka
rnata
ka
Guja
rat
Chattis
garh
Jha
rkhand
Orissa
M.P
.
Ma
hara
sh
tra
W. B
engal
Pu
nja
b
Raja
sth
an
U.P
Hary
ana
Bih
ar
India lags significantly behind other
countries in the penetration of tractors, with
the tractor driver HP/Hectare at an abysmal
1.1.
India is impacted by fragmented land
holdings and low penetration of irrigation
facilities, which inhibits certainty of
agricultural income discouraging farmers
from using tractors as a major source of
power on farms.
Punjab and Haryana, which enjoy the
highest penetration of irrigation facilities in
the country, also have the highest
penetration of tractors.
Pulling down the national average are the
states of Maharashtra, West Bengal,
Karnataka, constrained by limited irrigation
penetration.
Page 11

The Indian Tractor Industry : Buckle up for more rough weather ahead
State wise irrigation intensity
Source: Industry, Spark Capital
Usage for non-agri purposes
Source: Industry, Spark Capital
98%
85%76%
62%58% 58%
49% 46%
34% 33%28%
35% 32%
20%
10%
0%
10%
20%
30%
40%
50%
60%
70%
80%
90%
100%
Pu
nja
b
Hary
ana
U.P
.
Bih
ar
T.N
.
W. B
engal
A.P
.
Guja
rat
M.P
Ka
rnata
ka
Chattis
garh
Orissa
Raja
sth
an
Ma
hara
sh
tra
Jha
rkhand
72.5%
62.5%
42.5% 37.5% 32.5%27.5%
17.5%12.5%
0.0%
10.0%
20.0%
30.0%
40.0%
50.0%
60.0%
70.0%
80.0%
90.0%
100.0%
Orissa
W. B
engal
A.P
.
Bih
ar
T.N
.
Chattis
garh
Raja
sth
an
Ma
hara
sh
tra
Ka
rnata
ka
Hary
ana
U.P
.
Pu
nja
b
M.P
.
Guja
rat
Besides the key northern states of
Punjab, Haryana and UP, the rest of
India lags significantly in the
penetration of irrigation facilities.
This in turn leaves theses states
entirely dependent on the monsoon,
exposing them to fluctuations in
agricultural output depending on the
vagaries of the monsoon.
It is conventionally believed that
~30% of the tractors are used in non-
agri purposes. Our channel checks
indicate that deploying of tractors for
non-agri use is not an option, but a
necessity if the farmer were to be
able to generate sufficient cash flows
to repay his loans.
The rate for non-agri use is estimated
at ~Rs.700/ day (assuming the tractor
is driven by the owner)
Penetration levels of irrigation leave a lot to be desired; non-agri usage of tractors has never been an option, but a need
Page 12

The Indian Tractor Industry : Buckle up for more rough weather ahead
TAFE and International Tractors gain significant share in the overall market; Escorts falters
Though the 41-50 HP seg. leads in volumes; our checks reveal that the 21-30 HP (within 0-30 HP) segment holds much promise
Source: Industry, Spark Capital
Note: Due to changes made in HP classification made in mid-FY13, data for & prior to FY13 is not comparable with FY14 and beyond
11% 11% 11%
35% 37% 37%
49% 47% 46%
5% 6% 7%
0%
20%
40%
60%
80%
100%
FY14 FY15 FY16E
Upto 30 hp 31-40 hp 41-50 hp 51 hp and above
Overall volumes: 41-50 HP is the largest HP segment; M&M manages to hold its fort amidst intensifying competition
HP
SegmentFY14 FY15 FY16E
CAGR
(FY14-
FY16)
0-30 70,794 59,411 49,462 -16%
31-40 223,085 202,281 170,851 -12%
41-50 286,286 251,627 215,160 -13%
>50 30,972 32,663 30,180 -1%
Total 6,11,137 5,45,982 4,65,653 -13%
Page 13
42.2% 41.8% 40.6% 41.0% 40.1% 41.5%
20.4% 23.3% 25.0% 24.8% 24.4% 23.2%
8.6% 8.3% 9.6% 10.3% 11.9% 11.8%13.2% 11.3% 11.6% 10.7% 10.4% 10.0%8.0% 7.5% 5.7% 5.9% 5.4% 6.2%
0%
20%
40%
60%
80%
100%
FY11 FY12 FY13 FY14 FY15 FY16E
Mahindra & Mahindra Ltd. TAFE International Tractors Ltd. Escorts Ltd. Johndeere New Holland India VST Others
Source: Industry, Spark Capital
Pan India, HP
and OEM
share

The Indian Tractor Industry : Buckle up for more rough weather ahead
Shift in Market share in major states
M&M and International tractors have made significant inroads in market share in this segment, Escorts loses big time
35.7% 36.5% 36.5% 37.5% 36.5% 39.0%
19.7% 22.8% 22.4% 21.8% 21.1% 18.7%
12.4% 12.0% 13.7% 14.5% 16.0% 15.9%20.7% 17.6% 16.7% 16.1% 15.7% 15.8%
0%
20%
40%
60%
80%
100%
FY11 FY12 FY13 FY14 FY15 FY16E
Mahindra & Mahindra Ltd. TAFE International Tractors Ltd. Escorts Ltd. Johndeere New Holland India VST Others
21% 17% 16% 17%
26%33% 34% 34%
36%40%
34%40%
FY11 FY14 FY15 YTD16
UP
Haryana
Punjab
23%26% 25%
23%
22% 21% 18% 14%
12%15% 14% 13%
21% 17% 16% 17%
25%18% 17% 18%
17%12% 14% 12%
10% 13% 14% 14%
8% 8% 9%
6%
15%16% 16%
18%
FY11 FY14 FY15 YTD16 FY11 FY14 FY15 YTD16 FY11 FY14 FY15 YTD16
M&M extends its lead in the North Zone, largest market by size; International tractors makes impressive gains
Page 14
Source: Industry, Spark Capital
North Zone

The Indian Tractor Industry : Buckle up for more rough weather ahead
Shift in Market share in major states
Source:: Industry, Spark Capital
East Zone Market share
50.0% 48.2% 47.3% 48.1% 47.9% 48.5%
16.1% 17.9% 19.5% 19.5% 17.8% 16.6%10.7% 11.0% 11.0% 11.9% 13.6% 14.7%11.5% 10.6% 10.5% 9.5% 9.8% 9.8%
0%
20%
40%
60%
80%
100%
FY11 FY12 FY13 FY14 FY15 FY16E
Mahindra & Mahindra Ltd. TAFE International Tractors Ltd. Escorts Ltd. Johndeere New Holland India Others
47%44%
45% 46%
49%47% 46% 46%
49%
52% 51% 51%
19%24% 22% 20%
19%
22%20% 19%
21% 18% 16% 16%
16%15%
14%15%
8%
6%7% 7%
4%
1% 2% 2%
53% 54%
51%52% 7%
7% 7%6%
14%8%
11% 10%
9% 11% 13% 13%
11% 11% 12% 13%
11% 12% 14% 14%
11%14% 16% 17%
Bihar
Chattisgarh
Orissa
WB
FY11 FY14 FY15 YTD16 FY11 FY14 FY15 YTD16 FY11 FY14 FY15 YTD16 FY11 FY14 FY15 YTD16
The East Zone is the fastest growing tractor market across India; International Tractors gains share from M&M and Escorts
Page 15
East Zone

The Indian Tractor Industry : Buckle up for more rough weather ahead
TAFE makes significant inroads in the share of M&M and Escorts in the West; International tractors gains as well
West Zone Market share
40.0% 40.1% 38.4% 38.4% 37.3% 36.5%
23.7% 26.9% 29.3% 28.8% 29.4% 30.0%
7.3% 6.7% 8.0% 8.8% 10.2% 10.5%12.6% 10.6% 11.0% 10.2% 9.4% 9.4%8.0% 6.6% 5.3% 5.2% 4.1% 4.6%
0%
20%
40%
60%
80%
100%
FY11 FY12 FY13 FY14 FY15 FY16E
Mahindra & Mahindra Ltd. TAFE International Tractors Ltd. Escorts Ltd. Johndeere New Holland India VST Others
Shift in Market share in major states
Source: Industry, Spark Capital:
42%43%
45%44%
36% 37%35%
33%
51%47%
46% 46%
28%30%
29% 27%
21%26% 26% 26%
8%11% 11% 11%
26%
30% 29% 29%
46% 46%47%
48%
9%
5% 5% 6%
17%13% 13% 13%
8%
5%3% 3%
17%15% 14% 13%
7% 9% 10% 10%
9% 11%14% 15%
7%10% 12% 13%
5% 5% 6% 6%
FY11 FY14 FY15 YTD16 FY11 FY14 FY15 YTD16 FY11 FY14 FY15 YTD16 FY11 FY14 FY15 YTD16
Gujarat
MP
Maharashtra
Rajasthan
Page 16
West Zone

The Indian Tractor Industry : Buckle up for more rough weather ahead
The 2nd fastest growing zone : South Zone saw TAFE extend share gains; only zone where Itnl. Tractors has lost share
South Zone Market share
50.2% 48.9% 48.4% 48.4% 46.9% 48.3%
18.6% 20.7% 23.0% 23.8% 24.0% 21.5%
14.6% 14.4% 10.2% 12.8% 11.4% 12.3%
0%
20%
40%
60%
80%
100%
FY11 FY12 FY13 FY14 FY15 FY16E
M&M TAFE Johndeere Itnl. Tractors Ltd. Escorts Ltd. New Holland India VST Others
Shift in Market share in major states
Source: Industry, Spark Capital:
52%
47% 47% 48%
46%
49%
46%48%
52%51%
53%
52%
20%25% 25% 23%
19%24% 25% 23%
15% 16% 18%16%
16%15%
14% 14%
14%11% 9% 9%
13%10% 9%
14%
10% 13% 14% 14%
8% 8% 9%
6%
15%16% 16%
18%
FY11 FY14 FY15 YTD16 FY11 FY14 FY15 YTD16 FY11 FY14 FY15 YTD16 FY11 FY14 FY15 YTD16
AP
Karnataka
Tamilnadu
Page 17
South Zone
The Indian Tractor Industry : Buckle up for more rough weather ahead
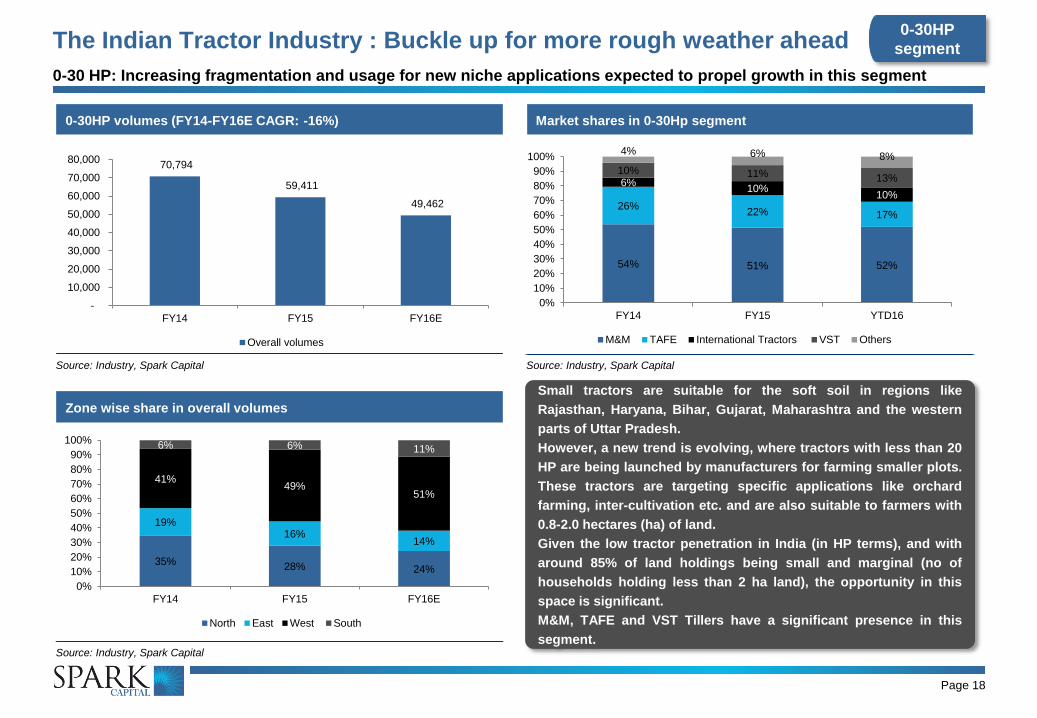
0-30 HP: Increasing fragmentation and usage for new niche applications expected to propel growth in this segment
0-30HP volumes (FY14-FY16E CAGR: -16%)
Source: Industry, Spark Capital
Market shares in 0-30Hp segment
Source: Industry, Spark Capital
54% 51% 52%
26%22% 17%
6%10%
10%
10% 11% 13%
4% 6% 8%
0%
10%
20%
30%
40%
50%
60%
70%
80%
90%
100%
FY14 FY15 YTD16
M&M TAFE International Tractors VST Others
Small tractors are suitable for the soft soil in regions like
Rajasthan, Haryana, Bihar, Gujarat, Maharashtra and the western
parts of Uttar Pradesh.
However, a new trend is evolving, where tractors with less than 20
HP are being launched by manufacturers for farming smaller plots.
These tractors are targeting specific applications like orchard
farming, inter-cultivation etc. and are also suitable to farmers with
0.8-2.0 hectares (ha) of land.
Given the low tractor penetration in India (in HP terms), and with
around 85% of land holdings being small and marginal (no of
households holding less than 2 ha land), the opportunity in this
space is significant.
M&M, TAFE and VST Tillers have a significant presence in this
segment.
70,794
59,411
49,462
-
10,000
20,000
30,000
40,000
50,000
60,000
70,000
80,000
FY14 FY15 FY16E
Overall volumes
Zone wise share in overall volumes
Source: Industry, Spark Capital
35%28% 24%
19%16%
14%
41%49%
51%
6% 6% 11%
0%
10%
20%
30%
40%
50%
60%
70%
80%
90%
100%
FY14 FY15 FY16E
North East West South
Page 18
0-30HP
segment

The Indian Tractor Industry : Buckle up for more rough weather ahead
State wise share in 0-30 HP segment – North
Source: Industry, Spark Capital
60% 57% 55%
27% 29% 31%
10% 11% 10%
3% 3% 4%
0%
10%
20%
30%
40%
50%
60%
70%
80%
90%
100%
FY14 FY15 YTD16
UP Haryana Punjab Others
24,704
16,621
11,976
-
5,000
10,000
15,000
20,000
25,000
30,000
FY14 FY15 FY16E
North Zone total volumes
North Zone volumes (FY14-FY16E CAGR: -30%)
Source: Industry, Spark Capital
State wise share in 0-30 HP segment - East
Source: Industry, Spark Capital
East Zone volumes (FY14-FY16E CAGR: -28%)
Source: Industry, Spark Capital
55% 57% 62%
25% 24% 19%
5% 6% 9%7% 8% 7%
0%
10%
20%
30%
40%
50%
60%
70%
80%
90%
100%
FY14 FY15 YTD16
Bihar Chattisgarh West Bengal Jharkhand Orissa Assam
13,179
9,773
6,914
-
2,000
4,000
6,000
8,000
10,000
12,000
14,000
FY14 FY15 FY16E
East Zone total volumes
0-30 HP: Increasing fragmentation and usage for new niche applications expected to propel growth in this segment
Page 19
0-30HP
segment

The Indian Tractor Industry : Buckle up for more rough weather ahead
State wise share in 0-30 HP segment – West
Source: Industry, Spark Capital
West Zone volumes (FY14-FY16E CAGR: -7%)
Source: Industry, Spark Capital
State wise share in 0-30 HP segment - South
Source: Industry, Spark Capital
South Zone volumes (FY14-FY16E CAGR: +15%)
Source: Industry, Spark Capital
30% 37% 35%
11%5% 5%
47% 51% 54%
12% 7% 6%
0%
10%
20%
30%
40%
50%
60%
70%
80%
90%
100%
FY14 FY15 YTD16
Gujarat M.P. Maharashtra Rajasthan
28,686 29,176
24,980
22,000
23,000
24,000
25,000
26,000
27,000
28,000
29,000
30,000
FY14 FY15 FY16E
West Zone total volumes
4,225 3,841
5,592
-
1,000
2,000
3,000
4,000
5,000
6,000
FY14 FY15 FY16E
South Zone total volumes
24%16%
26%
43%75% 62%
1%
1% 1%33%
8% 11%
0%
10%
20%
30%
40%
50%
60%
70%
80%
90%
100%
FY14 FY15 YTD16
A.P. Karnataka Kerala T.N.
0-30 HP: Increasing fragmentation and usage for new niche applications expected to propel growth in this segment
Page 20
0-30HP
segment
The Indian Tractor Industry : Buckle up for more rough weather ahead
31-40 HP volumes (FY14-FY16E CAGR: -12%)
Source: Industry, Spark Capital
37% 36% 39%
30% 30% 30%
12% 13% 12%14% 14% 13%
1% 1% 1%
0%
20%
40%
60%
80%
100%
FY14 FY15 YTD16
M&M TAFE International Tractors
Escorts John Deere New Holland
Others
Market shares in 30-40Hp segment
Source: Industry, Spark Capital
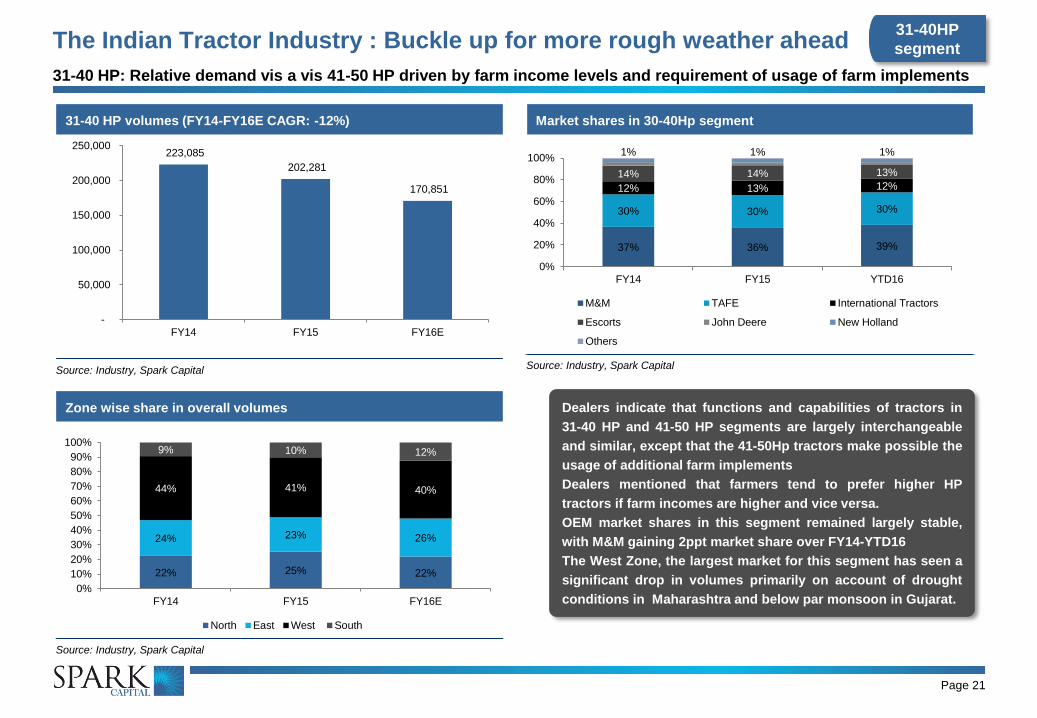
Dealers indicate that functions and capabilities of tractors in
31-40 HP and 41-50 HP segments are largely interchangeable
and similar, except that the 41-50Hp tractors make possible the
usage of additional farm implements
Dealers mentioned that farmers tend to prefer higher HP
tractors if farm incomes are higher and vice versa.
OEM market shares in this segment remained largely stable,
with M&M gaining 2ppt market share over FY14-YTD16
The West Zone, the largest market for this segment has seen a
significant drop in volumes primarily on account of drought
conditions in Maharashtra and below par monsoon in Gujarat.
Zone wise share in overall volumes
Source: Industry, Spark Capital
22% 25% 22%
24% 23% 26%
44% 41% 40%
9% 10% 12%
0%
10%
20%
30%
40%
50%
60%
70%
80%
90%
100%
FY14 FY15 FY16E
North East West South
223,085
202,281
170,851
-
50,000
100,000
150,000
200,000
250,000
FY14 FY15 FY16E
31-40 HP: Relative demand vis a vis 41-50 HP driven by farm income levels and requirement of usage of farm implements
Page 21
31-40HP
segment

The Indian Tractor Industry : Buckle up for more rough weather ahead
State wise share in 31-40 HP segment – North – Put CAGR
Source: Industry, Spark Capital
North Zone volumes (FY14-FY16E CAGR: -13%)
Source: Industry, Spark Capital
State wise share in 31-40 HP segment - East
Source: Industry, Spark Capital
East Zone volumes (FY14-FY16E CAGR: -10%)
Source: Industry, Spark Capital
50,074 51,291
37,583
-
10,000
20,000
30,000
40,000
50,000
60,000
FY14 FY15 FY16E
54,478
47,484 44,350
-
10,000
20,000
30,000
40,000
50,000
60,000
FY14 FY15 FY16E
75% 77% 78%
17% 16% 15%
0%
10%
20%
30%
40%
50%
60%
70%
80%
90%
100%
FY14 FY15 YTD16
U.P. Haryana Punjab Others
44% 45% 45%
22% 22% 21%
11% 13% 13%
12% 13% 13%
0%
10%
20%
30%
40%
50%
60%
70%
80%
90%
100%
FY14 FY15 YTD16
Bihar Chattisgarh Others Jharkhand Others
31-40 HP: Relative demand vis a vis 41-50 HP driven by farm income levels and requirement of usage of farm implements
Page 22
31-40HP
segment

The Indian Tractor Industry : Buckle up for more rough weather ahead
State wise share in 31-40 HP segment – West– Put CAGR
Source: Industry, Spark Capital
West Zone volumes (FY14-FY16E CAGR: -17%)
Source: Industry, Spark Capital
State wise share in 31-40 HP segment - South
Source: Industry, Spark Capital
South Zone volumes (FY14-FY16E CAGR: +1%)
Source: Industry, Spark Capital
97,689
82,990
67,594
-
20,000
40,000
60,000
80,000
100,000
120,000
FY14 FY15 FY16E
20,844
20,516
21,324
20,000
20,200
20,400
20,600
20,800
21,000
21,200
21,400
FY14 FY15 FY16E
22% 23% 25%
37% 33% 25%
6%5%
5%
35% 39% 45%
0%
10%
20%
30%
40%
50%
60%
70%
80%
90%
100%
FY14 FY15 YTD16
Gujarat M.P. Maharashtra Rajasthan
58%50% 54%
38% 46% 41%
4% 3% 5%
0%
10%
20%
30%
40%
50%
60%
70%
80%
90%
100%
FY14 FY15 YTD16
A.P Karnataka T.N. Kerala
31-40 HP: Relative demand vis a vis 41-50 HP driven by farm income levels and requirement of usage of farm implements
Page 23
31-40HP
segment

The Indian Tractor Industry : Buckle up for more rough weather ahead
43% 43% 44%
23% 23% 22%
7% 9% 10%11% 10% 10%8% 7% 7%1% 1% 1%
0%
20%
40%
60%
80%
100%
FY14 FY15 YTD16
M&M TAFE International Tractors
Escorts John Deere New Holland
Others
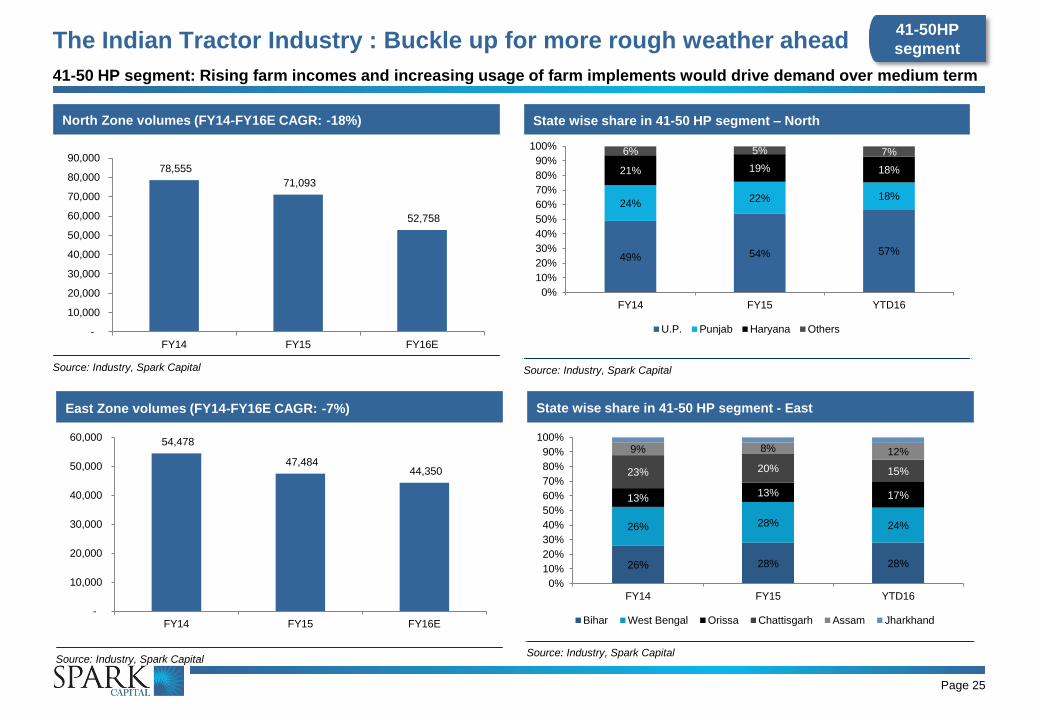
41-50 HP segment: Rising farm incomes and increasing usage of farm implements would drive demand over medium term
41-50 HP volumes (FY14-FY16E CAGR: -13%)
Source: Industry, Spark Capital
Market shares in 41-50 HP segment
Source: Industry, Spark Capital
Zone wise share in overall volumes
Source: Industry, Spark Capital
22% 25% 22%
24% 23% 26%
44% 41% 40%
9% 10% 12%
0%
10%
20%
30%
40%
50%
60%
70%
80%
90%
100%
FY14 FY15 FY16E
North East West South
286,286
251,627
215,160
-
50,000
100,000
150,000
200,000
250,000
300,000
350,000
FY14 FY15 FY16E
Demand for 41-50 HP segment tractors have a direct
correlation with rising farm incomes (if incomes are lower, then
31-40Hp tractors are preferred).
Also, 41-50HP tractors enables the usage of a wide array of
farm implements , which would gain traction over the medium
term as farm mechanisation levels improve.
International Tractors was the largest gainer of market share in
this segment, gaining share from OEMs across the board.
The West Zone, the largest market for this segment has seen a
significant drop in volumes primarily on account of drought
conditions in Maharashtra and below par monsoon in Gujarat
Page 24
41-50HP
segment
The Indian Tractor Industry : Buckle up for more rough weather ahead
State wise share in 41-50 HP segment – North
Source: Industry, Spark Capital
North Zone volumes (FY14-FY16E CAGR: -18%)
Source: Industry, Spark Capital
State wise share in 41-50 HP segment - East
Source: Industry, Spark Capital
East Zone volumes (FY14-FY16E CAGR: -7%)
Source: Industry, Spark Capital
78,555
71,093
52,758
-
10,000
20,000
30,000
40,000
50,000
60,000
70,000
80,000
90,000
FY14 FY15 FY16E
54,478
47,484 44,350
-
10,000
20,000
30,000
40,000
50,000
60,000
FY14 FY15 FY16E
49% 54% 57%
24%22% 18%
21% 19% 18%
6% 5% 7%
0%
10%
20%
30%
40%
50%
60%
70%
80%
90%
100%
FY14 FY15 YTD16
U.P. Punjab Haryana Others
26% 28% 28%
26% 28% 24%
13%13% 17%
23% 20% 15%
9% 8% 12%
0%
10%
20%
30%
40%
50%
60%
70%
80%
90%
100%
FY14 FY15 YTD16
Bihar West Bengal Orissa Chattisgarh Assam Jharkhand
41-50 HP segment: Rising farm incomes and increasing usage of farm implements would drive demand over medium term
Page 25
41-50HP
segment

The Indian Tractor Industry : Buckle up for more rough weather ahead
State wise share in 41-50 HP segment – West
Source: Industry, Spark Capital
West Zone volumes (FY14-FY16E CAGR: -17%)
Source: Industry, Spark Capital
State wise share in 41-50 HP segment - South
Source: Industry, Spark Capital
South Zone volumes (FY14-FY16E CAGR: -5%)
Source: Industry, Spark Capital
97,689
82,990
67,594
-
20,000
40,000
60,000
80,000
100,000
120,000
FY14 FY15 FY16E
55,564
50,060 50,458
47,000
48,000
49,000
50,000
51,000
52,000
53,000
54,000
55,000
56,000
FY14 FY15 FY16E
11% 15% 13%
33% 32% 30%
30% 26% 25%
26% 28% 31%
0%
10%
20%
30%
40%
50%
60%
70%
80%
90%
100%
FY14 FY15 YTD16
Gujarat M.P. Maharashtra Rajasthan
52% 49% 47%
34% 38%32%
13% 13%21%
0%
10%
20%
30%
40%
50%
60%
70%
80%
90%
100%
FY14 FY15 YTD16
A.P Karnataka T.N. Kerala
41-50 HP segment: Rising farm incomes and increasing usage of farm implements would drive demand over medium term
Page 26
41-50HP
segment

The Indian Tractor Industry : Buckle up for more rough weather ahead
> 50 HP segment – a niche segment with limited applications in non-agri segment; growth expected to be muted
>50HP volumes (FY14-FY16E CAGR: -1%)
Source: Industry, Spark Capital
Market shares in >50HP segment
Source: Industry, Spark Capital
Zone wise share in overall volumes
Source: Industry, Spark Capital
22% 25% 22%
24% 23% 26%
44% 41% 40%
9% 10% 12%
0%
10%
20%
30%
40%
50%
60%
70%
80%
90%
100%
FY14 FY15 FY16E
North East West South
30,972
32,663
30,180
28,500
29,000
29,500
30,000
30,500
31,000
31,500
32,000
32,500
33,000
FY14 FY15 FY16E
18% 16%27%
24% 26%26%
36% 31%23%
13% 12% 10%
6% 10% 5%2% 3% 5%
0%
20%
40%
60%
80%
100%
FY14 FY15 YTD16
John Deere M&M International Tractors
New Holland Escorts TAFE
Others
Dealers indicated that the market for the >50HP segment is
expected to remain limited as for Indian conditions, a 41-50HP
tractor is more amenable and versatile with capabilities of
being used in the non-agro segment as well.
Also, the price gap between a 41-50HP segment and >50 HP
segment was indicated as being significant to convince
farmers to purchase the latter.
John Deere was the largest gainer of market share in this
segment, gaining share particularly from International tractors.
Page 27
>50HP
segment

The Indian Tractor Industry : Buckle up for more rough weather ahead
State wise share in >50 HP segment – North – Put CAGR
Source: Industry, Spark Capital
North Zone volumes (FY14-FY16E CAGR: -5%)
Source: Industry, Spark Capital
State wise share in >50HP segment - East
Source: Industry, Spark Capital
East Zone volumes (FY14-FY16E CAGR: +16%)
Source: Industry, Spark Capital
15,520
16,256
13,947
12,500
13,000
13,500
14,000
14,500
15,000
15,500
16,000
16,500
FY14 FY15 FY16E
2,713
3,226
3,637
-
500
1,000
1,500
2,000
2,500
3,000
3,500
4,000
FY14 FY15 FY16E
41% 41% 39%
30% 30% 32%
25% 26% 24%
4% 4% 6%
0%
10%
20%
30%
40%
50%
60%
70%
80%
90%
100%
FY14 FY15 YTD16
Punjab U.P. Haryana Others
28% 34%47%
42% 35%27%
12% 14% 11%
12% 9% 8%
6% 7% 8%
0%
10%
20%
30%
40%
50%
60%
70%
80%
90%
100%
FY14 FY15 YTD16
West Bengal Chattisgarh Bihar Orissa Others
> 50 HP segment – a niche segment with limited applications in non-agri segment; growth expected to be muted
Page 28
>50HP
segment

The Indian Tractor Industry : Buckle up for more rough weather ahead
State wise share in >50 HP segment – West– Put CAGR
Source: Industry, Spark Capital
West Zone volumes (FY14-FY16E CAGR: -5%)
Source: Industry, Spark Capital
State wise share in >50 HP segment - South
Source: Industry, Spark Capital
South Zone volumes (FY14-FY16E CAGR: 8%)
Source: Industry, Spark Capital
8,338
8,500
7,457
6,800
7,000
7,200
7,400
7,600
7,800
8,000
8,200
8,400
8,600
FY14 FY15 FY16E
4,401
4,681
5,139
4,000
4,200
4,400
4,600
4,800
5,000
5,200
FY14 FY15 FY16E
12% 12% 17%
32% 29%34%
41% 45%32%
15% 14% 17%
0%
10%
20%
30%
40%
50%
60%
70%
80%
90%
100%
FY14 FY15 YTD16
Gujarat M.P. Maharashtra Rajasthan
46%37% 42%
43%51%
32%
11% 11%25%
0%
10%
20%
30%
40%
50%
60%
70%
80%
90%
100%
FY14 FY15 YTD16
A.P Karnataka T.N. Kerala
> 50 HP segment – a niche segment with limited applications in non-agri segment; growth expected to be muted
Page 29
>50HP
segment

The Indian Tractor Industry : Buckle up for more rough weather ahead
OEM sales by HP category
M&M: While 41-50HP is the major segment, increasing focus on 0-
30 HP segment
Source: Industry, Spark Capital
International Tractors Ltd: Increasing focus on 41-50HP and 0-30HP
Source: Industry, Spark Capital
40%31% 33% 34%
42%51% 49% 48%
8% 3% 4% 4%
10% 15% 14% 13%
0%
10%
20%
30%
40%
50%
60%
70%
80%
90%
100%
FY13 FY14 FY15 YTD16
31-40 hp 41-50 hp 51 hp and above Upto 30 hp
43% 41% 40% 39%
30% 35% 36% 38%
21% 17% 16% 14%
6% 7% 9% 9%
0%
10%
20%
30%
40%
50%
60%
70%
80%
90%
100%
FY13 FY14 FY15 YTD16
31-40 hp 41-50 hp 51 hp and above Upto 30 hp
Page 30
In a bid to tap the growing tractor rental business in India,
Mahindra & Mahindra (M&M), has set up of a new startup
venture called Trringo, the first ever organised rental service
for the sector.
Based on a franchisee model aimed at increasing farm
mechanisation levels in India through easy availability of
tractors to farmers who cannot afford to purchase them,
Trringo would use technology to create a sharing
infrastructure in the deep rural pockets of India.
Commenced operations at its new plant at Hoshiarpur, Punjab,
with an installed capacity of 200,000 units p.a. (up from current
capacities of 65,000 units p.a., which would be discontinued)
Claimed to be the world’s largest integrated unit, the plant is
expected to enhance the company’s reach in the South andin
the export markets.
It plans to introduce five products for TN (and South) , the GT
26, GT 30 for sugarcane and orchard farms and the DI 750,
Rx750 and the Rx47 – four-wheel drive models for puddling
and haulage applications.
Also plans to launch a 250 HP tractor next year in the global
markets.
Recent updates
OEM
updates

The Indian Tractor Industry : Buckle up for more rough weather ahead
OEM sales by HP category
Escorts: More focussed on the Big tractor segments (>40HP)
Source: Industry, Spark Capital
TAFE: Focussing big on the 41-50HP segment
Source: Industry, Spark Capital
63%
43% 45% 47%
21%45% 45% 44%
0%0% 1% 1%17%
12% 10% 8%
0%
10%
20%
30%
40%
50%
60%
70%
80%
90%
100%
FY13 FY14 FY15 YTD16
31-40 hp 41-50 hp 51 hp and above Upto 30 hp
44% 47% 50% 47%
51% 50% 43% 47%
3% 3% 6% 4%
0%
10%
20%
30%
40%
50%
60%
70%
80%
90%
100%
FY13 FY14 FY15 YTD16
31-40 hp 41-50 hp 51 hp and above Upto 30 hp
Page 31
No recent tractor segment specific updates
Escorts recently launching a new category of tractors called
“ANTI LIFT TRACTORS. specifically for commercial haulage
operators, are available in two models: ALT 4000 and ALT 3500,
in 37HP and 41 HP
Recent updates
OEM
updates

The Indian Tractor Industry : Buckle up for more rough weather ahead
New Holland: Volumes derived primarily from the 41-50Hp segment
Source: Company, Spark Capital
John Deere: The biggest >51HP player; expected to increase focus
on lower HP segments
Source: Company, Spark Capital
22% 21% 24% 25%
64% 67% 61% 58%
14% 12% 15% 17%
0%
10%
20%
30%
40%
50%
60%
70%
80%
90%
100%
FY13 FY14 FY15 YTD16
31-40 hp 41-50 hp 51 hp and above
25% 20% 18% 16%
55% 65% 64%54%
20% 15% 18%30%
0%
10%
20%
30%
40%
50%
60%
70%
80%
90%
100%
FY13 FY14 FY15 YTD16
31-40 hp 41-50 hp 51 hp and above
OEM sales by HP category
Page 32
Tractor maker John Deere India is aiming for a 10 per cent
jump in exports at 27,500 units this fiscal on likely increase in
demand for its new models in countries like the US and
Thailand.
Industry sources indicated that on the back of slowing demand
in India, it is expected that one of its plants near Pithampur is
expected to cater almost entirely to the export markets .
Tractors with advanced features which are now being exported
are expected to be introduced domestically over the medium
term
No recent tractor segment specific updates
Recent updates
OEM
updates

The Indian Tractor Industry : Buckle up for more rough weather ahead
Existing models across HP categories
Upto 20 HP
Yuvraj 15HP Shakti Mt 180D
Shakti Mt 180D - Jai
21 to 30 HP
Mahindra 245 DI MF 1030 Baaghban Shakti VT 224 - Ajai Powertrac Diesel Saver
Mahindra 255 DI DI 730 Shakti MT 270 - Viraat
Mahindra 265 DI (New) Shakti VT 224
31 to 40 HP
Mahindra 265 Power MF 1035 DI 734 3032 5036 Farmtrac XP
Mahindra 275 ECO TAFE 35 DI 35 3030 5039 Powertrac DS Plus
Mahindra 275 DI Eicher 333 3510 5038
Mahindra 295 Eicher 364 3037
Mahindra 415 (New) Eicher 368 4010
Swaraj 735
41 to 50 HP
Mahindra 475 MF 241 DI 740 3230 5041 Farmtrac Jai Kisan
Mahindra 575 MF 7250 DI 745 4510 5042 Powertrac Euro Series
Mahindra 595 MF 245 DI 42 4710 5045
Arjun 555 MF 5245 DI 47 3600 5050
TAFE 45 3630
Eicher 480
Eicher 485
Eicher 5150
Eicher 5660
>50 HP
Arjun Novo 605 MF 5245 DI 750 3630 (SPL) 5055 5055 Farmtrac Executive
Arjun International MF 9000 DI 60 5500 5310 5310
Mahindra 555 MF 9500 Worldtrac 75 6500 5060 5060
Arjun Novo 605 4WD
(New)TAFE 5450 Worldtrac 90 7500 5065 5065
Page 33

The Indian Tractor Industry : Buckle up for more rough weather ahead
Change in estimates – M&M and VST Tillers
Page 34Page 34
Volume estimates FY16E FY17E FY18E
Volume YoY % Volume YoY % Volume YoY %
Power Tillers 27,000 17% 31,051 15% 34,777 12%
Tractors 7,400 11% 8,880 20% 10,390 17%
Volume Estimates
FY15 FY16E FY17E FY18E
Automotive 4,64,842 488,109 595,545 659,544
% growth -8% 5% 22% 11%
Farm Equipment - tractor segment 236,426 212,269 222,089 249,156
% growth -12% -10% 5% 12%
TOTAL 701,268 700,378 817,633 908,700
% growth -9.0% 0% 17% 11%
SOTP Valuation
Basis
Mar’18PAT/
Market Cap
(Rs. mn)
PE (x)Discount
(%)
Eq Value
(Rs. mn)
Rs. per
share
M&M + MVML Core PAT 41,176 14x - 576,464 928
Listed subsidiaries &
holdings
Market Cap
/ book value308,485 20% 246,788 396
1,325
VST Tillers & Tractors
Mahindra & Mahindra (M&M + MVML)
Key estimate revision
FY17E FY18E
Old New Change Old New Change
Revenue 441,888 434,537 -1.7% 498797 490,194 -1.7%
EBITDA 58,329 56,490 -3.2% 65,841 64,706 -1.7%
Margin (%) 13.20% 13.0% -20 bps 13.20% 13.20% 0 bps
PAT 37,984 36,633 -3.6% 44,060 43,226 -1.9%
PAT Margin 8.60% 8.43% -17 bps 8.83% 8.82% -1 bps
EPS 61.7 59.0 -3.6% 71.5 69.6 -1.9%
All figures in Rs. mn, except EPS, which is in Rs.
Key estimate revision
FY16E FY17E
Old New Change Old New Change
Revenue 6,329 6,329 n/a 7,508 7,508 n/a
EBITDA 1,125 1,125 n/a 1,336 1,336 n/a
Margin (%) 17.8% 17.8% n/a 17.8% 17.8% n/a
PAT 736 736 n/a 884 884 n/a
PAT Margin 11.6% 11.6% n/a 11.8% 11.8% n/a
EPS 85.2 85.2 n/a 102.3 102.3 n/a
All figures in Rs. mn, except EPS, which is in Rs.

The Indian Tractor Industry : Buckle up for more rough weather ahead
Financial summary – VST Tillers
Page 35
Abridged Financial Statements - Standalone Key metrics
Rs. mn FY15 FY16E FY17E FY18E FY15 FY16E FY17E FY18E
Profit & Loss Growth ratios
Revenues 5,516 6,329 7,508 8,679 Revenues -12% 15% 19% 16%
Manufacturing & Other Expenses 4,514 5,204 6,171 7,134 EBITDA -17% 12% 19% 16%
EBITDA 1,002 1,125 1,336 1,545 PAT -16% 6% 20% 16%
Depreciation 94 116 131 149 Margins
EBIT 908 1,009 1,205 1,396 EBITDA 18.2% 17.8% 17.8% 17.8%
Net Interest Exp / (inc) 21 22 22 22 EBIT 16.5% 15.9% 16.1% 16.1%
Profit Before Tax 1,005 1,083 1,300 1,507 PAT 12.6% 11.6% 11.8% 11.8%
Tax 311 347 416 482 Leverage & WC ratios
Adj. Net Profit 694 736 884 1,024 Debt to equity (x) - - - -
Balance Sheet (Rs. mn) Current ratio (x) 2.1 2.4 2.4 2.4
Shareholders Equity 3,635 4,207 4,893 5,688 Debtor days (Sales) 62 63 63 63
Loan funds - - - - Inventory days (COGS) 66 72 72 72
Deferred Tax Liability (Net) 47 46 46 46 Creditor Days (COGS) 56 51 51 50
Sources of Funds 3,683 4,253 4,939 5,734 Performance & turnover ratios
Net block 1,347 1,421 1,590 1,741 RoCE 20.7% 18.9% 19.6% 19.5%
Capital WIP 21 - - - RoAE 20.5% 18.8% 19.4% 19.4%
Current assets, loans & advances 2,402 2,762 3,479 4,290 Total asset turnover (x) 1.4 1.4 1.4 1.4
Current liabilities & provisions 1,039 1,095 1,294 1,461 Fixed asset turnover (x) 3.2 3.3 3.4 3.5
Net Current Assets 1,363 1,667 2,184 2,829 Valuation metrics
Application of funds 3,683 4,253 4,939 5,734 Current price (Rs.)
Cash Flows (Rs. mn) Shares outstanding (mn) 8.6 8.6 8.6 8.6
Cash flows from operations 260 499 746 876 Market capitalisation (Rs. mn) 13,175 13,175 13,175 13,175
Capex (227) (170) (300) (300) Enterprise value (Rs. mn) 12,991 13,031 12,750 12,373
Free Cash Flow 32 329 446 576 EV/EBIDTA (x) 13.0 11.6 9.5 8.0
Cash flows from investments (129) (382) (300) (300) Adj. Per-share earnings (Rs.) 80.3 85.2 102.3 118.6
Cash flows from financing (173) (156) (165) (198) Price-earnings multiple (x) 19.0 17.9 14.9 12.9
Closing cash and cash equivalents 179 144 425 803 Dividend yield (%) 1.0% 1.0% 1.3% 1.5%
1525

The Indian Tractor Industry : Buckle up for more rough weather ahead
Financial summary – M&M
Page 36
Abridged Financial Statements (M&M + MVML) Key metrics
Rs. mn FY15 FY16E FY17E FY18E FY15 FY16E FY17E FY18E
Revenues 372,236 383,445 434,537 490,194 Revenues -4.1% 3.0% 13.3% 12.8%
Manufacturing & Other Expenses 326,203 331,609 378,047 425,488 EBITDA -12.3% 12.6% 9.0% 14.5%
EBITDA 46,033 51,836 56,490 64,706 PAT -18.4% 5.2% 9.2% 18.0%
Depreciation 10,980 11,904 13,332 14,415
EBIT 46,611 47,969 51,998 60,015 EBITDA 12.4% 13.5% 13.0% 13.2%
Interest Exp / (inc) 3,039 2,304 2,138 1,181 EBIT 12.5% 12.5% 12.0% 12.2%
Profit Before Tax 43,572 45,664 49,860 58,834 PAT 8.6% 8.7% 8.4% 8.8%
Tax 9,339 12,114 13,228 15,608 Leverage & WC ratios
Adj. Net Profit 31,883 33,550 36,633 43,226 Debt to equity (x) 0.2 0.2 0.1 0.0
Current ratio (x) 1.2 1.2 1.2 1.2
Shareholders Equity 198,769 222,004 248,322 281,233 Debtor days (Sales) 24 25 25 25
Loan funds 30,382 35,000 22,000 9,500 Inventory days (COGS) 40 50 45 45
Sources of funds 229,152 257,004 270,322 290,733 Creditor Days (COGS) 83 90 85 85
Net block 79,019 87,115 93,783 99,368 Performance & turnover ratios
Investments 104,133 112,133 120,133 128,133 RoACE 17.0% 16.0% 14.7% 16.0%
Capital WIP 21,788 26,788 31,788 31,828 RoAE 17.1% 15.9% 15.6% 16.3%
Current assets, loans & advances 145,528 155,350 158,446 178,196 Total asset turnover (x) 1.2 1.2 1.2 1.3
Current liabilities & provisions 121,316 124,381 133,827 146,791 Fixed asset turnover (x) 3.9 3.6 3.6 3.8
Net Current Assets 24,212 30,969 24,619 31,405 Valuation metrics
Application of funds 229,152 257,004 270,322 290,733 Current price (Rs.)
Shares outstanding (mn) 621 621 621 621
Cash flows from operations 57,171 43,009 55,004 61,410 Market capitalisation (Rs. mn) 761,411 761,411 761,411 761,411
Capex (20,346) (25,000) (25,000) (20,040) Enterprise value (Rs. mn) 770,740 773,470 762,829 739,782
Free cashflow 20,975 10,009 22,004 33,370 EV/EBIDTA (x) 16.7 14.9 13.5 11.4
Cash flows from investments 7,436 (33,000) (33,000) (28,040) Per-share earnings (Rs.) 51.8 54.5 59.5 70.2
Cash flows from financing (22,054) (8,121) (24,363) (22,823) Price-earnings multiple (x) 23.7 22.5 20.6 17.5
Cash at the end of the year 21,053 22,941 20,582 31,129 Dividend yield (%) 1.1% 1.1% 1.1% 1.1%
Profit & Loss Growth ratios
Margins
Balance Sheet (Rs. mn)
Cash Flows (Rs. mn)
1,226

The Indian Tractor Industry : Buckle up for more rough weather ahead
Spark Disclaimer
Spark Capital Advisors (India) Private Limited (Spark Capital) and its affiliates are engaged in investment banking, investment advisory and institutional equities and
infrastructure advisory services. Spark Capital is registered with SEBI as a Stock Broker and Category 1 Merchant Banker.
We hereby declare that our activities were neither suspended nor we have defaulted with any stock exchange authority with whom we are registered in the last five years. We
have not been debarred from doing business by any Stock Exchange/SEBI or any other authorities, nor has our certificate of registration been cancelled by SEBI at any point of
time.
Spark Capital has a subsidiary Spark Investment Advisors (India) Private Limited which is engaged in the services of providing investment advisory services and is registered
with SEBI as Investment Advisor. Spark Capital has also an associate company Spark Infra Advisors (India) Private Limited which is engaged in providing infrastructure
advisory services.
This document does not constitute or form part of any offer or solicitation for the purchase or sale of any financial instrument or as an official confirmation of any transaction.
This document is provided for assistance only and is not intended to be and must not alone be taken as the basis for an investment decision. Nothing in this document should
be construed as investment or financial advice, and nothing in this document should be construed as an advice to buy or sell or solicitation to buy or sell the securities of
companies referred to in this document.
Each recipient of this document should make such investigations as it deems necessary to arrive at an independent evaluation of an investment in the securities of companies
referred to in this document (including the merits and risks involved), and should consult its own advisors to determine the merits and risks of such an investment. This
document is being supplied to you solely for your information and may not be reproduced, redistributed or passed on, directly or indirectly, to any other person or published,
copied, in whole or in part, for any purpose. This report is not directed or intended for distribution to or use by any person or entity who is a citizen or resident of or located in
any locality, state, country or other jurisdiction, where such distribution, publication, availability or use would be contrary to law, regulation or which would subject Spark Capital
and/or its affiliates to any registration or licensing requirement within such jurisdiction. The securities described herein may or may not be eligible for sale in all jurisdictions or to
a certain category of investors. Persons in whose possession this document may come are required to inform themselves of and to observe such applicable restrictions. This
material should not be construed as an offer to sell or the solicitation of an offer to buy any security in any jurisdiction where such an offer or solicitation would be illegal.
Spark Capital makes no representation or warranty, express or implied, as to the accuracy, completeness or fairness of the information and opinions contained in this
document. Spark Capital , its affiliates, and the employees of Spark Capital and its affiliates may, from time to time, effect or have effected an own account transaction in, or
deal as principal or agent in or for the securities mentioned in this document. They may perform or seek to perform investment banking or other services for, or solicit
investment banking or other business from, any company referred to in this report.
This report has been prepared on the basis of information, which is already available in publicly accessible media or developed through an independent analysis by Spark
Capital. While we would endeavour to update the information herein on a reasonable basis, Spark Capital and its affiliates are under no obligation to update the information.
Also, there may be regulatory, compliance or other reasons that prevent Spark Capital and its affiliates from doing so. Neither Spark Capital nor its affiliates or their respective
directors, employees, agents or representatives shall be responsible or liable in any manner, directly or indirectly, for views or opinions expressed in this report or the contents
or any errors or discrepancies herein or for any decisions or actions taken in reliance on the report or the inability to use or access our service in this report or for any loss or
damages whether direct or indirect, incidental, special or consequential including without limitation loss of revenue or profits that may arise from or in connection with the use of
or reliance on this report.
Absolute
Rating
Interpretation
BUY Stock expected to provide positive returns of >15% over a 1-year horizon REDUCEStock expected to provide returns of <5% – -10% over a 1-year
horizon
ADDStock expected to provide positive returns of >5% – <15% over a 1-year
horizonSELL Stock expected to fall >10% over a 1-year horizon
Disclaimer
Page 37

The Indian Tractor Industry : Buckle up for more rough weather ahead
Disclaimer (Cont’d)
Spark Capital and/or its affiliates and/or employees may have interests/positions, financial or otherwise in the securities mentioned in this report. To enhance transparency,
Spark Capital has incorporated a disclosure of interest statement in this document. This should however not be treated as endorsement of views expressed in this report:
Disclosure of interest statement Yes/No
Analyst financial interest in the company No
Group/directors ownership of the subject company covered No
Investment banking relationship with the company covered No
Spark Capital’s ownership/any other financial interest in the company covered No
Associates of Spark Capital’s ownership more than 1% in the company covered No
Any other material conflict of interest at the time of publishing the research report No
Receipt of compensation by Spark Capital or its Associate Companies from the subject company covered for in the last twelve months:
Managing/co-managing public offering of securities
Investment banking/merchant banking/brokerage services
products or services other than those above
in connection with research report
No
Whether Research Analyst has served as an officer, director or employee of the subject company covered No
Whether the Research Analyst or Research Entity has been engaged in market making activity of the Subject Company; No
Analyst Certification of Independence
The views expressed in this research report accurately reflect the analyst’s personal views about any and all of the subject securities or issuers; and no part of the research
analyst’s compensations was, is or will be, directly or indirectly, related to the specific recommendation or views expressed in the report.
Additional Disclaimer for US Institutional Investors
This research report prepared by Spark Capital Advisors (India) Private Limited is distributed in the United States to US Institutional Investors (as defined in Rule 15a-6 under
the Securities Exchange Act of 1934, as amended) only by Auerbach Grayson, LLC, a broker-dealer registered in the US (registered under Section 15 of Securities Exchange
Act of 1934, as amended). Auerbach Grayson accepts responsibility on the research reports and US Institutional Investors wishing to effect transaction in the securities
discussed in the research material may do so through Auerbach Grayson. All responsibility for the distribution of this report by Auerbach Grayson, LLC in the US shall be borne
by Auerbach Grayson, LLC. All resulting transactions by a US person or entity should be effected through a registered broker-dealer in the US. This report is not directed at you
if Spark Capital Advisors (India) Private Limited or Auerbach Grayson, LLC is prohibited or restricted by any legislation or regulation in any jurisdiction from making it available
to you. You should satisfy yourself before reading it that Auerbach Grayson, LLC and Spark Capital Advisors (India) Private Limited are permitted to provide research material
concerning investment to you under relevant legislation and regulations;
Page 38