the importance of formal and informal networks on
TRANSCRIPT
The Importance of Formal and Informal Networks on Generalized
Trust in Flanders: an Experimental Approach to Social Capital
Matteo Migheli*
(University of Torino and Catholic University of Leuven)
May 2006
Abstract
In this paper we try to analyze the link between social capital and generalized trust. The second one is viewed as a product of the first by a large part of the literature on social capital. Although they are two widely studied subjects, the existing literature does not provide, to our knowledge, any experimental verification of this link. To explore this relationship, we use a traditional trust game in its basic formulation, and a questionnaire aimed to measure respondents’ stock of social capital. In addition to the traditional associations, we add three other informal networks, which constitute individual social capital, according to our vision of the problem. We explore the link through two different standard analytical methods: the comparison of means, and econometric tools. Our aims are: to verify if the claimed link exists also when people face (experimentally) real situations, and if some effects detected in previous repetitions of a trust game are robust to controlling for social capital too. The most interesting effect is the gender effect. Our second aim is thus to verify if it is robust, since other works show that women are also the gender which associate less. As joining organizations is commonly viewed as increasing the stock of social capital, the gender effect could simply reflect this fact. Our findings partially confirm our initial hypotheses. Some formal and informal networks display a positive and significant link with generalized trust. However, the gender effect is persistent, at least in phase A.
Keywords: social capital, trust game, generalized trust, gender effect, networks
JEL Classification: C90, J16, Z13
* Università degli Studi di Torino, Department of Economics and Finance “G. Prato” Via Real Collegio, 30 – 10024 Moncalieri (TO) – Italy and Katholieke Universiteit Leuven, Department of Economics. Email: [email protected]: I would like to thank Mario Deaglio, Erik Schokkaert, Giuseppe Bertola, Elsa Fornero, Massimo Marinacci, Alessandro Sembenelli, Tiziano Razzolini, and the audiences of my seminars at the Katholieke Universiteit Leuven and Università degli Studi di Torino for their precious comments and remarks.
1. Trust between sociology and economics.
The concept of “trust” (meaning “confidence”) is widely diffused in
economics. We can find it in several fields, ranging from finance to the job
market. Trust is important, since it plays a central role in agents’ decisions [see
for example Berg, Dickhaut and McCabe (1995)] and it can help the development
of institutions [see Boix and Posner (1998) and Letki and Evans (2005)].
Recently economic literature has begun to link trust and social capital.
Although the definition of the latter is multifaceted, it can be defined through
Lin’s (2001) words:
“[…] social capital may be defined operationally as resources embedded in social networks and accessed and used by actors for actions.”
This designation is partly due to sociological literature, and partly to
economic research. Even if the concept is not new in this second field [see Bruni
and Sudgen (2000)] during the last century the emergence and predominance of
the “rational agent” left no free space for moral channels. In 1993, Putnam’s
book Making Democracy Work: Civic Traditions in Modern Italy renewed economists’
interest in this topic. Unfortunately, probably due to the difficulty in measuring it
and its relative newness, it is impossible to provide a unique and universally
accepted definition of social capital. Nevertheless, Lin’s proves to be
acknowledged and widespread: almost all authors agree on this description, and
they use memberships to formal associations to make it operational.
In our view, a major shortcoming is the absence of informal groups: even
if we cannot deny that formal organizations represent social nets, it is clear that
groups of friends and communication networks also belong to Lin’s set.
As Durlauf and Fafchamps (2004) emphasize, trust is viewed by some
authors as (one of) the product(s) of social capital. Carpenter et al. (2004) offer
some evidence about this point. In particular, they study the level of trust as a
consequence of the social capital stock possessed by some South-Asian peoples.
1

Economists have made a great effort in trying to measure trust.
Experimental economics, in particular, has focused on this problem. Berg,
Dickhaut and McCabe (1995) proposed in their article the so-called “trust game”,
whose aim is to evaluate interpersonal trust between two people who do not
know each other and who will never meet. The game has been applied by a
number of other scholars, as Croson and Buchan (1999) point out. Some
modifications have recently been brought to it [see Fehr et al. (2000)], but the
basic design has remained unchanged.
In this work we will try to verify if formal and / or informal networks do
affect interpersonal trust. We asked two groups of students to participate in a
trust game; the same people were also required to fill in a questionnaire, in order
to collect individual data about their involvement in social groups.
The paper is organized as follows: in section two we will give a
description of the trust game, in section three we will discuss the variables
collected through the questionnaire, and then we will present the analysis
methodology (section four) and our results (sections five and six). Conclusive
remarks will be tagged on.
2. The “trust game”
Berg, Dickhaut and McCabe originally proposed the trust game in 1995.
It is a two-player and two-stage game. The set up is as follows. Participants are
divided into two groups, A and B. Each person Ai is randomly and anonymously
matched to person Bi. In the first stage Ai receives the possibility of splitting
between himself and Bi the notional sum of S euro1. We denote as αiS the amount
given to Bi by Ai, where αi ∈ [0, 1]. The quantity αiS is interpreted as a measure of
Ai’s generalized interpersonal trust. Molm, Takahashi and Peterson (2000) point
out that this behaviour is more manifest when exchanges are non-negotiated, but
reciprocal; by using their words: “No matter how established the relation, how predictable
the other’s behaviour and how long the ‘shadow of the future’, each act of giving still remains a
declaration of trust that the other will reciprocate, and each act of reciprocity confirms that
1 Of course, the currency depends on the country where the game is played. In addition, some experimenters [see for example Fershtman and Gneezy (2001)] use tokens or points.
2
trust.”2 The experimenter triples Ai’s decision and hence Bi receives 3αiS, i=0,…
N. In stage two, each player of type B decides which amount out of the received
one he wants to give back to his partner. We denote this quantity as βi3αiS, βi ∈
[0, 1] It is clear that if Ai totally trusts Bi (which means he is confident in the fact
that Bi will reciprocate) the best strategy would be αi = 1. In fact, if Bi’s behaviour
is fully reciprocating, then he will choose βi = 0.5; in which case, Ai would yield a
return equal to 50%. Strategies suggested by Nash equilibrium application are
different: the subgame perfect Nash equilibrium is βi = 03; since Ai knows this,
then he will choose αi = 0. This holds under the hypothesis that players’ utility
function is:
)(muu pp =
where m is the possessed quantity of money. No other factor affects utility. As it
can be seen in Croson and Buchan (1999), the Nash equilibrium occurs in a small
minority of cases; as Bouckaert and Dhaene (2004) point out “In experimental
settings where anonymous players play the game only once, a typical finding is that player [A]
transfers a positive amount to player [B], and that player [B] responds by transferring a positive
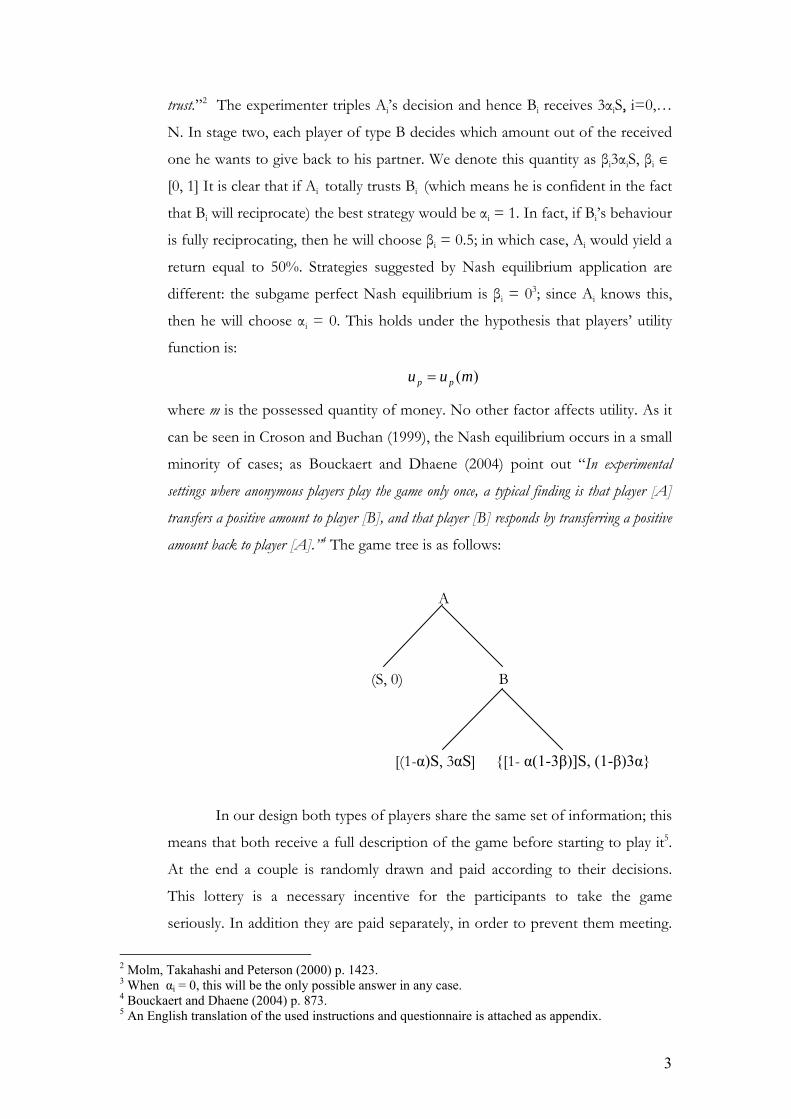
amount back to player [A].”4 The game tree is as follows:
A
(S, 0) B
[(1-α)S, 3αS] {[1- α(1-3β)]S, (1-β)3α}
In our design both types of players share the same set of information; this
means that both receive a full description of the game before starting to play it5.
At the end a couple is randomly drawn and paid according to their decisions.
This lottery is a necessary incentive for the participants to take the game
seriously. In addition they are paid separately, in order to prevent them meeting.
2 Molm, Takahashi and Peterson (2000) p. 1423. 3 When αi = 0, this will be the only possible answer in any case. 4 Bouckaert and Dhaene (2004) p. 873. 5 An English translation of the used instructions and questionnaire is attached as appendix.
3
This is important to rule out any psychological pressure: if they met, they would
prefer to seem generous, hence amounts would be affected by generosity.
At times literature on Experimental Economics casts doubts about the
use of lotteries in experiments. These criticisms are based on Allais’ preferences:
in his view, when facing uncertainty, people’s decisions are not consistent with
the independence axiom of expected utility theory. In other words: the presence
of lotteries leads choices not to coincide with preferences. If this were the case,
our experimental results would be biased. According to Cubitt, Starmer and
Sugden (1998) “[…] the system [of lotteries] does appear to be unbiased when applied to
choices among simple prospects.”6 Hence, we think that our outcomes are not
influenced by the presence of a lottery.
We recruited students of the Katholieke Universiteit Leuven; in particular
group A was composed of 255 first-year7 law students and group B by 129
second-year8 bioengineering students. A very short introduction given by the
professor to encourage then to them to participate seriously and the game was
played at the beginning of a normal class. According to Eckel and Grossman
(2000), our players are pseudo-volunteers, in the sense that they were not asked
whether they desired to participate or not; they were just involved in the
experiment. All of them received a copy of instructions (the same for both
groups), a paper on which they had to write down their decision and a two-page
questionnaire. The experiment lasted about 15 minutes. The same decision
papers (containing A’s choices) were randomly passed to players of type B. The
two stages took place on different days and in different buildings. In order to
ensure maximum neutrality of the environment, we chose the classroom of the
course.
Eckel and Grossman (2000) would raise some distrust in our recruiting
mechanism. Their experiment points out that pseudo-volunteers tend to evaluate
6 Cubitt, Starmer and Sugden (1998) p. 130. 7 “eerste kandidatuur” 8 “tweede kandidatuur”
4
monetary incentives less than free participants9. We do not want to rebut this
outcome here; nevertheless we believe that there is no certainty about which
method is best or least unbiased. Volunteers could be motivated by self-selection,
i.e. by a subjective higher evaluation of money, and thus they could constitute a
particular sub-sample of the population10. Since there is no evidence against this
interpretation of Eckel and Grossman’s results, we do not account for the
selection procedure as a source of bias.
Additional disturbances could have arisen if the Professor of the course
had invited his students to participate. In such a case they could have behaved to
please him. In order to rule out this possible effect, no information was
communicated before the game taking place. Furthermore, the experimenter and
not the Professor explained the rules and distributed the copies11.
3. Formal and informal network measurement and additional personal
characteristics
Since our goal is to analyse whether social capital influences trust, we
attached to the decision sheet a questionnaire aimed at pinpointing participants’
level of social capital. They were asked to indicate the average time spent within
different types of formal (social, youth, sports, religious, etc.) and informal (going
out with friends, phone conversations, etc.) groups. We included some other
questions, aimed at identifying some relevant individual characteristics, such as
gender, having a student job or not, province of origin, number of brothers and
sisters, subjective ethnic affiliation12 and the amount, if any, spent on rent..
9 Following Eckel and Grossman, we define “free participants” as those players recruited through public announcements. This procedure ensures only the motivated getting involved. In Eckel and Grossman’s definition, these players are called “volunteers”. 10 In this case, recruiting players through a public announcement would generate a biased (or at least non representative) sample. 11 In this case the experimenter was helped by a couple of assistants. They were strangers to the students. 12 Subjective ethnicity has been measured by the question: "To which cultural-ethnic group do you feel you belong to?” Answers have been coded as follows: 0 = home town (e.g. Hasselt); 1 = region (e.g. Flanders); 2 = Belgian; 3 = European; 4 = wider definitions (e.g. citizen of the World). We admit the weakness in this classification, the responses beinghighly subjective. However, we attach great importance to the self-reported ethno-cultural affiliation , when dealing with personal feelings such as trust and reciprocation.
5
Several authors show that gender is an important factor in experiments.
Reviewing a series of trust games, Croson and Buchan (1999) highlight that
women are more likely to demonstrate more reciprocity than men, but not more
trust. In the same stream, Fershtman and Gneezy (2001) provide evidence also
for a significant dissimilarity in trust. According to Simpson (2003), genders
evaluate risk, greed and fear differently, and then react according to a common
“gender feeling”. His work is based on different experimental designs, aimed to
produce different “feelings” in participants. His results explain why responses are
different when different games are played. In addition, Andreoni and Vesterlund
(2001) emphasize that “[…] when altruism is expensive, women are kinder, but when it is
cheap, men are more altruistic. […] Furthermore, men are more likely to be either perfectly
selfish or perfectly selfless, whereas women tend to be “equalitarians” who prefer to share
evenly.”13
Some controls are linked to the fact that the experimental amount of
money given to participants represents an additional income for them. Hence,
the paid rent is a good proxy for family income; subjective money evaluation
could be affected by this factor. Here the monthly rent is used as a proxy for a
household’s income. We introduce this variable for at least two motives. The first
one is that social class and association memberships are positively correlated, at
least in adulthood. Children and young people could join voluntary organizations
emulating their parents. The second point is that the passed amount in our game
could have been affected by different marginal utilities of money, linked to the
family’s social class.
Having a student job (and thus a wage) could decrease the available time
for socializing activities, ceteris paribus. The consequence of this is that working
students have fewer opportunities to increase their social capital stock. Given the
typology of a student job, we do not expect it to influence trust and / or
reciprocity behaviour.
13 Andreoni and Vesterlund (2001), p. 293.
6
The number of brothers and sisters is considered an important control,
since we expect them to constitute both an informal network and a link to other
people.
4. Methodology
In order to analyse our data we use two methodologies. Firstly we
consider the effect of each single variable on the passed amount; this
investigation is performed by mean comparisons. Secondly we consider our
potential determinants all together, by using econometric tools.
The Hotelling’s test for mean comparisons allows us to check whether
the averages of two groups identified by a dichotomous variable are significantly
different from each other.
Although the methodology of mean comparisons is widely used in the
literature [see Croson and Buchan (1999)], there could be effects hidden by this
approach. As a consequence, we think that econometric analysis can help us to
cope with this problem.
Our data are heavily focused on some respondents’ choices and the
similarity of the contained variables. On the one hand this allows us to
disentangle different association types and informal networks. On the other hand
endogeneity problems could arise. In particular the number of hours spent with
friends could show simultaneity with the dependent variable. The point is that
people, who are more prone to believe others, are also likely to look for more
friendships. Basically trust (the object of our investigation) determines both the
passed amount (of which it is a proxy) and the time spent out with friends. In
order to detect this problem of simultaneity14, we perform a Durbin – Wu –
Hausman test. This test points out that in general we have no endogeneity, but in
two cases concerning Group B. In particular this problem arises for the two
considered subgroups of phase B. To avoid this problem, we need to use IV; in
particular a GMM setup appears to be the most suitable choice.
14 However, the DWH test is not able to distinguish between endogeneity and simultaneity. Nevertheless, we claim (and we have explained why) that we are observing the second distortion and not the first one.
7
When analysing Group B, we divide it into three subsets as explained in
what follows.
We discuss here the used IV. The first IV we can identify is living in
Leuven from Monday to Friday. Most of the students at the KUL15 are not born
in Leuven, but somewhere else in Flanders (or the Netherlands). After the
secondary school16, in general they enrol at KUL. The town offers much
accommodation for students, but some of them17 commute every day. Our
hypothesis is that living in Leuven during the week allows for easier interaction
with friends, but should not influence generalized trust. Our claim can be
interpreted as follows. To have a student room in Leuven allows people to have
stable interpersonal relationships within the town; as a consequence these
students are very likely to enjoy two groups of friends: one in their town of origin
and the other one in Leuven.
The second instrument we are going to use is the number of sms (short
message service) weekly sent to friends. Some studies [see for example Barkhuus
(2005) and Grinter and Eldridge (2001)] point out that young people mostly text
messages to arrange meetings with their friends. We think that the more sms a
person sends, the more friends and rendezvous he has with them.
Eventually we include as an IV the weekly average time spent each week
in active communication through Internet. At first sight, we hypothesised
Internet as s a mean keeping distant friends in contact. However, young people
do use the World Wide Web also (and especially) to chat and organize meetings.
Hence we consider it an IV for the time spent together with friends. Although we
acknowledge that Internet can be used also for distant communications, we guess
that the most important use is the one first highlighted. For the same reason as
before, we also introduce the squared value of this variable.
15 Katholieke Universiteit Leuven. 16 And/or hooge school 17 This is the case for those, who live not too far from Leuven. Belgian Railways are very efficient and offer fast and frequent links between the most important towns.
8
Following Baum, Schaffer and Stillman (2002) and Greene (2003), we use
GMM techniques and calculate a Hansen J statistic to evaluate the fitness of our
instruments. As highlighted, this technique is used only for the two subgroups,
and not for the whole sample B.
In order to better analyze group B’s data, we divide it into three sub-
groups. We can identify three different general outcomes at the end of the game.
In the first case player A ends up with an endowment smaller than B’s; in the
second one both A and B have the same amount of money (i.e. they shared
resources equally); finally we have the inverse of the first situation: B ends up
with more than A. Since the final outcome strongly depends on B’s choice, let’s
denote them as UE (uneven) in the first case, as PE (perfectly even) in the
second one and eventually as ME (more than even) in the last situation18. Given
this classification, in our analysis we must drop the second group and consider
the characteristics of the first and the third only. The rationale for this is to leave
outside the supposed equalitarian people, in whose behaviour we do not observe
variability.
A second explanation can be provided, when observing simple
descriptive statistics19 of our data. We notice that a large share of B players B
gave back such amount that at the end of the game both A and B were in the
same conditions. In other words: people tried to distribute the money received
evenly. In some cases we found on the experiment sheet the expression of this
desire; three students wrote down on the decision sheet “so he/she has as much
as I have.” In 75 cases20 (couples) out of 128 people acted in such a way such that
in the end both had the same amount of money. The incidence of this outcome
is too high to be considered random. In addition we have to stress that some B
players did not have the possibility of distributing evenly, since they received less
than 150€. If we drop them21 (15 observations), 66.37% of couples divided
18 Of course, for some type B players PE and ME were not feasible options, since they received from A an insufficient sum. I order to avoid problems arising from this , in our analysis we dropped all the couples, whose decisions made it impossible to reach (potentially) all three outcomes. Notice also that our measure of equalitarianism can be interpreted as a kindness function [see Fehr and Schmidt (1999)]. 19 Not shown here. 20 This figure corresponds to 58.59% of all the respondents. 21 See footnote 19.
9
equally. In 19.47% of our couples A ended with less than B and in the rest
(14.26%) A got more than B.
5. Description of results
In this section we will briefly describe the main results of the experiment.
The statistical and econometric analyses are illustrated and discussed in section 6.
Group A. This group is composed of255 respondents, out of whom 250
were retained; the others dropped as a result their extreme answers to the
questionnaire.
People in this group passed on average 83.43€ out of their 200€ initial
endowment. In proportional terms, they gave 41.72% of what they possessed.
This result is much lower than what we found in several other experiments: in
their review, Croson and Buchan (1999) observe figure of 68.01%. Even though
women are less trusting, our level is low: the two American researchers quoted
calculated a general mean of 63.04% for female respondents and of 69.64% for
men. Our upshots are 38.12% for women and 47.72% for the other sex. Figures
1 and 2 depict this analytically; in particular we notice that more than 40% of the
group passed 50€, about 20% 100€ and around 10% the whole disposable
amount. Only 3 people (equal to 1.2% of the sample) complied with the Nash
equilibrium holding everything for themselves. We would stress that 50€ is
exactly the amount necessary to distribute the initial 200€ equally, as B receives
three times A’s decision.
Tables 1, 2 and 3 portray the control variables and the geographical
composition of the group. As for the formal networks, we notice active
involvement in sports and faculty organizations; youth, political, social and
religious associations are also clearly popular; in particular the time spent within
them appears to be relevant. Third world and animal protection societies display
a pretty scarce involvement of their members. It is interesting to notice that those
participating in other-than-own Faculty associations spend more time than in
own Faculty’s ones. Membership to informal networks is more general. Almost
all the respondents enjoy these networks.
10
Group B. Let’s now have a look to the reciprocating sub-sample. The
average back passed amount is 63.96€, but 58 people (it is 45.31% of the total)
did not reciprocate. Considering only the ones who gave back a positive sum, the
figure raises to 116.95€. In relative terms (it is in percentage of what received) we
get 16.11% and 29.46% respectively. This second outcome is close to general
average of Croson and Buchan (1999). When differentiating according to players’
gender, and considering positive amounts only, our ratios are 29.04% for females
and 29.83% for males. Again, this is not consistent with Croson and Buchan’s
findings: they determine 37.4% and 26.8% respectively. Figures 3 and 4 represent
the absolute passed quantities: the proportion of non-reciprocating people is
quite high, but we interpret this behaviour as the desire to divide up the initial
endowment equally (at least for the majority). Generally, people who did not
send any sum back received 50€.
Tables 4, 5 and 6 represent some of the controls, as before. The four
most popular formal associations are the same as in Group A, but there are some
important differences in frequentation. In particular bioengineering students tend
to spend more time within own-faculty associations, but on average do less
sport. A Hotelling test carried out on these differences shows significance in the
first case, but not in the second one. The same analysis performed on youth clubs
and youth organizations concludes that differences are not significant. The same
result is to be had for all the other formal memberships. We would like to stress
that group B’s players display more interest in environmental problems than their
colleagues of the other sample; it is likely that bioengineering students are more
likely to be closer to these problems, than law students. When observing data for
informal networks we identified a significant difference in telephone usage:
although group A contains a higher percentage of female respondents, the
difference is significant even after controlling for gender composition. Law
students are more talkative than their counterparts22. We can assess the same as
regard as the average number of SMS sent, as well as for Internet usage. Here
however, , we must point out that the discrepancy is only significant for women.
There is no dissimilarity in time spent with friends. In conclusion it would seem
22 Is this self-selection?
11
that bioengineering students use ICT technology for active communication less
than their law equivalents.
It could be claimed that the minor usage of phone-based contacts is due
to differences in parents’ income. In order to test this hypothesis we also
performed a Hotelling test on the rent amounts. Surprisingly we discovered that
there is a disparity in favour of group A, but only when the respondent is male.
6. Statistical and econometrical analyses.
6.1 Comparison of means (Hotelling’s method)
We will first present the results for the comparison of means; secondly
we will discuss the GMM estimations. As for the first stage, we consider both the
absolute passed amount and its normalized value with respect to the rent the
respondent pays for his student room. We compare means by dividing the
respondents into two sub-samples; the threshold is represented by the average
attendance to each type of organization. By this way we will analyse the effect of
spending more time than the sample average within a specific association.
We look now at group A. The first group of variables we took into
account is the set of formal associations. At first sight, we identify religious and
social associations influencing our experimental results. In particular, as for the
first one, more involved people passed 115,75€ on average, vs. 82,58€ by the
others23. The difference is no longer significant when considering the normalized
amount (NAH). As for the social associations, we notice that students who spend
more time within them passed 60.33% of the paid rent, whilst the others 37.44%
only24.
Secondly we found some influence exerted by informal networks. In
particular respondents more active than the average in sending SMS to friends
gave to their game mate an amount equal to 32.86% of their rent, vs. a figure of
40.37% for the least active group25. Also the amount of time spent with friends is
significant; in particular, we found out that going out with friends affects the
23 Significant at 90% level. 24 Significant at 95% level. 25 Significant at 90% level.
12
passed amount negatively. Our figures indicate an average giving of 34.00% vs.
41.84%26. Both these results are in contrast to our expectations.
As usual in the field of experiments [see Croson and Buchan (1999)] we
notice a gender effect. In our case male respondents passed on average 96.00€,
whilst their female colleagues only 77.17€27. This difference becomes insignificant
if the normalized amount is taken into account28. In addition we have an
unsurprising job effect: those students who work passed 31.98% of their rent,
compared to 40.31% of the others.
Eventually, we have an unexpected geographic effect. Apparently people
from Western Flanders are both more trusting and more reciprocating than all
other Flemish. When considering the NAH, we observe that Western Flemish
tend to pass 22 percent points more than other Belgians. The difference is not
significant when the absolute amount is considered.
When considering group B, we take into account the passed amount
normalized on the received one. Results are partially different with respect to the
previous group. First of all, we notice a negative effect of spending time in sports
activities: those who stay above the mean gave back about 8 percentage points
less.29 Cultural involvement does induce the opposite result: students who are
engaged more than the average passed 22.53% against 14.55%30 of the other
group.
The ten respondents31 participating in youth clubs more than the mean
reciprocated 6.39% of what they received, against 16.93%32 of the others. This
result is quite surprising, because our expectations were for a difference of the
opposite sign.
26 Significant at 90% level. 27 Significant at 99% level. 28 Notice that there is no significant difference between the average rents paid by male and female students in our sample. 29 Significant at 95% level. 30 Significant at 90% level. 31 This figure amounts to the 8% of the sample. 32 Significant at 90% level.
13
An astonishing outcome is the strongly negative effect of having sisters.
Independently of the sex of the respondent, to have more sisters than the mean
does decrease the reciprocation rate from 20.04% to 13.59%.33 This effect is not
detected for brothers. It is quite difficult to claim a valid explanation for this
behaviour. It is not clear to us why the presence of sisters would induce people to
be less reciprocating.
The geographical effect involving Western Flemish is present again; this
time we observe that the rest of Belgians passed back 14.56% of the received
amount received, against 28.78%34 of the province of Brugge. This province is
characterized by a higher density of farmers and a deeper catholic culture than
the rest of Flanders. According to our previous work, receiving a religious
education when young fosters social capital, among whose outcomes we can find
generalized trust.
Although the applied methodology gives us some important results, we
cannot avoid some hidden effects. For instance, given the high correlation
between the time spent out with friends and the number of sms, it is not possible
to disentangle the two effects. Since we are interested in clearly understanding
which kind of network exerts which effect on our proxy dependent variable, we
discuss now the GMM regression results.
6.2 Econometric estimation results
As for group A, we ran an OLS standard regression. We introduce all the
variables capturing all the forms of social capital. We also account for siblings, to
live in Leuven also during the weekend and for having a student job.
Our results are shown in Table 7. As for formal organizations, we can
notice that sports, own faculty, third world, youth and religious ones display
significant effects. This does not mean that the other kinds of organizations do
not constitute social capital. Here we are considering a specific output of social
33 Significant at 90% level. 34 Significant at 90% level.
14
capital: generalized trust and we are dealing with a particular subsample of the
general population.
We examine more in detail the types of association which display
significant coefficients. Participating in sports activities exerts a positive effect on
trust. This can well be the consequence of fair play embedded in several sports.
Moreover several sports involve playing in a team; this facilitates social contacts,
and creates “team spirit”. In addition respect of rules is required; this is close to
build civil conscience, and hence it promotes social capital, and thus generalized
trust.
Also youth organizations contribute to increase individual generalized
trust. Spending time in youth organizations has positive consequences; this
finding agrees with our hypotheses. This is important because shows us that
networking within clubs organized for young people has a positive impact on
members’ behaviour and trust35. Since we are considering Flanders this is good
news: a large majority of young Flemish are joiners of this type of associations.
Hence, given the highlighted positive correlation, Northern Belgians are likely to
constitute a trusty society; in turn this can have positive impacts on many aspects
of life and on the economic system in particular (see the quoted literature at the
beginning of the present work).
Involvement within associations caring for third world problems do
affect generalized trust positively. This outcome is in line with our initial
hypothesis. People who show pro – social preferences (here represented by
caring for socio – economic problems in the poor countries) are also more
trusting than the population average. Of course it is probable that cultural and
political background of the individual play a crucial role in determining this type
of preferences.
Spending time in youth organizations has positive consequences; this
finding agrees with our hypotheses. It is important because shows us that
35 Here an easy remark could be the following: nothing tells us that the opposite be false. At the end of the results commentary we will quote an important paper assessing whether the relation presented here is one – way.
15
networking within clubs organized for young people does have a positive impact
on members’ behaviour and trust36. Since we are considering Flanders this is
good news: a large majority of young Flemish are joiners of this type of
associations. Hence, given the highlighted positive correlation, Northern Belgians
are likely to constitute a trusty society; in turn this can have positive impacts on
many aspects of life and on the economic system in particular (see the quoted
literature at the beginning of the present work).
As expected, also participation in religious associations is linked positively
to the amount passed. Again: people who join these clubs are moved by catholic
(we are considering a Flemish sample) teachings. Not only, Migheli (2005) shows
that religious education fosters social capital and thus trust, but basic principles
of any Christian confession are likely to stimulate social interaction and trust.
Spending time within own faculty associations displays a negative and
significant coefficient. This result is unexpected. Also the absence of significance
of hours weekly spent out with friends is surprising. However the latter variable
could present some bias due to the difficulty of self – evaluating it precisely.
As we can notice, the majority of the associations displaying positive and
significant coefficients have pro – social goals. Although they can differ type by
type, all of them are concerned with building interpersonal relationships among
their members, with respecting rules, and in some cases with providing help for
non – members.
In contrast with our expectations we find out a negative and significant
coefficient for the number of sent sms. Our interpretation here is the following.
According to Barkhuus (2005) shy people use a larger number of sms, than the
average population. Shyness could be a cause of “generalized distrust” or, in any
case, of a lower level of generalised trust. Interpreted in this way, our result is
consistent with our expectations. The net constituted by sms represents a lack of
social capital, rather than a valuable asset in this sense.
36 Here an easy remark could be the following: nothing tells us that the opposite be false. At the end of the results commentary we will quote an important paper assessing whether the relation presented here is one – way.
16
Self reported ethnicity is significantly and positively correlated with the
passed amount. This means that the wider the feeling, the higher the level of
generalized trust. Our measure of ethnicity is rather row: we acknowledge that it
presents at least two shortcomings. First of all its value is subjectively chosen by
the respondent, and secondly the shown categories were selected arbitrarily by
the experimenter. Nevertheless, the coefficient is significant and positive as
expected. This means that a strong nationalist sentiment (here people defining
themselves as Flemish) is linked to a lack of generalized trust. Stated differently:
people, who identify themselves with a restricted cultural group, are also less
prone to trust a person they do not know. And this is hardly surprising. This
appears to be true, even though the probability their anonymous mate belongs to
the same group is very high37.
Considering demographic indicators, we have to stress the gender effect.
As emphasized before, there is huge uncertainty about its sign when accounting
for trust in experimental outcomes [see Croson and Buchan (1999) and Andreoni
and Vesterlund (2001)]. Our results indicate that men gave more than female
students. The difference is important and highly significant. It is not among the
goals of this paper to discuss the topic of gender effects further; however it could
constitute an interesting field for future research.
We analyze now the behaviour of Group B. In this case one more
complication arises: the amount passed back by each player B is limited by
his/her mate’s decision. This fact has at least two implications: the first one is the
impossibility to use the absolute passed amount as a dependent variable; the
second is the existence of sentiments of anger. As for the former problem, it can
be solved by normalizing the passed amount on the received one. Unfortunately
this procedure has the effect of worsening the second problem. People who
received a low amount are likely to feel irritated by the other member of the pair.
After the experiment, some of them told us that they had not been willing to
reciprocate because their mate had been too greedy, and therefore he/she did not
37 Remember that the experiment was performed among undergraduate students of the K.U. Leuven. Here classes are held in Nederland, hence non – Dutch speaking students are ruled out. The probability that a non Flemish citizen speaks Nederland is very low, even among Belgians.
17
deserve any additional amount of money. By contrast, students who received
400€ or more found their companion’s behaviour as kind as to deserve a prize38.
Of course, we could argue that social capital should weaken the sentiment of
anger, but we have no possibility to verify whether this is the case in our
experiment, or to evaluate its magnitude. Aware of these troubles, we split players
B into three groups, as indicated in section 4. We consider only UE and ME sub
samples, and discuss results separately only when some important difference has
to be stressed.
The results for the overall section B of the game are strongly different
from the previous section. We show two regressions: in the second one the
dummy for having a student room gets subsituted by the rent paid for it. This
latter variable would represent a proxy for the income of student’s family.
Received amount displays a positive coefficient, which is strongly
significant. This is not surprising, since sentiments of anger and willingness of
redistribution have played an important role. This is a confirmation of the fact
that people who received more, are also more willing to reciprocate.
There are two formal networks displaying significant coefficients. The
first one is the coefficient of environmental associations: it is positive, as
expected. Caring for (a particular type of) collective problems promotes
reciprocating behaviours.
Participation within youth clubs is significant as well (although only in
model 1), but the sign is negative. Although we expected a different sign, we have
to underline that this group of organizations collects a large number of
multifaceted clubs. Given this fact, the interpretation of this coefficient is rather
difficult, also because this category was intended as residual with respect to youth
organizations. In addition, the coefficient is not robust with respect to the
substitution of having a student room with the rent paid for it.
38 This means that, in these cases, players B were willing to pass back more than 50% of what they received.
18
Among informal networks, the use of the Internet and phone calls are
significant and display a positive effect (although the latter are significant only in
model 2). This is a confirmation of our initial hypotheses: also long – distance
relationships constitute a part of the individual stock of social capital. The
number of sent sms is again negatively correlated with the dependent variable (in
this case the amount passed back).
We find out again the negative effect exerted by sisters, already detected
by comparing the means. However, we highlight that the significance of the
coefficient is not robust when we change from regression 1 to 2.
Eventually paid rents for student’s room and passed back amounts are
negatively correlated. There are at least two possible explanations for this
phenomenon. Richer people could be greedier and thus less willing to
reciprocate; or students who pay more for their rent are more motivated to save,
and hence gave less back.
We examine now the two subgroups (ME and UE) previously described.
The adopted strategy reduces the number of observations definitely. This
generates some collinearity problems and obliged us to drop some controls
previously considered. Among them there are the time spent within religious
associations for both groups and in youth organizations for ME subsample. This
means to exclude two important independent variables, reducing the power of
our interpretation. However, we are convinced that our procedure is the most
efficient one.
As previously discussed, here we deal with IV, since a Durbin-Wu-
Hausman test detects endogeneity problems for the time spent out with friends.
In our eyes, this could be a problem of simultaneity, as reciprocity and friendship
could be influenced by some hidden factor. More simply it is also likely that more
reciprocating people be also more friendly in general, and hence spend more time
with their friends (or have more friends). However, given the strong reduction in
the number of observations, the detected endogeneity could be spurious.
19
The first non dropped variable is the received amount again. Of course, it
turns out to be extremely significant in both groups, and this is not surprising at
all. The coefficient is positive in both cases. This fact could indicate that
resentment does exist within our sample and it affects decisions.
When considering the other controls, our upshots are partially compatible
with group A’s outcome, but there are noticeable differences too. The first is
given by the effect of spending time with friends39. In both of our sub samples
the coefficient is positive and significant. This means that the more people meet
their friends, the more their behaviour is reciprocating, even when controlling for
the received amount. This result is in line with our hypotheses: informal
networks foster social capital and hence the sentiment of reciprocity.
Spending some time within youth organizations does foster reciprocation.
This outcome is in accordance with our expectations, even if it is in contradiction
with Group A’s results. Anyway, we would like to stress that in phase 1 we
measure trust, whilst in the second part of the game reciprocity is the proxy
dependent variable. Hence we can not compare the effects of our controls.
However, notice that the coefficient is not significant for ME group. We could
interpret this as follows: UE subjects are likely to be affected by anger, as we
explained before. In such a case participation in youth organizations (but
surprisingly not in youth clubs40) seems to reduce this sentiment or to counteract
against it. When player A had been very trusting, then these kind of activities
appear not to exert any significant effect. Despite this being partially in contrast
to our hypotheses, we find this result to be interesting anyway.
The same happens when telephone conversations are taken into account:
in the UE group they exert a fostering effect, but it is no longer present for ME
individuals. Again, we believe that keeping contact with distant friends helps to
avoid the depletion of the individual social capital stock. As a consequence also
reciprocity turns out to be positively affected.
39 Remember that these are fitted values as for Group A. 40 As for “youth organizations” we translate “Jeugdbewewing”, as for “youth clubs” “Jeugdclub”.
20
A strange and somehow astonishing result is linked to siblings: in the first
subsample (UE) an increasing number of brothers depresses reciprocity, whilst
the same result is found as for sisters in the second group. Maybe the
psychological and / or sociological literature could contain an answer for this
outcome. In our eyes, this variable hides some unknown effects, which can not
be derived from our data41.
Having a job is detrimental, but only for the UE group. A possible
interpretation is that working (although we are considering students’ jobs)
subtracts time to the other social relationships, with negative consequences.
Gender matters and it is strongly significant. Once more, we observe that
men were more reciprocating than female players. As usual, we refer to Croson
and Buchan (1999) and Simpson (2003) for an extensive discussion of the sign of
gender coefficients in different situations. In our case we can highlight that men
are apparently less risk-averse, and that apparently they feel less resentment
against mistrust [see also Andreoni and Vesterlund (2000)].
Subjective ethnicity has effect also in this case; this holds only for UE
players. People, who feel they belong to wider areas (such as Belgium, or Europe,
instead of Flanders or the own town), reciprocate more. This outcome is in line
with what we found for group A. According to Alesina and La Ferrara (2002),
living in an ethnically mixed environment does decrease people’s trust. In our
case, we are controlling for the individual’s self-reported affiliation, but we claim
that psychological effects should be similar.
The second session of the game provides us with fewer but somehow
more interesting results. The first fact (fewer results) is due to the more complex
outcome; this forced us to divide our players into three sub samples: each of
them has been analyzed separately. The immediate consequence of this operation
is a smaller number of observations and several collinearity problems. In addition
41 Some of the people with whom I discussed this result tried to give me an explanation. The most frequent was that females are more likely to spend money on clothes, cosmetics, etc. than men. For this reason, people, who are used to living with several women, are less willing to finance their esthetical needs. The author has no siblings, and hence does not share, nor contradict this reading.
21
results of phase 2 are more difficult to interpret. We have already highlighted
anger: this sentiment is surely present, but it is not simple to detect and measure.
Although these results seem to be stringent because of their strong
significance, we would like to point out the exiguity of included cases. It does not
mean that our findings are weak or inconsistent, but that they rely on a
population minority.
Another important remark we would stress here is the following. Table 8
shows that our controls are particularly significant in the UE case. This can be
interpreted as a strong confirmation of our hypotheses. As we pointed out
before, UE players are suspected to be affected by anger. Also in this case heavier
involvement in the social network does reflect in a larger amount of money
given. Hence social capital appears to diminish the feeling of anger. In reality we
can not assess whether social capital influences reciprocity or anger or both
contemporaneously. What we do highlight is that there is an effect and this is in
the expected direction.
7. Conclusions
In this paper we tried to test our hypothesis that also informal networks
matter to build social capital. We decided to proxy its individual’s endowment by
using generalized trust, one of its most recognized outputs [see Durlauf and
Fafchamps (2004)]. The basic idea is that the larger the stock of social capital, the
more developed the person’s trust. In order to measure this output, we used a
widespread game: the trust (or investment) game in its original form [see Berg,
Dickhaut and McCabe (1995)]. In addition, to collect all the necessary data, we
asked the players to fill in a questionnaire, containing detailed questions about
both formal and informal networks.
We treated the collected information through two analytical techniques;
the first one consists of Hotelling tests on group mean comparisons, the second
one of econometric estimations. Although the former is more traditional widely
spread, we definitely prefer the latter, because it leaves less space to hidden
effects. However, we have to recognize that in some cases our findings do not
22
vary much. We needed to use IV estimation for the two subgroups of phase B, as
discussed in the previous sections.
We discussed the results for players A and B separately, because of the
different decisional framework students faced and of the dissimilar dependent
variable.
Our main findings are in line with our hypotheses. In particular we can
observe that participation in some formal and informal networks fosters both
generalized trust and reciprocity. This constitutes an experimental proof of the
fact that social capital and trust are strongly linked. We also show that not only
interpersonal relationships built within voluntary associations matter, but also
informal nets.
We observe a widespread redistributive willingness. A large part of our
sample acts as if they would like to divide the endowment evenly. We can not test
if this outcome is casual or wanted, but some players expressly wrote their
intention on their decision sheet42. As a consequence, we decided to split group B
into three different sub samples. The first one (UE) collects the uneven
reciprocators: in this case players A ended up with less money than their B mate.
The second set (PE) is composed of perfectly even distributors. The last one
(ME) is the group of more – than – even players B: in this last case the final sum
of money of A is larger than the correspondent B’s. We ran GMM estimation for
both UE and ME. We found that reciprocity is strongly affected by social capital,
especially when A passed a small fraction of his initial endowment.
We assessed before that when B receives a low part of A’s wealth, then
he might be affected by feelings of anger. Some players did express it clearly
during the experiment. The fact that social capital effects are stronger in the UE
group than in the ME may induce us to suppose that social nets are stronger on
anger (as countermeasures) than on reciprocity tout court. Clearly, as we assessed
before, we can not exclude that both factors43 are simultaneously affected.
42 In this case, if a player of type A wrote down something on his form, the form was substituted before passing it to player B. 43 Anger and reciprocity.
23
Although Belgian students appear to be less trusting than the
international mean, we observe a strong link between social capital and trust and
social capital and reciprocity. As outlined by Claibourn and Martin (2000), we
could assess that involvement in social networks and their active usage promote
trust. In other words: generalized trust and reciprocity are (one of) the final
product(s) of social capital. The relationship between these variables appears to
be from membership and use to belief.
Testing whether international differences be present and writing down a
formal model explaining the observed phenomena is a starting point for future
research work.
24
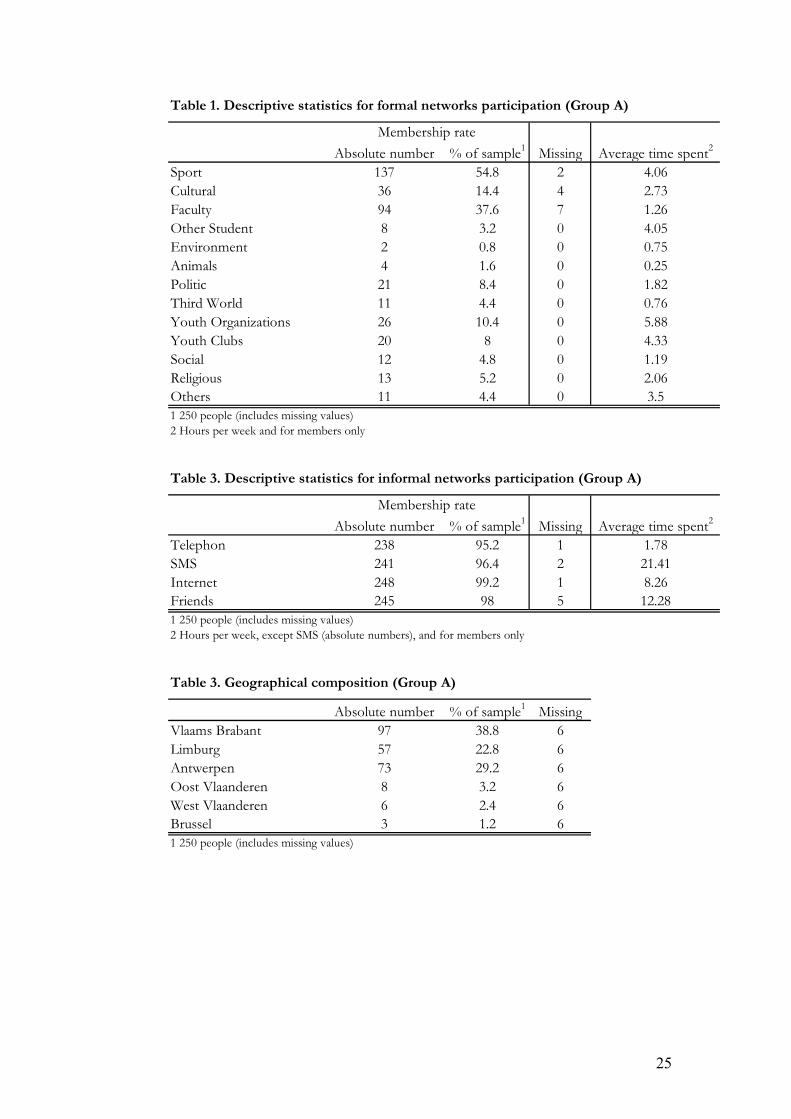
Table 1. Descriptive statistics for formal networks participation (Group A)
Absolute number % of sample1 Missing Average time spent2
Sport 137 54.8 2 4.06Cultural 36 14.4 4 2.73Faculty 94 37.6 7 1.26Other Student 8 3.2 0 4.05Environment 2 0.8 0 0.75Animals 4 1.6 0 0.25Politic 21 8.4 0 1.82Third World 11 4.4 0 0.76Youth Organizations 26 10.4 0 5.88Youth Clubs 20 8 0 4.33Social 12 4.8 0 1.19Religious 13 5.2 0 2.06Others 11 4.4 0 3.51 250 people (includes missing values)2 Hours per week and for members only
Table 3. Descriptive statistics for informal networks participation (Group A)
Absolute number % of sample1 Missing Average time spent2
Telephon 238 95.2 1 1.78SMS 241 96.4 2 21.41Internet 248 99.2 1 8.26Friends 245 98 5 12.281 250 people (includes missing values)2 Hours per week, except SMS (absolute numbers), and for members only
Table 3. Geographical composition (Group A)
Absolute number % of sample1 MissingVlaams Brabant 97 38.8 6Limburg 57 22.8 6Antwerpen 73 29.2 6Oost Vlaanderen 8 3.2 6West Vlaanderen 6 2.4 6Brussel 3 1.2 61 250 people (includes missing values)
Membership rate
Membership rate
25
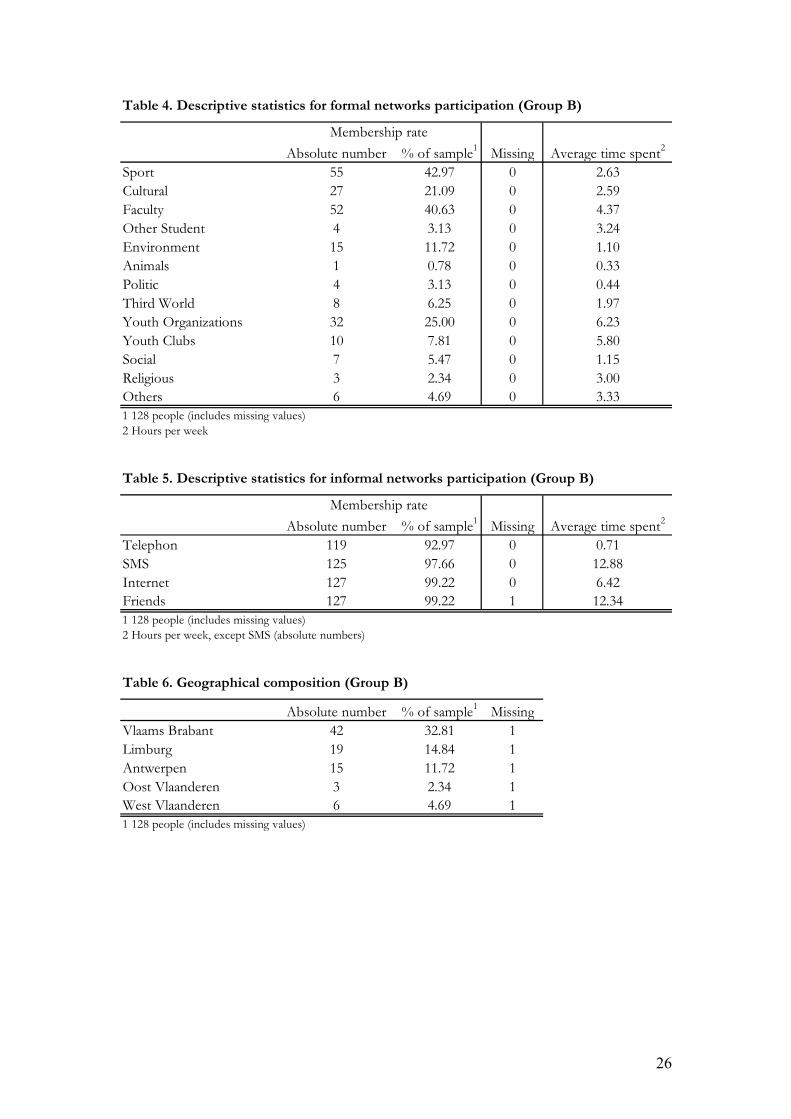
Table 4. Descriptive statistics for formal networks participation (Group B)
Absolute number % of sample1 Missing Average time spent2
Sport 55 42.97 0 2.63Cultural 27 21.09 0 2.59Faculty 52 40.63 0 4.37Other Student 4 3.13 0 3.24Environment 15 11.72 0 1.10Animals 1 0.78 0 0.33Politic 4 3.13 0 0.44Third World 8 6.25 0 1.97Youth Organizations 32 25.00 0 6.23Youth Clubs 10 7.81 0 5.80Social 7 5.47 0 1.15Religious 3 2.34 0 3.00Others 6 4.69 0 3.331 128 people (includes missing values)2 Hours per week
Table 5. Descriptive statistics for informal networks participation (Group B)
Absolute number % of sample1 Missing Average time spent2
Telephon 119 92.97 0 0.71SMS 125 97.66 0 12.88Internet 127 99.22 0 6.42Friends 127 99.22 1 12.341 128 people (includes missing values)2 Hours per week, except SMS (absolute numbers)
Table 6. Geographical composition (Group B)
Absolute number % of sample1 MissingVlaams Brabant 42 32.81 1Limburg 19 14.84 1Antwerpen 15 11.72 1Oost Vlaanderen 3 2.34 1West Vlaanderen 6 4.69 11 128 people (includes missing values)
Membership rate
Membership rate
26
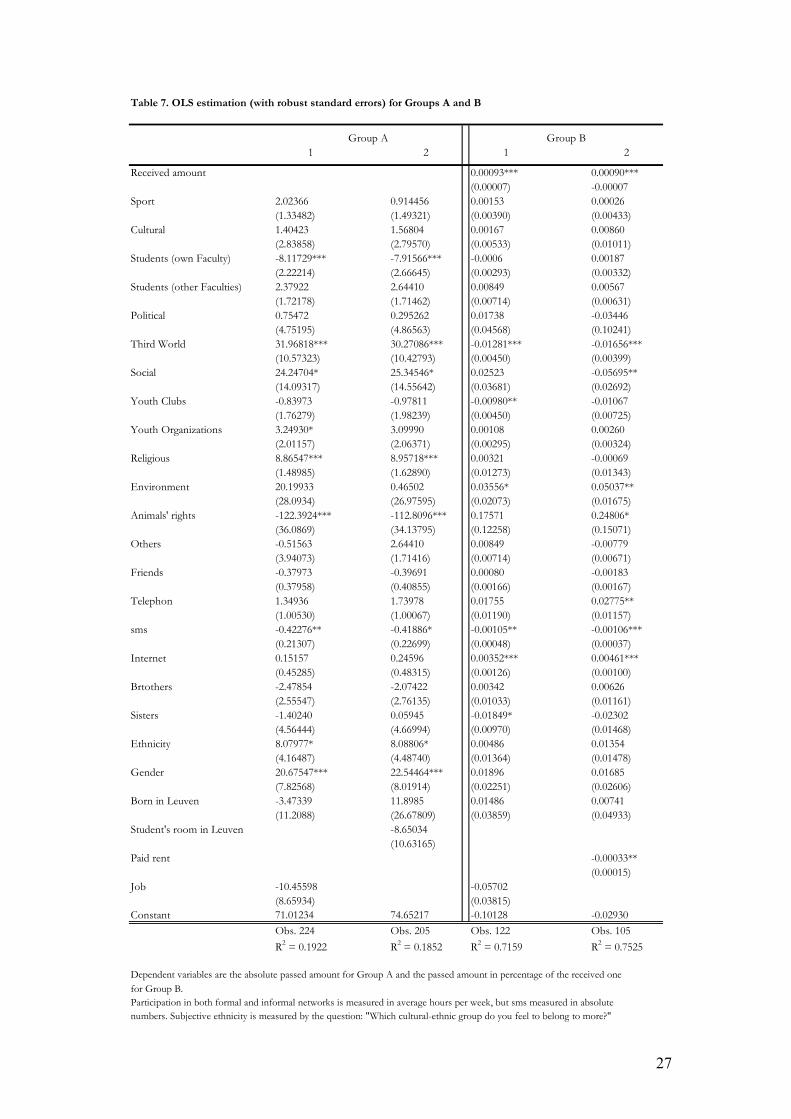
Table 7. OLS estimation (with robust standard errors) for Groups A and B
1 2 1
Received amount 0.00093*** 0.00090***(0.00007) -0.00007
Sport 2.02366 0.914456 0.00153 0.00026(1.33482) (1.49321) (0.00390) (0.00433)
Cultural 1.40423 1.56804 0.00167 0.00860(2.83858) (2.79570) (0.00533) (0.01011)
Students (own Faculty) -8.11729*** -7.91566*** -0.0006 0.00187(2.22214) (2.66645) (0.00293) (0.00332)
Students (other Faculties) 2.37922 2.64410 0.00849 0.00567(1.72178) (1.71462) (0.00714) (0.00631)
Political 0.75472 0.295262 0.01738 -0.03446(4.75195) (4.86563) (0.04568) (0.10241)
Third World 31.96818*** 30.27086*** -0.01281*** -0.01656***(10.57323) (10.42793) (0.00450) (0.00399)
Social 24.24704* 25.34546* 0.02523 -0.05695**(14.09317) (14.55642) (0.03681) (0.02692)
Youth Clubs -0.83973 -0.97811 -0.00980** -0.01067(1.76279) (1.98239) (0.00450) (0.00725)
Youth Organizations 3.24930* 3.09990 0.00108 0.00260(2.01157) (2.06371) (0.00295) (0.00324)
Religious 8.86547*** 8.95718*** 0.00321 -0.00069(1.48985) (1.62890) (0.01273) (0.01343)
Environment 20.19933 0.46502 0.03556* 0.05037**(28.0934) (26.97595) (0.02073) (0.01675)
Animals' rights -122.3924*** -112.8096*** 0.17571 0.24806*(36.0869) (34.13795) (0.12258) (0.15071)
Others -0.51563 2.64410 0.00849 -0.00779(3.94073) (1.71416) (0.00714) (0.00671)
Friends -0.37973 -0.39691 0.00080 -0.00183(0.37958) (0.40855) (0.00166) (0.00167)
Telephon 1.34936 1.73978 0.01755 0.02775**(1.00530) (1.00067) (0.01190) (0.01157)
sms -0.42276** -0.41886* -0.00105** -0.00106***(0.21307) (0.22699) (0.00048) (0.00037)
Internet 0.15157 0.24596 0.00352*** 0.00461***(0.45285) (0.48315) (0.00126) (0.00100)
Brtothers -2.47854 -2.07422 0.00342 0.00626(2.55547) (2.76135) (0.01033) (0.01161)
Sisters -1.40240 0.05945 -0.01849* -0.02302(4.56444) (4.66994) (0.00970) (0.01468)
Ethnicity 8.07977* 8.08806* 0.00486 0.01354(4.16487) (4.48740) (0.01364) (0.01478)
Gender 20.67547*** 22.54464*** 0.01896 0.01685(7.82568) (8.01914) (0.02251) (0.02606)
Born in Leuven -3.47339 11.8985 0.01486 0.00741(11.2088) (26.67809) (0.03859) (0.04933)
Student's room in Leuven -8.65034(10.63165)
Paid rent -0.00033**(0.00015)
Job -10.45598 -0.05702(8.65934) (0.03815)
Constant 71.01234 74.65217 -0.10128 -0.02930Obs. 224 Obs. 205 Obs. 122 Obs. 105R2 = 0.1922 R2 = 0.1852 R2 = 0.7159 R2 = 0.7525
Dependent variables are the absolute passed amount for Group A and the passed amount in percentage of the received onefor Group B. Participation in both formal and informal networks is measured in average hours per week, but sms measured in absolutenumbers. Subjective ethnicity is measured by the question: "Which cultural-ethnic group do you feel to belong to more?"
Group BGroup A2
27
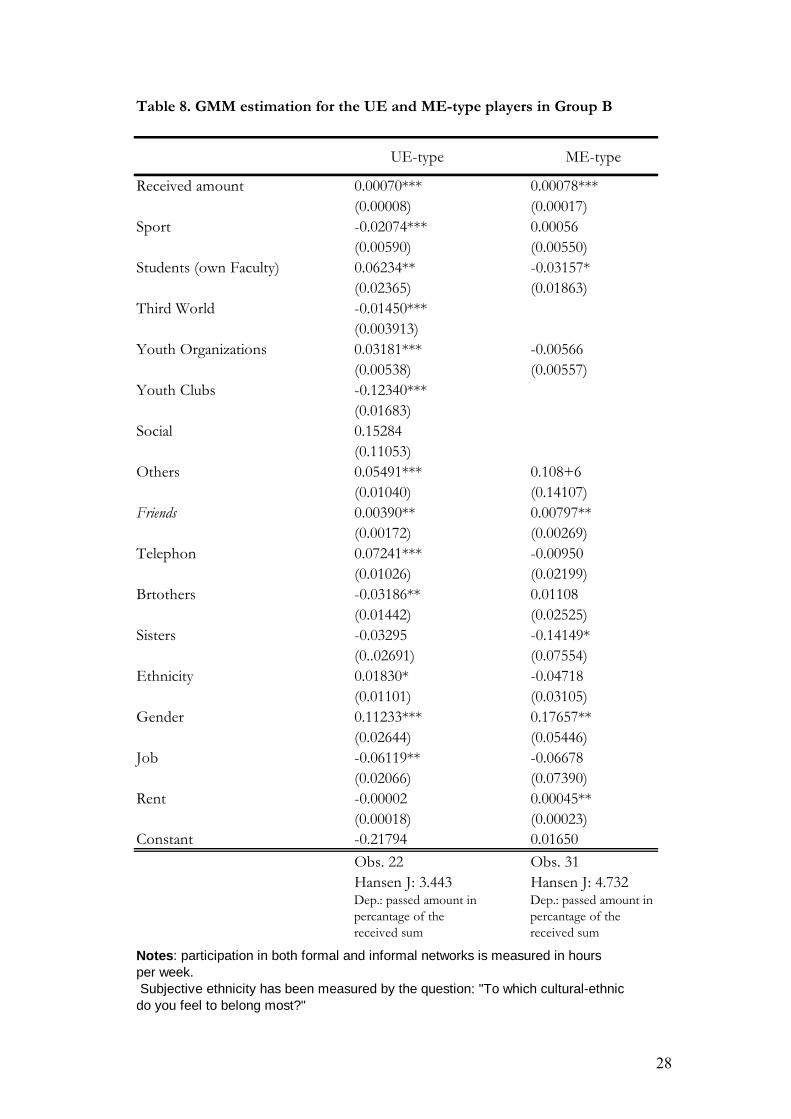
Table 8. GMM estimation for the UE and ME-type players in Group B
UE-type ME-type
Received amount 0.00070*** 0.00078***(0.00008) (0.00017)
Sport -0.02074*** 0.00056(0.00590) (0.00550)
Students (own Faculty) 0.06234** -0.03157*(0.02365) (0.01863)
Third World -0.01450***(0.003913)
Youth Organizations 0.03181*** -0.00566(0.00538) (0.00557)
Youth Clubs -0.12340***(0.01683)
Social 0.15284(0.11053)
Others 0.05491*** 0.108+6(0.01040) (0.14107)
Friends 0.00390** 0.00797**(0.00172) (0.00269)
Telephon 0.07241*** -0.00950(0.01026) (0.02199)
Brtothers -0.03186** 0.01108(0.01442) (0.02525)
Sisters -0.03295 -0.14149*(0..02691) (0.07554)
Ethnicity 0.01830* -0.04718(0.01101) (0.03105)
Gender 0.11233*** 0.17657**(0.02644) (0.05446)
Job -0.06119** -0.06678(0.02066) (0.07390)
Rent -0.00002 0.00045**(0.00018) (0.00023)
Constant -0.21794 0.01650Obs. 22 Obs. 31Hansen J: 3.443 Hansen J: 4.732
Notes: participation in both formal and informal networks is measured in hours per week. Subjective ethnicity has been measured by the question: "To which cultural-ethnicdo you feel to belong most?"
Dep.: passed amount in percantage of the received sum
Dep.: passed amount in percantage of the received sum
28
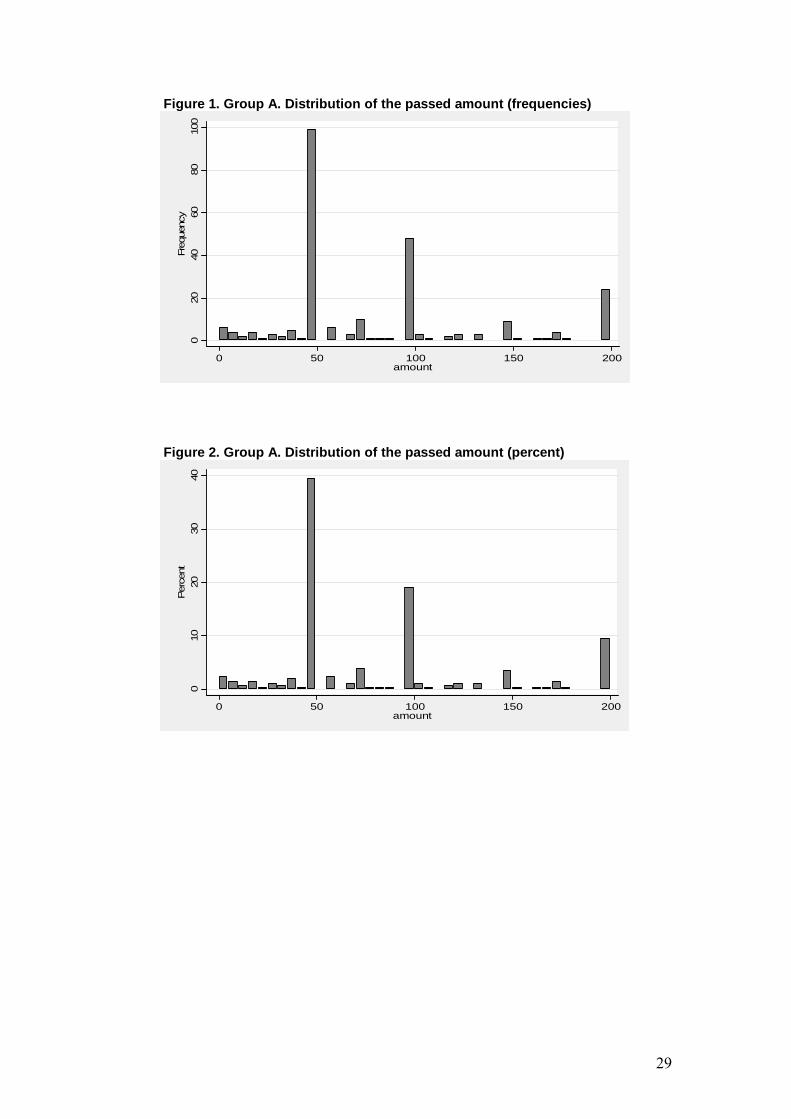
Figure 1. Group A. Distribution of the passed amount (frequencies)
Figure 2. Group A. Distribution of the passed amount (percent)
020
4060
8010
0Fr
eque
ncy
0 50 100 150 200amount
010
2030
40Per
cent
0 50 100 150 200amount
29
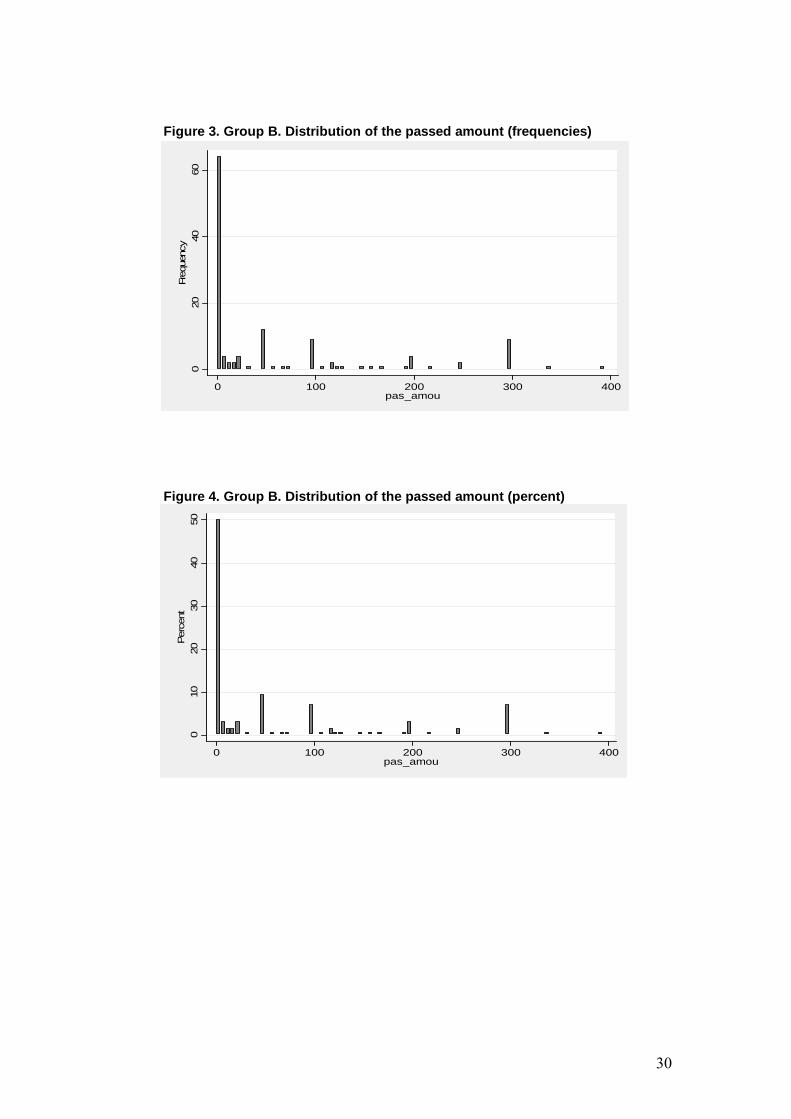
Figure 3. Group B. Distribution of the passed amount (frequencies)
Figure 4. Group B. Distribution of the passed amount (percent)
020
4060
Freq
uenc
y
0 100 200 300 400pas_amou
010
2030
4050
Perc
ent
0 100 200 300 400pas_amou
30
Refeferences
• Alesina, Alberto; La Ferrara, Eliana “Who Trusts others?” Journal of Public Economics August 2002, 85(2), pp. 207 – 234
• Andreoni, James; Vesterlund, Lise “Which Is the Fair Sex? Gender Differences in Altruism” The Quarterly Journal of Economics February 2001, 116(1), pp. 293 – 312
• Barkhuus, Louise “Why Everyone Loves to Text Message: Social Management with SMS” November 2005 (mimeo)
• Baum, Christopher F.; Schaffer, Mark E.; Stillman, Steven “Instrumental Variables and GMM: Estimation and Testing” Boston College Economics Working Paper n. 545, November 2002
• Berg, Joyce; Dickhaut, John; McCabe, Kevin “Trust, Reciprocity, and Social History” Games and Economic Behaviour July 1995, 10(1), pp. 122 – 142
• Boix, Carles; Posner, Daniel N. “Social Capital: Explaining Its Origins and Effects on Government Performance” British Journal of Political Science October 1998, 28(4), pp. 686 – 693
• Bouckaert, Jan; Dhaene, Geert “Inter-Ethnic Trust and Reciprocity: Results of an Experiment with Small Businessmen” European Journal of Political Economy November 2004, 20(4), pp. 869 – 886
• Bruni, Luigino; Sugden, Robert “Moral Canals: Trust and Social Capital in the Work of Hume, Smith and Genovesi” Economics and Philosophy April 2000, 16(1), pp. 21 – 45
• Carpenter, Jeffrey P.; Daniere, Amrita G.; Takahashi, Lois M. “Social Capital and Trust in South – East Asian Cities” Urban Studies April 2004, 41(4), pp. 853 – 874
• Claibourn, Michele P.; Martin, Paul S. “Trusting and Joining? An Empirical Test of the Reciprocal Nature of Social Capital” Political Behaviour December 2000, 22(4), pp. 267 – 291
• Croson, Rachel; Buchan, Nancy “Gender and Culture: International Experimental Evidence from Trust Games” The American Economic Review May 1999, 89(2), pp. 386 – 391
• Cubitt, Robin P.; Starmer, Chris; Sugden, Robert “On the Validity of the Random Lottery Incentive System” Experimental Economics September 1998, 1(2), pp. 115 – 131
• Durlauf, Steven N.; Fafchamps, Marcel “Social Capital” NBER Working Paper Series n. 10485, May 2004
• Eckel, Catherine C.; Grossman, Philip J. “Volunteers and Pseudo-Volunteers: the Effect of Recruitment Method in Dictator Experiments” Experimental Economics October 2000, 3(2), pp. 107 – 120
• Fehr, Ernst; Schmidt, Klaus M. “A Theory of Fairness, Competition, and Cooperation” The Quarterly Journal of Economics August 1999, 114(3), pp. 817 – 868
• Fehr, Ernst; Gächter, Simon “Fairness and Retaliation: the Economics of Reciprocity” Journal of Economic Perspectives Summer 2000, 14(3), pp.159 – 181
• Fershtman, Chaim; Gneezy, Uri “Discrimination in a Segmented Society” The Quarterly Journal of Economics February 2001, 116(1), pp. 351 – 377
• Grinter, Rebecca E.; Eldridge, Margery A. “y do tngrs luv 2 txt msg?” in Proceedings of the Seventh European Conference on Computer-Supported Cooperative Work Schmidt, K and Wulf, V (eds.), 2001, Kluwer Academic Publishers, Dodrecht, pp. 219 – 238
31
• Greene, William H. “Econometric Analysis” fifth edition, 2003, Prentice Hall, Upper Saddle River NJ
• Letki, Natalia; Evans Geoffrey “Endogenizing Social Trust: Democratisation in East-Central Europe” British Journal of Political Science 2005, 35
• Lin, Nan “Inequality in Social Capital” Contemporary Sociology November 2000, 29(6), pp. 785 – 795
• Migheli, Matteo “Exogenous Individual Characteristics and Social Capital in Western Europe” November 2005 (mimeo)
• Molm, Linda; Takahashi, Nobuyuki; Peterson, Gretchen “Risk and Trust in Social Exchange: an Experimental Test of a Classical Proposition” The American Journal of Sociology March 2000, 105(5), pp. 1396 – 1427
• Putnam, Robert D. Making Democracy Work: Civic Traditions in Modern Italy, Princeton University Press, Chihester, 1993
• Simpson, Brent “Sex, Fear, and Greed: a Social Dilemma Analysis of Gender and Cooperation” Social Forces September 2003, 82(1), pp. 35 – 52
32