the implications of cultural background on labour market...
TRANSCRIPT

1
The Implications of Cultural Background on Labour Market Choices: the Case of
Religion and Entrepreneurship
Luca Nunziata1 and Lorenzo Rocco2
This version: November 15th 2010
Abstract.
This paper aims at contributing to the recent literature on the relationship between culture and labour market outcomes by analyzing that peculiar aspect of cultural background represented by religion in relation to the choice of becoming an entrepreneur. We focus on the implications of Protestant versus Catholic religious denominations, each considered as distinct confessions of the same religion, i.e. Christianity. Our empirical analysis is based on European Social Survey data collected in four waves between 2002 and 2008 in 22 European countries. We capture the differential impact of Protestant versus Catholic ethic through a difference-in-differences approach based on the diverse minority status of both confessions across European regions. Our analysis suggests that religious denomination significantly affects the likelihood of becoming an entrepreneur (variously defined), after differencing out all possible confounders related to the minority versus majority characteristics of each religion denominations across regions, and including a large set of controls at the individual level. On average, a protestant individual has a 2% to 5% higher probability of being self-employed than a catholic individual. Our results are stable across a number of robustness checks.
JEL CODES: J24, J21, Z12, Z13
Keywords: Entrepreneurship, Self-employment, Religion, Culture, Protestantism, Catholicism.
Wordcount: around 9500 (excluding tables and figures).
1University of Padua and IZA.
2University of Padua.
2
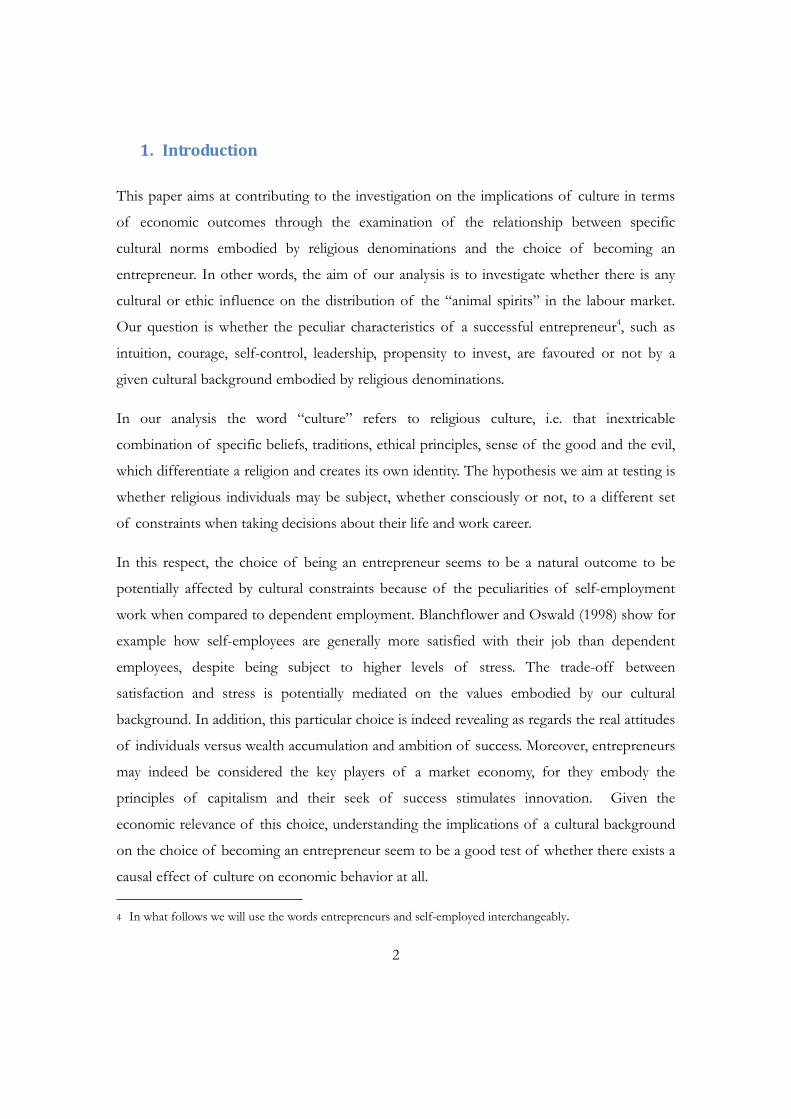
1. Introduction This paper aims at contributing to the investigation on the implications of culture in terms
of economic outcomes through the examination of the relationship between specific
cultural norms embodied by religious denominations and the choice of becoming an
entrepreneur. In other words, the aim of our analysis is to investigate whether there is any
cultural or ethic influence on the distribution of the “animal spirits” in the labour market.
Our question is whether the peculiar characteristics of a successful entrepreneur4, such as
intuition, courage, self-control, leadership, propensity to invest, are favoured or not by a
given cultural background embodied by religious denominations.
In our analysis the word “culture” refers to religious culture, i.e. that inextricable
combination of specific beliefs, traditions, ethical principles, sense of the good and the evil,
which differentiate a religion and creates its own identity. The hypothesis we aim at testing is
whether religious individuals may be subject, whether consciously or not, to a different set
of constraints when taking decisions about their life and work career.
In this respect, the choice of being an entrepreneur seems to be a natural outcome to be
potentially affected by cultural constraints because of the peculiarities of self-employment
work when compared to dependent employment. Blanchflower and Oswald (1998) show for
example how self-employees are generally more satisfied with their job than dependent
employees, despite being subject to higher levels of stress. The trade-off between
satisfaction and stress is potentially mediated on the values embodied by our cultural
background. In addition, this particular choice is indeed revealing as regards the real attitudes
of individuals versus wealth accumulation and ambition of success. Moreover, entrepreneurs
may indeed be considered the key players of a market economy, for they embody the
principles of capitalism and their seek of success stimulates innovation. Given the
economic relevance of this choice, understanding the implications of a cultural background
on the choice of becoming an entrepreneur seem to be a good test of whether there exists a
causal effect of culture on economic behavior at all. 4 In what follows we will use the words entrepreneurs and self-employed interchangeably.
3
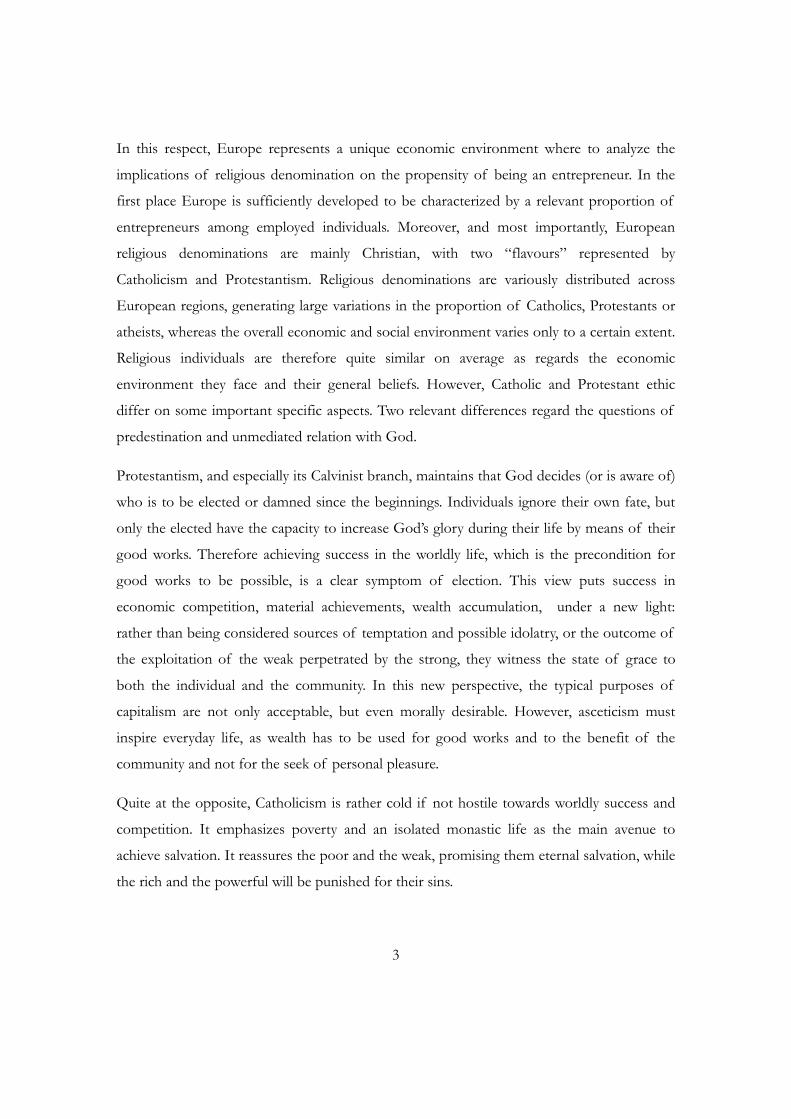
In this respect, Europe represents a unique economic environment where to analyze the
implications of religious denomination on the propensity of being an entrepreneur. In the
first place Europe is sufficiently developed to be characterized by a relevant proportion of
entrepreneurs among employed individuals. Moreover, and most importantly, European
religious denominations are mainly Christian, with two “flavours” represented by
Catholicism and Protestantism. Religious denominations are variously distributed across
European regions, generating large variations in the proportion of Catholics, Protestants or
atheists, whereas the overall economic and social environment varies only to a certain extent.
Religious individuals are therefore quite similar on average as regards the economic
environment they face and their general beliefs. However, Catholic and Protestant ethic
differ on some important specific aspects. Two relevant differences regard the questions of
predestination and unmediated relation with God.
Protestantism, and especially its Calvinist branch, maintains that God decides (or is aware of)
who is to be elected or damned since the beginnings. Individuals ignore their own fate, but
only the elected have the capacity to increase God’s glory during their life by means of their
good works. Therefore achieving success in the worldly life, which is the precondition for
good works to be possible, is a clear symptom of election. This view puts success in
economic competition, material achievements, wealth accumulation, under a new light:
rather than being considered sources of temptation and possible idolatry, or the outcome of
the exploitation of the weak perpetrated by the strong, they witness the state of grace to
both the individual and the community. In this new perspective, the typical purposes of
capitalism are not only acceptable, but even morally desirable. However, asceticism must
inspire everyday life, as wealth has to be used for good works and to the benefit of the
community and not for the seek of personal pleasure.
Quite at the opposite, Catholicism is rather cold if not hostile towards worldly success and
competition. It emphasizes poverty and an isolated monastic life as the main avenue to
achieve salvation. It reassures the poor and the weak, promising them eternal salvation, while
the rich and the powerful will be punished for their sins.

4
According to the Protestant ethic there is no need for intermediation between God and the
human being, nor sacraments and confession had any significance, because everybody’s state
of grace is predetermined. Instead, Protestants are encouraged to focus on self-reflection.
The path towards God is a personal one. This conception strengthens individualism and self-
confidence, two important personal characteristics in a capitalistic economy.
Symmetrically, Catholicism emphasizes the role of the priest as mediator between God and
men, the only allowed to administer the sacraments, required for keeping or restoring the
link with God. Much emphasis is also put on the need of a unique and standardized reading
of the Scriptures, and personal interpretations are refused.
Max Weber (1904) argued that these specificities of Protestantism were crucial in inducing
many individuals in pre-capitalistic societies to engage in secular activities. The spirit of
capitalism, which in Weber’s work may be defined as the rational pursuit of economic profit
and the morality attached to this scope, is fundamentally embodied by the attitude towards
entrepreneurship activities.
In the same spirit of Gruber (2005), we adopt a DID research design in order to identify a
causal effect of religious norms on economic outcomes by exploiting the specificity of
religious patterns in European regions. Our emphasis is therefore on carefully designing an
identification strategy which may enable us to assess whether there exists a causal link from
culture to economic outcomes, rather than identifying which is the value-related channel that
operates in this direction.
We focus on the structure of the geographical distributions of religious creeds across
European regions by looking at the minoritarian/majoritarian nature of Protestantism and
Catholicism in each European region. This distribution is mainly inherited from deep
historical processes, which may be safely considered exogenous to individual labour market
choices in current times.
The idea is that individuals belonging to minority creeds, have on average deeper adherence
to the bound of social and ethical norms carried by their religion, with respect to individuals
belonging to majority creeds. This does not mean that majority religious individuals cannot

5
individually personify their own religion’s values, but only that concentrating on minority
individuals, or more specifically on the differential impact of different minority religion
creeds, we are more likely to identify the effect of interest.
Using European Social Survey (ESS) data collected every two years from 2002 to 2008 in 22
European countries, our empirical strategy aims at capturing the differential impact of
Protestant versus Catholic “ethics” after differencing out all confounders related to the
minority status of each religious denomination across European regions, and including a
large set of controls at the individual as well as at the country\regional level. Importantly,
ESS includes information about parents’ occupation. This is a crucial bit of information, as
being raised in a family of entrepreneurs is a strong predictor of the propensity of
becoming an entrepreneur.
According to our empirical findings, Protestantism does indeed favor entrepreneurship. The
key result is that Protestants are about 2-5% more likely to be entrepreneurs than Catholics,
after controlling for individual, family background, regional characteristics and country or
regional fixed effects, which fully capture common national/regional cultural traits, the
extent to which legislation and fiscal policy favors entrepreneurship, and the
national\regional entrepreneurial propensity.
The paper is organised as follows. Section 2 discusses the relationship between religion and
entrepreneurship. Section 3 presents our identification strategy, tests its tenets and
introduces the model. Section 4 briefly describe data. Results and robustness checks are
displayed in Section 5. Section 6 concludes.
2. Culture and religion as economic factors. Guiso et al. (2006) provide a general introduction to the role of cultural traits in the
economy and make a distinction between a slow-moving component of culture transmitted
“fairly unchanged from generation to generation”, and a fast-moving component which may
be illustrated by peer-group effects. An example of the former could be represented by

6
religious beliefs. According to the authors, a cultural tradition may be the result of an
optimization process at societal level, but the cultural elements inherited by each individual
are not affected by individual experiences during their lifetime.
Tabellini (2005) provides some empirical evidence on the effects of culture on economic
outcomes, by measuring values and beliefs (such as trust, respect for others, confidence in
self-determination) at the regional level in Europe, and instrumenting them with a set of
historical variables. As a result the exogenous regional component of culture is found to be
correlated with current economic development.
More recently, Giavazzi et al (2009) focuses on the role played by cultural attitudes towards
gender, the young and leisure, by showing how these can explain women and young
employment dynamics, as well as total hours worked in OECD countries.
Guiso et al (2009) show instead how trust of European citizens towards other countries,
rooted in culture, can explain trade and foreign investment patterns. Under the Guiso et al
framework the link goes from culture (deep) to beliefs and values; and from beliefs and
values to economic outcomes.
The strand of economic research on religion has been inaugurated by Iannacone (1988). He
views religious norms as endogenously produced by optimization at group-level. Thereafter,
an increasing interest was devoted to the role and the mechanism of religion, both from a
theoretical (e.g. Benabou and Tirole, 2006) and an empirical perspective (Becker and
Woessmann, 2009; Gruber and Hungerman, 2008, among many others).
However, the link between religion and the choice of becoming an entrepreneur has not
been previously empirically investigated except for few papers, none of which adopts a focus
on the specificities of Europe. Audretsch et al. (2007) find that in India Islam and
Christianity favors entrepreneurship, while Hinduism inhibits it. Minns and Rizov (2005)
study entrepreneurship in Canada at the beginning of the 20th Century and find that
Catholics were less likely to become entrepreneurs than Protestants. Guiso et al (2007)
conclude that “Buddhism and Christianity seem most conducive to capitalism, and Islam the
least”.
7
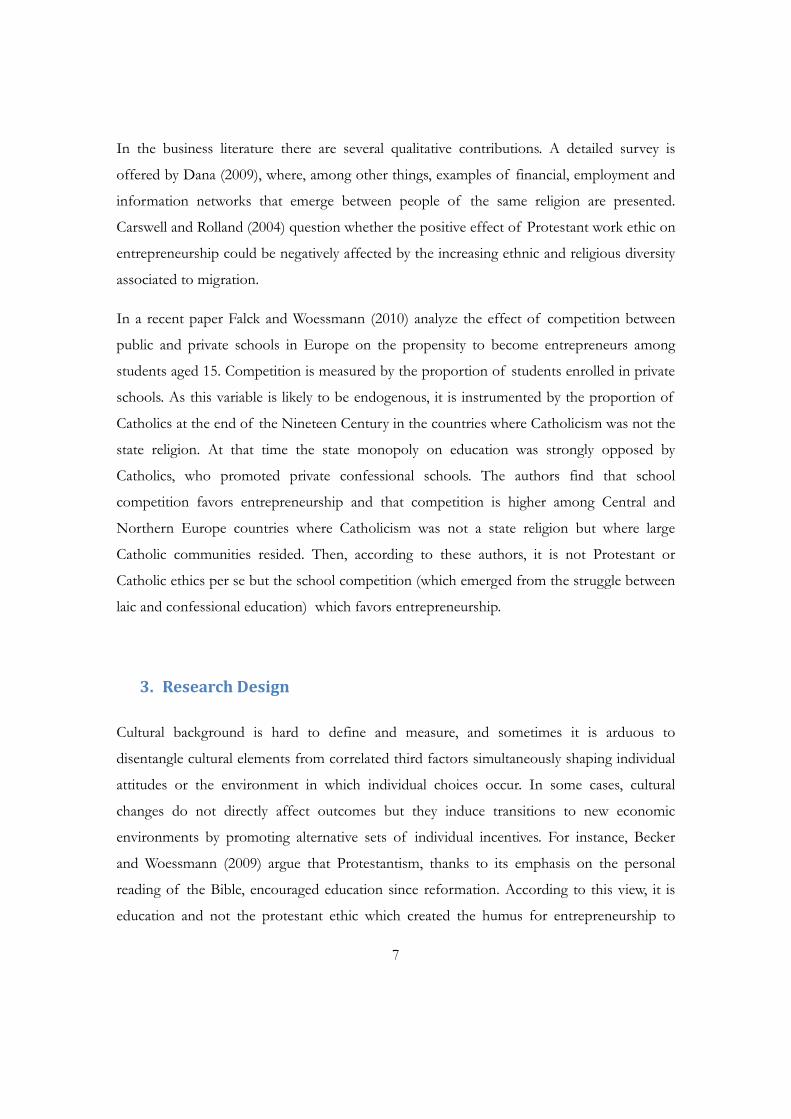
In the business literature there are several qualitative contributions. A detailed survey is
offered by Dana (2009), where, among other things, examples of financial, employment and
information networks that emerge between people of the same religion are presented.
Carswell and Rolland (2004) question whether the positive effect of Protestant work ethic on
entrepreneurship could be negatively affected by the increasing ethnic and religious diversity
associated to migration.
In a recent paper Falck and Woessmann (2010) analyze the effect of competition between
public and private schools in Europe on the propensity to become entrepreneurs among
students aged 15. Competition is measured by the proportion of students enrolled in private
schools. As this variable is likely to be endogenous, it is instrumented by the proportion of
Catholics at the end of the Nineteen Century in the countries where Catholicism was not the
state religion. At that time the state monopoly on education was strongly opposed by
Catholics, who promoted private confessional schools. The authors find that school
competition favors entrepreneurship and that competition is higher among Central and
Northern Europe countries where Catholicism was not a state religion but where large
Catholic communities resided. Then, according to these authors, it is not Protestant or
Catholic ethics per se but the school competition (which emerged from the struggle between
laic and confessional education) which favors entrepreneurship.
3. Research Design
Cultural background is hard to define and measure, and sometimes it is arduous to
disentangle cultural elements from correlated third factors simultaneously shaping individual
attitudes or the environment in which individual choices occur. In some cases, cultural
changes do not directly affect outcomes but they induce transitions to new economic
environments by promoting alternative sets of individual incentives. For instance, Becker
and Woessmann (2009) argue that Protestantism, thanks to its emphasis on the personal
reading of the Bible, encouraged education since reformation. According to this view, it is
education and not the protestant ethic which created the humus for entrepreneurship to

8
develop in reformed areas. Taking this view to the extreme, if the same amount and
distribution of education was exogenously transplanted into Catholic or Muslim countries,
entrepreneurship would develop in a similar fashion, keeping other non-cultural factors
fixed.
In order to identify the effect of cultural elements embodied by religion on a specific
outcome of interest, a researcher should set up an identification strategy that specifically
deals with confounding factors. A suitable context where this may be possible is Europe,
which is a continent characterized by well established regional religious traditions, mostly
related to Christianity, but that still differ in a number of ways as regards basic ethical
principles and prescriptions. Protestantism and Catholicism are indeed distinct confessions
of the same religion, Christianity, and they share a large part of their beliefs and values, while
differing only with respect to certain peculiar cultural aspects that may be the driver of our
empirical modelling. In addition, European Catholics and Protestants operate in similar
economic contexts, they share a similar access to education, which is guaranteed regardless
of individual religion, and share similar languages (in same cases identical, such as in the
Netherlands, Germany and the UK) and other cultural dimensions. There is no negative
discrimination on the labor market which could lead to entrepreneurships as a sort of
obliged way (Clark and Drinkwater, 2000). Therefore Protestants and Catholics are on
average homogenous in terms of what matters to entrepreneurship, except for their specific
religious culture.
However, a well known fact from the literature is that adherence to a certain religious creed
does not necessarily imply internalization of religious ethical principles. That’s why various
religiousness intensity indicators have been used before in order to measure the different
degree of attachment of individuals to religious cultural beliefs. Most of these indicators, e.g.
frequency of attendance of religious services, donation of money and time to religious
organizations, are however endogenous to labour market choices. We should instead use a
religious intensity measure which is exogenous to our outcome of interest.
In this context, our identification strategy rests on four pillars.
9
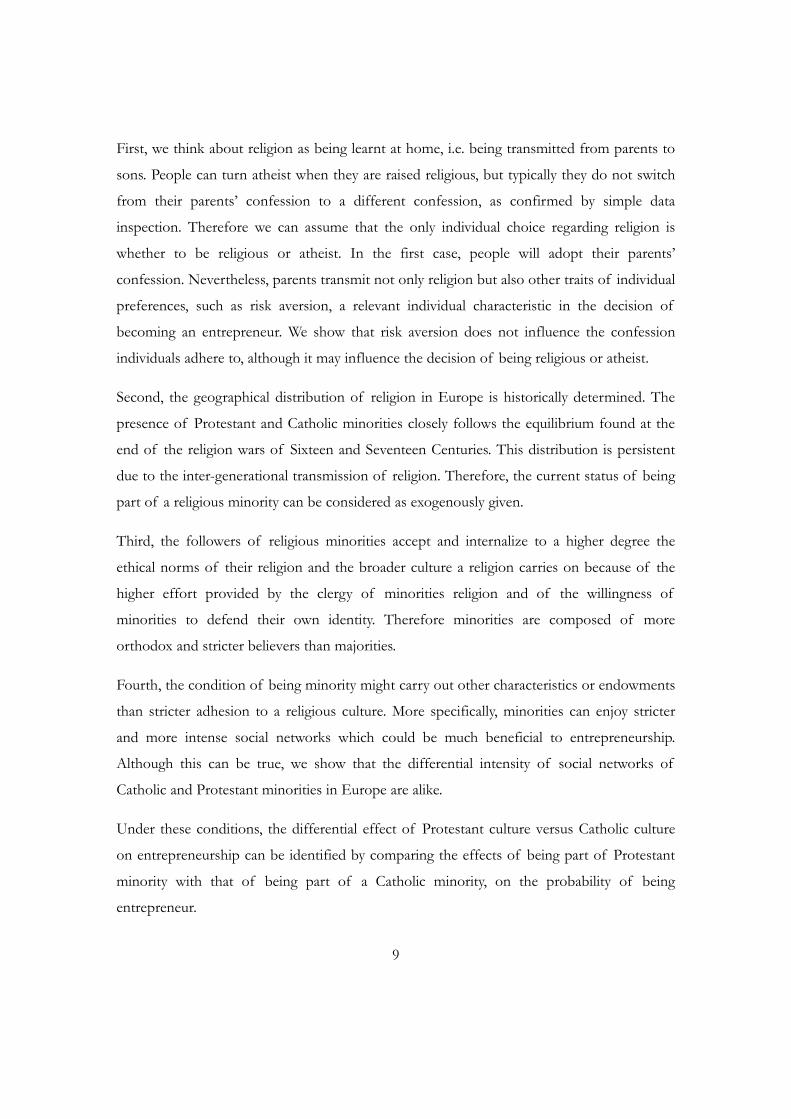
First, we think about religion as being learnt at home, i.e. being transmitted from parents to
sons. People can turn atheist when they are raised religious, but typically they do not switch
from their parents’ confession to a different confession, as confirmed by simple data
inspection. Therefore we can assume that the only individual choice regarding religion is
whether to be religious or atheist. In the first case, people will adopt their parents’
confession. Nevertheless, parents transmit not only religion but also other traits of individual
preferences, such as risk aversion, a relevant individual characteristic in the decision of
becoming an entrepreneur. We show that risk aversion does not influence the confession
individuals adhere to, although it may influence the decision of being religious or atheist.
Second, the geographical distribution of religion in Europe is historically determined. The
presence of Protestant and Catholic minorities closely follows the equilibrium found at the
end of the religion wars of Sixteen and Seventeen Centuries. This distribution is persistent
due to the inter-generational transmission of religion. Therefore, the current status of being
part of a religious minority can be considered as exogenously given.
Third, the followers of religious minorities accept and internalize to a higher degree the
ethical norms of their religion and the broader culture a religion carries on because of the
higher effort provided by the clergy of minorities religion and of the willingness of
minorities to defend their own identity. Therefore minorities are composed of more
orthodox and stricter believers than majorities.
Fourth, the condition of being minority might carry out other characteristics or endowments
than stricter adhesion to a religious culture. More specifically, minorities can enjoy stricter
and more intense social networks which could be much beneficial to entrepreneurship.
Although this can be true, we show that the differential intensity of social networks of
Catholic and Protestant minorities in Europe are alike.
Under these conditions, the differential effect of Protestant culture versus Catholic culture
on entrepreneurship can be identified by comparing the effects of being part of Protestant
minority with that of being part of a Catholic minority, on the probability of being
entrepreneur.

10
In what follows we will first discuss each of the assumptions upon which our research
design rests, then we will present the empirical analysis based on the identification strategy
described above. We will start by discussing the inheritance of religious denominations from
parents.
1) Religion is inherited by parents
Religion and religiosity are transmitted by parents to sons, generation after generation (Hoge
et al., 1982; Clark and Worthington, 1987; Ozorak, 1989; Hayes and Pittelkow, 1993; Bañas
and Noemann, 2006). A rather large number of people turn atheist, especially in the last
decades when we have assisted to an acceleration of the process of secularization in Europe,
but very few people change their religion.
Looking at the data of the newly released ISSP Religion III survey collected in 2008, 96
percent of respondents with two Catholic parents have been raised Catholic. This figure is
only slightly smaller for Protestants (94 percent). Of those raised Catholic, 84 percent
continue to follow their denomination when adult, while 15 percent turn atheist and only
about 1 percent convert to Protestantism. The parallel figures for Protestants are 78 percent,
20 percent and 1 percent respectively. Overall about 80 percent follow parents’ confession
with a slightly higher persistence among Catholics. These proportions change somewhat
among minorities. Among Protestant minorities, 66 percent keep parents’ religion, 26
percent turn atheists and 8 percent convert to Catholicism. Similar numbers are observed
among Catholic minorities. Such higher erosion is partly explained by the fact that only
about 50 percent of people belonging to a minority spouse someone with the same religion,
compared to more than 80% in the total population. Looking at the previous ISSP Religion I
(1991) and II (1998) surveys, persistence was higher even among minorities.
Generally, conversion to another confessions is uncommon. Instead, as seen, many people
become atheist5, despite having being raised in a religious household. They are about 4.95
years younger [c.i. 4.23 – 5.48], 11 percent [c.i. 9-13] more likely to be male, 13 percent [c.i. 5 Similar patterns have been found using both ISSP Religion 2 (1998) and ISSP Religion 1 (1991) data on
subsamples of countries, except secularization being less pronounced.

11
11-15] more likely to be employed and they have on average 1.30 additional years of
education [c.i. 1.16-1.44]6. On the other hand, conversion from atheism to either
Catholicism or Protestantism is limited: 83 percent of those raised atheist continue to
declare themselves atheists, 5 percent convert to Catholicism and 12 to Protestantism.
Being Catholic, Protestant or atheist might be correlated with several attributes of individual
preferences. This is because both religion and some character traits are learnt in the family.
For instance the growing literature of endogenous preferences suggests that time
preferences (Doepke and Zilibotti, 2005) or trust (Guiso, Sapienza, Zingales, 2008) are partly
decided and shaped by parents. Similarly it is reasonable to suppose that risk aversion is
learned in the family. We have used SOEP 2004 data to assess whether there are any
differences between Catholics and Protestants in terms of risk aversion in Germany. We
focus on risk aversion because it has been indicated as one important ingredient of
entrepreneurship (see Kihlstrom and Laffont (1979); Ekelund et al. (2005) among many
others).
The overall message of this analysis, detailed in Appendix A, is that there are no systematic
differences in terms of risk aversion between Catholic and Protestants. This is reassuring as
any difference in the level of entrepreneurship between the two confession cannot be
ascribed to risk aversion. We have less conclusive indication regarding the difference between
religious people and atheists, but possible differences will not bias our results.
2- Minorities are stable over the long run
6 t-test based across the sample of people coming from a household where both parents were religious, either
Catholic or Protestant, who turn atheist and the sample of people with the same background
who remains religious, controlling for country dummies.
12
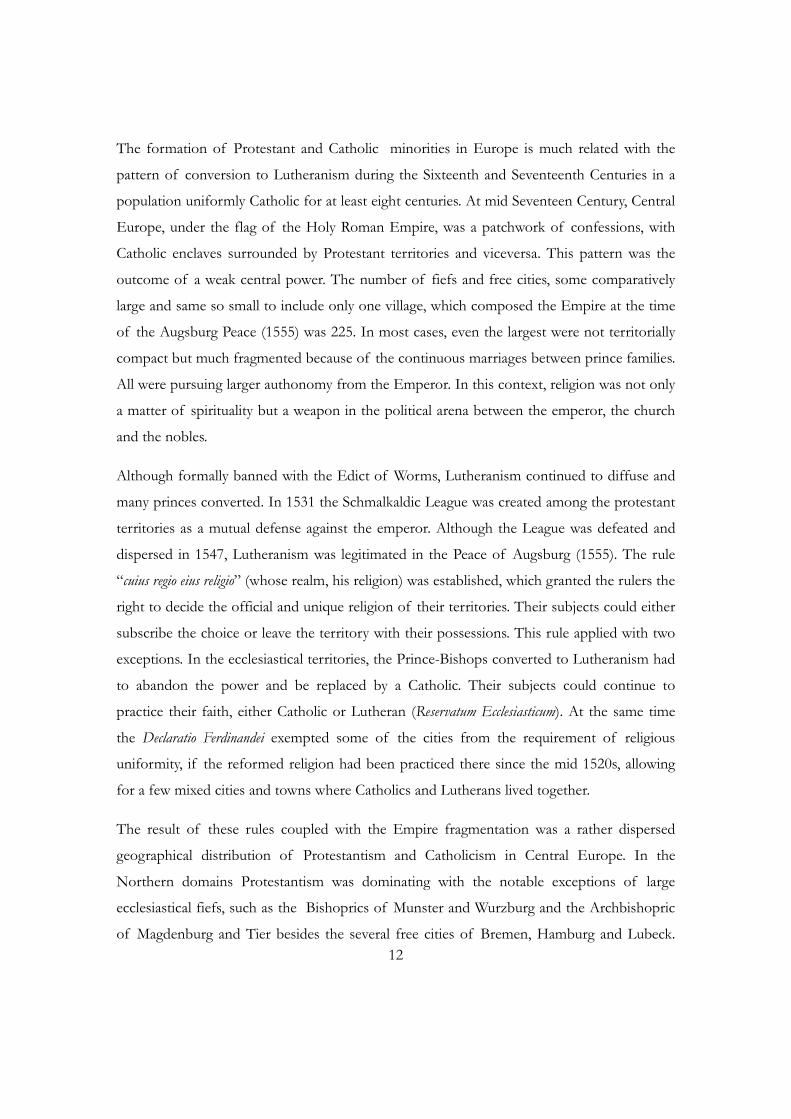
The formation of Protestant and Catholic minorities in Europe is much related with the
pattern of conversion to Lutheranism during the Sixteenth and Seventeenth Centuries in a
population uniformly Catholic for at least eight centuries. At mid Seventeen Century, Central
Europe, under the flag of the Holy Roman Empire, was a patchwork of confessions, with
Catholic enclaves surrounded by Protestant territories and viceversa. This pattern was the
outcome of a weak central power. The number of fiefs and free cities, some comparatively
large and same so small to include only one village, which composed the Empire at the time
of the Augsburg Peace (1555) was 225. In most cases, even the largest were not territorially
compact but much fragmented because of the continuous marriages between prince families.
All were pursuing larger authonomy from the Emperor. In this context, religion was not only
a matter of spirituality but a weapon in the political arena between the emperor, the church
and the nobles.
Although formally banned with the Edict of Worms, Lutheranism continued to diffuse and
many princes converted. In 1531 the Schmalkaldic League was created among the protestant
territories as a mutual defense against the emperor. Although the League was defeated and
dispersed in 1547, Lutheranism was legitimated in the Peace of Augsburg (1555). The rule
“cuius regio eius religio” (whose realm, his religion) was established, which granted the rulers the
right to decide the official and unique religion of their territories. Their subjects could either
subscribe the choice or leave the territory with their possessions. This rule applied with two
exceptions. In the ecclesiastical territories, the Prince-Bishops converted to Lutheranism had
to abandon the power and be replaced by a Catholic. Their subjects could continue to
practice their faith, either Catholic or Lutheran (Reservatum Ecclesiasticum). At the same time
the Declaratio Ferdinandei exempted some of the cities from the requirement of religious
uniformity, if the reformed religion had been practiced there since the mid 1520s, allowing
for a few mixed cities and towns where Catholics and Lutherans lived together.
The result of these rules coupled with the Empire fragmentation was a rather dispersed
geographical distribution of Protestantism and Catholicism in Central Europe. In the
Northern domains Protestantism was dominating with the notable exceptions of large
ecclesiastical fiefs, such as the Bishoprics of Munster and Wurzburg and the Archbishopric
of Magdenburg and Tier besides the several free cities of Bremen, Hamburg and Lubeck.

13
The South was predominantly Catholic, with the traditionally Catholic Bavaria and Austria,
but with several free cities such as Augsburg, Ulm and Krepten largely or significantly
protestant. The same Wurttemberg (the second larger southern fief) joined the Schmalkaldic
League before being restored to Catholicism.
Religion wars continued in Europe for almost hundred years. The peace of Westphalia
(1648) which ended the Thirty Years war confirmed the religious situation emerged one
century before with the Peace of Augsburg. Furthermore, it made the imperial power more
symbolic than real, wiping out its chances of achieving the goal of a unique religion in the
Empire, thus guaranteeing the ultimate enrooting of Protestantism.
Essentially the same religious pattern emerged three centuries ago is present in Central
Europe nowadays. This is apparent comparing Figure 1 and 2. In the former we have
reported the map of the Holy Roman Empire after the Westphalia Treaty, highlighting the
the Habsburg domains, Bavaria, and the Ecclesiastic possessions, that is the areas with a
massive Catholic presence. In the latter we represent the same area nowadays with the
proportion of Catholics in each region. The two matches to a large extent. For instance the
regions bordering with the Netherlands, covered by the important Bishopric of Munster
show a significant Catholic population also nowadays, although the Netherlands and the
remaining North-Eastern Germany are traditionally Protestant.
FIGURES 1 AND 2 AROUND HERE
3- Minorities are more adherent to ethical norms
Although minorities suffer from a certain erosion, it has been claimed in the literature that
members of minority religions are the perfect believers, because they are more religious and
more observant of the ethical norms compared to the followers of the same religion when
they are majority. This may be true for at least two reasons. First because ministers of a

14
minority religion work harder to defend its identity against the competition of other
religions (market-share hypothesis, Stark, Finke, and Iannaccone 1995; Finke and Stark 1998;
Stark 1997). Second, because religion is an important factor of people identity, beside
language, history and culture, and it is considered by its followers a value to be preserved
against the influence of the majority (Bisin and Verdier, 2000).
According to this view, the religious culture is better observed in minorities, while it is rather
diluted and contaminated in majorities.
To test the strength of the correlation between adhesion and market share of a religion, we
use again ISSP Religion III data. We look at four possible outcomes, two related to the
intensity of religiosity and two to articles of faith. The first two are the (log) number of
times the individual prays in a year7 and a self-assessment of his religiosity, measured by a
dummy which takes 1 when he reports to be “extremely, very or somewhat religious” and 0
when reports from “neither religious nor not religious” to “extremely not religious”. The
remaining indicators are two dummies derived from the following questions. People are
asked whether they agree (on a scale from 1 to 5) with the statement “I have my own way of
connecting with God without churches or religious services”. Personal and unmediated
relation with God is one tenet of the Protestant confession, which acknowledges a minor
role to the clergy and the religious institution compared to the Catholic confession. Next,
respondents express their agreement on the statement “There is little that people can do to
change the course of their lives”. This question is related to another point of differentiation
between the two confessions. On the one hand Catholicism states that salvation can be
obtained and deserved by means of the good works. On the other hand Protestantism
indicates that salvation is a God’s grace which cannot be deserved by the necessarily
imperfect individual actions and that only faith counts. These last two indicators are coded as
dummies taking one when the individual strongly agrees or agrees and zero otherwise.
The estimated empirical equation is
7 Praying should depend mainly on individual religiosity and only marginally on the “supply” of churches and
priests, opposed to attendance to religious services.

15
irriririririririr XMAMPMCPCY εμβαααααα ++++++++= 543210 (1)
over the restricted sample of those declaring to be Catholic, Protestant or atheist. The
alternative outcomes irY of individual i living in region r are regressed over individual
confession, captured by two dummies, C for Catholicism and P for Protestantism, and
minorities conditions, captured by three dummies, MC, MP and MA which take on 1 when
the individual’s confession is minority in his region of residence. Next gender, age, years of
education, employment condition, urban or rural residence, generally denoted by X, are
included as controls, as well as regional fixed effects rμ which capture regional
characteristics common to all residents irrespectively of their faith (such as regional religious
composition). Coefficients 3α and 4α identify the differential effect of minorities compared
to the remaining population of the same faith. This is a model similar to that estimated in
Gruber (2005).
Regions are defined as the lowest level of geographical disaggregation available in the data.
In most cases, it ranges from an equivalent of NUTS1 to NUTS3 (sometimes imperfect) and
in few cases it has no clear correspondence with the standard classification (e.g. for
Denmark). This choice has been motivated by the need of capturing the minority conditions
as precisely as possible. Actually, sometimes minorities are territorially concentrated in rather
small enclaves where in fact their market share is relevant. We have also estimated the model
by defining regions as a geographical entity aggregated at least at level NUTS2, but results do
not qualitatively change if alternative definitions apply. Whatever the definition, we retain
only regions with more than 30 observations. This implies that in the first case the resulting
sample size is smaller (about 16,700 observations against 18,400).
We consider four alternative definition of minority, that we introduce here but we shall use
in the sequel of the paper as well.
Definition D: confession dir of an individual i residing in region r is considered minority if its
market-share in region r is less than 25%.

16
Definition E: confession dir of an individual i residing in region r is considered minority if a)
the condition in Definition D holds; and b) the market-share of dir is the smallest in region r
Definition F: religion dir of an individual i residing in region r is considered minority if
condition of Definition D holds; and b) if dir is Protestant (resp. Catholic) its market-share is
smaller than the share of Catholicism (resp. Protestantism); c) if dir is atheist, its market-
share is the smallest
Definition G: religion dir of an individual i residing in region r is considered minority if
conditions E.b and E.c alone hold.
Definition E is the most stringent, while a priori no clear ranking exists among the other
three. However, definition D and F and the one side and definitions E and G on the other
side turn out to map to a similar set of regions. Only in this section, thanks to the richness
of ISSP data regarding religious family background, market shares are defined not on
respondents’ religion but on the religion of their parents. This allows to better identify the
long term religious distribution in the regions, avoiding the fluctuations connected with the
recent secularization.
TABLE 2 AROUND HERE
The estimated coefficients of MC and MP with their robust standard errors are reported in
Table 2 for each outcome and each definition of minority. As expected religious minorities
tend to pray more and to be more religious than their “majority” counterparts, whatever the
definition of minority used. This results contrasts with Gruber (2005)’s, where a positive
relation has been found in the US between attendance to religious services and the share of
residents sharing the same confession, in spite of the similar specification of the model8.
8 Actually, we have found evidence that also attendance is larger among minorities, although for definitions D
and E coefficients are not precisely estimated for minority Catholics.
17
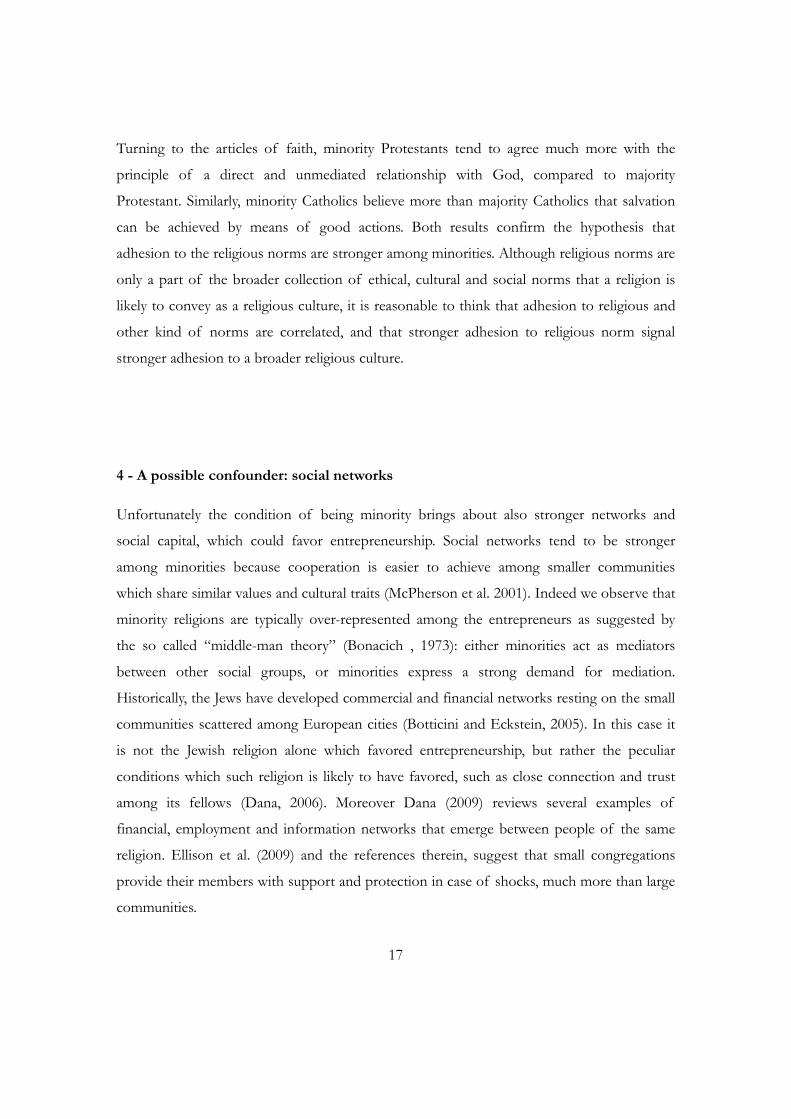
Turning to the articles of faith, minority Protestants tend to agree much more with the
principle of a direct and unmediated relationship with God, compared to majority
Protestant. Similarly, minority Catholics believe more than majority Catholics that salvation
can be achieved by means of good actions. Both results confirm the hypothesis that
adhesion to the religious norms are stronger among minorities. Although religious norms are
only a part of the broader collection of ethical, cultural and social norms that a religion is
likely to convey as a religious culture, it is reasonable to think that adhesion to religious and
other kind of norms are correlated, and that stronger adhesion to religious norm signal
stronger adhesion to a broader religious culture.
4 - A possible confounder: social networks
Unfortunately the condition of being minority brings about also stronger networks and
social capital, which could favor entrepreneurship. Social networks tend to be stronger
among minorities because cooperation is easier to achieve among smaller communities
which share similar values and cultural traits (McPherson et al. 2001). Indeed we observe that
minority religions are typically over-represented among the entrepreneurs as suggested by
the so called “middle-man theory” (Bonacich , 1973): either minorities act as mediators
between other social groups, or minorities express a strong demand for mediation.
Historically, the Jews have developed commercial and financial networks resting on the small
communities scattered among European cities (Botticini and Eckstein, 2005). In this case it
is not the Jewish religion alone which favored entrepreneurship, but rather the peculiar
conditions which such religion is likely to have favored, such as close connection and trust
among its fellows (Dana, 2006). Moreover Dana (2009) reviews several examples of
financial, employment and information networks that emerge between people of the same
religion. Ellison et al. (2009) and the references therein, suggest that small congregations
provide their members with support and protection in case of shocks, much more than large
communities.

18
Thus a stronger social connection could be the key to successful entrepreneurship. In
Appendix B we explore whether this is the case in Europe with Catholic and Protestant
minorities, by using data collected in the ISSP survey on Social Networks II produced in
2001. We have focused on the set of European countries excluding those with Christian
Orthodox majorities.
There is absolutely no evidence of a systematic difference between minorities in terms of
social connection for whatever indicator and minority definition. We have also found no
difference between minorities and “majorities”. Such results reassure about the ability of our
strategy of identify the effects of religious culture.
4. The Model We estimate a model similar to equation (1) on a sample composed of European Protestants,
Catholics and atheists, excluding other non-Christian religious minorities9:
irccrcircircircircircircirc WXMAMPMCPCY εμββαααααα +++++++++= 21543210 (2)
where ircY indicates whether individual i living in region r of country c is self-employed.
Individual confession Catholic or Protestant is captured by the dummies C and P. Individual
i might live in a region where her religion is minority. The dummies MC, MP and MA
(minority atheists) capture this condition. Further Xirc and Wrc are individual and regional
9 We exclude individuals belonging to the following religious denominations: Christian Orthodox, Jewish,
Muslim, Eastern Religions, other denominations.

19
characteristics, cμ are country fixed effects, and ircε is the error term10. This is a
generalization of a standard difference-in-differences model.
We are interested in the differential effect of Protestantism on the propensity to
entrepreneurship compared to Catholicism. Consider the following diagram (Figure 3). The
propensity of entrepreneurship is measured on the vertical axis and the degree of adhesion
to a religious culture is reported on the horizontal axis. Whatever the confession, if the
degree of adhesion is minimal, the propensity to self-employment is not affected by the
religious culture and fully depends on other factors (the vertical intercept on the diagram).
As far as adhesion increases, confessions have an effect on the propensity to self-
employment, possibly in a specific way. The difference among the effects is approximately
zero between majorities and non-zero between minorities. Thus, the difference between
these differences captures the full differential effect of Protestantism compared to
Catholicism, purified of any possible common trend, which can derive by the more intense
social networks that co-move with adhesion, as discussed in the previous section.
FIGURE 3 AROUND HERE
Formally the difference-in-differences quantity is defines as
),,,0,1|(),,,1,1|([)],,,0,1|(),,,1,1|([
crcircircircirccrcircircircirc
crcircircircirccrcircircircirc
WXMCCYEWXMCCYEWXMPPYEWXMPPYEDIDμμ
μμ==−==
−==−===
(3)
which is equivalent to
10 Compared to model (1), regional fixed effects have been removed while regional and country level controls
W have been included. Regional controls are time-varying but rather slow-moving: thus they are unsuitable
to be used with regional fixed effects. Nevertheless, a variant of model (2) including regional fixed effects
has been estimated and it will be discussed in Section 5.
20
43 αα −=DID (4)
Note that individual preferences, such as risk aversion, on average do not affect this quantity
if their distribution across confessions is alike, as suggested by our analysis11.
The hypothesis that religious culture is less compelling in shaping individual behavior among
majorities (actually among non minorities) implies that 21 αα = . This condition provides a
simple test of specification for our story.
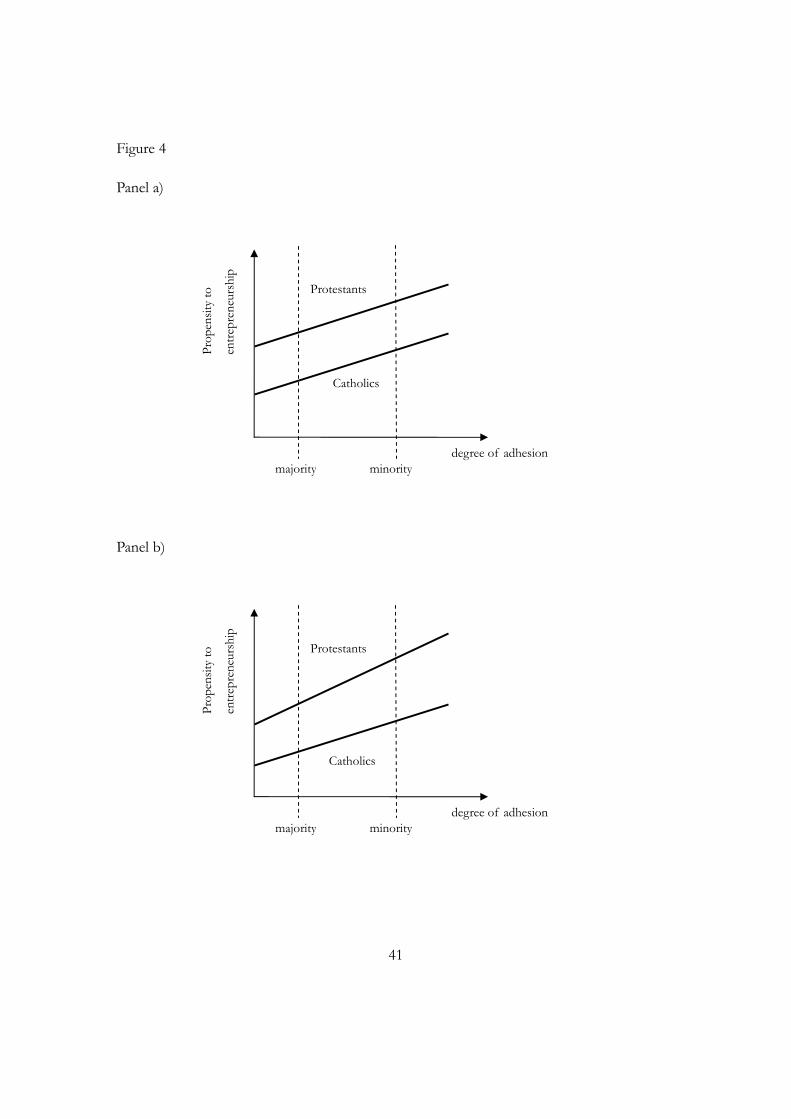
FIGURE 4 AROUND HERE
Consider a situation like the one depicted in Figure 4 panel a), where the difference between
the two confessions is the same both in majorities and minorities. In this case our DID=0
turn to be the proper specification test, while 21 αα − captures the entire differential effect
of Protestantism. Finally in Figure 4 panel b) we have represented the intermediate case of a
non-negligible difference among majorities. This could occur when the proportion of
atheists is large, the market share of either Protestants and Catholics are rather large but they
can be hardly defined majorities (rather they are large minorities). In this case the total
differential effect of Protestantism would be given by the quantity )( 21 αα −+DID .
5. Data and Empirical Analysis Our sample consists of European Social Survey (ESS) data collected every two years from
2002 to 2008 on a number of Western and Eastern European countries. We select all
11 Put in another way, in our framework of analysis we only require risk aversion not to be systematically
different between Protestants and Catholics for reasons unrelated to their embodied social norms.
21
countries where Orthodox religion is not majority and exclude all non-Christian religious
minorities, ending up with 22 Euro countries, 126,598 individuals in the sample, of which
70,265 are active in the labour market. The remaining countries in the sample are Austria,
Belgium, Italy, Luxembourg, Czech-Republic, Netherlands, Denmark, Norway, Estonia,
Poland, Finland, Portugal, France, Slovakia, Germany, Slovenia, Spain, Hungary, Sweden,
Switzerland, Ireland, United Kingdom. The countries represented in the sample include
therefore the major Western-European and a number of Eastern-European whose religious
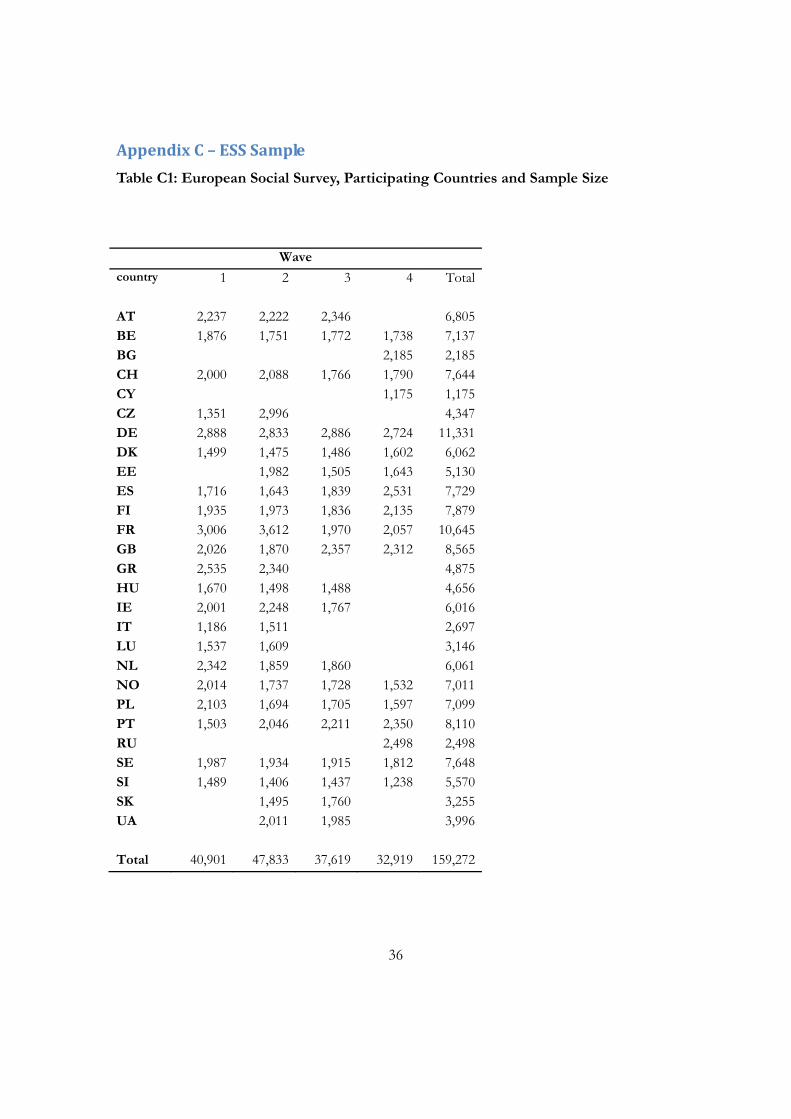
tradition is not Orthodox. Table A1 in the Appendix shows the participation of each
country to each wave of the ESS.
In order to identify religious minorities across Europe according to the definitions given
above, and to control for unobservable characteristics of geographical areas of residence we
consider regional patterns in religious denominations. Ideally, regions should be comparable
in terms of their population and size. The Eurostat NUTS classification provides four level
of aggregation: NUTS 0 identify countries; NUTS 1 macro-regions with a population
between 3 and 7 million; NUTS 2 regions with a population between 800 thousands and 3
million; NUTS 3 regions (sub-regions in most cases) with a population between 150
thousands and 800 thousands. Unfortunately not all surveyed countries report the same
NUTS level, some being more disaggregated (up to level 3) and some being only at level 1.
Moreover in some cases the number of observation at higher levels is too small and have
forced us to aggregate downwards. Eventually, we have defined our regions according to the
following alternative schemes:
Region 0 : each country coincides with a region
Region 1: NUTS 1 whenever possible, NUTS 0 otherwise
Region 2: NUTS 2 whenever possible, Region 1 aggregation otherwise
Region 3: NUTS 3 whenever possible, Region 2 aggregation otherwise
FIGURES 5 AND 6 AROUND HERE

22
The large sample size allows us to define up to Region 3. It is possible to have an idea on how
our minority and region definition interact by looking at Figures 5 and 6. In Figure 5 (resp. 6)
we report the proportion of Protestant (resp. Catholic) minorities by using ESS data
according to each definition of minority at the most disaggregate level possible (Region 3).
We note that only few regions in Germany, UK, Sweden and Latvia are affected by the
alternative definitions of minority and only when Protestantism is considered. Instead the
regions reporting Catholic minorities are essentially the same across definitions. The number
of regions in the ESS dataset is 220 under the definition Region 3, 177 under Region 2, 90
under Region 1 and 22 under Region 0.
FIGURES 7 AND 8 AROUND HERE
Table 4 displays the proportion of the three religious denominations in each country
included in the sample, while Table 5 and Figures 7 and 8 show the proportion of the
surveyed individuals who are, respectively, self-employed, self-employed with at least 1
dependent employee and self-employed with at least 10 dependent employees.
TABLES 4 AND 5 AROUND HERE
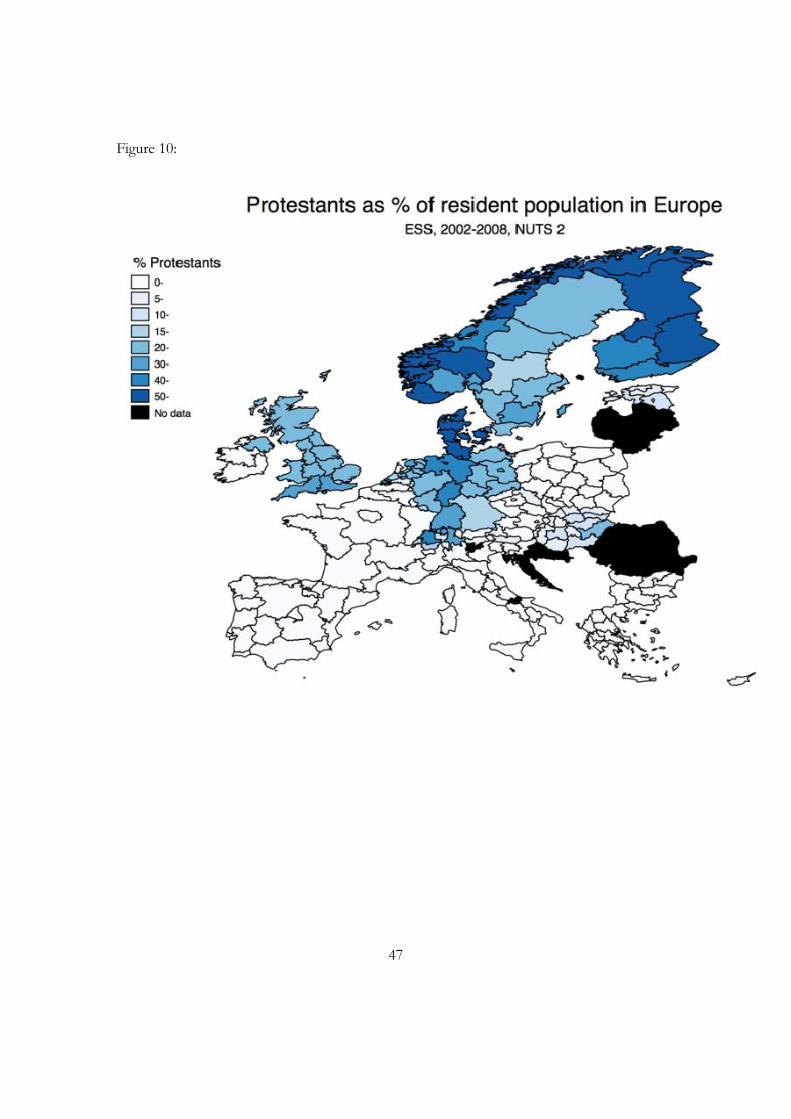
Figures 9 to 11 display the proportion of, respectively, Catholics, Protestants and atheists
across European regions (NUTS 2).
FIGURES 9, 10 AND 11 AROUND HERE
23
Looking at Table 4 we note that atheists represent 38% of individuals in our sample while
Catholics and Protestants are, respectively, 35% and 16% of the total. The distribution of
self-employed individuals across countries displayed in Table 5 and Figures 7 and 8 reveals
instead how diverse is the propensity of being an entrepreneur in each country. Mostly
Catholic countries, like Italy, Poland, Spain and Portugal, are also the countries with the
largest proportion of self-employed individuals over total employment. Of course such
simple correlation masks many factors (observable and not) which may underline the
relationship between religion and entrepreneurship. Looking at various definition of self-
employment, i.e. self-employed with, respectively, at least one and ten dependent employees,
we see how the extent of the entrepreneurship phenomenon is not necessarily related to the
dimension of the firm managed by the individual. Indeed, the proportion of entrepreneurs
with many employee is quite diverse across countries.
Individual controls in our empirical models include age, gender, if foreigner, years of
schooling, marital status and a wealth variable indicating whether the main source of income
is financial. In addition we have exploited one of the specificities of ESS data, i.e. the
availability of information on entrepreneurial family background, i.e. whether one parent
was self-employed. Family background is particularly important as a control since we are able
to distinguish individuals who inherited a business or a propensity to be self-employed from
the family from those who were not expose to such background. In addition, the
specification includes full sets of country (or regional) and time dummies, in order to control
for country (or region) unobservable characteristics, and common cyclical factors. In some
specifications we include time varying regional and country controls. The former include
per-capita regional GDP growth, population density, unemployment rate, and number of
doctors per capita as a proxy for social development (source: Eurostat). The latter include a
set of indexes of business, trade, fiscal, monetary, investment and financial freedom,
freedom from corruption (source: Heritage Foundation), plus a measure of the average tax
rate including both national and local taxes (source OECD). Summary statistics are reported
in the appendix.
We estimate model (2) adopting a linear probability model specification, clustering individual
standard errors across European regions. We display our estimated model across various

24
definitions of entrepreneur and including a set of individual controls and country fixed
effects.
Our difference-in-differences estimations in Table 6 show that a Protestant individual has a
higher propensity of being self-employed with respect to a Catholic individual (MinP-MinC
is the DID effect).
TABLE 6 AROUND HERE
Column 1 presents our baseline model which points to an estimated increase in the
propensity of being self-employed if minority Protestant with respect to a minority Catholic
equal to 2.7%. If we scale this percentage effect on the proportion of self-employed in our
sample, the estimated percentage increase in the propensity of being self-employed is 18.6%
(indicated at the bottom of the table). This result is robust to the inclusion in the sample of
religious only individuals (column 2), considering only regions where the percentage of each
denomination (Protestant, Catholic or atheist) is at least equal to 3% (column 3), and
estimating the model including western European countries only (column 4). In the latter
case we exclude those European countries that experienced a peculiar recent historical past
with strong institutional limitations on private entrepreneurship and a general climate of
aversion towards religion. In column 4 the estimated effect is somewhat larger than previous
columns. The inclusion of regions with a certain degree of representativeness of each
denomination in column 3 produces the smaller estimated effect. Overall the estimated
coefficient effect is between 2.7% and 3.9%. The identification assumption of our empirical
strategy is tested by checking if there exists a significant effect of being a Protestant in
Protestant majority regions versus being a Catholic in Catholic majority regions. We do not
find any significant effect in each specification.
Table 7 includes time varying country and\or regional controls, still displaying a robust
estimated effect of around 2.6%.

25
TABLE 7 AROUND HERE
Table 8 includes a set of robustness checks. In column 1 we drop the set of potentially
endogenous variables which are education, marital status and wealth. There is no effect on
our estimated parameter which stays at 2.7%. The result is also robust to the exclusion of
unpaid family workers, individuals in agriculture, and considering only employed individuals
rather than active.
TABLE 8 AROUND HERE
In Table 9 we show how our estimation results do not depend on the specification of the
fixed effects. Column 1 is our baseline model while column 2 includes a specification where
we include regional NUTS1 fixed effects instead of country fixed effects. The estimated
coefficient of 2.5% remains close to the one estimated in the previous column. The model
in column 3 includes regional NUTS2 fixed effects (NUTS1 for some countries where
NUTS2 are not available), and column 4 includes regional fixed effects based on the most
disaggregated regional definitions (NUTS3 where available, or alternatively NUTS2 or
NUTS1). We can see that the estimated effect is extremely robust to these changes.
TABLE 9 AROUND HERE
Finally, we estimate our baseline model by dropping one country at a time. Table 10 shows
how our main result is not driven by any of the countries in the sample. The estimated effect
is always positive and significant, varying from a minimum of 2.2% to a maximum of 3.3%.

26
The same exercise is performed on our identifying assumption, which also results to be
always confirmed.
Typical effects of controls include 11 to 13% if father was self-employed; -1 to -3%
(although never significant) if foreigner; 8% if male and 10% if main source of income is
financial. In addition we find a positive effect of education. This varies from 0.1 to 0.5% per
education year, increasing non-linearly when non-linearity is allowed for. When education is
instead controlled by means of educational level dummies, using lower secondary as
baseline, we find a nonlinear effect of education, with both lower and higher levels of
education having a positive and significant effect (respectively from 1 to 3% and around 1%)
on the propensity of being self-employed.
We have also estimated model (2) by using ISSP Religion I and II data, which cover the
decade before the one we have analyzed so far. The fist obvious interest of this exercise is
that of testing the robustness of our results in a different time period. The second
motivation is the presence in ISSP of very detailed information on parents’ religion.
Religious family background is a rather accurate measure of the cultural environment of the
family where the respondent has grown up. Nevertheless, ISSP has also two drawbacks: it
does not include information on parents’ entrepreneurship and minority definitions E and G
become too restrictive, because of the smaller sample size compared to ESS12. We have then
estimated model (2) replacing entrepreneurial with religious family background. Overall
results remain qualitatively similar, although not always precisely estimated. There is a
tendency to have larger effects of protestant ethics compared to what we obtained by using
ESS, most likely due to the omission of the highly relevant entrepreneurial family
background. Next we have considered the confession the respondent was raised in rather
than his current religious denomination and we have defined regional market shares
accordingly. In so doing we should capture the cultural backround each individual has been
12 Our sample is composed of about 12,700 individuals and the countries included are Germany, Great Britain,
Austria, Hungary, Italy, Ireland, Netherlands, Norway, Sweden, Czech Republic, Slovenia, Poland, Spain,
Latvia, Slovak Republic, France, Portugal, Denmark and Switzerland. All included countries are also in ESS,
except for Latvia.

27
exposed to during childhood and which is not observed by looking at current denomination.
Results remain stable, as one could predict given our earlier results suggesting that transitions
between confessions are small. This also suggests that current religious denomination is an
acceptable indicator of religious cultural background.
6. Conclusions In this paper we suggest a methodology for identifying the implications of alternative
cultural and social norms embodied by religious denomination on labour market outcomes
in European regions. We have tested whether cultural norms represented by religious beliefs
may affect individual labour market choices. More specifically we investigated the differential
impact of Protestant versus Catholic ethics on the decision of becoming an entrepreneur by
means of a differences-in-difference approach where we difference out all possible
confounders related to being part of a minority creed.
Differently from other contributions, such as Guiso, Sapienza and Zingales (2006), in this
paper we concentrate on causality more than on the specific channel by which religious
social norms may affect economic outcomes.
We have estimated a standard DID model where we exploit the similarity in the environment
characteristics where Protestant and Catholic minorities live in Europe to elicit the role
played by religious ethics. Our findings suggest that cultural background has a significant
effect on individual propensity to become an entrepreneur in Europe. It results that
Protestants are between 2 and 4 percent more likely to be entrepreneurs than Catholics. This
result is robust across alternative specifications and does not depend on the inclusion of a
specific country in the sample. Moreover, the effect remains extremely stable to the inclusion
of educational controls. This result is not necessarily at odds with Becker and Woessman
(2009) since the focus of our analysis is quite different from their investigation. In addition
to the time framework being crucially different, we analyse the implications of religious
denomination on the choice of becoming an entrepreneur among individuals who display a
certain adherence to their creed (i.e. minorities), while Becker and Woessman focus on the

28
implications of aggregate prevalence of Protestantism on economic growth at regional level
just after reformation.
This paper contributes to the growing literature which look at the cultural influences over
individual economic decisions and behaviours. Our results do suggest that moral
considerations, ethics and culture substantially enter in labour market choices, therefore
providing further evidence on the need to take cultural elements into consideration when
analyzing economic behaviour.

29
References
Audretsch, D.B., Bönte, W. and Tamvada, J.P. (2007) “Religion and entrepreneurship”,
CEPR discussion paper n.6378
Becker, S. and Woessmann L. (2009) Was Weber Wrong? A Human Capital Theory of
Protestant Economic History, The Quarterly Journal of Economics, 124(2), 531-596.
Bénabou, R and J. Tirole (2006) “Belief in a Just World and Redistributive Politics”, The
Quarterly Journal of Economics, 121(2): 699-746
Bisin, A., and T. Verdier (2000) “Beyond The Melting Pot: Cultural Transmission, Marriage,
And The Evolution Of Ethnic And Religious Traits”, Quarterly Journal of Economics,
115:955-988
Blanchflower D. and Oswald A. (1998) What makes an entrepreneur? evidence on
inheritances and capital constraints, Journal of Labor Economics, 16(1):26-60, January.
Blanchflower D.(2000), Self-employment in OECD countries, Labour Economics, 7(5):471-505,
September.
Bonacich, E. (1973). “A Theory of Middleman Minorities”. American Sociological Review,
Vol. 38, No. 5 (Oct., 1973), pp. 583-594
Botticini, M. and Eckstein, Z. (2005). Jewish Occupational Selection: Education, Restrictions,
or Minorities?. The Journal of Economic History, 65 , pp 922-948
Brañas, P. and S. Neuman (2006), “Intergenerational transmission of ‘religious capital’:
Evidence from Spain” Papers on Economics of Religion - PER 06/02
Carswell, P. and Rolland, D. (2004) “The role of religion in entrepreneurship participation
and perception” International Journal of Entrepreneurship and Small Business, Volume 1,
Numbers 3-4, pp. 280-286(7)

30
Clark, C. A. and Worthington, A. (1987), “Family Variables Affecting the Transmission of
Religious Values from Parents to Adolescents: A Review,” Family Perspective 21: 1–21.
Clark, K. and Drinkwater, S. (2000) “Pushed out or pulled in? Self-employment among
ethnic minorities in England and Wales” Labour Economics 7: 603–628
Dana, L.P. (2006) “A historical study of the traditional livestock merchants of Alsace” Food
Journal Vol. 108 No. 7 pp. 586-598
Dana, L.P. (2009) “Religion as an explanatory variable for entrepreneurship”,
Entrepreneurship and Innovation vol 10, No 2, pp 87–99
Doepke, M. and F Zilibotti (2005) “Social class and the spirit of capitalism”, Journal of the
European Economic Association, 3(2-3): 516-524
Dohmen, T., A. Falk, D. Huffman, U. Sunde, J. Schupp, and G. Wagner (2005): “Individual
Risk Attitudes: New Evidence from a Large, Representative,Experimentally-Validated
Survey," Discussion Paper No. 511, DIW Berlin
Ekelund, J., E. Johannson, M. Järvelin, and D. Lichtermann (2005), “Self-employment and
Risk Aversion - Evidence from Psychological Test Data," Labour Economics, 12, 649:659
Ellison, C.G., Krause, N.M., Shepherd B.C. and M.A. Chaves (2009) “Size, Conflict, and
Opportunities for Interaction: Congregational Effects on Members’ Anticipated Support
and Negative Interaction”, Journal for the Scientific Study of Religion, 48(1):1–15
Falck O. and L. Woessmann (2010) “School Competition and Students’ Entrepreneurial
Intentions: International Evidence Using Historical Catholic Roots of Private Schooling”
CESIFO WORKING PAPER NO. 3086
Giavazzi, F., Schiantarelli F. and Serafinelli, M. (2009), Culture, Policies and Labor Market
Outcomes, IZA D.P. 4558.
Gruber, J. and D.M. Hungerman (2008) “The Church versus the Mall: What Happens When
Religion Faces Increased Secular Competition?”, The Quarterly Journal of Economics,
123(2): 831-862
31
Gruber, J.H. (2005) “Religious Market Structure, Religious Participation, and Outcomes: Is
Religion Good for You?” Advances in Economic Analysis & Policy BEpress, 5(1) Art. 5
Guiso, L., P. Sapienza, and L. Zingales (2006), "Does Culture Affect Economic Outcomes?,"
Journal of Economic Perspectives, 2, Spring, 23-48.
Guiso, L., Sapienza, P., and L. Zingales (2008a). “Alfred Marshall Lecture Social Capital As
Good Culture”, Journal of the European Economic Association, 6(2–3):295–320
Guiso, L., Sapienza, P., and Zingales, L. (2003), “People’s opium? Religion and economic
attitudes”, Journal of Monetary Economics, Vol 50, No 1, January, pp 225–282.
Guiso, L., Sapienza, P., and Zingales, L. (2009) “Cultural Biases in Economic Exchange”,
Quarterly Journal of Economics, 2009, forthcoming.
Hayes, B. C., and Pittelkow, Y. (1993), “Religious Belief, Transmission, and the Family: An
Australian Study,” Journal of Marriage and the Family 55: 755–766.
Hoge, D. R., Petrillo, G. H. and Smith, E. I. (1982), “Transmission of Religious and Social
Values from Parents to Teenage Children,” Journal of Marriage and the Family 44: 569–580.
Iannaccone, L. R. (1998). "Introduction to the Economics of Religion," Journal of Economic
Literature, 36(3), pp. 1465-1495.
Kihlstrom, R., and J. Laffont (1979): “A General Equilibrium Theory of Firm Formation
Based on Risk Aversion," Journal of Political Economy, 87, 719:748
Lazear, E. P., (2002) “Entrepreneurship,” NBER Working Paper No. 9109.
Marx, K. 1859. A Contribution to the Critique of Political Economy. New York: International
Publishers.
McPherson, M., Smith-Lovin, L. and J.M. Cook (2001) “Birds Of A Feather: Homophily in
Social Networks” Annual Review of Sociology 27:415–44
Mill, J.S. (1843). A System of Logic. London: Longmans, Green and Co.

32
Ozorak, E. W (1989), “Social and Cognitive Influences on the Development of Religious
Beliefs and Commitment in Adolescence,” Journal for the Scientific Study of Religion 28: 448–463.
Robbins, L. (1945), An Essay on the Nature and Significance of Economic Science. Macmillan and
Co., London.
Smith, A. (1904), An Inquiry into the Nature and Causes of the Wealth of Nations. London:
Methuen and Co., Ltd., ed. Edwin Cannan. Fifth edition.
Tabellini G. (2005), "Culture and Institutions: Economic Development in the Regions of
Europe," Journal of the European Economic Association, forthcoming.
Tabellini G. (2008), "Institutions and Culture," Journal of the European Economic Association
Papers and Proceedings, Vol.6(2-3).
Weber, M. (1904), The Protestant Ethic and the Spirit of Capitalism, Roxbury Publishing
Company, reprinted 2001.

33
Appendix A – Religion and risk aversion
Basing on SOEP 2004 data, we define two measures of risk aversion. The first is an index of
relative risk aversion (RRA) which can be derived from a question about the amount of
windfall money to re-invest in a lottery with specified probabilities and returns, following the
procedure indicated in Caliendo et al. (2007). This is an objective measure experimentally
validated (Dohmen et al., 2005). The second is the self-reported willingness to take risks
measured on a scale from 0 (maximal willingness) to 10 (no willingness). Rather surprisingly
the correlation between the two measures is quite small (24 percent). The average level of
both measures is alike across all confessions (about 2.9 for RRA and 5.6 for the willingness
to take risk) as well as their standard deviations (1.32 for RRA and 2.30 for willingness),
indicating that risk aversion is distributed in a similar way across confessions.
However, a similar marginal distribution can be the resulting outcome of the combined
correlation with many variables besides religion. There are two cases to distinguish: if risk
aversion is shaped by the religion culture, then the effect of risk aversion on
entrepreneurship can be ascribed to the broader effect of religion; if instead risk aversion is
a causa prima, then by looking at the relationship between religion and entrepreneurship we
could find a spurious correlation. Indeed, we have tested whether risk aversion influences
the decision of being religious (i.e. Catholic or Protestant) compared to atheist after
controlling for regional (lander) fixed effects, individual age, gender, years of education,
marital status, employment condition, and, importantly, father and mother religion. As said,
religious family background could influence both the religion and the degree of risk aversion
transmitted to the sons. Estimates of a probit model are reported in the first column of
Table A1. By using RRA we cannot reject the hypothesis that risk aversion is uncorrelated
with religiosity. Instead, when willingness to take risks is considered, the model suggests that
more risk averse people are more likely to be religious. Furthermore, we have tested whether
the degree of risk aversion is correlated with the particular individual confession. We have
estimated a multinomial probit model where the dependent variable is individual confession
(Atheist – the base outcome - , Catholic and Protestant), and the explanatory variables are
the measures of risk aversion and the same controls used above. Coefficients of the two
measures of risk aversion for both Catholic and Protestant outcomes are reported in

34
columns 2 and 3 of Table 1. Their difference is in column 4. Regardless of the measure
adopted, risk aversion influences the probability of being Catholic or Protestant to a similar
extent.
TABLE A1 AROUND HERE
Appendix B – Minorities and networks
We estimated again equation (1), with the same controls and the same definitions of regions
and minority. Outcome variables refer to 1) the number of close friends a) in the workplace,
b) who live near the respondent; 2) respondent’s participation in voluntary local
organization; 3) potential ability to borrow money from relatives and friends in case of need;
4) number of times the respondent has lent money to relatives and friends in the current
year; 5) to what extent relatives and friends are sources of information to find a job; 6) how
often the respondent help someone to find a job; 7) self-reported general trust in other
people; 8) self-reported perception that others’ opportunism.
Differently than in the analysis conducted on point 3 of Section 3, now we look at the
difference between the coefficients of MP and MC. Such difference would indicate to what
extent protestant minorities are possibly more socially connected than catholic minorities.
Results are reported in Table B1 for each definition of minority (now definitions E and G
are perfectly equivalent)13.
TABLE B1 AROUND HERE
Precise questions used in Table B1
Thinking about people at your work place, how many of them are close friends of yours?
13 Minorities are defined over respondents’ religion, as information of religious family background are not
collected in ISSP Social Network II.

35
Thinking now of people who live near you – in your neighbourhood or district: How many
of these people are close friends of yours?
How many other close friends do you have – apart from those at work, in your
neighbourhood, or family members? Think, for instance, of friends at clubs, church,
orthe like.
People sometimes belong to different kinds of groups or associations. The list below
contains different types of groups. For each type of group, please tick a box to say
whether you have participated in the activities of this group in the past 12 months. A
church or other religious organisation ; A sports group, hobby or leisure club ; A
charitable organisation or group ; A neighbourhood association or group ; Other
associations or groups ; (exluded parties and unions)
Now, suppose you needed to borrow a large sum of money. Who would you turn to first for
help? husband, wife, partner ; mother ; father ; daughter ; son ; sister ; brother ; other
blood relative ; in-law relative ; god-parent ; close friend ; neighbour ; someone you
work with ; employer ; (exluded banks, governemnts, monay lenders...)
During the past 12 months, how often have you done any of the following things for people
you know personally, such as relatives, friends, neighbours or other acquaintances? b)
Lent quite a bit of money to another person ; d) Helped somebody to find a job
There are many ways people hear about jobs - from other people, from advertisements or
employment agencies, and so on. Please indicate how you first found out about work at
our present employer. From parents, brothers or sisters ; From other relatives ; From a
close friend ; From an acquaintance
To what extent do you agree or disagree with the following statements? There are only a few
people I can trust completely; If you are not careful, other people will take advantage of
you
36
Appendix C – ESS Sample
Table C1: European Social Survey, Participating Countries and Sample Size
Wave
country 1 2 3 4 Total AT 2,237 2,222 2,346 6,805BE 1,876 1,751 1,772 1,738 7,137BG 2,185 2,185CH 2,000 2,088 1,766 1,790 7,644CY 1,175 1,175CZ 1,351 2,996 4,347DE 2,888 2,833 2,886 2,724 11,331DK 1,499 1,475 1,486 1,602 6,062EE 1,982 1,505 1,643 5,130ES 1,716 1,643 1,839 2,531 7,729FI 1,935 1,973 1,836 2,135 7,879FR 3,006 3,612 1,970 2,057 10,645GB 2,026 1,870 2,357 2,312 8,565GR 2,535 2,340 4,875HU 1,670 1,498 1,488 4,656IE 2,001 2,248 1,767 6,016IT 1,186 1,511 2,697LU 1,537 1,609 3,146NL 2,342 1,859 1,860 6,061NO 2,014 1,737 1,728 1,532 7,011PL 2,103 1,694 1,705 1,597 7,099PT 1,503 2,046 2,211 2,350 8,110RU 2,498 2,498SE 1,987 1,934 1,915 1,812 7,648SI 1,489 1,406 1,437 1,238 5,570SK 1,495 1,760 3,255UA 2,011 1,985 3,996 Total 40,901 47,833 37,619 32,919 159,272

37

38
Figures
Figure 1
Source: Made from the public domain map "Central Europe about 1648" from the Historical Atlas by William R. Shepherd, at the Perry-Castañeda Library Map Collection at the University of Texas.

39
Figure 2
<5%5-15%15-25%25-50%>50%No data
Source: our elaboration on ESS data

40
Figure 3
Prop
ensit
y to
entre
pren
eurs
hip
degree of adhesionmajority minority
Protestants
Catholics
41
Figure 4
Panel a)
Panel b)
Prop
ensit
y to
entre
pren
eurs
hip
degree of adhesionmajority minority
Protestants
Catholics
Prop
ensit
y to
entre
pren
eurs
hip
degree of adhesionmajority minority
Protestants
Catholics

42
Figure 5: Protestant minorities – ESS data
0%0-5%>5%No data
Prop. Minoritarian Protestants - NUTS 3 - Def. D
0%0-5%>5%No data
Prop. Minoritarian Protestants - NUTS 3 - Def. E
0%0-5%>5%No data
Prop. Minoritarian Protestants - NUTS 3 - Def. F
0%0-5%>5%No data
Prop. Minoritarian Protestants - NUTS 3 - Def. G

43
Figure 6: Catholic minorities - ESS data
0%0-5%>5%No data
Prop. Minoritarian Catholics - NUTS 3 - Def. D
0%0-5%>5%No data
Prop. Minoritarian Catholics - NUTS 3 - Def. E
0%0-5%>5%No data
Prop. Minoritarian Catholics - NUTS 3 - Def. F
0%0-5%>5%No data
Prop. Minoritarian Catholics - NUTS 3 - Def. G

44
Figure 7: Proportion of self-employed – ESS data
<5%5-10%10-15%>15%No data
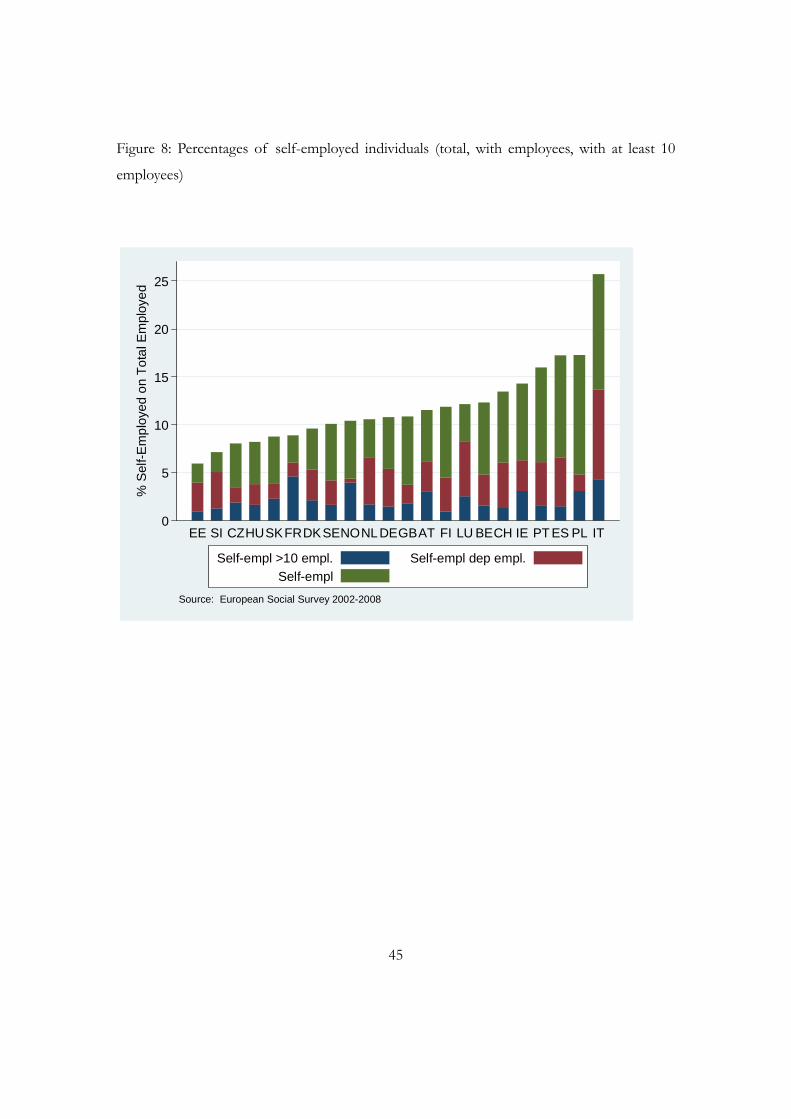
45
Figure 8: Percentages of self-employed individuals (total, with employees, with at least 10
employees)
0
5
10
15
20
25
% S
elf-E
mpl
oyed
on
Tota
l Em
ploy
ed
EE SI CZHUSKFRDKSENONLDEGBAT FI LU BECH IE PT ES PL IT
Source: European Social Survey 2002-2008
Self-empl >10 empl. Self-empl dep empl.Self-empl

46
Figure 9:
47
Figure 10:

48
Figure 11:

49
Tables
Table A1: Coefficients of SOEP measures of risk aversion for both Catholic and Protestant outcomes.
Religious Catholic Protestant difference
RRA -0.011 -0.020 -.0208 0.00
p value 0.249 0.196 0.129 0.997
willingness 0.029 0.043 0.034 0.99
p value 0.000 0.000 0.000 0.319
Note: Column (1): Probit model estimates based on SOEP 2004. Religious takes on 1 for Catholics or Protestants and 0 for atheists. Controls are lander dummies, age, gender, years of education, marital status, employment condition, and father and mother religion. Furthermore, we have tested whether the degree of risk aversion is correlated with the particular individual confession. Column (2) and (3): multinomial probit model estimates based on SOEP 2004. The dependent variable is individual confession (Atheist – the base outcome - , Catholic and Protestant). Same controls. Column (4): difference between (2) and (3).

50
Table 2: religious minorities and religious intensity
pray religious
D E F G D E F G
minority catholic 0.408** 0.820*** 0.412* 0.820*** 0.0508* 0.149*** 0.0575** 0.149***
(0.199) (0.306) (0.217) (0.306) (0.0295) (0.0469) (0.0284) (0.0469)
minority protestant 0.460* 1.257*** 0.503** 1.257*** 0.0976** 0.247*** 0.0996** 0.247***
(0.253) (0.277) (0.254) (0.277) (0.0433) (0.0521) (0.0448) (0.0521)
my way fate
D E F G D E F G
minority catholic -0.0643* 0.0908 -0.0319 0.0908 -0.0637** -0.197*** -0.0803*** -0.197***
(0.0359) (0.0693) (0.0393) (0.0693) (0.0250) (0.0596) (0.0279) (0.0596)
minority protestant 0.127*** 0.0951** 0.128*** 0.0951** 0.00278 -0.0344 0.0124 -0.0344
(0.0313) (0.0400) (0.0320) (0.0400) (0.0258) (0.0323) (0.0256) (0.0323)
Note: OLS Estimates of model (1) on ISSP Religion III data across alternative measures of religion intensity and adhesion. Gender, age, years of education, employment condition, urban or rural residence and regional fixed effects are included as controls.

51
Table B1: religious minorities and social networks
MP-MC se MP-MC pval MP-MC# friends at the workplace D 0.0535 0.1010 0.5960# friends at the workplace F 0.0139 0.1100 0.9000# friends at the workplace E-G 0.1110 0.1130 0.3270# friends living near you D -0.0233 0.0694 0.7380# friends living near you F -0.0184 0.0881 0.8340# friends living near you E-G 0.0070 0.1240 0.9550participate vol. org. D 0.1080 0.0704 0.1290participate vol. org. F 0.1170 0.0826 0.1580participate vol. org. E-G -0.0328 0.0876 0.7090borrow D -0.0250 0.0519 0.6300borrow F 0.0166 0.0599 0.7820borrow E-G 0.0571 0.0675 0.3990lend D 0.0391 0.0415 0.3480lend F 0.0119 0.0461 0.7970lend E-G 0.0831 0.0508 0.1040work info D -0.0315 0.0384 0.4130work info F -0.0422 0.0534 0.4300work info E-G -0.1210 0.0724 0.0976helped s.o. job D 0.0121 0.0453 0.7900helped s.o. job F 0.0097 0.0509 0.8480helped s.o. job E-G 0.0117 0.0529 0.8250trust D -0.0105 0.0553 0.8500trust F -0.0442 0.0558 0.4290trust E-G 0.0374 0.0619 0.5470others take advantage D -0.1140 0.0619 0.0678others take advantage F -0.1080 0.0732 0.1420others take advantage E-G 0.0306 0.0966 0.7520Note: differential effect of being minority protestant compared to minority catholic, on alternative indicators of social network and alternative definitions of majority. Based on ISSP Religion III data.

52
Table 4: Proportions of Catholics, Protestants and Atheists in each country
country catholic protestant atheist AT 0.61 0.03 0.29BE 0.40 0.01 0.54CH 0.31 0.30 0.33CZ 0.25 0.03 0.69DE 0.22 0.28 0.45DK 0.01 0.56 0.39EE 0.01 0.08 0.74ES 0.69 0.00 0.27FI 0.00 0.47 0.26FR 0.16 0.01 0.35GB 0.10 0.28 0.51HU 0.29 0.11 0.38IE 0.78 0.03 0.16IT 0.78 0.00 0.20LU 0.52 0.01 0.27NL 0.20 0.16 0.56NO 0.01 0.47 0.47PL 0.90 0.00 0.08PT 0.83 0.01 0.14SE 0.01 0.26 0.69SI 0.48 0.01 0.41SK 0.60 0.08 0.24 Total 0.35 0.16 0.38
Note that countries are indicated by their ISO code, i.e. :
Austria AT Italy IT Belgium BE Luxembourg LU Czech Republic CZ Netherlands NL Denmark DK Norway NO Estonia EE Poland PL Finland FI Portugal PT France FR Slovakia SK Germany DE Slovenia SI Greece GR Spain ES Hungary HU Sweden SE Iceland IS Switzerland CH Ireland IE Ukraine UA Israel IL United Kingdom GB Bulgaria BG Cyprus CY.

53
Table 5: Proportions of self-employed individuals (total, with employees, with at least 10
employees)
country self self + deps
self + 10 deps
AT 0.103 0.055 0.027BE 0.106 0.041 0.013CH 0.127 0.057 0.012CZ 0.073 0.032 0.017DE 0.098 0.049 0.013DK 0.092 0.051 0.020EE 0.054 0.036 0.008ES 0.141 0.054 0.012FI 0.114 0.043 0.009FR 0.056 0.038 0.029GB 0.104 0.036 0.017HU 0.050 0.023 0.010IE 0.127 0.056 0.027IT 0.197 0.105 0.033LU 0.097 0.066 0.020NL 0.099 0.062 0.016NO 0.101 0.042 0.038PL 0.149 0.041 0.026PT 0.132 0.050 0.013SE 0.096 0.040 0.015SI 0.059 0.042 0.011SK 0.076 0.034 0.020 Total 0.102 0.046 0.018

54
Table 6: Difference-in-Differences estimations of the effects of religion on the propensity of being entrepreneur (ESS data)
(1) (2) (3) (4) VARIABLES selfemplACT selfemplACT selfemplACT selfemplACT
RELIGIOUS -0.004 -0.020*** -0.007
(0.004) (0.005) (0.006) PROTESTANT -0.012** -0.003 -0.005 -0.011*
(0.006) (0.008) (0.008) (0.007) MINORITY -0.005 0.007 -0.008 -0.003
(0.011) (0.012) (0.011) (0.011) MAJORITY -0.004 -0.003 -0.000 -0.011
(0.009) (0.010) (0.013) (0.010) PROTESTANT*MAJORITY 0.016 0.019 0.000 0.022
(0.013) (0.015) (0.000) (0.014) PROTESTANT*MINORITY 0.039*** 0.036*** 0.025** 0.051***
(0.011) (0.011) (0.011) (0.015) ATHEIST*MAJORITY 0.000 -0.005 0.001
(0.008) (0.014) (0.009) ATHEIST*MINORITY 0.022*** 0.017** 0.020***
(0.006) (0.007) (0.007) FOREIGN -0.009 -0.017 -0.012 -0.002
(0.010) (0.016) (0.015) (0.011) FATHER SELF EMP. 0.118*** 0.132*** 0.116*** 0.114***
(0.005) (0.007) (0.007) (0.006) AGE 0.004*** 0.004*** 0.004*** 0.004***
(0.000) (0.000) (0.000) (0.000) MALE 0.076*** 0.086*** 0.079*** 0.076***
(0.004) (0.007) (0.007) (0.005) EDUCAT. YEARS 0.001* -0.001* 0.005*** 0.001
(0.001) (0.001) (0.001) (0.001) MARRIED 0.017*** 0.027*** 0.010 0.011**
(0.005) (0.006) (0.007) (0.005) WEALTH 0.108*** 0.103*** 0.124*** 0.134***
(0.027) (0.038) (0.038) (0.032) Constant -0.101*** -0.118*** -0.137*** -0.112***
(0.021) (0.020) (0.025) (0.021)
Observations 70265 35789 26913 55301 R-squared 0.067 0.078 0.059 0.073
MinP-MinC 0.0267 0.0333 0.0201 0.0395 se MinP-MinC 0.0101 0.0102 0.00939 0.0140
pval MinP-MinC 0.00864 0.00132 0.0349 0.00554 MajP-MajC 0.00382 0.0164 -0.00457 0.0112
se MajP-MajC 0.0141 0.0165 0.00829 0.0154 pval MajP-MajC 0.787 0.321 0.583 0.470
pceff 0.186 0.231 0.151 0.271 pceff+2SE 0.326 0.374 0.293 0.464 pceff-2SE 0.0455 0.0891 0.00987 0.0783

55
Table 7: Difference-in-Differences estimations of the effects of religion on the propensity of being entrepreneur (ESS data)
(1) (2) (3) VARIABLES selfemplACT selfemplACT selfemplACT RELIGIOUS -0.005 -0.004 -0.005 (0.005) (0.004) (0.005) PROTESTANT -0.011* -0.013** -0.011* (0.006) (0.006) (0.006) MINORITY -0.005 -0.004 -0.004 (0.011) (0.010) (0.010) MAJORITY -0.005 0.003 0.002 (0.009) (0.007) (0.007) PROTESTANT*MAJORITY 0.017 0.015 0.016 (0.013) (0.012) (0.012) PROTESTANT*MINORITY 0.037*** 0.039*** 0.037*** (0.011) (0.011) (0.011) ATHEIST*MAJORITY 0.001 -0.002 -0.001 (0.008) (0.007) (0.007) ATHEIST*MINORITY 0.021*** 0.026*** 0.025*** (0.007) (0.006) (0.006) FOREIGN -0.004 -0.010 -0.005 (0.011) (0.010) (0.011) FATHER SELF EMP. 0.119*** 0.117*** 0.119*** (0.006) (0.005) (0.006) AGE 0.004*** 0.004*** 0.004*** (0.000) (0.000) (0.000) MALE 0.076*** 0.076*** 0.076*** (0.004) (0.004) (0.004) EDUCAT. YEARS 0.001 0.001 0.001 (0.001) (0.001) (0.001) MARRIED 0.016*** 0.017*** 0.016*** (0.005) (0.004) (0.005) WEALTH 0.115*** 0.108*** 0.116*** (0.029) (0.027) (0.029) TAX RATE 0.001 0.001 (0.001) (0.001) BUSINESS FREEDOM 0.001** 0.001 (0.000) (0.000) TRADE FREEDOM 0.000 0.000 (0.002) (0.002) FISCAL FREEDOM 0.001 0.001* (0.001) (0.001) MONETARY FREEDOM 0.001** 0.001 (0.001) (0.001) INVEST. FREEDOM -0.000 -0.000 (0.000) (0.000) FINANCIAL FREEDOM 0.001* 0.001 (0.000) (0.000) FREEDOM FROM CORRUPT. 0.001* 0.001* (0.001) (0.001) REG. UNEMPL. RATE 15-64 -0.001 -0.001 (0.001) (0.001)

56
REG. POP. DENSITY 0.000** 0.000** (0.000) (0.000) REG. DOCTORS 0.000 0.000 (0.000) (0.000) REG. GDP GROWTH -0.002*** -0.003*** (0.001) (0.001) Constant -0.475*** -0.114*** -0.413** (0.181) (0.018) (0.185) Observations 65551 70265 65551 R-squared 0.068 0.067 0.069 MinP-MinC 0.0263 0.0260 0.0256 se MinP-MinC 0.0102 0.00999 0.0101 pval MinP-MinC 0.0105 0.00995 0.0118 MajP-MajC 0.00550 0.00268 0.00429 se MajP-MajC 0.0143 0.0126 0.0127 pval MajP-MajC 0.700 0.831 0.736 pceff 0.180 0.180 0.175 pceff+2SE 0.319 0.319 0.313 pceff-2SE 0.0406 0.0416 0.0372

57
Table 8 (1) (2) (3) (4) VARIABLES selfemplACT selfemplACT selfemplACT selfemplACT RELIGIOUS -0.004 -0.004 -0.011** -0.005 (0.005) (0.004) (0.004) (0.005) PROTESTANT -0.012** -0.012* -0.012** -0.012** (0.006) (0.006) (0.005) (0.006) MINORITY -0.005 -0.006 -0.002 -0.004 (0.011) (0.011) (0.011) (0.012) MAJORITY -0.004 -0.004 -0.006 -0.002 (0.009) (0.009) (0.010) (0.010) PROTESTANT*MAJORITY 0.015 0.017 0.010 0.014 (0.013) (0.014) (0.015) (0.014) PROTESTANT*MINORITY 0.039*** 0.037*** 0.035*** 0.038*** (0.011) (0.011) (0.011) (0.012) ATHEIST*MAJORITY 0.000 0.000 0.002 0.001 (0.008) (0.008) (0.008) (0.008) ATHEIST*MINORITY 0.020*** 0.021*** 0.018** 0.027*** (0.006) (0.006) (0.007) (0.007) FOREIGN -0.009 -0.011 0.002 -0.010 (0.010) (0.010) (0.010) (0.011) FATHER SELF EMP. 0.118*** 0.123*** 0.078*** 0.120*** (0.005) (0.006) (0.005) (0.006) AGE 0.004*** 0.004*** 0.004*** 0.004*** (0.000) (0.000) (0.000) (0.000) MALE 0.075*** 0.076*** 0.065*** 0.078*** (0.004) (0.004) (0.003) (0.004) EDUCAT. YEARS 0.001 0.003*** 0.001 (0.001) (0.001) (0.001) MARRIED 0.017*** 0.015*** 0.014*** (0.005) (0.004) (0.005) WEALTH 0.112*** 0.104*** 0.175*** (0.028) (0.024) (0.038) Constant -0.081*** -0.102*** -0.112*** -0.096*** (0.021) (0.021) (0.022) (0.023) Observations 70265 69520 67983 66300 R-squared 0.066 0.069 0.050 0.068 MinP-MinC 0.0271 0.0258 0.0236 0.0264 se MinP-MinC 0.0101 0.0103 0.0102 0.0106 pval MinP-MinC 0.00775 0.0127 0.0211 0.0135 MajP-MajC 0.00321 0.00508 -0.00215 0.00166 se MajP-MajC 0.0140 0.0145 0.0153 0.0147 pval MajP-MajC 0.820 0.726 0.889 0.910 pceff 0.188 0.177 0.194 0.177 pceff+2SE 0.328 0.317 0.362 0.319 pceff-2SE 0.0481 0.0360 0.0270 0.0348

58
Table 9
(1) (2) (3) (4) VARIABLES selfemplACT selfemplACT selfemplACT selfemplACT RELIGIOUS -0.004 -0.004 -0.004 -0.005 (0.004) (0.005) (0.005) (0.005) PROTESTANT -0.012** -0.012* -0.013** -0.012* (0.006) (0.006) (0.007) (0.007) MINORITY -0.005 -0.012 -0.008 0.022*** (0.011) (0.013) (0.015) (0.003) MAJORITY -0.004 0.002 -0.002 -0.027*** (0.009) (0.008) (0.010) (0.003) PROTESTANT*MAJORITY 0.016 0.012 0.015 0.015 (0.013) (0.013) (0.013) (0.013) PROTESTANT*MINORITY 0.039*** 0.037*** 0.040*** 0.038*** (0.011) (0.011) (0.012) (0.012) ATHEIST*MAJORITY 0.000 -0.005 -0.010 -0.010 (0.008) (0.007) (0.008) (0.008) ATHEIST*MINORITY 0.022*** 0.022*** 0.035*** 0.035*** (0.006) (0.006) (0.004) (0.004) FOREIGN -0.009 -0.009 -0.009 -0.009 (0.010) (0.010) (0.010) (0.010) FATHER SELF EMP. 0.118*** 0.116*** 0.115*** 0.115*** (0.005) (0.005) (0.005) (0.005) AGE 0.004*** 0.004*** 0.004*** 0.004*** (0.000) (0.000) (0.000) (0.000) MALE 0.076*** 0.076*** 0.076*** 0.076*** (0.004) (0.004) (0.004) (0.004) EDUCAT. YEARS 0.001* 0.001* 0.001* 0.001 (0.001) (0.001) (0.001) (0.001) MARRIED 0.017*** 0.017*** 0.018*** 0.018*** (0.005) (0.005) (0.004) (0.005) WEALTH 0.108*** 0.109*** 0.106*** 0.107*** (0.027) (0.027) (0.027) (0.027) Constant -0.101*** -0.069** -0.120*** -0.126*** (0.021) (0.031) (0.015) (0.012) Observations 70265 70265 70265 70265 R-squared 0.067 0.069 0.071 0.072 MinP-MinC 0.0267 0.0251 0.0270 0.0260 se MinP-MinC 0.0101 0.0101 0.0101 0.0101 pval MinP-MinC 0.00864 0.0137 0.00796 0.0109 MajP-MajC 0.00382 0.000539 0.00199 0.00223 se MajP-MajC 0.0141 0.0133 0.0125 0.0125 pval MajP-MajC 0.787 0.968 0.873 0.858 pceff 0.186 0.174 0.187 0.181 pceff+2SE 0.326 0.314 0.327 0.321 pceff-2SE 0.0455 0.0339 0.0474 0.0400
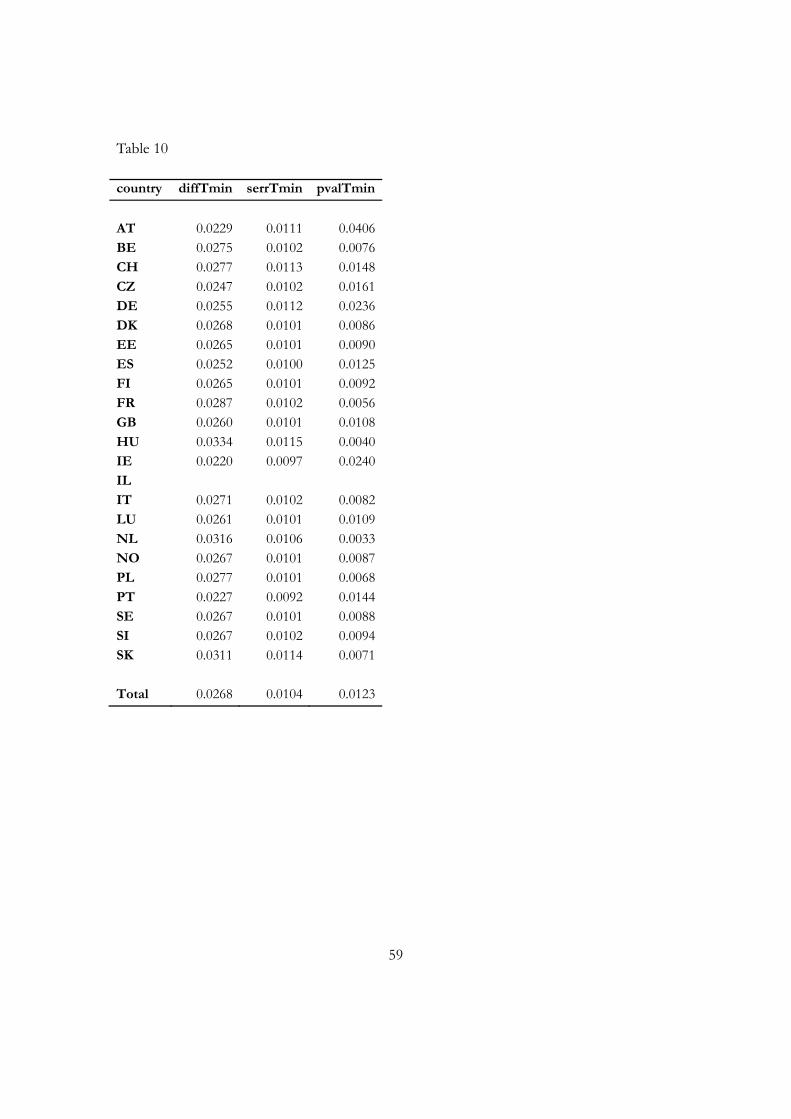
59
Table 10
country diffTmin serrTmin pvalTmin
AT 0.0229 0.0111 0.0406BE 0.0275 0.0102 0.0076CH 0.0277 0.0113 0.0148CZ 0.0247 0.0102 0.0161DE 0.0255 0.0112 0.0236DK 0.0268 0.0101 0.0086EE 0.0265 0.0101 0.0090ES 0.0252 0.0100 0.0125FI 0.0265 0.0101 0.0092FR 0.0287 0.0102 0.0056GB 0.0260 0.0101 0.0108HU 0.0334 0.0115 0.0040IE 0.0220 0.0097 0.0240IL IT 0.0271 0.0102 0.0082LU 0.0261 0.0101 0.0109NL 0.0316 0.0106 0.0033NO 0.0267 0.0101 0.0087PL 0.0277 0.0101 0.0068PT 0.0227 0.0092 0.0144SE 0.0267 0.0101 0.0088SI 0.0267 0.0102 0.0094SK 0.0311 0.0114 0.0071 Total 0.0268 0.0104 0.0123