the impacts of tour guide performance on foreign …
TRANSCRIPT

THE IMPACTS OF TOUR GUIDE PERFORMANCE
ON FOREIGN TOURIST SATISFACTION AND
DESTINATION LOYALTY IN VIETNAM
by
Hoang Le Nguyen
A thesis submitted in satisfaction of the
requirements for the degree of
Doctor of Business Administration
University of Western Sydney
2015

Approved by _____________________________________________________
Chairperson of Supervisory Committee
_____________________________________________________
_____________________________________________________
_____________________________________________________
Program Authorised
to Offer Degree ____________________________________________________
Date _____________________________________________________________

i
Acknowledgements
This thesis could not have been completed without the contributions of many people.
Firstly I would like to show my deepest gratitude to my principal supervisor, Associate
Professor Terry Sloan – Human Resources and Management (SoBus), for his enormous
help, valuable advice and recommendations. Especially, he has also taught me much
more than just finishing the thesis. Again, I would like to say “Thank you very much”
for all you have done for me.
Secondly, I would like to express my sincere appreciation to Dr. Colin Sheringham – my
co-supervisor – for guiding me in the stages of my academic research, especially his
comments on Chapter 2 - Literature review. My thanks also go to Dr. Charles Edward
O’Mara for his assistance with English expression from the early drafts of my thesis.
I also acknowledge Associate Professor Tho Nguyen at the School of Management of
Ho Chi Minh City University of Economics for his guidance in the early stage of my
academic research in Vietnam, as well as his encouragement in the whole process of my
study. Moreover, I would like to thank two of my colleagues, Dr Duy Luong and Dr Duy
Nguyen, who were always with me during my doctoral study. Their experiences on
research and comments helped me to carry out the study.
I also would like to thank the following organizations which supported the conduct of
my thesis, including Vietnam Ministry of Education and Training project for granting
me the scholarship, and Ho Chi Minh City University of Economics.
Finally, to my mother Professor Chinh Hoang, I wish to express all my thanks to her for
all things she has done for me. My thesis could not be finished without her
encouragement and support.

ii
Statement of Authentication
The work presented in this thesis is, to the best of my knowledge and belief, original
except as acknowledged in the text. I hereby declare that I have not submitted this
material, either in full or in part, for a degree at this or any other institution.
---------------------------------------------
Hoang Le Nguyen

iii
TABLE OF CONTENTS
Acknowledgements i
Statement of Authentication ii
Table of Contents iii
List of Tables vii
List of Figures ix
Abbreviations x
Abstract xii
Chapter 1: Introduction to the study 1
1.1 Introduction 1
1.2 The tourism industry in Vietnam 1
1.3 Human resource management and the role of tour guide in a package tour
in Vietnam 3
1.4 Objectives of the study and research questions 5
1.5 Scope of the research 7
1.6 Organization of the thesis 7
1.7 Conclusion 8
Chapter 2: Literature review 10
2.1 Introduction 10
2.2 Tourism research development 10
2.3 The role of human resource management in tourism industry 14
2.4 Tour guide, service performance, tourist satisfaction, and destination loyalty 21
2.4.1 The role of tour guide 21

iv
2.4.2 Service quality and customer satisfaction 28
2.4.3 Tour guide performance and tourist satisfaction 32
2.4.4 Destination loyalty 34
2.5 Research model, research questions and hypotheses 37
2.6 Conclusion 39
Chapter 3: Research methodology 40
3.1 Introduction 40
3.2 Design of the research 40
3.2.1 Qualitative research, quantitative research or combination of both 40
3.2.2 Exploratory research, confirmatory research or combination of both 42
3.2.3 The use of exploratory factor analysis, confirmatory factor analysis, and
structural equation modeling 43
3.3 Design of measures 46
3.3.1 Intrapersonal servability of tour guide 47
3.3.2 Interpersonal servability and organizational skills of tour guide 49
3.3.3 Tourist satisfaction 55
3.3.4 Destination loyalty of tourist 56
3.4 Pilot study 57
3.5 Main survey 57
3.5.1 Sampling 57
3.5.2 Sample size 60
3.5.3 Survey method 60
3.5.4 Data analysis techniques 62
3.6 Ethical considerations 65
3.7 Conclusion 66

v
Chapter 4: Results and findings 67
4.1 Introduction 67
4.2 Focus group interviews 67
4.3 Quantitative data analysis 70
4.3.1 Descriptive statistics 71
4.3.1.1 Demographic profile of tourists and their satisfaction in a package tour 71
4.3.1.2 Intrapersonal servability attributes of tour guides 84
4.3.1.3 Interpersonal servability and organizational skills attributes of
tour guides 85
4.3.1.4 Tourist satisfaction and destination loyalty 88
4.3.2 Exploratory Factor Analysis 89
4.3.2.1 Tourist satisfaction 89
4.3.2.2 Destination loyalty of tourists 89
4.3.2.3 Intrapersonal servability of tour guide 90
4.3.2.4 Interpersonal servability and organizational skills of tour guide 91
4.3.3 Confirmatory Factor Analysis and Structural Equation Modeling 93
4.3.4 Hypotheses testing 95
4.4 Summary and conclusion 98
Chapter 5: Conclusions and implications 101
5.1 Introduction 101
5.2 Conclusions from the research questions 102
5.2.1 Question 1: What are factors influencing tour guide performance
in tourism industry in Vietnam? 102
5.2.2 Question 2: What is the relationship between tour guide performance and
tourist satisfaction in tourism industry in Vietnam? 104

vi
5.2.3 Question 3: What is the relationship between tourist satisfaction on tour
guide performance and destination loyalty? 108
5.3 Contributions of the research findings 110
5.3.1 Theoretical contribution 110
5.3.2 Methodological contribution 111
5.4 Implications of the research 112
5.5 Limitations of the research and further research 113
5.6 Conclusion 115
List of References 116
Appendices 139
Appendix 1: Participant consent form 139
Appendix 2: Participant information sheet 140
Appendix 3: Focus group interview proforma 144
Appendix 4: Questionnaire 146
Appendix 5: Research documentation 151

vii
List of Tables
Table 2.1: Development stages of human resource management 15
Table 2.2: Key roles of tour guide identified by selected authors 25
Table 3.1: Measures of appearance 48
Table 3.2: Measures of work attitude 48
Table 3.3: Measures of communication skill 49
Table 3.4: Measures of empathy 50
Table 3.5: Measures of professional competence 51
Table 3.6: Measures of connecting customers 51
Table 3.7: Measures of solving problems 52
Table 3.8: Measures of organizational skill 53
Table 3.9: Measures of environmental protection skill 54
Table 3.10: Measures of entertainment introduction skill 55
Table 3.11: Measures of tourist satisfaction 56
Table 3.12: Measures of destination loyalty of tourist 56
Table 3.13: Absolute fit indices 64
Table 3.14: Incremental fit indices 65
Table 4.1: Factor loading from Pattern Matrix of ‘intrapersonal servability’ 90
Table 4.2: Factor loading from Pattern Matrix of ‘interpersonal servability and
organizational skills’ 92
Table 4.3: Regression weights of SEM 94
Table 4.4: Regression weights of SEM after deleting four factors of tour guide
performance 95

viii
Table 4.5: Standardized regression weights of SEM after deleting four factors of
tour guide performance 95
Table 4.6: Direct and indirect effect of tour guide performance on
tourists’ satisfaction and their loyalty 95
Table 4.7: Summary of the results of the hypotheses testing 99

ix
List of Figures
Figure 2.1: Study location of empirical research on tour guides and tour guiding in
the period 1979-2013 (n=191) 22
Figure 2.2: Trends in publication of tour guide and guiding services research 23
Figure 2.3: Research model of the study 38
Figure 4.1: Foreign tourists to Vietnam in terms of nationality 72
Figure 4.2: Foreign tourists to Vietnam in terms of gender 73
Figure 4.3: Foreign tourists to Vietnam in terms of marital status 74
Figure 4.4: Foreign tourists to Vietnam in terms of age 75
Figure 4.5: Foreign tourists to Vietnam in terms of education level 76
Figure 4.6: Foreign tourists to Vietnam in terms of occupation 78
Figure 4.7: Foreign tourists to Vietnam in terms of income 79
Figure 4.8: Foreign tourists to Vietnam in terms of the times of visit 80
Figure 4.9: Foreign tourists to Vietnam in terms of purpose 81
Figure 4.10: Foreign tourists to Vietnam in terms of companion 82
Figure 4.11: Foreign tourists to Vietnam in terms of intention to stay 83
Figure 4.12: Intrapersonal servability attributes of tour guides assessed by tourists 85
Figure 4.13: Interpersonal servability and organizational skills attributes of tour
guide assessed by tourists 86
Figure 4.14: Tourist satisfaction on guiding service, tour services and overall tour
experience 88
Figure 4.15: Destination loyalty of tourists 89
Figure 5.1: The effect of tour guide performance on tourist satisfaction 107
Figure 5.2: The effect of tour guide performance and tourist satisfaction on
destination loyalty of foreign tourists 109

x
Abbreviations
AGFI Adjusted Goodness-of-Fit Index
ASEAN Association of South-East Asian Nations
CFA Confirmatory Factor Analysis
CFI Comparative Fit Index
ECVI Expected Cross Validation Index
EFA Exploratory Factor Analysis
GDP Gross Domestic Product
GFI Goodness-of-Fit Index
HOLSAT Holiday Satisfaction
IFI Incremental Fit Index
MICE Meetings, Incentives, Conferencing, Exhibitions
ML Maximum Likelihood
NCP Non-Centrality Parameter
NFI Normed-Fit Index
RFI Relative-Fit Index
RMR Root Mean square Residual
RMSEA Root Mean Square Error of Approximation
SEM Structural Equation Modeling
SERVPERF Service Performance
xi
SERVQUAL Service Quality
TLI Tucker-Lewis Index
TTCI Travel and Tourism Competitiveness Index
UK United Kingdom
USA United States of America
USD United States Dollar
VNAT Vietnam National Administration of Tourism

xii
ABSTRACT
This research was generated through my previous career as a tour guide in Vietnam. The
tourism industry has been developing over recent years in Vietnam, as will be evidenced
by the literature review below. This research investigates the impact tour guides have on
the satisfaction of tourists who are choosing Vietnam as a tourism destination. The
following proposal outlines the case of the study in terms of history of tourism industry
in Vietnam, the role of tour guide in a package tour, and the relationships between tour
guide performance, foreign tourist satisfaction, and tourist’s destination loyalty in
Vietnam.
In the literature on tourism studies, significant attention has been paid to tourist
satisfaction that depended on various factors, but relatively little attention has been paid
to the effect of tour guide performance on both tourists’ satisfaction and their destination
loyalty. Even less research has been conducted on the role of the tour guide in a package
tour.
Tour guides are frontline employees in the tourism industry who play a significant role
in drawing tourists to a destination. Tour guiding service is the principal component of
tour services. Whether tour guides can deliver quality service to tourists is not only
essential to the business success of the company, but also significant to the image of the
destination (Huang et al., 2010). Although previous research looked at the factors of tour
guide performance on the experience of tourists in package tour, there is disagreement
about the impact of tour guide performance on tourist satisfaction. Destination loyalty of
tourist also needs to be investigated from the tour guide performance and tourist
satisfaction perspectives, in order to provide a more complete understanding of the role
of the tour guide in a package tour. This research, therefore, attempts to bridge these
gaps by exploring the attributes of tour guide performance from the foreign tourist’s
perspective.
The study was conducted in the context of the foreign tourists who are in Vietnam to
evaluate domestic tour guide performance. This context was chosen on the basis that

xiii
there has been no research conducted on tour guide performance in the Vietnamese
context. A self-administrated questionnaire was developed based on the review of the
relevant literature and focus group interviews, and was administered to a sample of 500
foreign tourists in six big cities that attract many foreign tourists in Vietnam. Tour
guides were recruited for data collection in every tour held by tourism companies. Tour
guides distributed the questionnaires to the tourists on the last night of the package tour
and then collected them on the next morning. The tour guide, in addition, also informed
the tourists that only the researcher would see the returned questionnaires that they put
in a sealed envelope. Additionally, I and my colleagues also travelled to the places that
attract many foreign tourists; handed the questionnaires to them; let them have
approximately 10 minutes to answer; and finally collected the questionnaires again.
Following a pilot study testing the survey instrument, the main data collection phase
resulted in 451 completed and useable questionnaires being available for analysis.
Structural equation modeling was used to explore the relationships among tour guide
performance, tourist satisfaction, and destination loyalty. The findings show that the
theoretical model fits well with the data, and that the five hypotheses proposed were
supported, providing answers three research questions.
The finding indicates that tour guide performance plays an important role on foreign
tourists’ satisfaction and tourists’ destination loyalty in a package tour. Tour guide
performance is comprised of five dimensions – appearance, professional competence
skill, solving problems skill, organizational skill, and entertainment introduction skill.
Tour guide performance is not only positively and significantly related to the satisfaction of
tourists, but also is one of the factors that determine the destination loyalty of customers.
This study, moreover, has proposed a number of suggestions for both tour guide and tour
manager/tour operator in order to identify the advantages and disadvantages of tour guide
attributes, and then to foster and enhance the performance of this force to reach a higher
level of customer satisfaction, as well as promote destination loyalty.

1
CHAPTER 1
INTRODUCTION TO THE STUDY
1.1 Introduction
In today’s global economy, tourism is one of the world’s largest industries. The
economic impact of the industry showed that, in 2011, it contributed 9% of global Gross
Domestic Product (GDP), equivalent to the value of over 6 trillion United States Dollar
(USD), and accounted for 255 million jobs (World Travel and Tourism Council, 2012).
Over the next ten years, the tourism industry is expected to grow by an average of 4%
annually, taking it to 10% of global GDP, or approximately 10 trillion USD. By 2022, it
is predictable that the industry will account for 328 million jobs, or 1 in every 10 jobs all
over the world (World Travel and Tourism Council, 2012). This trend, therefore, will
create not only more opportunities but also more challenges to build up the sector in
many countries, especially a developing country like Vietnam.
The tourism industry in Vietnam has recently had a speedy growth. However, along with
this development, the sector also has had to face the difficulties and challenges from
both external and internal factors. The external factors include the global financial crisis,
the increasing oil price, and the flu pandemic; while the internal factors come from a
lack of interesting of destinations, weak tourism administration, a lack or poor provision
of services, and weak human resources’ competencies (e.g. tour guide). This chapter will
give an overview of the tourism industry in Vietnam as well as the role of the tour guide
in a package tour for foreign tourists. The chapter also will bring out the objectives and
research questions of the study, the scope of the research, and conclude by outlining the
organization of the thesis.
1.2 The tourism industry in Vietnam
Since the economy opening to the world market in the early of 1990s, Vietnam’s travel
and tourism sector has had rapid growth. In 2010, the tourism industry generated more

2
than 4 billion USD in tourism receipts, indicating the importance of the industry to
Vietnam’s economy (Ha, 2010). The travel and tourism industry contributed directly
4.3% and indirectly 13.6% to total GDP of the country in 2008 (World Economic Forum,
2009). In addition, the industry also created jobs directly for 3% and indirectly for 9.9%
of total labor force in Vietnam in 2010 (Ha, 2010).
Vietnam is one of the most popular tourist destinations in the Asia-Pacific region (Binh,
2010). The World Travel and Tourism Council affirmed Vietnam as the world's fourth
fastest growing tourist destination (The Economist, 2008). In 2008, the country attracted
approximately 4.25 million inbound visitor arrivals, an increase of 2% when compared
with 2007. This growth, however, was comparatively slower than 2007 that recorded
over 16%, the decline possibly due to the global economic slowdown (Euromonitor,
2009). In addition, the industry also has to face problems and difficulties in its
development, such as inflation and fuel price growth, lack of policies to attract tourists,
underdeveloped system of hotels and accommodation, or the weaknesses in service
quality of a package tour (Euromonitor, 2011). These things are key factors that may
influence the development of the industry in the future.
Given the international importance of the travel and tourism sector, in 2005 the World
Economic Forum, along with its Industry and Data Partners, produced the Travel and
Tourism Competitiveness Index (TTCI) in order to provide a comprehensive strategic
tool for measuring the factors and policies that make it attractive to develop the travel
and tourism sector in 133 economies in the world (World Economic Forum, 2005). By
providing detailed assessments of the travel and tourism environments in nations, the
results might be used by all stakeholders to improve the industry’s competitiveness in
their countries, therefore contributing to national growth and prosperity.
Data presented at the World Economic Forum in 2009 ranked Vietnam 17th out of 25
countries in Asia Pacific, and 7th out of 8 countries in ASEAN (above Cambodia only,
while Laos and Myanmar are not in the survey) in terms of TTCI (World Economic
Forum, 2009 – see Table A0.1 in Appendix 5). This was definitely not good news for
Vietnamese travel and tourism industry. Specifically, when taking a deep look on 14

3
indicators in the 3 sub-indexes, it can be concluded that the threat of the industry comes
from Cambodia, Philippines, Indonesia, and Laos.
1.3 Human resource management and the role of tour guide in
a package tour in Vietnam
For a long time, it has been known that an efficient human resource management is one
of the important factors required to develop the travel and tourism industry in countries,
especially in developing countries like Vietnam (D’Annunzio-Green et al., 2002; Baum,
2007). This issue, again, was shown clearly in the World Economic Forum’s statistic in
2009. Specifically, the index of human resources in travel and tourism of Vietnam was
scored at 4.9 (out of 7) and ranked 82nd (out of 133 economies) all over the world, in
which the availability of qualified labor was ranked 45th. This rating was lower than
those of the other ASEAN countries (World Economic Forum, 2009 – see Table A0.1).
A person buying a package tour is likely to interact with a range of people, called human
resources of travel and tourism sector, including retail travel agent, insurance companies,
airport services, immigration and customs services, hotels, tour services at the
destination, companies and individuals selling goods and services at the destination, and
service providers on return (Baum, 1997). In terms of services at the destination, tourists
have most contact with tour operators, tour managers, along with tour guides when
designing a tour program and obtain the services they need.
One of the important elements contributing to the success of a tour program, as well as
to the satisfaction of tourists, is the skill of the tour guide (Huang et al., 2010; Mak et al.,
2010). These studies further reported that unequal skill of tour guides influences the
quality of tourism services in both small and big companies. Huang et al. (2010)
reported that when some of skillful tour guides leave their current companies to open
their own businesses, they take their customers and management skills with them. This
leads to difficulties for the old company due to a lack of skilled employees. Conversely,
the customers have to face the situation of a shortage of staff and instability of service
quality in the newly formed company, resulting in a low level of their satisfaction with a

4
package tour (Zhang and Chow, 2004). As a result, building proficient and skillful staff,
especially tour guides, is one of the vital objectives to improve competition capacity for
tourism companies (Huang et al., 2010).
In the report of Vietnam National Administration of Tourism (VNAT) – Ministry of
Culture, Sports and Tourism, recorded until 2010, Vietnam had about 800 registered
outbound and 10,000 inbound tourism companies with the total of more than 17,000 tour
guides who are working in the sector (VNAT, 2011a). Another statistic of VNAT in
2011 also showed that in the total of 987 international tourism companies, limited
companies occupied 60%, while joint-stock companies occupied 32% and state-owned
companies held not more than 2% of the total (VNAT, 2011b). Limited company is
company in which the liability of members is limited to what they have invested or
promised to the company. Joint-stock company is a business entity which is owned
by shareholders, and each shareholder owns the portion of the company in proportion to
his or her ownership of the company's shares. State-owned company is a legal entity
created by a government to undertake commercial activities on behalf of Vietnamese
government. Its legal status varies from being a part of government to stock
companies with a state as a regular stockholder. A statistic of Vietnam Ministry of
Industry and Trade showed that limited company is typical business in Vietnam,
occupying the largest market share not only in tourism industry but also in other
industries (MOIT, 2011). According to VNAT, there are two criteria for a qualified
international tour guide, including i) has bachelor degree in tour guiding profession (or
certificate of tour guiding profession in case he/she has bachelor degree in other
professions); and ii) is fluent1 in at least one foreign language (VNAT, 2011c). However,
not all of tour guides are sufficiently qualified for their jobs due to lack of education
and/or skills (Duyen, 2009). Specifically, in Ho Chi Minh City – the economic and
commercial centre of the country, although there were only 1,684 qualified outbound
tour guides that approved by VNAT, the total number of this labor force had exceeded
3,000 in 2009 (Duyen, 2009). This means there were a large number of unqualified tour
1 “Fluent” in English is TOEFL 500/IELTS 5.5/TOEIC 650 (according to the Decree 92/2007/NĐ-CP of Government)
5
guides working in the particular region. Moreover, in the “Ho Chi Minh City Excellent
Tour Guides 2010” contest, Mr. Huynh Cong Thang2 also indicated that the number of
unqualified tour guides had been increasing year by year (Vi, 2010). However, there is
lack of academic and available data from national surveys on tour guide as well as the
effect of tour guide performance on tourist satisfaction, leading to the difficulty to
identify the strengths and weaknesses of Vietnamese tour guides.
Additionally, in an in-depth interview Mrs. Pham Thi Hoa – Manager of Outbound
Department of Cholontourist Joint Stock Company – one of the biggest tourism
companies in Ho Chi Minh City with more than 20 years of experience in tourism
services – reported that there are several challenges faced by the human resource
management in the company, such as: low salary; heavy pressure of workloads; bad
relationship between new management system and old staff as well as tour operators and
salesmen, etc. She also implied that the lack of skills and qualifications, as well as the
lack of ability in languages (especially rare languages) of tour guide; are significant
factors that the company has to face (Hoa, 2011).
However, that is not the end of the story. For a long time, much research has reported
tour guide performance may influence the operation of businesses as well as the
development of tourism industry in many countries (Wong, 2001; Yu et al., 2002; Wong
and Kwong, 2004). These researchers noted that there are many complaints from tourists,
especially foreign clients, about quality of tour guide staff. In the Vietnamese context,
tour guides were reported to lack knowledge, have weakness in language ability and
interpersonal skills, which results in unacceptable mistakes; or they do not have empathy
or passion for their work (Thuy and Anh, 2005; Ha, 2008; Hung, 2010). Consequently,
poor tour guide skill is one of the factors that contributed to 85% of tourists stating that
they have no intention to return to Vietnam (Anh, 2006).
1.4 Objectives of the study and research questions
2 Mr Huynh Cong Thang is currently responsible for education and training of Association of Tourism in Ho Chi Minh City - Vietnam

6
From the above research there are relationships between tour guide and tourist
satisfaction as well as between tourist satisfaction and tourist’s intention to return to a
destination. However, although some research on the tour guide performance and its
impact on tourist satisfaction has been conducted in countries like Hong Kong, Macau,
and China (Wong, 2001; Huang et al., 2010; Mak et al., 2010), there is lack of academic
research on this in Vietnam. The coverage of this research will be greatly expanded and
discussed further in the literature review in chapter 2.
Consequently, understanding the factors affecting tour guide performance, and the
relationship between tour guide performance and foreign tourist satisfaction is
considered essential in order to increase competitiveness and develop the tourism sector
in Vietnam. Therefore, the purposes of the study are:
i) To explore the factors affecting the tour guide performance in a package tour;
ii) To determine the importance of tour guide performance to foreign tourist
satisfaction;
iii) To investigate the relationship between foreign tourist satisfaction on tour guide
performance and destination loyalty.
All of the above purposes are studied in the context of the tourism industry in Vietnam.
In fulfilling these purposes this research will make contribution to the study of tourism
by examining the relationship between tour guide performance and tourist satisfaction.
Hence, given these objectives, the research questions of the study are:
What are factors influencing tour guide performance in tourism industry in
Vietnam?
What is relationship between tour guide performance and tourist satisfaction in
tourism industry in Vietnam?
What is the relationship between tourist satisfaction on tour guide performance and
destination loyalty?

7
It is also noted that in this study, the words ‘factor’ and ‘attribute’ are used
simultaneously in order to show the quality or feature regarded as a characteristic or
inherent part of tour guide performance, while the word ‘dimension’ is used to state the
group of attributes/factors of tour guide performance.
Chapter 2 following will outline the present literature on tourism research concentrating
on the impacts of tour guide performance on tourist satisfaction and destination loyalty.
1.5 Scope of the research
The main objective of this study is to identify specific attributes of tour guide
performance for improving the foreign tourist satisfaction and destination loyalty in the
context of Vietnam.
By building on industry, strategic human resource management and customer
satisfaction studies, the research will focus on the impacts of tour guide performance on
foreign tourists’ satisfaction in the Vietnamese tourism industry.
The research model includes the factors of tour guide leading to gains in the level of
satisfaction of tourists. As most of the research in the tourism sector has focused on the
perception tour guide at tourist’s approach, this study extends knowledge by examining
tour guide performance at the various points of view from tourist to tour guide and tour
manager in the Vietnamese tourism industry.
The lack of understanding of impacts of tour guide performance on tourist satisfaction as
well as the relationship between tourist satisfaction on tour guide performance and
destination loyalty suggested that this investigation is timely in planning for future
improvements in the Vietnamese tourism industry.
1.6 Organization of the thesis
This thesis is organized into five chapters. Chapter 1 has outlines the research questions
and objectives of the research. Background information has been provided and several
critical issues on tour guide in the tourism industry have been named.

8
Chapter 2 reviews the relevant literature on the role of human resource management in
tourism industry, as well as the role of tour guide on tourist satisfaction and destination
loyalty. This chapter also brings out the model, three research questions, and five
hypotheses of the study based on the literature review and previous studies.
Chapter 3 introduces the research design; the methodology is discussed, and methods
seeking responses to three research questions. Ethical issues are also discussed in this
chapter.
Chapter 4 provides an analysis of the exploratory data from the focus group interviews,
as well as presents the results of the foreign tourist questionnaire. This chapter also
provides a discussion of responses to the research questions and the attributes of tour
guide performance, the relationship between tour guide performance and tourist
satisfaction, the relationship between tourist satisfaction on tour guide and destination
loyalty, and the relationship between tour guide performance and tourist’s destination
loyalty.
Chapter 5, the final chapter, contains the conclusions and implications of the study for
the future of the Vietnamese tourism industry. The limitations of the current study will
be subsequently reported, followed by the areas for future research. Finally, the
conclusions of the current study will be presented.
1.7 Conclusion
This research explores the factors affecting tour guide performance as well as examining
the relationship between tour guide performance and tourist satisfaction that leads to the
destination loyalty of tourists. Three research questions with five hypotheses are tested
by an empirical study of 500 foreign tourists in Vietnam. This is the first study in
Vietnam that addresses the concept of tour guide performance based on the perceptions
of tourists, tour guides, and tour managers/tour operators. The next chapter will review
the literature on tour guide, service performance, tourist satisfaction and destination
loyalty in order to bring out the research model and hypotheses to be tested. Specifically,
the chapter will discuss the role of human resource management in tourism industry, the

9
role of tour guide in a package tour, the differences between service quality and service
performance, the relationship between service quality and tourist satisfaction in tourism
industry, the relationship between tour guide performance and tourist satisfaction, and
the relationship between tourist satisfaction and destination loyalty.

10
CHAPTER 2
LITERATURE REVIEW
2.1 Introduction
The new millennium is influenced by significant political, social, demographic and
technological changes, and will positively differ from the 20th century. As far as many
people are concerned, the 21st century will bring more spare time, a higher standard of
living and a better quality of life (Holjevac, 2003). As biological beings, humans not
only have to satisfy their basic needs for food, beverages, sleep and shelter, but also to
satisfy their social and spiritual needs like leisure, recreation, and travel. In addition, a
decline in the number of poor people will lead to the fact that people will have more
chances for both rest and recreational activities in their free time. Recreational and travel
activities will be undertaken not only for the purpose of meeting the growing needs of
people for leisure, but also for maintaining and caring for people’s health and longevity,
for creating a life of comfort satisfaction and relaxation, or in other words, improving
the quality of life (Holjevac, 2003). As the result, human beings as travelers will be the
key force in the development of tourism industry.
2.2 Tourism research development
Early research on tourism defined tourism as an identifiable nationally important
industry (Australian Department of Tourism and Recreation, 1975:2). The industry
involves a wide cross section of component activities including the provision of
transportation, accommodation, recreation, food, and related services for domestic and
overseas travelers. It involved travel for all purposes, including recreation and business
(Ansett Airlines, 1977:773). Later, Leiper (1979) also affirmed the tourism industry
consists of all firms, organizations and facilities that are intended to serve the specific

11
needs and wants of tourists. That intention is manifested by a marketing and design
orientation of the individual units forming the industry.
Nowadays, tourism sector is among the world’s most important industries, accounting
for significant shares of global GDP and employment. In 2013 these shares were
estimated at 9.5% and 8.9% respectively (World Travel and Tourism Council, 2014).
Tourism is an industry that may help developing countries to solve their problems of
unemployment and poverty by turning the potentials, for example, natural beauties and
cultural heritage, into a profit. Moreover, it is a clean industry that achieves to preserve
and conserve nature for future generations (Holjevac, 2003).
Theoretically, there are some arguments related to the similarity or difference between
the terms ‘tourism’ and ‘hospitality’. The results from a study of Cheng et al. (2011)
suggested that tourism and hospitality research are becoming more closely related. The
authors stated that about 40% of the tourism research included hotel and restaurant
administration in their objectives. In addition, approximately 30% of the studies directly
employed the word ‘hospitality’ or ‘hotel’ in their titles, and the number of such studies
has increased noticeably in recent years (Cheng et al., 2011). This might suggest the
mergence of these two academic fields, or at least the blurriness of research boundaries.
However, this suggestion was in conflict with the argument of Jamal et al. (2008) who
proposed that hospitality should be considered as a distinctive field from tourism. In the
same way, Howey et al. (1999) also affirmed that there was a mixture of research
between the hospitality and tourism fields.
Along with the development of the world tourism industry, research on this field has
been increasing over years. There is apparently no shortage of research on ecotourism
(e.g., Lee, 2004; Romzi et al., 2011), consumer behavior (e.g., Christina and Hailin,
2008; Hung et al., 2011), sustainable tourism (e.g., Buckley, 2012), hospitality education
(e.g., Baum, 2002; Solnet, 2012), or cultural tourism (e.g., Hughes and Allen, 2005;
Cuccia and Rizzo, 2011). In general, there are nine popular themes on tourism research
in developing countries, including regional tourism development, tourism industry status,
ecotourism and sustainable development, operational management, research review,

12
tourism and sociology, tourist behavior, tourism discipline development, and tourism-
related theory (Tsang and Hsu, 2011).
Goeldner and Ritchie (2012) found that tourism has been researched by many
disciplinary approaches. The authors also demonstrated that tourism studies have
become more pervasive and complicated, which interacts with the rapid change of social
and technological environment. Additionally, the changing disciplinary focuses in
tourism research not only showed the coverage of tourism knowledge by academic
journals, but also demonstrated each disciplinary focus’ relative position in this field.
Specifically, according to Ballantyne et al. (2009), Tourist Studies (articles that focus on
the behaviors, preferences and perspectives of tourists) accounted for 11% of all
published articles, and played the most important role in tourism research area. Tourism
Planning (tourism development, strategies, predicting and forecasting); Destinations
(destination image, management and development) and Marketing (marketing,
segmentation and promotion) each accounted for 8–9% of the articles. These top four
topics represented 37% of all articles. Tourist Studies, Marketing and Special Events
also showed the greatest growth over years, while Destinations, Tourism Planning, and
Cultural Tourism showed the greatest decline. This decline was due to these topics
shifting out of the three major journals and into specialist journals, including the Journal
of Vacation Marketing, Tourism Geographies and Tourism Economics. On the other
hand, the majority of tourism research (59%) used quantitative research designs, while a
much lower proportion of studies took a qualitative (19%) or mixed method approach
(6%), and the remainder (16%) were review or theoretical articles. Most research on
tourism used statistical analysis (70%), including some qualitative designs. It can be said
that Tourist Studies was strongly quantitative; while Destinations was more likely than
the others to use qualitative designs; and Tourism Planning was more likely to use a
variety of methods. In addition, the Journal of Travel Research had the highest
proportion of articles with quantitative designs (74%), while the Annals of Tourism
Research had the highest ratio of articles with qualitative designs (28%), and Tourism
Management had the highest percentage of articles with other designs (26%).
13
It is also noted that approximately half of all the tourism research collected data from a
single site or limited geographical area (Ballantyne et al., 2009). The authors affirmed
the Annals of Tourism Research had the highest proportion of studies (27%) where data
were collected from more than one country. The percentage of studies conducted by
USA or UK-based authors/institutions decreased from 48% to 22%, while research
conducted by institutions in Australia/New Zealand, Asia and other European countries
increased from 33% to 59% over 10 years (from 1994 to 2004). In 2010, The Australian
Business Deans Council ranked 79 tourism and hospitality journals into one of four
categories, where three journals (including Annals of Tourism Research, Journal of
Travel Research, and Tourism Management) were given an A* ranking (Fennell, 2013).
The Journal of Travel Research published mostly USA-based studies (47%); Tourism
Management published articles from the UK (24%), Asia (24%), and Europe (22%);
and Annals of Tourism Research published similarly among countries (Ballantyne et al.,
2009). Furthermore, the authors, again, confirmed the increasing importance of research
on tourists and tourist experiences; the decline in economic and hospitality studies; the
rise in marketing and management areas; the gradual decrease of the domination of
North America; and the increasing contribution of Australia, New Zealand and Asian
countries.
It can be said that tourism is an industry that has a high need for human capital and
offers a diversity of jobs in a variety of businesses of varied sizes and types (Szivas et al.,
2003). Because of this reason, studies on human resource management in the industry
have been of interest to many researchers (D’Annunzio-Green et al., 2002; Chan et al.,
2004; Baum, 2007; Baum, 2012). Additionally, the efficient human resource
management not only creates capable labor forces (e.g. tour guide) in organizations but
also contributes to the service quality outcomes as well as the success and development
of tourism industry (Grant et al., 2008).
This chapter reviews the literature and the theory related to studies in tourism. Based on
the wide range of sources, the literature is divided into two themes: i) The role of human
resource management in travel and tourism industry; and ii) Tour guide, service
performance, tourist satisfaction and destination loyalty in travel and tourism industry.

14
The chapter, in the next step, also brings out the research model, research questions, and
hypotheses of the study based on the literature review and previous studies.
2.3 The role of human resource management in tourism
industry
In order to understand the role of human resource management as a whole, consideration
was given to its origins and historical development (Nankervis et al., 2008). Both human
resource management and human resource personnel are influenced by management
theory relating to the change of economic, social, political and industrial relation factors
(Davidson et al, 2010). The foundation of the human resource management paradigm is
based on the notion of the welfare of employees (Carey, 1999). Table 2.1 provides an
overview of the stages of human resource management development.

15
Table 2.1: Development stages of human resource management
Development stage Characteristics
Welfare and administration (1900 to 1940s) Welfare, administration, staffing and training (1940s to mid 1970s) Human resource management and strategic human resource management (mid-1970s to late 1990s) Strategic human resource management in the new millennium
- Represents an era prior to the establishment of the human resource management profession - Line managers and supervisors performed personnel management functions - Personnel management functions were fragmented - Restricted to administration areas - Beginning of specialist approach to personnel management - Human relations theory - Scientific management - Behavioral science - Resurgence of unionism - Influence of “excellence” theories - Total quality management theories - Move from personnel management to human resource management - Strategic focus on organizations’ overall effectiveness - Increased employment legislation - Strategic approach to human resource management – strategies and policies - Likely that human resource management concepts and roles of human resource managers will change - More attention to international human resource models - Thought leaders have implied that the new human resource management will either specialize in value management, strategic partnering and establishing the human resource architecture for organizational success or the devolvement of outsourcing traditional human resource processes to line managers and external human resource consultants, respectively - Emphasis on talent management, knowledge management and human capital management
Source: Adapted from Nankervis et al. (2008)

16
The welfare and administration in the first stage recognizes a rigid process simply
dealing with the procedure of having employees and the requirement to hire, pay, and
fire. A company associated with this process was run by line managers who performed
this function with organizational assistance. Then the next stage changed to incorporate
staffing and training that employees were treated and consideration of their motivations
were significant factors to increase the productivity (Nankervis et al., 2008).
There was an important focus placed upon the quality and strategic outcomes of human
resource management from the 1970s to the 1990s. This reflected to a large extent the
general management thinking about holistic approaches and systems management of
employees working with the organization as a whole. At last, the new millennium in
human resource research noticed a focus on high performance workplaces, talent
management. Human capital and knowledge management therefore became key themes
for organizations in all industries (Davidson et al., 2010).
In this thesis, human resource management is understood to be recruiting the right
people for the right position, and then helping them achieve the right standards or
develop them to provide better product/service delivery to customers (Price, 2004).
Baum (2012) indicated that the human resource dimension is one of the most important
elements of any industry sector, such as tourism, which is characterized by high levels of
human involvement in the development and delivery of services or vacation experiences
to the customer. Historically, Olsen et al. (1990) stated human resource management is
one of the biggest challenges facing the tourism sector. This challenge will continue to
be one of the issues for managers in the future (Berman, 2004). Especially, how to find
and develop employees in a labor market is significant to the travel and tourism sector.
Nowadays, although the environment where technological development has
revolutionized the concept of hospitality services, it is still impossible to satisfy
customers without well- trained and skillful employees (José et al., 2009; Pucciani and
Murphy, 2011). According to Wright et al. (1994), human capital, including knowledge,
skills, and behavior of employee, reinforces the importance of people-related
competencies with links to the success of a company. In addition, effective human
resource management can be considered as the new and significant source of

17
competitiveness (Chan et al., 2004). Hence, understanding how to manage this
competitive source in an organization for better performance is a great concern for all
hospitality and tourism establishments (Singh et al., 2007). More recently, research on
tourism education in Turkey of Yesiltas et al. (2010) also showed that the contribution
of human resource management, as reflected in the service quality and the experience of
consumer, is a key element in the delivery of a high quality international tourism product.
Investment in human resources therefore emerges as a crucial aspect of tourism
development. Additionally, Kusluvan et al. (2010) in their research again affirmed the
role of human resource management when considering human resource as one of the
most important asset of tourism organization, and stressing the significance of employee
performance in tourism and hospitality industry. The authors also stated that, because
the main output of tourism organizations is services, researchers have investigated the
features of services that are most significantly driven by human resources.
Despite the substantial need for human resource management in tourism industry, the
function of human resource management has not reached full potential in many
countries. For example, in the small and medium-sized enterprises of hotel and catering
in the UK, which employ not more than 250 employees but represent 97% of the UK
tourism and hospitality workforce, human resource management is acknowledged as
having more potential to explore (Lee-Ross, 2000). A study in Australia of 483
hospitality firms, on the other hand, indicated that service quality and staff
commitment could be improved by human resource practices like performance appraisal
and remuneration strategies (Davies et al., 2001). Lucas and Deery (2004), in their
review of 100 papers concerning human resource management in five leading hospitality
journals, also found that human resource management research in hospitality
predominately replicated mainstream human resource management research. They
suggested that human resource management hospitality researchers should look at a
number of key issues, including the role of human resource management in managing
the work environment. Lately, Enz (2009) in her worldwide survey of 243 lodging
managers for their opinions on human resource management issues also reported that

18
“innovation in human resource management is needed to gain a sustainable competitive
advantage” (Enz, 2009, p. 14).
The same situation can be also found in developing economies as it seems that human
resource management needs to be applied more. For example, China has an expanding
but under-developed tourism industry that has significant needs in training and
education for employees where the concept of customer service is not broadly
understood (Hanqin et al., 2001). Moreover, Cho et al. (2006) found that there is no
relationship between human resource practices and hospitality organizational
performance, but they acknowledged that human resource practices did impact upon
employee turnover.
Methodically, although there are other issues, most of the existing literature that has
relevance for the human resource management of people in tourism industry seems to be
put in one of the following categories: (1) employee personality and emotional
intelligence, (2) emotional and aesthetic labor, (3) human resource management
practices, (4) internal marketing, (5) organizational culture and climate, (6) business and
human resource management strategy, and (7) employee job attitudes and behaviors
(Kusluvan et al., 2010). Among them, ‘employee personality and emotional intelligence’
field, especially employee personality, was chosen as the basic discipline for this study.
Employee personality shows its importance as a selection criterion for tourism
organizations due to the role in employee performance. Normally, employers use terms
such as ‘good attitudes’, ‘social skills’, and ‘personal characteristics’ to identify the
skills requirements for tourism employees (e.g. tour guide). Many researchers and
industry practitioners also argued that employee personality influences customer service
attitudes and behaviors, customer service skills, and overall performance of service
providers, which may be critical for service quality, customer satisfaction, customer
loyalty, and organizational success (Kusluvan et al., 2010).
With the importance of human resource management in tourism industry as well as the
development trend of human resource management shown in Table 2.1, it can be said
that the behavior and skills of employees are very important parts of the customers’

19
evaluation of the quality in service industries. The behavior of service providers
influences directly the customers’ judgment of the nature of the service (Goodwin and
Ross, 1990; Chen and Chen, 2010). For a long time, Wiley (1990) affirmed that
customer satisfaction on service as a correlate of employee’s attitude and performance,
stressing the importance of quality service to organizational achievements. Additionally,
Baum and Hagan (1999) implied that the lack of sustained employment may decrease
the ability of operators to deliver quality to customers. Obviously, customer has the right
to expect high quality of goods or services in the current market economy. At the same
time, qualified labor is becoming harder to find and keep, while customers are
demanding increasingly high level of services (D’Annunzio-Green et al., 2002; Nickson,
2013). Again, Liu and Wall (2006) and Lin et al., (2011) in their research reported that
the deficiencies in human capital, along with a labor surplus with low skills and
qualifications, have been a major obstacle preventing the host population from
participating effectively in tourism employment.
Research by Schlesinger and Hesket (1991) indicated that capable workers who are
well-trained will provide better service, need less supervision, and are much more likely
to stay on the current job. As a result, their customers are more satisfied, return more
often and seem to purchase more, creating the loyalty to that service. Berry et al. (1989)
suggested that, in an organization which has the culture of providing quality service, it
could motivate their employees through challenging the ir performance. In today’s
competitive market, organizational effectiveness depends on understanding customer’s
values and communicating this understanding to the performance of employees (Ranjan
and Sanjeev, 2008; Carmel and Lester, 2010).
Nevertheless, the employees in an organization offer different skills, abilities, and
knowledge that may or may not be suitable to the needs of business. Additionally, their
commitment and motivation are also various. In particular, some people are willing to
work and are motivated to achieve company’s objectives, while others regard their
employing firm as a vehicle for personal goals. This leads to the fact that some people
may be overworked while others are underutilized. Commonly, there is a gap between
the actual performances of employees and the ideal requirements of a business. Human

20
resource management focuses on narrowing this gap to reach greater organizational
effectiveness (Price, 2004). Human resource management is a special approach to
management of people in order to achieve competitive advantage through the strategic
development of a capable workforce by using an integration of culture, structural and
personal techniques (Storey, 2001). Agreeing with this point, Baum (2012) also stated
that the role of human resource management in creating service quality has widely been
recognized as one of the most significant methods to enhance quality and
competitiveness.
In today globalization process of travel and tourism, the role human resource
management issue, again, is more concerned. Expansion opportunities in home markets
with native customers have recently been limited by intense competition from a large
number of domestic companies. At the same time, there are more attractive opportunities
for business from foreign customers (Jean-Jacques et al., 2010; Cohen, 2012). On the
other hand, for expanding international travel, technological advances in terms of
information and communication have reinforced the rapid expansion of hospitality and
tourism organizations (Kriegl, 2000). As a result, the challenges for organizations when
dealing with international customers from many countries around the world will bring
out a new frontier in terms of employee issues because they have to interact with the
variety of languages, cultures, habits of foreign customers (Nickson, 2013).
In general, with the purpose of attracting customers to maximize profit, tourism
enterprises compete against one another not only on low price strategy or fascinating
destination provision, but also on the level and quality of services they offer to the
customers. Due to this competition, employees in the companies who provide services
(e.g. tour operators, tour managers, tour guides) can be considered as one of the most
significant resources (Nickson, 2013). Tourism is a labor intensive industry so that
provides a good environment to explore issues of human resource management (Singh et
al., 2007; Kusluvan, 2010). Studying the role of human resource management in tourism
operations as well as the role of employees like tour guide in a tour program, therefore,
will fill the gap of understanding the importance of human resource management and

21
human resource management practices for the development of the emerging travel and
tourism industry in many countries, especially developing economy like Vietnam.
2.4 Tour guide, service performance, tourist satisfaction, and
destination loyalty
2.4.1 The role of tour guide
According to The World Federation of Tourist Guide Associations (2003:1), a tour guide
can be understood as a person who ‘guides visitors in the language of their choice and
interprets the cultural and natural heritage of an area’, and who ‘possesses an area-
specific qualification usually issued and/or recognized by the appropriate authority’.
Tour guides are frontline employees in the tourism industry who play significant role in
drawing tourists to a destination. Tour guiding service is the principal component of tour
services offered by tourism companies. Whether tour guides can deliver quality service
to tourists is not only necessary to the business success, but also critical to the image of
the destination (Huang et al., 2010).
It can be said that empirical research on tour guides and tour guiding is concentrated into
Asia region (especially China, Hong Kong, and Taiwan) and Australia. Research of
Weiler et al. (2014) revealed that 26% of studies were undertaken in Asia region, of
which 17% in China/Hong Kong/Taiwan, followed by studies conducted in Australia
(25%), the US (12%), Europe (excluding the UK) (11%), and Latin/South America (7%)
(see Figure 2.1).

22
Figure 2.1: Study location of empirical research on tour guides and tour guiding in the
period 1979-2013 (n=191)
Source: Weiler et al. (2014)
Up to 2013, there had been 146 papers on tour guides and guiding services published in
scholarly journals, including 43 papers in Annals of Tourism Research, Journal of
Sustainable Tourism and Tourism Management (Weiler et al., 2014). The following
figure also shows the trend of research over time, indicating that publication of tour
guiding research in journals had grown considerably in the past 20 years in comparison
to research published as book chapters which has declined.

23
Figure 2.2: Trends in publication of tour guide and guiding services research
Source: Weiler et al. (2014)
There have been six themes identified in the tour guiding literature over the past 50
years, including (i) the multiple and complex roles and role dimensions of tour guiding,
(ii) the role of the guide as communicator and interpreter, including performance,
storytelling and intercultural communication, (iii) theory, research and practice relating
to the guide’s contribution to the sustainability, (iv) visitors’ expectations of and
satisfaction with their guides and guided experiences, (v) improving tour guide
performance through training, education and professional development, and (vi)
conceptualizing and fostering quality in tour guiding, especially through professional
associations and guide certification (Weiler, 2014). In addition, a number of other
emerging themes have been studied, for example, the role of gender (Lin et al., 2008;
Modlin et al., 2011); the perspectives of tour guide (Aloudat, 2010); and the health,
safety and well-being of tour guides (Houge and Kerr, 2013).
Although there are limited empirical studies on tour guides, a number of researchers
have paid attention to some of the roles that the tour guide can play in drawing the
tourist experience. Historically, tour guide could be understood as leader, information
giver, navigator, health and safety officer, organizer and mediator (Cohen, 1985; Weiler

24
et al., 1992; Pond, 1993; Weiler and Davis, 1993). These roles, after that, were recruited
to be the attributes required for a ‘qualified’ or ‘good’ guide (Black and Weiler, 2005).
More recent studies, in addition, showed that tour guide has more professional roles to
play in ecotourism and nature-based tourism, for example, interpreting site and
motivating tourists to modify their behavior to minimize the impacts on the resource
base (Weiler & Ham, 2001; Yamada, 2011; Poudel and Nayaupane, 2013). A review of
some of the key published literature from 1985 to 2014 focusing on the roles of tour
guides revealed ten main roles. As shown in Table 2, all eight of the studies identified
the role of interpreter and information giver, suggesting that while tourists gain their
information from a range of sources, for example signs and brochures, face-to-face
interpretation is widely acknowledged in the literature as a key role of a tour guide. For
example, research of Ballantyne and Hughes (2001) and Yamada (2011) in ecotourism
affirmed that interpretation is fundamental to effective guiding, and training programs
for tour guide need to focus on the face-to-face interpretation skill. On the other hand,
seven studies mentioned the roles of leader, while six authors, except Bras (2000) and
Weiler and Walker (2014), implied the roles of motivator of conservation values and
social catalyst. In terms of the role of leader, Howard et al. (2001) defined leader
characteristics of tour guide as providing direction, access, security and safety, as well as
maintaining cohesion within the group; while Huang et al. (2010) showed that the tour
guide role as a leader can be understood as the skill of time management and tour-related
activities organization. Other roles mentioned by at least four authors, include
navigator/protector, cultural broker/mediator, tour manager, public relations
representative and facilitator of access to non-public area.

25
Table 2.2: Key roles of tour guide identified by selected authors
Tour guide roles Cohen
(1985)
Weiler
&
David
(1993)
Bras
(2000)
Ballantyne
& Hugh
(2001)
Howard
et al.
(2001)
Huang
et al.
(2010)
Yamada
(2011)
Weiler
&
Walker,
2014)
Interpreter/educator
Information giver
Leader
Motivator of
conservation
values/role model
Social role/catalyst
Navigator/protector
broker/mediator
Cultural
broker/mediator
Tour & group
manager/organizer
Public
relations/company
representative
Facilitator of
access to non-
public areas
Source: Developed for this research
Many researchers have presented various methods for measuring tour guide’s roles from
tourists’ perspectives by assuming about their own dimensions of tour guide
performance. For example, Zhang and Chow (2004) suggested 20 service quality

26
attributes to evaluate tour guide performance in Hong Kong. The authors affirmed that
there were five most important service quality attributes affecting mainland Chinese
tourists’ level of satisfaction, including punctuality, the ability to solve problems,
knowledge of the destination, honest and trustworthy, and informing of safety
regulations. Another research of Wang et al. (2007) employed multistage steps to
validate a scale for measuring the group package tour service in Taiwan. In their study,
six items for tour leader attributes (presentation ability, sense of responsibility,
friendliness, interpretive ability, professional ability, and ability to coordinate within
group members) and two items for local guide attributes (professional ability and skillful
group leading) were extracted and found to be important to measure the performance of
the tour leader or local guide. Later, Huang et al. (2010), after reviewing relevant
literature review of tour guide performance attributes, summarized 35 items to estimate
the relationships between tour guide performance and tourist satisfaction in Shanghai,
China. The study used both Chinese-speaking and English-speaking samples, in which
the Chinese-speaking sample produced two factors labeled intrapersonal servability and
interpersonal servability, whereas the English-speaking sample generated four factors
labeled professional competence, interpersonal skills and organization, empathy, and
problem-solving ability. The results illustrated that tour guide service performance
determines tourist satisfaction with the tour guide services. Recently, by adapting from
previous research of Heung (2008) about the items to measure service quality of tour
guide performance, Chang (2014) in his research on the relationship between tour guide
performance and tourists’ shopping behavior in Taiwan, also identified three factors for
measuring tour guide performance, including ‘presentation and communication ability’,
‘professional attitude and ability’, and ‘personal appearance/manners and
integrity/knowledge.
According to Black and Weiler (2005), there are six mechanisms that may improve role
performance of tour guide, including codes of conduct, professional associations, awards
of excellence, training, professional certification, and licensing. Codes of conduct are
generally considered to be a tool for awareness-raising rather than a form of quality
control of tour guide (Font and Buckley, 2001; Weiler and Ham, 2001). This mechanism

27
can be measured by the roles of tour guide in terms of safety, navigation and access
(Guild of Registered Tourist Guides, 2001); or in terms of interpreter, motivator of
conservation values, and cultural broker (Bras, 2000). Next, professional associations
have the capacity to provide professional support and other benefits that can raise
guiding standards. This mechanism is instrumental in introducing or supporting other
mechanisms as well as to contribute to improve professional standards and performance
of tour guide. The third mechanism, awards of excellence, focuses on recognizing and
rewarding excellence in guiding. This mechanism can be measured by guiding
experience, planning and research of the product, measures to ensure a high standard of
interpretation and customer service, and provisions for visitors with special needs
(Tourism Council of Australia, 2000; Gaborit, 2001).
The fourth mechanism, training, assists tour guides in carrying out their various roles
and enhancing guide performance. This was usually measured and provided by
professional associations that mentioned above, or by government and non-government
training providers (Black and Weiler, 2005). Well-trained guides may provide a
competitive edge for a tour company, and increase level of tourist satisfaction
(Roggenbuck et al., 1992; Whinney, 1996). In addition, training is also a requirement for
licensing or certification (Bras, 2000). Next, professional certification is the mechanism
that enhances the performance of tour guides. Professional certification is generally
defined as a process in which tour guide is tested and evaluated to determine if they have
the skills and knowledge required by their profession. The requirements of a
professional certification may vary depending on the aims of the program, the forms of
assessment, and the level of certification. In contrast to professional certification, the last
mechanism, licensing, is a mandatory legal requirement for some professions to practice
(Morrison et al., 1992; Pond, 1993). Licenses are normally issued and required by
government agencies (Issaverdis, 2001). Many countries around the world require a
license to practice as a guide, including South Africa, Malaysia, Singapore, Indonesia,
China, and United Kingdom (Black and Weiler, 2005). It is also noted that skills,
knowledge, and understandings are generally the criteria that a guide must possess to
gain a license. These criteria also vary from country to country. In fact licensing has

28
some benefits in supporting and enhancing tour guide performance, however, difficulties
of monitoring and enforcement may restrict licensing to be a more well-known
mechanism than the others (Black and Weiler, 2005).
Furthermore, Black and Weiler (2005) also affirmed that enhancing guide performance
can be attempted through one or a combination of the above mechanisms. The possible
outcomes of implementing the mechanisms may develop individual guide performance
as well as improve industry-wide performance and increase tourists’ experience. Among
the above mechanisms, training, professional certification, and licensing are most
significant that stressed by many authors. For example, many Asian countries such as
Indonesia, Malaysia and Singapore had set up a strict certification and licensing system
with much government involvement for a tour guide (Bras, 2000; Henderson, 2003).
Huang and Weiler (2010) in their research also confirmed these mechanisms as the
evaluation of China’s quality assurance system for tour guide. Mak et al. (2011)
described the designing the measures and mechanisms that related to training and
certification, in order to enhance service quality and professionalism of tour guide in
Hong Kong and Macau. Moreover, in Canada, only two cities, including Montreal and
Quebec City, had training necessary in order to become a tour guide. These two cities
only also will issue the license required for conducting local sightseeing tours (Hu and
Wall, 2013).
2.4.2 Service quality and customer satisfaction
Service quality and customer satisfaction are two recognized concepts in marketing
literature (Parasuraman et al., 1988; Fornell et al., 1996). An increasing number of
research on these topics can also be found in tourism industries (Ekinci, 2003; Antony
and Ghosh, 2004; Campos-Soria et al., 2005; Lee et al., 2011; Kuo et al., 2013). On the
operational level, service performance is considered as a suitable measure for both
service quality and customer satisfaction (Johns et al., 2004; Martínez Caro and
Martínez García, 2008; Setó-Pamies, 2012).

29
Service quality has been widely researched, in most cases along with customer
satisfaction, and in the fields of consumer behaviors and marketing. One of the most
commonly applied theories regarding service quality is the SERVQUAL model
(Parasuraman et al., 1988). The authors promoted the model by conceptualizing service
quality as a construct with five dimensions, including Tangibles, Reliability,
Responsiveness, Assurance, and Empathy. The model has been applied to various
service sectors, including tourism industry (Saleh and Ryan, 1991; Heung et al., 2000;
Bhat, 2012). However, when applying this model to the service sector, these researchers
seem to agree more on the multiple attribute nature of service quality than the five
dimensions in the original model.
Methodically, in the context of tour guide services, Heung (2008, pp. 306-307)
suggested that service quality can be evaluated through three main constructs:
(1) Core service delivery: this construct reveals the essence of a tour guide’s service,
which the guide must deliver with consistency (e.g., follow the itinerary of the tour,
and ensure that transportation, accommodation, dining and tour activities are
arranged smoothly and safely);
(2) Customer orientation: this construct reflects the extent the guide puts tourists’
needs and interests ahead of his or her own in providing superior value to them (e.g.,
assure customer satisfaction during a tour, and focus on what is valuable to the
tourists and do as much as possible for them);
(3) Communication effectiveness: this construct involves an exchange of information
and is an important factor in the relationship marketing between the tour guide and
the tourists (e.g., communicate the itinerary of the trip to the tourists, provide
interpretation of attractions, and handle tourist’s enquiries/complaints).
Additionally, service performance is a concept that closely related to service quality.
Some researchers have used service performance as a good tool to evaluate service
quality (Crompton and Love, 1995; Johns et al., 2004). For example, in their research,
Johns et al. (2004) used the traditional SERVQUAL and service performance

30
(SERVPERF) scale respectively in order to examine service quality delivered by travel
agents in Northern Cyprus, by measuring customer’s expectation and perceptions of
travel agents and identifying the gaps in the service quality offered. The result of this
study showed that SERVPERF was considered as better than SERVQUAL to predict
overall satisfaction of customers. However, research on both service quality and service
performance of tour guiding profession is relatively scarce when compared with those
on hotel and restaurant services. By using SERVQUAL, Wong and Kwong (2004)
investigated the selection criteria for choosing package tours by Hong Kong outbound
tourists and found that tour arrangements and service quality are the most important
factors when choosing outbound package tours. Criteria included in service quality
factor are ‘reputation of travel agency’, ‘service quality of travel agency’, ‘escorts, tour
guides’ quality and experience’, ‘guaranteed departure’, ‘safety of the tour’, and
‘relaxing itinerary’. Zhang and Chow (2004) applied an importance performance
analysis based on SERVQUAL in assessing Hong Kong tour guides’ performance by
outbound visitors. The results showed that Hong Kong tour guides performed well in
their professional skills, reliability, and language ability, even though they should
increase their problem-solving ability.
Customer satisfaction has been broadly investigated by researchers and over the years. A
number of methodological approaches to the measurement of customer satisfaction have
been expanded, but no agreement has yet been proven as the best approach. The
literature on customer satisfaction is generally divided into two schools of thought lead
by Parasuraman et al. (1985) and Gronroos (1984). The first regarded customer
satisfaction as a gap between customers’ expectations and their perceptions of a product
or service’s performance, whereas the second considered customer satisfaction as ‘an
outcome of the actual quality of performance and its perception by consumers’ (Kozak
and Rimmington, 1999, p. 261).
Both above schools of thought, however, have received a considerable amount of
criticism. One major shortcoming of the expectation– perception approach is that
customer’s retrospective expectation may be altered by the receipt of further information
on the product or service in question, leading to the difficulty on measuring his/her

31
actual repurchase expectation (Yuksel and Yuksel, 2001). In contrast, the absence of the
expectation variable in the performance-only model can make it ‘impossible to interpret
high levels of customer satisfaction as the results of low expectations or superior quality
of service provider’ (Fuchs and Weiermair, 2004, p. 215). Measuring expectations offers
additional information to determine the optimum level of performance that can be used
as a benchmark to enhance the service quality (Ekinci, 2002). The expectation
perception concept was additionally developed as the expectancy–disconfirmation
model by Oliver (1980) with four elements: expectation, perceived performance,
disconfirmation and satisfaction. The author assumed that consumers have expectations
of a product or service before purchasing it, and then compared its actual performance
with those expectations. If their expectations are exceeded, positive disconfirmation is
achieved, leading to consumer satisfaction and willingness to purchase, and vice versa.
Because of this reason, the choice of using expectation-perception or performance-only
approach to measure customer satisfaction is still debated.
Service quality has been generally accepted as one of the factors affecting tourist
satisfaction (Heung et al., 2002; Baloglu et al., 2003; Chan, 2004; Kuo et al., 2013). For
example, a research of Heung et al. (2002) in Hong Kong’s restaurants on tourist
perceptions of service factors and their impacts on tourist satisfaction showed that
employee attributes, reliability, and physical features are significant factors contributing
to overall satisfaction. In addition, when investigating the effect of tour services on
customer satisfaction in package tours, Chan (2004) proposed a model that included two
constructs; those are satisfaction with tour service and satisfaction with tour experience.
The results of this study proved satisfaction with tour service was driven largely by tour
guide service, leisure activities, and food; while satisfaction with tour experience was
primarily determined by tour guide service, leisure activities, and shopping.
In the Vietnamese context, few researchers have focused on tourist satisfaction (Truong
and Foster, 2006; Truong and King, 2009). By using a holiday satisfaction (HOLSAT)
model, Truong and Foster (2006) measured the Australian tourists’ satisfaction on their
holiday experience at Vietnam, but not the satisfaction with a specific service provider
(e.g. tour guide service). Another research of Truong and King (2009) also aimed to

32
evaluate the satisfaction levels among Chinese tourists in Vietnam on tourism products
in general. Because of this reason, it can be said that there is no research focusing on
tourist satisfaction on a specific service in Vietnam, leading to the difficulty and debate
for researchers when choosing the appropriate methods and models (e.g. SERVQUAL or
SERVPERF sale, expectation-perception or performance-only model) to assess the
tourist satisfaction on tour guide performance.
2.4.3 Tour guide performance and tourist satisfaction
Relating to the relationship between the role of tour guide and tourist satisfaction, there
is disagreement about the impact of tour guide performance on tourist satisfaction. Geva
and Goldman (1991) investigated 15 guided tours from Israel to Europe and the United
States, and found that in most cases tour guide performance did not significantly affect
customers’ satisfaction with the tour. Their findings contradict expectations because it is
widely recognized that tour guides have responsibilities to customize the tour to
individual needs and preferences, and hence, they are highly responsible for achieving
tourist satisfaction. In contrast, Mossberg (1995) found that performance of tour guides
during service affects tourist perceptions of the tour. In addition, Wong (2001) surveyed
international tourists’ satisfaction with services provided by local tour guides in Hong
Kong and found that international tourists are generally satisfied with the local guides in
terms of professional skills, customer relationship/empathy, and communication. Huang
et al. (2010) in their research about the role of tour guide on domestic and foreign
tourists’ satisfaction in China also stated that tour guide performance is one of the most
important factors affecting the satisfaction of clients, especially foreigners, in a package
tour. In their research, reviewing relevant literature and focus group interviewing were
employed to identify and measure the skills/attributes of tour guide performance. At the
same time, after analyzing the three factors affecting the service quality of tour guide
profession in Macau, including core service delivery, customer orientation, and
communication effectiveness, Mak et al. (2010) concluded that tour guide is one of the
most visible and critical players in the tourism industry, especially for sustainable
development. Later, Mak et al. (2011) also identified six critical issues affecting the

33
service quality and professionalism of tour guide in Hong Kong and Macau, including
unhealthy tourism business practices, low tour fare versus guiding quality, recognition of
the importance of tour guide, income and training for tour guide, human resource issues
and role conflict of tour guide. Both of these two research conducted semi-structured in-
depth interviews with representatives of tour guide associations, monitoring authorities,
government officials, tour operators, and selected practicing tour guides in Hong Kong
and Macau, in order to identify the skills of tour guide as well as their measurements.
Recently, by reviewing previous and relevant literature, Weiler and Walker (2014)
affirmed the role of tour guide and stated that the communication skill of tour guides
enhanced the guided tour experience as well as the tourists’ expectation.
Previous research looked at the factors of tour guide performance that affect the
experience of tourists in package tour. For example, Yu et al. (2002) offered a
theoretical framework to examine tour guide’s role of intercultural communication and
mediation. They suggested that tour guide’s intercultural competence affects tourist
satisfaction with quality of intercultural travel experience. Furthermore, Wang et al.
(2000) showed the critical technique to study service features in group package tours.
The authors identified a hierarchical structure of critical service features that included 9
sectors and 25 subsectors (see Table A0.2 in Appendix 5). In each subsector, tourists’
narratives of their satisfying or unsatisfactory experiences regarding tour guide
performance are clarified. The result of this research also proposed clearly information
on tourists’ perception of tour guide performance as well as how tour guide performance
influences tourist satisfaction. Lately, a research by Weiler and Yu (2007) suggested that
as a cultural mediator, a tour guide has to perform a number of roles relating to three
specific dimensions: the mediation of access, understanding, and encounters. Among
them, the mediation of understanding contributes most to the generation of a memorable
tour experience. In agreement with this, Weiler and Walker (2014) raised the
performance of tour guides when implying their roles of mediator and experience broker
in a package tour. It is also noted that in most research, tour guide performance was
assessed by tourists’ evaluation.

34
In the Vietnamese context, there is limited research on tourism industry, none of which
has been found to examine the role of the tour guide or the relationship between tour
guide performance and tourist satisfaction. Without substantive research results
regarding tour guide performance and service quality, tourism companies are less
confident in regulating tour guide practices and ensuring tour guide performance in
order to deliver the best quality service to their customers. In order to fill this gap, this
thesis aims partly at assessing the role of tour guides in Vietnam through their
performance.
2.4.4 Destination loyalty
Customer satisfaction is considered as an essential business goal because it is assumed
that satisfied customers are more likely to be repeat customers. Ideally, organizations
should attempt to go beyond simply satisfying customers and build customer loyalty.
According to Taylor (1998, p.41), the two factors that measure customer loyalty are
‘likelihood to repurchase the product of service’ and ‘likelihood to recommend a product
or service to others’. Some studies have said that a 5% increase in customer retention
can generate a growth in profit of 25-95% across a range of industries (Reichheld and
Sasser, 1990; Reichheld, 1996). In addition, loyal customers are more likely to act as
free word-of-mouth advertising agents that can bring networks of friends, relatives and
other potential customers to a product or service informally (Shoemaker and Lewis,
1999). Reichheld and Sasser (1990) asserted that word-of-mouth transfer might account
for up to 60% of sales to new customers. Therefore, loyalty becomes a fundamental
strategic component for organizations and businesses. Obviously, the more satisfied the
customers are, the more likely they are to repurchase the product or service as well as to
encourage others to become customers. In order to retain customers, organization must
try to satisfy them, but a further and more significant objective must be considered, that
is establishing customer loyalty (Cronin et al., 2000; Petrick et al., 2001; Chen and Chen,
2010; Kumar et al., 2013).
In the travel and tourism context, many authors agreed that tourist satisfaction with
travel experiences contributes to destination loyalty (Bramwell, 1998; Oppermann,
35
2000; Alexandris et al., 2006; Faullant et al., 2008; Truong and King, 2009; XiaoXia et
al., 2013). Specifically, the degree of tourist’s loyalty to a destination could be reflected
in his/her intention to revisit the destination as well as his/her willingness to recommend
it (Oppermann, 2000; Um et al., 2006; Sun et al., 2013). The satisfaction of tourists
created by tourism destination could produce repeat visits and positive word-of-mouth
effects to friends and/or relatives. Although many authors agreed that recommendations
by previous visit also can be taken as the most reliable information sources for potential
tourists (Truong and King, 2009; Chen and Lin, 2012; Sun et al., 2013), there are some
arguments about the destination loyalty in terms of tourists’ intention to revisit. Lehto et
al. (2004) showed that repeat vacations differ from regular product repurchases because
previous trip experiences cannot be duplicated practically. Conversely, a study of
tourists to New Zealand conducted by Oppermann (1997) revealed that first-time tourists
tend to spend more money, but stay a shorter time than repeat visitors (Liu et al., 2012).
The author also mentioned that first-time tourists tend to explore the destination
extensively while repeat visitors explore more intensively, visiting fewer places but
spending more time at each place. Furthermore, a research of Wang (2004) noted that
repeat visitors are likely to stay longer, engage in fewer activities, and be more involved
in local life-related activities than first-time visitors. Additionally, in making travel
decisions, repeat visitors appear to rely more on their own experiences than on other
information sources, therefore they spend much less time on planning (Li et al., 2008).
In particular, in terms of travel and tourism sectors, although a review of literature
exhibits an abundance of studies on tourist satisfaction, but destination loyalty has not
been thoroughly investigated. In fact, recent tourism studies have addressed and
examined the constructs of satisfaction and loyalty independently. However, studies
discussing the causal relationship between tourist satisfaction and destination loyalty are
lacking (Oppermann, 2000; Christina and Hailin, 2008; Chen and Chen, 2010; Lee et al.,
2011).
Nowadays, it is said that the number of research on tourism industry has been increasing
over years in Asia countries (Leung et al., 2011). Research of Jogaratnam et al. (2005)
indicated that Asian research output on tourism had grown noticeably over the earlier

36
period, with the region becoming one of the world’s top three contributors, accounting
about 15% of all articles published in the leading tourism and hospitality journals from
2002–2006. Severt et al. (2009) also affirmed that the Asian region now has the fastest
growth rate of contribution in tourism studies. Along with mainland China in the region,
Hong Kong with its comfortable combination of a Western lifestyle and Chinese
traditions, gives it advantages in drawing research talent from around the world (Law
and Cheung, 2008). Taiwan, in addition, in line with the expansion of tourism industry
and economic development in recent years and its greater emphasis on tourism
education, has also been successful in this regard (Kim et al., 2006). However, the
number of studies on tourism in other countries, like the Southeast Asia area, is still
lacking. The result from a study of Leung et al. (2011) affirmed there was little research
on tourism conducted in Thailand, Malaysia, Indonesia, and Singapore. The reason
mostly comes from the fact that English is not the first or the common language of many
Asian countries, which may affect the quality of published papers and increase
communication difficulty. Furthermore, most research on tourism in all countries as well
as in Asian region concentrates on hotel and restaurant administration, economics,
cultural/heritage study, parks and recreation, and sociology disciplines (Cheng et al.,
2011). This leads to the scarcity of research on tourism management discipline, for
example, the specific factors affect tourist satisfaction, or the relationship between
tourist satisfaction and destination loyalty.
In Vietnamese context, examination of the influence of tourist satisfaction with specific
attributes on repeat visit to Vietnam has only been conducted in a single study by
Truong and King (2009). Moreover, with a red alert that 80% – 85% of international
tourists do not intend to revisit Vietnam during the period 2007-2012 (Thu, 2012), it is
reasonably needed to conduct more studies on the relationship between tour guide
performance and tourist satisfaction as well as between tourist satisfaction on tour guide
and their loyalty, in order to have greater knowledge of this issue and to understand the
role of tourist satisfaction in developing loyalty.

37
2.5 Research model, research questions and hypotheses
According to Huang et al. (2010) in their research about tour guide’s role in Shanghai –
China, there are two dimensions of tour guide performance for both domestic and
foreign tourists; those are intrapersonal servability, and interpersonal servability and
organizational skills. Intrapersonal servability includes knowledge, personality, empathy,
passion, attitude, and health condition; while interpersonal servability and organizational
skills consist of interpersonal skills and organization, professional competence, and
problem solving skill.
Furthermore, according to Bowie and Chang (2005)’s research on tourist satisfaction
with guided package tours, it is said that there are 8 factors influenced tourist satisfaction,
including transport delays, problems with foreign languages, personal safety and health,
relationships with fellow tourists, failure of accommodation service, performance of
service staff, unfamiliar customs and foods, and difficulties over money. Among those,
there are some factors related to tour guide performance, for example, problems with
languages and relationship with fellow tourists. On the other hand, the authors also
found that tour guide performance, specifically in terms of service attitude and
interpretation skills, plays an important role in order to achieve success of a guided
package tour.
The research of Zhang and Chow (2004) stated that there are 20 service quality
attributes of a tour guide had a mean score. The top five most important attributes are
‘punctual’, ‘able to solve problems’, ‘knowledge of destination’, ‘honest and
trustworthy’, and ‘inform safety regulation’. The remaining attributes like ‘polite’,
‘respect customers’, ‘appear neat and tidy’, ‘always available for help’, etc. can be
possibly sorted into the two categories including intrapersonal and interpersonal
servabilities that Huang et al. (2010) had conducted.
After examining the above research in terms of tour guide attributes, there are a number
of attributs affecting the tour guide performance. The proposed research will be based on
the two categories of intrapersonal servability, interpersonal servability and
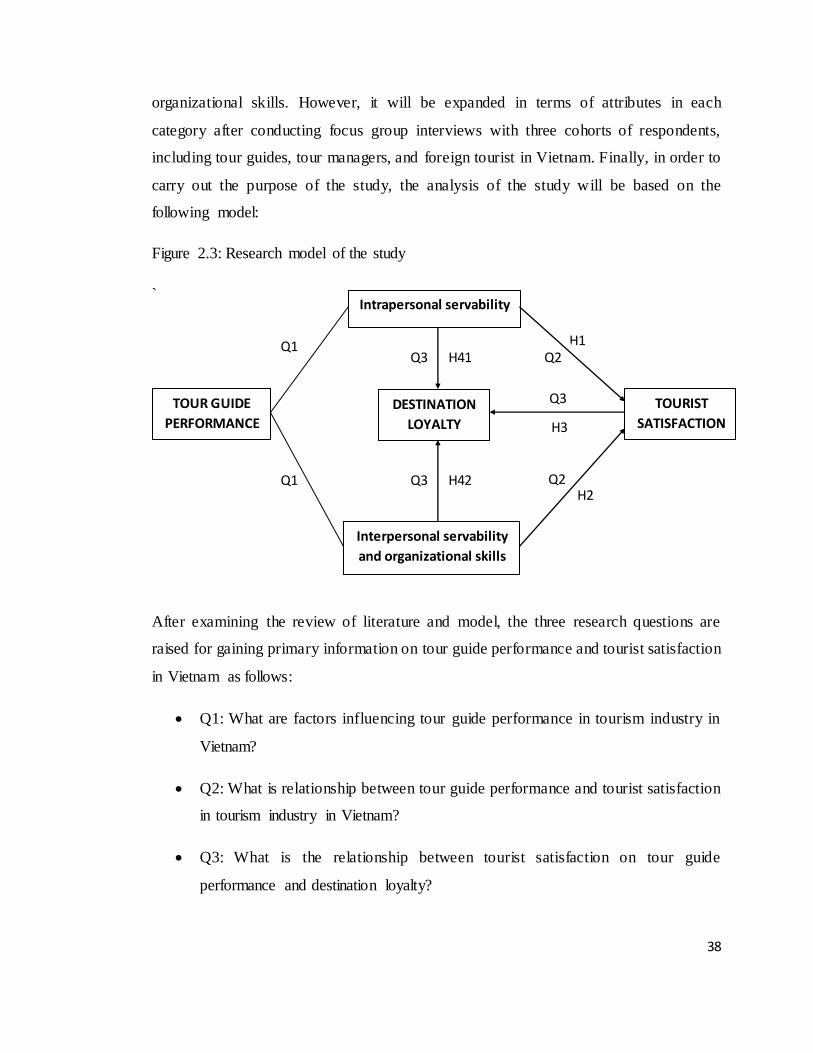
38
Intrapersonal servability
Interpersonal servability
and organizational skills
TOUR GUIDE
PERFORMANCE
TOURIST
SATISFACTION
H2
H1
H3
DESTINATION
LOYALTY
H41 Q2 Q1
Q3
H42 Q1 Q2
Q3
Q3
organizational skills. However, it will be expanded in terms of attributes in each
category after conducting focus group interviews with three cohorts of respondents,
including tour guides, tour managers, and foreign tourist in Vietnam. Finally, in order to
carry out the purpose of the study, the analysis of the study will be based on the
following model:
Figure 2.3: Research model of the study
`
After examining the review of literature and model, the three research questions are
raised for gaining primary information on tour guide performance and tourist satisfaction
in Vietnam as follows:
Q1: What are factors influencing tour guide performance in tourism industry in
Vietnam?
Q2: What is relationship between tour guide performance and tourist satisfaction
in tourism industry in Vietnam?
Q3: What is the relationship between tourist satisfaction on tour guide
performance and destination loyalty?

39
To assist in answering the above research questions as illustrated in the figure, the
following five hypotheses are proposed:
H1: Higher level of intrapersonal servability of tour guide is positively associated
with higher level of tourist satisfaction.
H2: Higher level of interpersonal servability and organizational skills of tour
guide is positively associated with higher level of tourist satisfaction.
H3: Higher level of tourist satisfaction is positively associated with higher level
of destination loyalty
H41: Higher level of intrapersonal servability of tour guide is positively
associated with higher level of destination loyalty
H42: Higher level of interpersonal servability and organizational skills of tour
guide is positively associated with higher level of destination loyalty
2.6 Conclusion
This chapter firstly explored the issues of human resource management in tourism
industry at a whole, and then provided the literature on tour guide, service performance,
tourist satisfaction, and destination loyalty in order to identify the research model and
confirm the research questions. The previous discussion has confirmed the importance
of tour guide performance on tourist satisfaction and destination loyalty. Two
components, namely intrapersonal servability, and interpersonal servability and
organizational skills, are considered to make up tour guide performance. Five
hypotheses were also raised based on the literature and existing research. The
methodology utilized to test this theoretical model is presented in the following chapter.

40
CHAPTER 3
RESEARCH METHODOLOGY
3.1 Introduction
While there has been extensive research on the tourism industry as well as tourist
satisfaction, one principal omission from most previous research has been an absence of
a clear understanding about the effect of tour guide performance on tourist satisfaction.
An important contribution of this research, therefore, is the development of a
methodology to provide an appropriate way to examine this effect. In other words, it is
significant to have an overall approach to the research process from the theoretical
aspect to the collection and analysis of the data (Hussey and Hussey, 1997). The purpose
of this chapter is to discuss the research methodology used in this project to show how
various considerations have shaped the methodology adopted, and to outline some of the
implications for the result of the study.
3.2 Design of the research
The design of the research methodology has a considerable influence upon the nature
and quality of research outputs since it influences both the validity of the results and the
extent to which the results can be generalized to other settings. The primary decisions
involved in the research design of this study were whether to adopt qualitative or
quantitative research, whether to conduct exploratory or confirmatory approach, and
whether to carry out a longitudinal or cross-sectional survey to collect the data.
3.2.1 Qualitative research, quantitative research or combination of both
Quantitative research is a methodology that ‘seeks to quantify the data’ and ‘applies
some form of statistical analysis’, while qualitative research is ‘an unstructured,
exploratory research methodology based on small samples that provides insights and
understanding of the problem setting’ (Malhotra, 2004, p.137). Quantitative method, in

41
this study, plays a significant role to examine the relationship between the tour guide
performance and foreign tourists’ satisfaction and destination loyalty in the Vietnamese
context. The Vietnamese context may vary from other contexts like China, Hong Kong,
and Taiwan in which other research has been undertaken due to differences in culture,
economy, and policies.
The qualitative analysis is exploratory in nature, designed to better understand the issues
associated with tour guide performance, and then to guide the design of the primary
stage of the research. In this kind of study, focus group interviews are often undertaken.
The purpose of using a focus group is to gain insights by listening to a group of people
talk about issues to the researcher, and the value comes from the unexpected findings
often obtained from a free-flowing group discussion (Malhotra, 2004). According to the
previous studies, there are many factors that affect tour guide performance. However,
not all of them can be applied in the Vietnamese context. Therefore, a focus group
interview is a reasonable method to determine the appropriate factors to apply to the
tourism industry in Vietnam, and qualitative research is needed for this study.
Furthermore, it is suggested that mixed method research is primarily quantitative or
qualitative in design, but it incorporates some elements or strategies of other approaches
within the same study (Morse, 2005). According to Hurmerinta and Nummela (2006),
there are three reasons that lead to the use of a mixed method approach. First, mixed
methods may be instrumental, in that the qualitative portion facilitates the quantitative
portion, or vice versa. Second, mixed methods can be used to improve the validity of the
research. And finally, this approach may show an expectation that a deeper
understanding of the research subject can be achieved.
Because of the above reasons, this study used a mixed-method research approach,
incorporating both qualitative and quantitative research. The first stage of the research
was qualitative utilizing focus group interviews while the second stage employed the
quantitative approach of a survey.
Hair et al. (2006) stated that a focus group involves a small group of respondents in an
interactive and spontaneous discussion with a moderator to guide the group’s discussion.

42
Normally, the preferred size for a focus group is from 8 to 12 participants (Malhotra,
2004; Hair et al., 2006), in order to have sufficient participants to generate discussion
without the group becoming unmanageable. Moreover, according to Malhotra and
Peterson (2006), convenience samples are useful in exploratory research where the
objective is to generate ideas, gain insights or develop hypotheses. They can be used for
focus groups, pretesting questionnaires or pilot studies. Because of this reason,
convenience sampling will be used for recruiting focus group respondents in this
research.
The questionnaire in quantitative research step consisted of five sections, where section
1 is intrapersonal servability of tour guide; section 2 is interpersonal servability and
organizational skills of tour guide; section 3 is tourist satisfaction with the tour guide
performance of a tour; section 4 is destination loyalty of tourist; and section 5 is
demographic profile of respondents. A 5-point Likert-type scale where 1 = strongly
disagree and 5 = strongly agree was employed to assess respondents’ ratings on the
performance of tour guides as well as tourists’ satisfaction with a package tour and their
destination loyalty. The questionnaire was prepared in English before carrying out pilot
test. Once pilot test was completed, the official questionnaire will be used for main
survey after revision.
3.2.2 Exploratory research, confirmatory research or combination of both
In general, there are three alternative choices in selecting the research approach. They
are exploratory research, confirmatory research, or a combination of both (Cohen and
Manion 1994). Exploratory research is conducted when there are very few or no earlier
studies that a researcher can refer to for information about the problem or issue (Hussey
and Hussey, 1997). The aim of this research is to look for patterns, ideas or hypotheses,
rather than testing or confirming a hypothesis. Confirmatory research, on the other hand,
is conducted when there is previous theory (or theories) to which a researcher can refer
for information about the problem or issue (Hussey and Hussey, 1997). The aim of this
research is to find out if the theory is supported by the facts. The starting point for
confirmatory research is a theory that the researcher narrows the focus to increasingly

43
specific hypotheses and observations, which address those hypotheses. Finally, the
researcher tests the final hypotheses with specific empirical data in order to confirm or
reject the original theory. However, a researcher may also use both exploratory and
confirmatory research at the same time, an approach refer to as a mixed methods
approach (Glaser, 1992). This research was classified as a part exploratory as well as a
part of confirmatory for two reasons.
First, this research conducted exploratory research because the first objective of the
study is to identify factors that affect tour guide performance in a package tour. This
research area is a little studied territory as there are only a few previous research reports
focused on this (Zhang and Chow, 2004; Huang et al., 2010). This previous research,
moreover, was conducted only in the context of China and its territories, and it might not
be applicable for the others like Vietnam. Most of finding of these studies indicated the
affect of tour guide to tourist satisfaction, but none of them reported on the loyalty of
tourists based on their satisfaction. In terms of exploratory part of this research, the
focus is on gaining insights and familiarity with the role of tour guide on foreign tourist
satisfaction.
Second, this research was part of confirmatory research because the second objective of
the study is to examine the effects of tour guide performance on tourist satisfaction,
together with the effects of tourist satisfaction on tourist loyalty. Five hypotheses were
developed to achieve the second objective of this research (see Chapter 2). The five
hypotheses were based on the theories found in previous research (Zhang and Chow,
2004; Christina and Hailin, 2008; Huang et al., 2010). The aim of this objective is to
investigate if the theories are supported by empirical data.
3.2.3 The use of exploratory factor analysis, confirmatory factor analysis,
and structural equation modeling
Researchers, in many cases, are interested in variables that cannot be directly observed,
such as achievement, intelligence, or beliefs. They use terms such as latent variables or
factors to describe unobserved variables. As a result, factor analysis, including

44
exploratory, confirmatory, and structural equation modeling are statistical techniques
that researchers can use to reduce the number of observed variables into a smaller
number of latent variables by examining the covariation among the observed variables
(Schreiber et al., 2006).
In exploratory factor analysis (EFA) the researcher has a large set of variables and
hypotheses that the observed variables may be linked together; however, the researcher
does not know the exact nature of the structure. Because of this reason, the purpose of an
EFA is to uncover this structure (Ullman, 2006). EFA in this case might determine how
many factors exist, the relationship between factors, and how the variables are
associated with the factors. In this type of analysis, various solutions are estimated with
a number of factors and types of rotation. EFA is an exploratory technique as the
researcher chooses among the solutions and selects the best one based on related theories.
For this reason, this research will employ EFA because one of the purposes of the study
is to determine the factors of tour guide that affect foreign tourist satisfaction.
Technically, before conducting the factor analysis and subsequent reliability testing, all
negatively worded items were coded to ensure that all statement responses were in the
same direction. Common factor analysis via principal axis factoring was applied in this
research instead of principal component analysis because this method identifies the
latent dimensions represented in the original variables (Hair et al., 1995). In addition,
promax rotation was also used due to its accuracy when reflecting the underlying
structure of the data better than other methods, such as varimax rotation (Gerbing and
Anderson, 1988).
In confirmatory factor analysis (CFA) the researcher has a strong idea and knowledge
about the number of factors, the relations among the factors, and the relationship
between the factors and measured variables. Based on theories and/or empirical research,
the goal of the analysis is to postulate relations between the observed measures and
underlying factors and then to test competing theoretical models about the structure
(Byrne, 2005; Ullman, 2006). This study, therefore, will use CFA in order to investigate
the relationship between tour guide performance and tourist satisfaction as well as

45
tourist satisfaction on tour guide performance and tourist loyalty based on the existing
theories in the research of Zhang and Chow (2004) and Huang et al. (2010).
The overall fit of the model is used in CFA as the necessary and sufficient standard to
examine whether a set of measurement items is unidimensional (Kumar and Dillon,
1987; Steenkamp and Van Trijp, 1991). The chi-square statistic is the most common
index of overall fit (Hair et al., 1995; Hoyle, 1995). However, this criterion in CFA is
highly sensitive to sample size. In the case of large sample sizes (commonly above 200),
a significant chi-square is likely to be found for any specification model (Hair et al.,
1995). Therefore, an acceptable fit of the model to the data is achieved with either a non-
significant chi-square value, which is suggestive of a p-value greater than or equal .05
(Bagozzi and Foxall, 1996), or if other indices, such as comparative fit index (CFI),
incremental fit index (IFI), Tucker-Lewis index (TLI), and goodness-of- fit index (GFI)
are satisfied. Another common measure of fit is Root Mean Square Error of
Approximation (RMSEA) (Steiger and Lind, 1980). Bryne (1989) also stated RMSEA as
one of the most informative criteria in structural equation modeling because it takes into
account the error of approximation in the population.
For a long time, structural equation modeling (SEM) has become one of the most useful
and popular forms of analysis used to address many problems in social sciences
(Baumgarther and Homburg, 1996). One of the advantages of using SEM to test a
theoretical model is allowing researchers to explicitly accommodate measurement errors
as well as incorporate abstract and unobservable constructs. On the other hand, SEM not
only combines theory and data but also confronts theory with data (Fornell, 1982). SEM
can also be used to assess the best fitting model in order to optimize the theoretical
model with existing data. Furthermore, SEM provides and tests multiple interrelated
dependence relationships in a single model that cannot be done by other multivariable
techniques (Hair et al., 1995). More specifically, unlike other statistical tools such as
regression, SEM also allows researchers to identify interrelated relationships in a single,
systematic and comprehensive analysis by modeling relationships among multiple
independent and dependent constructs simultaneously (Anderson and Gerbing, 1988).

46
In this study, SEM is selected as the tool to assess and test the proposed relationships in
the theoretical model defined in Chapter 2 by following the two-step approach suggested
by Anderson and Gerbing (1988). The two-step approach in SEM requires the
measurement model to be estimated before conducting the simultaneous estimation of
the measurement model and the structural model (Anderson and Gerbing, 1988). This
approach implies that reliability and validity of measurements are requirements for
theory testing. According to Anderson and Gerbing (1988), Bagozzi (1994), and Kline
(1998), every measurement model must be based on theory. Hence, a structural model
can be tested only if the measures of the constructs used in the model have been tested
for a satisfactory level of validity.
3.3 Design of measures
In order to design the measure of tour guide performance, focus group interviews were
firstly generated. Focus group interviews were considered as an appropriate method for
data collection because they allowed for authenticity and variety in participant responses,
stimulate discussion between participants, enable verbal and non-verbal information to
be collected (Bouma, 2001). In addition, focus group interviews are cost effective when
collecting a number of appropriate participants at the same time.
Following the methods of Beck et al. (1986), the focus group interviews in this study
took place in a non-threatening environment outside of work hours. Three focus group
interviews with three cohorts including tour guides, foreign tourists, and tour managers
were conducted in the study. The interviews were audio-taped by the author on the main
themes that arose as a result of the discussion, interactions and dynamics of the group
(Brodigan, 1992). During the discussions, notes were also taken and mind maps were
produced to facilitate the analysis of the data (Dey, 1993). At the conclusion of each
discussion on tour guide performance, a short evaluation questionnaire was distributed
to all participants in order to get feedback about their experiences of being a member of
the focus group. In this research, all participants agreed that the venue and moderator
were good. Additionally, the fuller description of the data collection instruments,

47
including participant consent form, participant information sheet, focus group interview
proforma, and questionnaire, are provided in Appendices 1-4.
The results of focus group interviews showed that there are four main constructs in the
theoretical model, including (1) intrapersonal servability; (2) interpersonal servability
and organizational skills; (3) tourist satisfaction; and (4) destination loyalty of tourist.
The following section reviews the measurement of these constructs in previous studies
and proposes the instrument for the study.
3.3.1 Intrapersonal servability of tour guide
As discussed in Chapter 2 and based on existing research of Leclerc and Martin (2004),
Zhang and Chow (2004), Heung (2008), Huang et al. (2010), and Chang (2014),
intrapersonal servability of tour guide is proposed as a construct comprising three
components, including appearance, work attitude, and communication skill.
3.3.1.1 Appearance
Extracted from research of Zhang and Chow (2004) and Huang et al. (2010), appearance
of tour guide, denoted as ‘app’, might be understood as the exterior and characteristics
of tour guide that can be seen at some of the first times when tourists meet a tour guide.
Huang et al. (2010) implied the appearance of tour guide using Chinese sample was
measured by personality, health condition, and friendliness. However, in terms of
foreign sample, the honesty and the politeness of tour guide were deleted out of the
measure by the researchers. More recently, the appearance of tour guide, again, had been
applied to the research of Chang (2014) on tour guide performance in Taiwan. In his
research, personal appearance of tour guide was measured by the politeness and the neat
appearance of tour guide. Therefore, in this research, appearance of tour guide is
evaluated by six items (Table 3.1). Each item was measured by a five-point Likert-type
scale anchored by: 1: strongly disagree and 5: strongly agree.
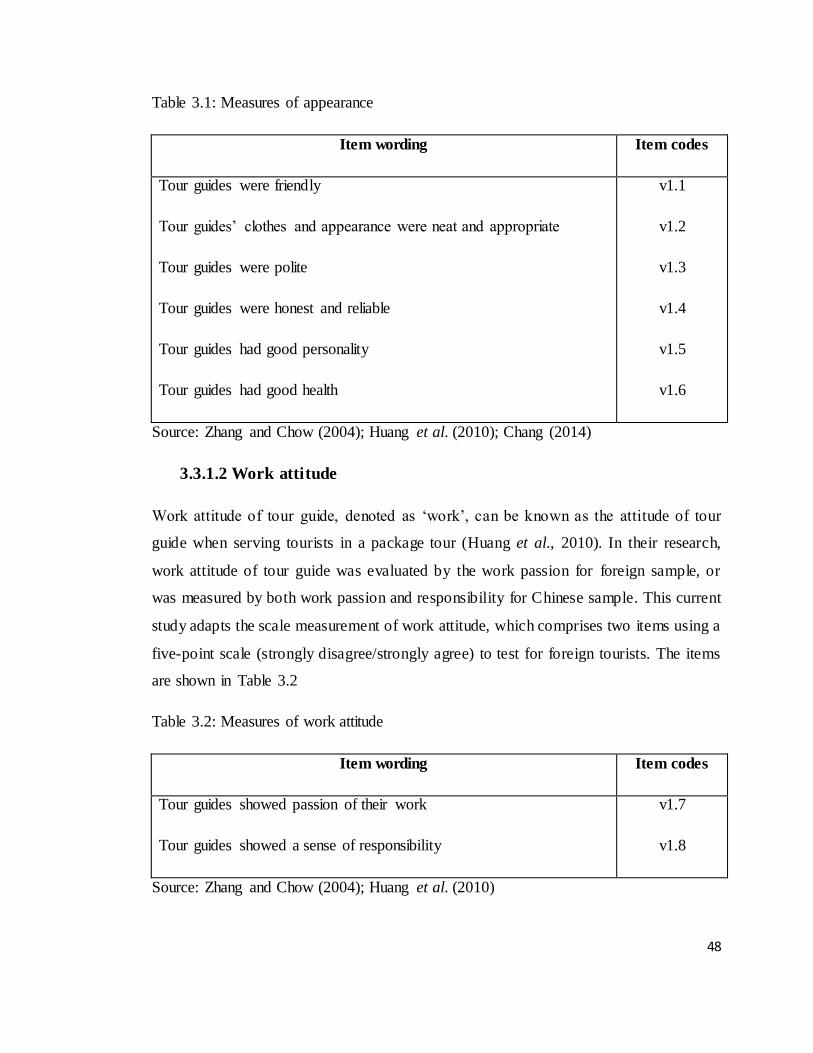
48
Table 3.1: Measures of appearance
Item wording Item codes
Tour guides were friendly
Tour guides’ clothes and appearance were neat and appropriate
Tour guides were polite
Tour guides were honest and reliable
Tour guides had good personality
Tour guides had good health
v1.1
v1.2
v1.3
v1.4
v1.5
v1.6
Source: Zhang and Chow (2004); Huang et al. (2010); Chang (2014)
3.3.1.2 Work attitude
Work attitude of tour guide, denoted as ‘work’, can be known as the attitude of tour
guide when serving tourists in a package tour (Huang et al., 2010). In their research,
work attitude of tour guide was evaluated by the work passion for foreign sample, or
was measured by both work passion and responsibility for Chinese sample. This current
study adapts the scale measurement of work attitude, which comprises two items using a
five-point scale (strongly disagree/strongly agree) to test for foreign tourists. The items
are shown in Table 3.2
Table 3.2: Measures of work attitude
Item wording Item codes
Tour guides showed passion of their work
Tour guides showed a sense of responsibility
v1.7
v1.8
Source: Zhang and Chow (2004); Huang et al. (2010)

49
3.3.1.3 Communication skill
Communication skill, denoted as ‘com’, is the skill of tour guide when communicating
and working with foreign customers (Leclerc and Martin, 2004; Zhang and Chow, 2004;
Chang, 2014). A research of Zhang and Chow (2004) in Hong Kong showed that
communication skill of tour guide was measured by the communication ability in
Mandarin/Cantonese and presentation skill of tour guide. This measure, again, was used
to evaluate the presentation and communication skill of tour leader and tour guide in the
context of China in the research of Heung (2008), as well as in the context of Taiwan in
the research of Chang (2014). Because of this reason, in this research communication
skill is measured by the language ability and the communication ability of tour guides as
shown in Table 3.3.
Table 3.3: Measures of communication skill
Item wording Item codes
Tour guides were fluent in the language of the tour group
Tour guides were good at communication
v1.9
v1.10
Source: Zhang and Chow (2004); Heung (2008); Chang (2014)
3.3.2 Interpersonal servability and organizational skills of tour guide
Existing research of Zhang and Chow (2004), Huang et al. (2010), and Mak et al. (2011)
as well as the conducted focus group interviews of this study implied that the
interpersonal servability and organizational skills of tour guide comprises seven
components, including empathy, professional competence, connecting customers,
solving problems, organizational skill, environmental protection skill, and entertainment
introduction skill.

50
3.3.2.1 Empathy
Empathy skill of tour guide, denoted as ‘emp’, is the ability to recognize the normal
psychological needs of customers, as well as the willingness to help customers (Huang
et al., 2010). For a long time, for example in the research of Zhang and Chow (2004),
this component was evaluated by the availability for help from the tour guide in the
context of Hong Kong. More recently, Heung (2008) and Chang (2014) in their research
in China and Taiwan also defined empathy skill as the helpfulness of tour guide. In this
study, the scale of this component comprises three items as shown in Table 3.4.
Table 3.4: Measures of empathy
Item wording Item codes
Tour guides took good care of customers’ needs
Tour guides were able to meet psychological needs of customers
Tour guides were willing to help customers
v2.1
v2.2
v2.3
Source: Zhang and Chow (2004); Heung (2008); Huang et al. (2010); Chang (2014)
3.3.2.2 Professional competence
The professional competence on guiding service in a package tour, denoted as ‘prof’,
can be understood as the knowledge of the guide about the culture, history, and lifestyle
of destinations and customers (Huang et al., 2010). Zhang and Chow (2004) in their
research also implied the ability to inform visitors about destination’s customs as one of
the significant factors that affect the performance of tour guide. Moreover, the
knowledge about the destination was also considered as one of the important elements to
evaluate the knowledge of tour guide in the study of Chang (2014). This research,
therefore, adapts the scale measurement of professional competence with three items
using a five-point scale. The items are shown in Table 3.5.

51
Table 3.5: Measures of professional competence
Item wording Item codes
Tour guides had a knowledge of destination’s culture and history
Tour guides had knowledge of local people’s lifestyle
Tour guides understood the culture of customers they were serving
v2.4
v2.5
v2.6
Source: Zhang and Chow (2004); Huang et al. (2010); Chang (2014)
3.3.2.3 Connecting customers
Research of Zhang and Chow (2004), Mak et al. (2011), and Chang (2014) showed that
the skill of connecting tourists in a tour, denoted as ‘connect’, is one of the significant
factors of a tour guide leading to tourist satisfaction. In their research, this component
includes the skill of performing in commentary and/or the sense of humor. Furthermore,
a research of Huang et al. (2010) stated that the ability to generate rapport among
tourists was one of the items to measure the skill of connecting customers of a tour guide.
In this study, the scale measurement of this component consists of three items that
shown in Table 3.6.
Table 3.6: Measures of connecting customers
Item wording Item codes
Tour guides performed well in commentary
Tour guides had a good sense of humor
Tour guides were able to generate rapport among tour’s members
v2.7
v2.8
v2.9
Source: Zhang and Chow (2004); Huang et al. (2010); Mak et al. (2011); Chang (2014)

52
3.3.2.4 Solving problems
In general, the skill of solving problems of tour guide in a package tour, denoted as
‘solv’, is measured by the ability to solve problems as stated in the research of Zhang
and Chow (2004), Heung (2008), and Chang (2014). However, Huang et al. (2010)
raised some more elements related to the skill of solving problems, including the ability
to handle complaints and unexpected incidents, and the ability to reconcile arguments
related to history. Because of this reason, this study employs the scale measurement of
the component that consists of five items (Table 3.7).
Table 3.7: Measures of solving problems
Item wording Item
codes
Tour guides were able to handle customers’ complaints
Tour guides were flexible in solving any problems and conflicts in the tour
Tour guides were able to cope with unexpected and urgent incidents
Tour guides were able to reconcile historical arguments among customers
Tour guides showed sound judgment in historical arguments with customers
v2.10
v2.11
v2.12
v2.13
v2.14
Source: Huang et al. (2010)
3.3.2.5 Organizational skill
Zhang and Chow (2004) in their research showed that organizational skill, denoted as
‘org’, can be measured by the skill of paying attention to detail during the tour. This
perception again was applied to a research of Heung (2008) on tour leader attributes in
the context of China. Additionally, Chang (2014) included the skill of arrangement of all
the services promised on the itinerary of tour guide in order to measure the
organizational skill of tour guide performance. More specifically, according to Huang et
al. (2010), organizational skills of the tour guide are the skills of time management in a

53
tour, the cooperation with other staff, and the organization of activities in a tour. In this
study, this component is measured by the following items shown in Table 3.8.
Table 3.8: Measures of organizational skills
Item wording Item codes
Tour guides followed the itinerary and schedule
Tour guides were good at time management
Tour guides were able to organize activities in a tour
Tour guides were able to cooperate with other staff (e.g., driver)
v2.15
v2.16
v2.17
v2.18
Source: Huang et al. (2010)
3.3.2.6 Environmental protection skill
Environmental protection skill, denoted as ‘envi’, is the factor that Zhang and Chow
(2004) implied in their research on the role of tour guide. It can be measured by the
ability to inform safety regulations. In agreement with this, Heung (2008) stated that the
skill of providing clear information on safety and security is one of significant attributes
of a tour leader in terms of environmental protection skill. However, in the context of
Vietnam, with the conducted focus group interviews of this study, environmental
protection skill is also evaluated by the knowledge to keep environmental clean and the
skill of keeping reminding customers of environmental issues. The measure therefore
consists of three items that shown in Table 3.9.

54
Table 3.9: Measures of environmental protection skill
Item wording Item codes
Tour guides had knowledge to keep environment clean during a tour
Tour guides kept reminding tourists of environmental protection issues
Tour guides kept reminding tourists of safety issues
v2.19
v2.20
v2.21
Source: Zhang and Chow (2004); Heung (2008); and extracted from focus group
interviews by the author
3.3.2.7 Entertainment introduction skill
Entertainment introduction skill, denoted as ‘intro’, is the tour guide’s introduction skill
to tourists about the interesting places in the country for sightseeing, for shopping, and
for eating and drinking. Both Zhang and Chow (2004) and Huang et al. (2010) agreed
that the ability to introduce reliable shops to tourists is important. However, the
conducted focus group interviews of this study also showed that the entertainment
introduction skill can be measured by other components, such as the ability to
introduced restaurants, traditional and special products, and the skill to introduce
interesting entertainment places to customers. As a result, there are five items to evaluate
entertainment introduction skill of tour guide (Table 3.10).

55
Table 3.10: Measures of entertainment introduction skill
Item wording Item
codes
Tour guides introduced restaurants with tasty foods to customers
Tour guides introduced Vietnamese traditional and original foods to customers
Tour guides introduced interesting entertainment places to tourists (e.g.,
casino)
Tour guides introduced Vietnamese traditional or special products to
customers
Tour guides introduced reliable shops to customers
v2.22
v2.23
v2.24
v2.25
v2.26
Source: Zhang and Chow (2004); Huang et al. (2010); and extracted from focus group
interviews by the author
3.3.3 Tourist satisfaction
Oliver (1993, p. 421) defined satisfaction as ‘the consumer’s subjective satisfaction
judgment resulting from observations of attribute performance’. As proposed in their
model, Huang et al. (2010) implied that tourist satisfaction can be measured by the
satisfaction with guiding service, tour service, and the overall tour experience. This
concept was also approved by many authors, including Chan (2004) in his research in
China; Truong and King (2009) in their search in Vietnam; and Ozdemir et al. (2012) in
their research in Turkey. Therefore the measure of tourist satisfaction in this study
includes three items as shown in Table 3.11.

56
Table 3.11: Measures of tourist satisfaction
Item wording Item codes
I was satisfied with guiding service
I was satisfied with tour services
I was satisfied with the overall tour experience
v3.1
v3.2
v3.3
Source: Chan (2004), Truong and King (2009); Huang et al. (2010); Ozdemir et al.
(2012)
3.3.4 Destination loyalty of tourist
Many researchers agreed destination loyalty is significant factor that influenced tourist
satisfaction. This factor is evaluated by intention to revisit and word-of mouth effects to
others of tourists, as well as the willingness to stay longer to travel if tourists have a
chance in the future (Oppermann, 2000; Um et al., 2006; Sun et al., 2013). Therefore,
destination loyalty will be measured by three items that shown in Table 3.12.
Table 3.12: Measures of destination loyalty of tourist
Item wording Item codes
I am willing to revisit Vietnam for tourism in the future
If I have a chance to come to Vietnam in a business trip, I will stay
longer to travel
I am willing to recommend others to travel to Vietnam
v4.1
v4.2
v4.3
Source: Oppermann (2000); Um et al. (2006); Sun et al. (2013)
Based on the above design of measures, the survey was constructed to test the
hypotheses and answer the research questions in chapter 2. The first stage of this testing
is running pilot study to revise the questionnaires before conducting the main survey.

57
3.4 Pilot study
A pilot survey was conducted by distributing 25 questionnaires to foreign tourists who
are travelling in Vietnam in package tours. It is noted that all of the constructs used in
this study have been developed and empirically tested in China and Hong Kong.
Because of this reason, it was considered that the pilot study would be useful in order to
modify measures to suit the context of Vietnam. On the other hand, another aim of using
the pilot test was to discover the reactions of respondents to the questions (e.g. unable to
understand, misunderstand, and skip the questions) (Hunt et al., 1982). The purpose of
the pilot test was to eliminate possible weaknesses and flaws in the first draft
questionnaire in order to create the final questionnaire for the main survey (Zikmund,
1997).
In the pilot study of this research, along with handing questionnaires to foreign tourists
and asking them to answer the questions, each participant was also asked in turn about
his or her interpretation of the questions. The purpose of this action was to ensure they
understood the measure of the question in the same manner for reliable responses. They
were encouraged to comment on the questionnaire critically and raised any problems
they could identify in the questions as if they were the respondents. If problems were
detected, all the participants would be encouraged to comment alternatives for handling
the identified problems. From their comments, some questions would be rephrased. In
this research, it is fortunate to say that almost the respondents understood correctly about
all the questions, except two participants who did not recognize what ‘MICE’ is due to
its abbreviation. This term therefore was revised in the official questionnaires.
3.5 Main survey
3.5.1 Sampling
In the first step, the population of the study was chosen. Population was defined as ‘the
complete set of units of analysis that are under investigation, while element is the unit
from which the necessary data is collected’ (Davis, 2000, p.220). This research focuses

58
on foreign tourists to investigate the effect of tour guide performance on tourists’
satisfaction and their destination loyalty. The empirical study is conducted in Vietnam in
order to test the theoretical model. Therefore, the population of the study is foreign
tourists who are/were traveling in a package tour in Vietnam, including Ho Chi Minh
City, Phan Thiet City, Nha Trang City, Da Nang City and Ha Noi.
The next step is to identify the sampling method to be used to select the sample for the
study. According to the methodology literature, there are two main sampling methods,
including probability and non-probability sampling (Zikmund, 2000). In this study, it is
very hard to apply probability sampling method due to the fact that there is no adequate
statistics on the number of foreign tourists in the country in a period of time, or it is
impossible to know where the foreign tourists are at the moment. Because of this reason,
non-probability sampling is conducted instead of probability sampling. Non-probability
sampling techniques, on the other hand, involve researchers drawing samples from a
larger population without requiring random selection. Henry (1990) stated that the
distinguishing character of non-probability sampling is that subjective judgment plays a
role in the selection of the sample because the researcher has greater control of the
selection process as well as to decide which units of the population to include. From the
list of non-probability sampling methods, including convenience, quota, purposive, and
snowball sampling (Tansey, 2007), convenience sampling was used to select the sample
element in this research. The decision to use this method was based on the following
analysis of the advantages and disadvantages of these four non-probability sampling
methods:
- Convenience sampling – A sampling involves the researcher selecting the most
readily available respondents, regardless of characteristics, until the required
sample size has been achieved. The advantage of this method is that there are no
strict selection rules and the sample can be drawn in whatever way is easiest and
convenient for the researcher. However, the disadvantage of this method derives
from the same feature – without any selection rules, there is no way to tell what
wider population the sample group represents or how the sample might differ
from other potential samples (Tansey, 2007).

59
- Quota sampling – A method allows the researcher seeking to ensure that certain
characteristics are present in the sample in proportion to their distribution in the
wider population. The advantage of this method is to provide the researcher with
a greater degree of certainty regarding the sample's makeup and its relationship
to the broader population of interest (Tansey, 2007). However, there are some
drawbacks to this selection method. First, the researcher must know the
population's characteristics beforehand but it is not always possible in particular.
Second, while the sample is representative of the population on the
characteristics of interest, there is no way for the researcher to be sure that it is
also representative of other characteristics that may be important (Kidder et al.,
1991).
- Purposive sampling – A selection method adapted when the purpose of study
and the researcher's knowledge of the population guide the process. If the study
requires interviewing a pre-defined and visible set of actors, the researcher may
have to identify the particular respondents of interest and sample those
considered most appropriate (Tansey, 2007). Furthermore, Kidder et al. (1991)
suggested the basic assumption is that with good judgment and an appropriate
strategy, researchers can choose the cases to be included and then develop
samples that suit their needs.
- Snowball/Chain-referral sampling – A well-known form of non-probability
sampling method conducted when the population of interest is not fully visible or
hard to collect (Babbie, 1995). This approach is commonly used in sociological
studies on hidden populations that may be involved in sensitive issues or illegal
activities (Biernacki and Waldord, 1981). The snowball sampling method entails
identifying an initial set of relevant respondents, and then requesting that they
suggest other potential subjects who share similar characteristics or who have
relevance to the object of study (Tansey, 2007). One of the disadvantages of this
method is that respondents often suggest others who share similar characteristics
or the same outlook, so the researcher needs to ensure that the initial set of

60
respondents is sufficiently diverse so that the sample is not skewed excessively
in any one particular direction (Seldon and Pappworth, 1983).
Convenience sampling was chosen in this study for two reasons. First, this method saves
travel costs and time. The researcher chooses the places that foreign tourists usually
come and then conduct the survey instead of going to all around the country to find them.
Second, in order to contact with foreign tourists, researcher has to have a good
relationship with tour guide/tour manager to be involved in a package tour and then send
the questionnaires to foreign tourists.
3.5.2 Sample size
According to large-sample distribution theory, SEM requires a large sample size to
obtain reliable estimates (Raykov and Widaman 1995; Joreskog and Sorbom, 1996).
However, the question of how large a sample size should be has not been entirely
determined (Hair et al., 1995). In fact, it depends on the used statistical methods (e.g.
Maximum Likelihood (ML), generalized least squares and asymptotically distribution
free). Hair et al. (1995) stated that the minimum sample size should be between 100 to
150 responses if using the ML method. The authors also recommended that the
minimum sample size should be at least greater than the number of covariances in the
input data matrix. An empirical ratio of at least five observations per estimates
parameter has also been proposed (Bollen, 1989). Because of these reasons, based on the
number of parameters to be estimated, the sample size targeted in this study was 500.
3.5.3 Survey method
The literature on research methodology has identified a number of survey methods used
in studies, including self-administered questionnaire, face-to-face interview, telephone
interview, and mail/internet survey. However, the choice among these different methods
is not easy because each method has its own advantages and disadvantages (Aaker et al.,
1995). Among these four methods, even though providing a speedy and moderate-cost
means of data collection, telephone interview and mail/internet survey are inappropriate
for this current study. The reason is the willingness to answer the questions of tourists

61
after a tour is low, or they do not want to be disturbed by interviews as they have many
works to do after a visit, leading to a moderate response rate of the method (Zickmund,
1997). Alternatively, Zickmund (1997) also suggested that face-to-face survey may yield
higher response rates and allows researchers to use physical stimuli to facilitate the
interview. This method, on the other hand, allows interviewers to clarify the meanings of
ambiguous or complex questions. However, face-to-face surveys incur high costs and
time, especially in this study, as tourists often do not have too much free time to answer
the questions deeply when they are taking rest after a long day travel or during a
package tour. For these reasons, self-administered questionnaire is the most appropriate
method used for this research in order to examine the relationship between tour guide
performance and tourist satisfaction. The advantage of this method is saving time and
costs with a comparatively high response rate. Self-administered questionnaire is also
the method used for many existing studies (Zhang and Chow, 2004; Huang et al., 2010;
Chang, 2014).
In this research, self-administered questionnaire is mainly used to evaluate tour guide
performance in a package tour. There is at least one tour guide who will serve the
foreign tourists in any package tour. Therefore, tour guides were recruited for data
collection in every tour held by tourism companies. The tour guide was informed about
the survey’s method before conducting. Additionally, there were two ways used to
collect the data for the survey. First, tour guides distributed the questionnaires to the
tourists who were at least 18 years old on the last night of the package tour in the hotel
and then collected the questionnaires in the next morning. The tour guide, in addition,
also informed the tourists that only the researcher would see the returned questionnaires
that put in sealed envelope. Second, the researcher and his colleagues themselves
travelled to interesting places in different cities where attracted many foreign tourists,
handed the questionnaires to the tourists, after that let them approximately 10 minutes to
answer, and at last collected the questionnaires again. The sampling period lasted for
five months from September, 2013.
62
3.5.4 Data analysis techniques
In this study, for the first steps, descriptive statistics such as frequencies, percentages
and means were firstly used to summarize the demographic information about the
respondents. This helps to give the researcher a feel for the data and provides guidance
in dealing with multivariate analysis (Hair et al., 2010). One-way analysis of variance
(ANOVA) was undertaken in this step to determine whether there are any significant
differences between the means of three or more independent groups. On the other hand,
independent-samples t-tests – the parametric tests which are based on certain well-
established assumptions – were used to test for the difference between means (Field,
2005).
In general, there are three steps for data analysis in this study. Firstly, the measures of
the constructs were refined via Cronbach’s alpha and EFA. The purpose of this test was
to provide a preliminary assessment and modification of the measurement scales.
Reliability analysis was used to remove inappropriate items with low item-total
correlations (lower than .3) (Nunnally, 1978). In addition, EFA was conducted to
identify dimensions of scales together with factor loadings for each scale item. Items
with low factor loadings (lower than .4) (Anderson and Gerbing, 1988) will be deleted.
CFA, after that, was employed to confirm the validity of these measures. Once being
validated via CFA, the measures of the constructs were used to test the theoretical model.
Finally, SEM was used to test the theoretical model and the five hypotheses.
Specifically, once data collection was completed, descriptive statistic of analyses was
firstly conducted to provide an overview of the sample. After that, the reliability tests
and EFA were applied to the data in order to perform a preliminary test of the validity
and reliability of the instrument. The purpose of this test is to evaluate or modify the
scales used to measure the constructs (Churchill, 1979; Peter, 1979); and this
modification is based on reliability and dimensionality.
Theoretically, coefficient alpha is the most commonly used and accepted means to
estimate the reliability of a multi- item measurement scale (Hair et al., 1995). Reliability

63
is evaluated by Cronbach’s alpha. It is a measure of the degree to which all items are
measuring the same thing (DeVellis, 1991). In order to assess a multi- item scale, internal
consistency reliability assessment is the first step to be carried out to avoid additional
dimensions produced by factor analysis because of garbage items (Churchill, 1979).
The coefficient alpha will be high if the scale items are highly correlated (Hair et al.,
1995). Vice versa, if the coefficient alpha is low, it can be said that the measurement
scale used did not adequately measure the construct that it was intended to measure
(Churchill, 1979). According to Nunnally (1978), as a standard of reliability, a
coefficient of .5 or .6 is satisfactory in the early stages of research. In addition, a
coefficient alpha with a value greater than .7 will lead to the high confidence for most
research purposes (Hair et al., 1995). The next step in the refining procedures is to use
EFA to explore the dimensions of each construct. There are two basic methods used for
extracting factors in EFA: common factor analysis and principle component analysis.
Common factor analysis using principal axis factoring was employed in this study to
identify the latent dimensions represented in the original variable (Hair et al., 1995).
Moreover, the oblique rotation (e.g. promax) also reflects more exactly the underlying
structure of the data than an orthogonal solution (e.g. varimax) (Hair et al., 1995). Items
with low factor loading (< .4) were deleted; and then Cronbach’s alpha was recalculated
for the scales of those items removed.
The next step of the data analysis was using CFA to confirm the measurement model.
SEM was employed to test the theoretical model which is based on a goodness-of- fit
measure rather than statistical calculation (Hair et al., 1995). Normally, there are two
types of measurement when conducting the SEM, including absolute fit and incremental
fit.
The absolute fit measurement is ‘the degree to which the overall model (structural and
measurement model) predicts the observed covariance or correlation matrix’ (Hair et al.,
1995, p. 654). The most important indices of absolute fit are identified as the Chi-square
statistic, the noncentrality parameter (NCP), the goodness-of-fit index (GFI), the root
mean square residual (RMR), the root mean square error of approximation (RMSEA)
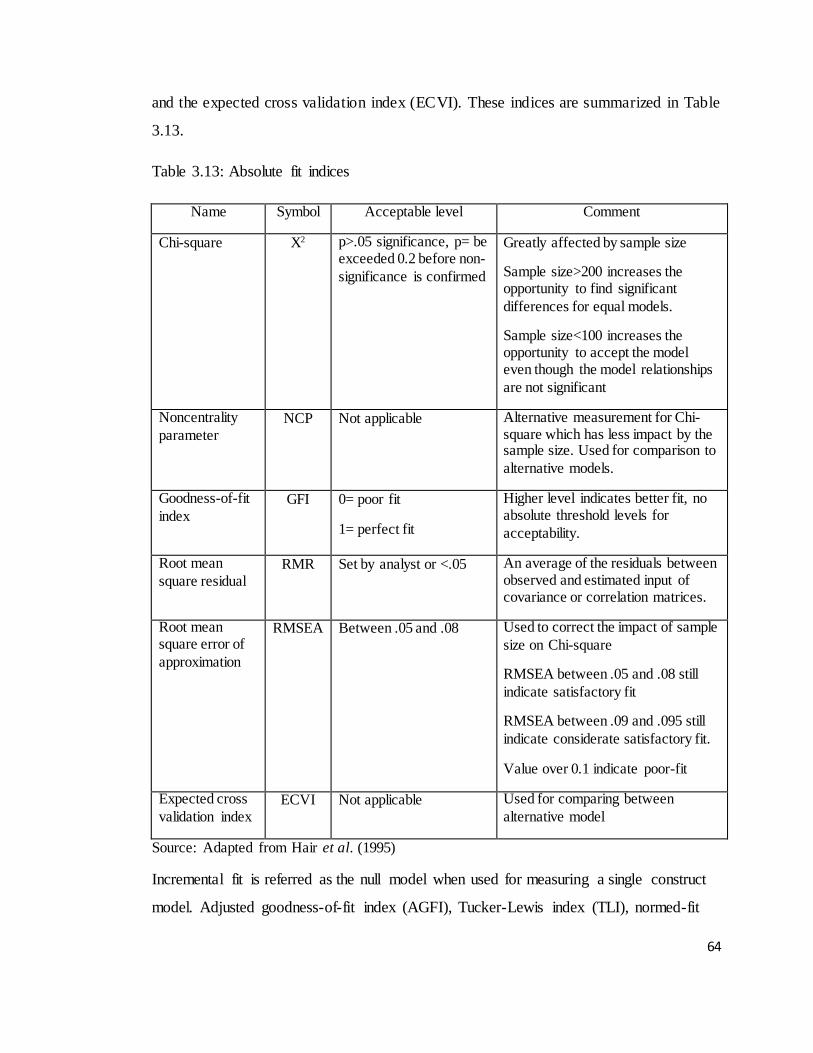
64
and the expected cross validation index (ECVI). These indices are summarized in Table
3.13.
Table 3.13: Absolute fit indices
Name Symbol Acceptable level Comment
Chi-square X2 p>.05 significance, p= be exceeded 0.2 before non-
significance is confirmed
Greatly affected by sample size
Sample size>200 increases the opportunity to find significant
differences for equal models.
Sample size<100 increases the opportunity to accept the model even though the model relationships
are not significant
Noncentrality
parameter NCP Not applicable Alternative measurement for Chi-
square which has less impact by the sample size. Used for comparison to
alternative models.
Goodness-of-fit
index GFI 0= poor fit
1= perfect fit
Higher level indicates better fit, no absolute threshold levels for
acceptability.
Root mean
square residual RMR Set by analyst or <.05 An average of the residuals between
observed and estimated input of covariance or correlation matrices.
Root mean square error of
approximation
RMSEA Between .05 and .08 Used to correct the impact of sample
size on Chi-square
RMSEA between .05 and .08 still
indicate satisfactory fit
RMSEA between .09 and .095 still
indicate considerate satisfactory fit.
Value over 0.1 indicate poor-fit
Expected cross
validation index ECVI Not applicable Used for comparing between
alternative model
Source: Adapted from Hair et al. (1995)
Incremental fit is referred as the null model when used for measuring a single construct
model. Adjusted goodness-of-fit index (AGFI), Tucker-Lewis index (TLI), normed-fit

65
index (NFI) and other incremental fit measurements such as relative-fit index (RFI),
incremental-fit index (IFI), and the comparative-fit index (CFI) are the indicators for
measuring the incremental-fit index. These indicators are summarized in Table 3.14.
Table 3.14: Incremental fit indices
Name Symbol Acceptable level Comment
Adjust goodness of fit index
AGFI .9 Value greater than 1 indicates poor fit
Tucker-Lewis
index TLI .9 Value greater than 1 indicates poor fit
Can be used for comparing between
alternative models
Normed fit
index NFI 0= poor fit
1= perfect fit
No absolute value indicating an acceptable
level of fits but recommended value is .9
Relative fit
index RFI 0= poor fit
1= perfect fit
Value between 0.9 and 0.95 indicates
satisfactory fit.
Values greater than 1 indicates over fit.
Incremental
fit index IFI 0= poor fit
1= perfect fit
Value between 0.9 and 0.95 indicates
satisfactory fit.
Values greater than 1 indicates over fit.
Comparative
fit index CFI 0= poor fit
1= perfect fit
Value between 0.9 and 0.95 indicates
satisfactory fit.
Values greater than 1 indicates over fit.
Source: Adapted from Hair et al. (1995)
3.6 Ethical considerations
The research procedures and questionnaire were considered and approved by the ethics
committee of University of Western Sydney before any data collection occurred. The
participant consent form and participant information sheet, which included all aspects of
the ethical and contact details, were provided to the respondents before the interview,
and are included in Appendix 1 and 2.

66
3.7 Conclusion
This chapter provided the details of the research methodology and procedures that were
used in the research, as well as presenting a justification of the research methodology.
The chapter also focused on the development of the questionnaire and the analytical
methods employed to evaluate the propositions and answer the research questions from
Chapter 2. The measures of four main constructs of the study, including intrapersonal
servability of tour guide, interpersonal servability and organizational skills of tour guide,
tourist satisfaction, and destination loyalty of tourist, have been explored through focus
group interviews and existing research.
This chapter, moreover, described the statistical methods employed for data analysis,
including validity and reliability assessments, normality distributions, and structural
equation modeling. The next chapter reports the results and findings of the data analysis.

67
CHAPTER 4
RESULTS AND FINDINGS
4.1 Introduction
The previous chapter discussed the research methodology includ ing the
operationalization of the four constructs of the theoretical model developed in Chapter 3,
and the research design of both the qualitative study and the quantitative study. This
chapter presents the results of both studies. Firstly, the focus group interviews of 30
respondents from three cohorts were analyzed. The findings from the focus group
interviews led to the finalization of the survey instrument for the main study. The
following section describes the characteristics of the sample and presents descriptive
statistics of the main survey. Next, the measurement model was assessed via exploratory
factor analysis and confirmatory factor analysis. The final section presents an
assessment of the theoretical model using structural equation modeling, and the
associated hypotheses are then discussed. It is also noted that the fuller description of the
results of descriptive statistics is presented in Appendice 5 (from A1 to A11).
4.2 Focus group interviews
In this research, a system of tour guide performance attributes were firstly generated by
reviewing relevant literature and previous studies (Geva and Goldman, 1991; Zhang and
Chow, 2004; Huang et al., 2010). In the next phase, focus group interviews were
organized separately with three different cohorts of tour managers, tour guides, and
tourists, in order to represent different perspectives on tour guide performance and
identify other important attributes not included in the existing system. Each cohort
consisted of 10 participants. Commonly the main tour guide performance attributes
identified by focus group members included appearance, language ability,
communication skill, cultural understanding, passion of work, and destination
knowledge.

68
Most of interviewees from three cohorts agreed on the existing factors derived from the
research of Huang et al. (2010) on tour guide performance. In Huang’s analysis,
however, some factors were eliminated from the model, such as language ability,
commentary skill, knowledge of destination’s culture, and reliable shop introduction
ability of tour guide. Nevertheless, many interviewees in this study, especially tour
guides and foreign tourists, stated that those factors play a significant role on the
performance of tour guides.
The importance of the language skill of tour guides also received support from all
cohorts in the interviews. Specifically, all of respondents from cohort 1 (tour guides)
agreed that the language skill of the guide is very important for the success of a package
tour, while 70% of respondents from cohort 2 (tour managers) affirmed ‘language skill
is one of the most important factors to build the success of tour guide’s role ’ (extracted
from one tour manager from Saigontourist company, one from Benthanhtourist company,
and one from Viettravel company). Three of them also provided some examples of bad
language ability of tour guides that lead to the dissatisfaction of foreign tourists in
package tours. Four respondents in cohort 3 (tourists), in addition, also complained
about the language ability of the tour guide, leading to their dissatisfaction because in
some cases, tour guides could not understand or they misunderstood tourists’ requests.
Interestingly, five tour guides from three tourism companies in the interview mentioned
that the ability to cooperate with other staff (e.g., driver) largely determines their
performance. Two tour managers who came from Saigontourist company and
Cholontourist company, moreover, believed that ‘the ability of the tour guide to remind
tourists of safety issues is significant in most of package tours because the environment
in Vietnam is not yet secure for customers, especially for foreign tourists ’. Three tourists
from France, United States and Australia in the interviews also agreed on this when
showing some unexpected events in the tour. For example, when climbing up to a hill or
a mountain in a hiking tour, they had to evade some trash or garbage or stones along the
way, leading to the fact that they had to choose alternative way but more dangerous, and
in some cases, some of them fell down and were injured. In addition, many foreign
tourists in the interviews showed their concerns about environmental protection in

69
Vietnam. They stated that if tour guides keep reminding them of this issue, the success
of a package tour as well as the satisfaction of tourists will be easy to reach. Four foreign
tourists (two from Australia and two from UK) in the interview also stated that ‘they will
be very pleased if tour guides keep reminding them about environmental protection
issues although they all already knew about them’.
In the interviews, foreign tourists, especially three who came from Asia countries
(Singapore, Hong Kong, and China), stated ‘there is a lack of entertainment places’ (e.g
casino), and in some cases tour guides did not know how to introduce the interesting
places for them to relax at night. Five tour managers and six tour guides from four
tourism companies expressed the view that the introduction ability of tour guide to
Vietnamese traditional foods (e.g., pho) is important as many foreign tourists want to
know and try. On the other hand, two of tour guides from Viettravel company who often
guide Asian tourists in package tours agreed that tourists, especially Asian people, ‘will
be very delighted if tour guides introduce interesting entertainment places (e.g., casino,
bar, club), or some Vietnamese traditional products for them to purchase (for non-Asian
customers) (e.g., palm-leaf conical hat, lacquer painting)’. This point of view was also
agreed from two tourists from Hong Kong and China.
The focus group interviews, however, showed most respondents from three cohorts
thought that ‘tour guide’s sense of humor is unnecessary in a package tour’ due to the
cultural differences between foreign tourists and tour guide, or the lack of language
ability of domestic tour guides. Further, three customers from America and France
raised the problem related to historical arguments among tourists in a tour or between
tourist and tour guide. They totally agreed that if tour guides know how to solve that
problem, then the tour program will be more useful and interesting.
Finally, the attribute system was justified based on findings from focus group interviews,
and a self-administrated questionnaire was designed based on the final attribute system.
The questionnaire consisted of five sections, where section 1 is intrapersonal servability
of tour guide; section 2 is interpersonal servability and organizational skills of tour
guide; section 3 is tourist satisfaction with the tour guide performance of a tour; section

70
4 is destination loyalty of tourist; and section 5 is demographic profile of respondents.
Sections 1 and 2 contained 36 items measuring the tour guide performance as perceived
by foreign tourists. A 5-point Likert-type scale where 1 = strongly disagree and 5 =
strongly agree was employed to assess respondents’ ratings on the performance of tour
guides. Sections 3 and 4, each containing three questions adapted from the research of
Huang et al. (2010) and Christina and Hailin (2008) were designed to measure tourists’
satisfaction with a package tour and their destination loyalty. These sections again
adopted 5-point Likert scale. The questionnaire was prepared in English before carrying
out a pilot test (see Questionnaire in Appendix 4).
4.3 Quantitative data analysis
The pilot testing was first conducted in 3 provinces in Vietnam, including Ho Chi Minh
City, Nha Trang City and Phan Thiet City. In this pilot survey, 25 questionnaires were
distributed to foreign tourists who came from Russia, England, United States, France,
Australia, and Malaysia. The number of replies was 19. However, the usable replies
were 15, which occupied 60% in total, because some Russian respondents could not
complete or marked the level of satisfaction in the highest score only due to their limited
English ability. The tourists in this pilot test are mostly from 19 to 49 years old, in which
the range of 19-29 years old makes up the highest density. In addition, lowest education
level of respondents is ‘complete high school’, while the highest one is ‘post graduate’.
The income of respondents was mainly from 20,000 USD to 60,000 USD. Only some of
tourists who are students have income below 20,000 USD. In general, the respondents
understood and answered the questionnaire accurately, and most completed the entire
questionnaire. Some of tourists, moreover, also gave some useful ‘other comments’ in
every section of the questionnaire. There were only 2 persons who did not understand
what ‘MICE’3 is. This term therefore was explained clearly in the final questionnaire
used for data collection.
3 Meetings, incentives, conferences, exhibitions

71
After modifications were made to the pilot, 500 official questionnaires were distributed
to foreign tourists in six cities that attract a lot of tourists in Vietnam. A number of 451
questionnaires were collected after eliminating several invalid ones because the
respondents skipped answering most of the questions.
4.3.1 Descriptive statistics
In general, the preliminary result of the research showed that the average satisfaction of
foreign tourists on guiding service, tour services, and the overall tour experience was
comparatively high, indicating by a density of more than 75% of total respondents were
‘agree’ or ‘strongly agree’. However, further analyses are needed to distinguish the level
of satisfaction of tourists in terms of age, gender, education level, etc., as well as to
understand deeply about the attributes of tour guide that affect to the level of satisfaction
of foreign tourists in Vietnam.
4.3.1.1 Demographic profiles of tourists and their satisfaction in a
package tour
As shown in figure 4.1, tourists from European countries occupied more than half of the
respondents in the survey, while the proportion of Australian tourists was ranked the
second with a share of 12%. On the other hand, with a proportion of 5%, tourists from
Russia also played significant role in tourism attraction of Vietnam. The reason for this
is the direct flight from Russia to Nha Trang – one of the favorite tourism destinations of
Vietnam – had been established, leading to the increase in Russian tourists over recent
years.

72
Figure 4.1: Foreign tourists to Vietnam in terms of nationalities
Source: Developed for this research
One-way ANOVA analyses between the nationality of tourists and their satisfaction on
guide service, tour service, as well as overall tour experience (Table A1.1, A1.2, and
A1.3 in Appendix 5) reveal that there is a significant difference between nationality of
tourists and their satisfaction on guiding service as well as between nationality of
tourists and their overall satisfaction of a package tour; while there is no significant
difference between nationality of tourists and their satisfaction on tour service with a
level of significance of 10%.
The t-test analyses using paired data, including 28 tests for 8 groups, indicated that
tourists from Europe are less satisfied with guiding service when compared with tourists
from North America. On the other hand, tourists from South East Asia countries are less
satisfied with guiding service when compared with tourists from North America, while
tourists from China, Japan, and Korea are also less satisfied with guiding service when
compared with tourists from North America (see Table A1.4)

73
Moreover, it can be said that in terms of satisfaction on the overall tour experience,
tourists from European countries are less satisfied when compared with tourists from
Australia; and tourists from South East Asia countries are less satisfied when compared
with tourists from New Zealand, Dubai, Israel, Hong Kong, Taiwan, and India (see
Table A1.5).
Figure 4.2: Foreign tourists to Vietnam in terms of gender
Source: Developed for this research
Figure 4.2 showed that 53% of the survey participants were male compared to 47%
female. Further analysis showed that there is no significant difference between gender of
tourists and their satisfaction on guiding service, or between gender of tourists and their
satisfaction on tour services. However, there is a significant difference between gender
of tourists and their overall tour experience (see Table A2.1 to A2.3) with t-test analysis
indicating that male tourists are less satisfied on the overall tour experie nce compared
with female tourists (see Table A2.4).

74
Figure 4.3: Foreign tourists to Vietnam in terms of marital status
Source: Developed for this research
Figure 4.3 showed that in the total of 451 respondents from the survey, people who were
never married occupied 41%, following by people who got married with a proportion of
37%. Tourists who were divorced also hold 19% of the total respondents.
From the one-way ANOVA analysis, it can be seen there is no significant difference at
the level of significance of 10% between marital status of tourists and their satisfaction
on guiding service. However, there is significant difference between marital status of
tourists and their satisfaction on tour services as well as marital status of tourists and
their satisfaction on the overall tour experience (see Table A3.1 to A3.3).
The t-test analyses indicated that, tourists who never married are more satisfied on tour
services when compared with tourists who were divorced; tourists who get married are
more satisfied when compared with tourists who were divorced; and tourists who are
widowed are more satisfied when compared with tourists who were divorced (see Table
A3.4).

75
Moreover, the results also showed that tourists who never married and who get married
are more satisfied on the overall tour experience compared with tourists who were
divorced (see Table A3.5).
Figure 4.4: Foreign tourists to Vietnam in terms of age
Source: Developed for this research
Tourists from 30 to 39 years old who came to Vietnam comprise the largest proportion
in the survey, while the younger people (from 19 to 29 years old) ranked the second with
27% of the total. It may be explained by the fact that middle-aged people with their
current jobs and social standings are more willing to travel for leisure. Additionally,
people who are from 60 years old occupied 7% of the total respondents, indicating that
Vietnam is attractive for all ages of tourists (shown in Figure 4.4).
One-way ANOVA analyses between age of tourists and their satisfaction on guide
service, tour service, as well as overall tour experience show the following results:
With a level of significance of 10% there is no significant difference between age of
tourists and their guide satisfaction; while there is a significant difference between age
of tourists and tour service satisfaction as well as between age of tourists and their
overall satisfaction of the tour package (see Table A4.1 to A4.3).
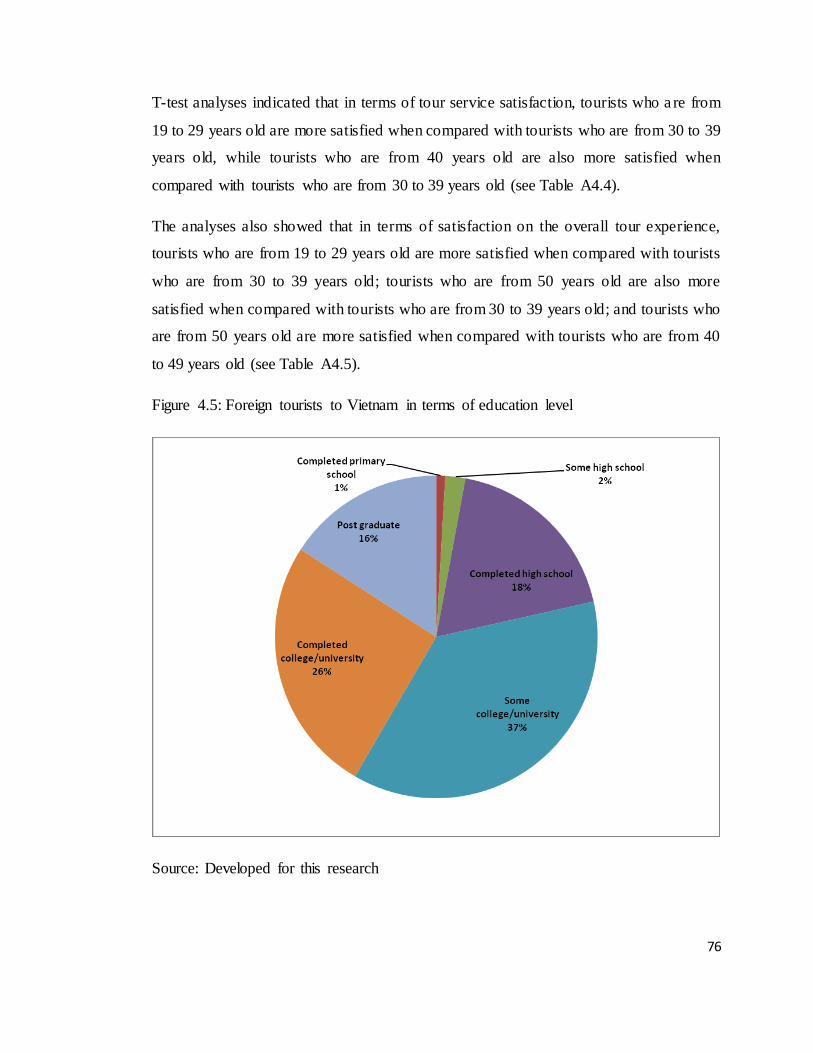
76
T-test analyses indicated that in terms of tour service satisfaction, tourists who a re from
19 to 29 years old are more satisfied when compared with tourists who are from 30 to 39
years old, while tourists who are from 40 years old are also more satisfied when
compared with tourists who are from 30 to 39 years old (see Table A4.4).
The analyses also showed that in terms of satisfaction on the overall tour experience,
tourists who are from 19 to 29 years old are more satisfied when compared with tourists
who are from 30 to 39 years old; tourists who are from 50 years old are also more
satisfied when compared with tourists who are from 30 to 39 years old; and tourists who
are from 50 years old are more satisfied when compared with tourists who are from 40
to 49 years old (see Table A4.5).
Figure 4.5: Foreign tourists to Vietnam in terms of education level
Source: Developed for this research

77
Figure 4.5 illustrates that the education level of respondents is comparatively high as the
ratio of people who are attending or completed college/university reached more than
60%. Moreover, figure 5 indicated that tourists who have higher level of education, e.g.
MA, MS, PhD, also made up 16% of the total. Only few people have low education
level (about 3%).
The one-way ANOVA analyses also showed there is no significant difference between
education level of tourists and their satisfaction on guiding services, while there is
significant difference between education level of tourists and their satisfaction on both
tour services and overall tour experience (see Table A5.1 to A5.3).
T-test analyses showed that in terms of satisfaction on tour service, tourists who only
completed high school are less satisfied when compared with tourists who completed
college/university or have a higher level of education (MA, MS, MD, PhD, …); tourists
who are students in college/university are also less satisfied when compared with
tourists who completed college/university or have a higher level of education (see Table
A5.4).
In terms of satisfaction on overall tour experience, tourists who are attending high
school are less satisfied when compared with tourists who completed high school, while
tourists who completed college/university or have a higher level of education (MA, MS,
MD, PhD, …) are more satisfied when compared with tourists who completed high
school or who are students in college/university (see Table A5.5).

78
Figure 4.6: Foreign tourists to Vietnam in terms of occupation
Source: Developed for this research
Figure 4.6 indicated that a number of 30% of total foreign tourists to Vietnam are
business people. However, unemployed people also hold 27% of the total. Specifically,
the number of teachers and lecturers who travelled to Vietnam is remarkable with the
proportion of 16% of the total respondents. The occupation of 6% of retired people is
appropriated with the ratio of people from 60 years old that is shown in Figure 4.4.
The one-way ANOVA analyses showed that there is no significant difference between
occupation of tourists and their satisfaction on guiding service, as well as between
occupation of tourists and their satisfaction on tour services. However, there is
significant difference between occupation of tourists and their satisfaction on the overall
tour experience (see Table A6.1 to A6.3).

79
The t-test analyses showed that in terms of satisfaction on overall tour experience,
tourists who are unemployed are less satisfied when compared with the others (who are
business person or civil servant or teacher/lecturer or clerk/white-collar worker or blue-
collar worker or retired). On the other hand, tourists who are teacher/lecturer are also
less satisfied when compared with tourists who are clerk/white-collar worker (see Table
A6.4).
Figure 4.7: Foreign tourists to Vietnam in terms of income
Source: Developed for this research
Figure 4.7 illustrates half of tourists who chose Vietnam as a destination has an income
from 20,000 USD to 60,000 USD a year, while people who have high income (above
100,000 USD a year) also hold 13% of the total. The lowest average income (less than
20,000 USD) with a proportion of 14% is mostly concentrated on unemployed or retired
people.

80
The one-way ANOVA analyses affirmed there is no significant difference between
income of tourists and their satisfaction of guiding service, where as there is significant
difference between income of tourists and their satisfaction on both tour services and
overall tour experience (see Table A7.1 to A7.3).
According to t-test analyses, in terms of satisfaction on tour services, tourists who have
income less than 40,000 USD or have income from 80,000 USD are more satisfied when
compared with tourists who have income from 40,000 USD to 59,999 USD (see Table
A7.4).
On the other hand, in terms of satisfaction on the overall tour experience, tourists who
have income less than 20,000 USD are more satisfied when compared with tourists who
have income from 20,000 USD to 59,999 USD; tourists who have income from 20,000
USD to 39,999 USD are less satisfied when compared with tourists who have income
above 100,000 USD; and tourists who have income from 40,000 USD to 59,999 USD
are also less satisfied when compared with tourists who have income above 60,000 USD
(see Table A7.5).
Figure 4.8: Foreign tourists to Vietnam in terms of the times of visit
Source: Developed for this research

81
Figure 4.9: Foreign tourists to Vietnam in terms of purpose
Source: Developed for this research
The survey revealed this was the first time that most foreign tourists came to Vietnam
with the purpose is travelling only, while people who came to Vietnam more than three
times made up only 3% of the total (shown in Figure 4.8 and 4.9).
According to the results of one-way ANOVA analyses, there is no significant difference
between the times of visit of tourists to Vietnam and their satisfaction on guilding
service, tour services, and overall tour experience (see Table A8.1 to A8.3).
The one-way ANOVA analyses, again, stated that there is no significant difference
between the purpose of tourists to and their satisfaction on guilding service, tour services,
and overall tour experience (see Table A9.1 to A9.3).

82
Figure 4.10: Foreign tourists to Vietnam in terms of companion
Source: Developed for this research
The highest prorpotions of tourists who came with family, friends or partners are 28%,
28% and 24% respectively, while tourists who came to Vietnam alone hold 18% of the
total (shown in Figure 4.10). Moreover, only few people intended to stay in Vietnam less
than 3 days, while normally tourists planned to travel from 4 days to 2 weeks.
Specifically, a proportion of 16% of respondents intended to stay in Vietnam more than
2 weeks (see Figure 4.11).
One-way ANOVA analyses affirmed there is no significant difference between tourists
with companions and their satisfaction of guiding service, while there is significant
difference between tourists with companions and their satisfaction on both tour services
and overall tour experience (see Table A10.1 to A10.3).
The result from t-test analyses showed that in terms of satisfaction on tour services,
tourists who travelled alone are less satisfied when compared with tourist who travelled

83
with family or partner(s); while tourists who travelled with partner(s) are more satisfied
when compared with tourists who travelled with friend(s) (see Table A10.4).
Moreover, in terms of satisfaction on the overall tour experience, tourists who travelled
alone are less satisfied when compared with tourists who travelled with family,
partner(s), or friend(s); tourists who travelled with family or partner(s) are more satisfied
when compared with tourists who travelled with friend(s) (see Table A10.5).
Figure 4.11: Foreign tourists to Vietnam in terms of intention to stay
Source: Developed for this research
One-way ANOVA analyses stated that there is no significant difference between
intending to stay in Vietnam of tourists and their satisfaction of guiding service as well
as satisfaction on tour services, while there is significant difference between intending to
stay of tourists and their satisfaction on overall tour experience (see Table A11.1 to
A11.3).
The result from t-test analyses indicated that in terms of satisfaction on overall tour
experience, tourists who intended to stay in Vietnam from 4 to 10 days are less satisfied
when compared with tourists who intended to stay from 11 days (see Table 11.4).

84
In summary, the above descriptive analyses affirmed that most of foreign customers who
came to Vietnam to travel are from European countries, Australia, and North America
countries. Tourists came from European countries are less satisfied on guiding service
and overall tour experience when compared with others. In addition, males are less
satisfied on the overall tour experience when compared with females. It also can be said
that customers who were divorced are less satisfied on both tour services and overall
tour experience when compared with others. Young and middle-aged people (from 19 to
39 years old) comprise the largest proportion of the total. However, middle-aged people
(from 30 to 39 years old) are less satisfied on both tour services and overall tour
experience when compared with others.
Approximately 80% of tourists who came to Vietnam completed high school. They are
studying in colleges/universities or have been graduated or have higher degree (MA, MS,
and PhD). These customers are also more satisfied on tour service and tour experience
when compared with tourists who have lower education level. Moreover, tourists who
have jobs occupied 67% of the total, and they are more satisfied on the overall tour
experience when compared with tourists who are unemployed. Tourists who have
average income (from 40,000 to 59,999 USD), in addition, are less satisfied on tour
services when compared with others. In addition, tourists who travelled with family or
friend(s) or partner(s) are more satisfied on both tour services and overall tour
experience when compared with people who travelled alone. The longer tourists
intended to stay in Vietnam, the more satisfaction on overall tour experience they feel.
4.3.1.2 Intrapersonal servability attributes of tour guides
In terms of intrapersonal servability attributes of Vietnamese tour guides, it can be said
that ‘friendly’ and ‘polite’ attribute received highest rates from respondents, with a
density of 97% of tourists agreed or strongly agreed. The similar results could be found
in ‘appearance’ and ‘honest and reliable’ and ‘good personality’ attributes when a
number of 96%, 93% and 93% of respondents agreed or strongly agreed respectively. In
addition, the ‘health’ of tour guide is comparatively high rated with 89% of total
respondents agreed or strongly agreed. However, in terms of ‘passion of work’ and
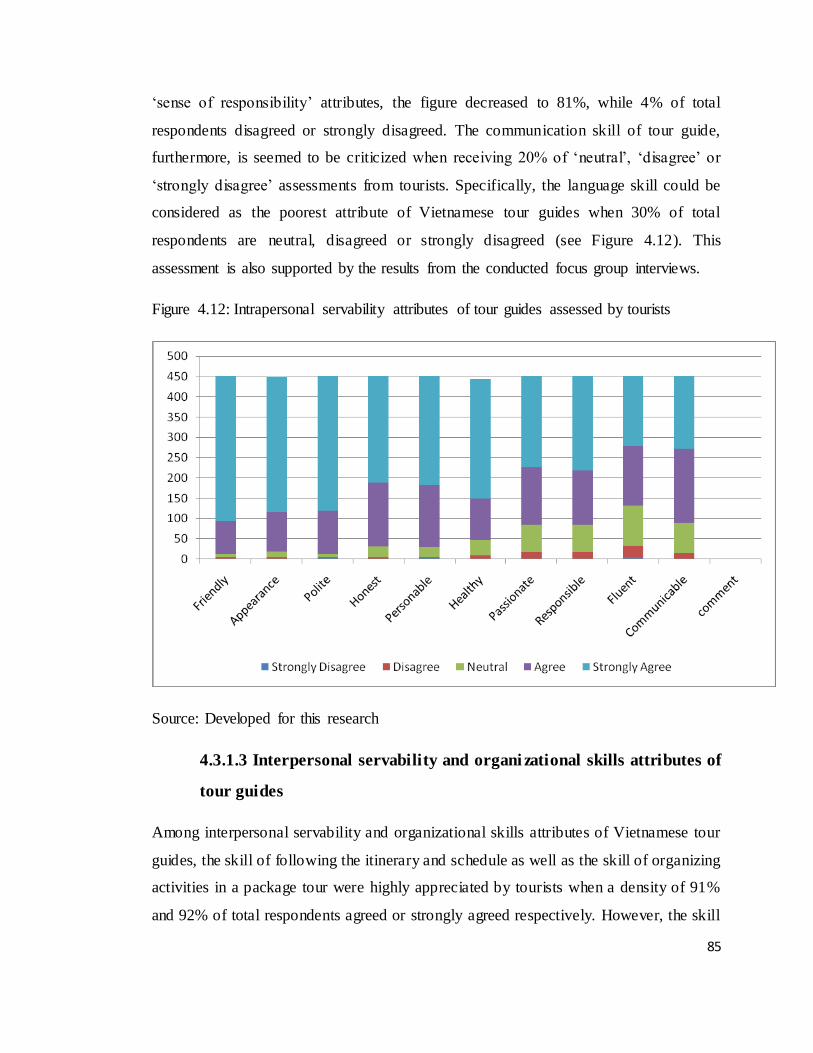
85
‘sense of responsibility’ attributes, the figure decreased to 81%, while 4% of total
respondents disagreed or strongly disagreed. The communication skill of tour guide,
furthermore, is seemed to be criticized when receiving 20% of ‘neutral’, ‘disagree’ or
‘strongly disagree’ assessments from tourists. Specifically, the language skill could be
considered as the poorest attribute of Vietnamese tour guides when 30% of total
respondents are neutral, disagreed or strongly disagreed (see Figure 4.12). This
assessment is also supported by the results from the conducted focus group interviews.
Figure 4.12: Intrapersonal servability attributes of tour guides assessed by tourists
Source: Developed for this research
4.3.1.3 Interpersonal servability and organi zational skills attributes of
tour guides
Among interpersonal servability and organizational skills attributes of Vietnamese tour
guides, the skill of following the itinerary and schedule as well as the skill of organizing
activities in a package tour were highly appreciated by tourists when a density of 91%
and 92% of total respondents agreed or strongly agreed respectively. However, the skill

86
of managing time in a tour was not comparatively high when receiving 75% of
respondents’ agreement or strong agreement. In addition, the skill of cooperating with
other staff (e.g., driver) is also one of the strengths of tour guides when receiving 89% of
‘agree’ or ‘strongly agree’ assessments from tourists. Although tour guides had fairly
good skills of introducing Vietnamese traditional and original foods as well as special
products to customers with 87% of total respondents agreed or strongly agreed, the skills
of introducing interesting entertainment places and reliable shops to tourists were not as
high when only 78% and 71% of respondents agreed or strongly agreed. Specifically, in
terms of the skill of introducing restaurants with tasty foods to customers, Vietnamese
tour guides were not high rated when only 65% of respondents agreed or strongly agree,
while there were 21% disagreed or strongly disagreed (see Figure 4.13).
Figure 4.13: Interpersonal servabiliy and organizational skills attributes of tour guide
assessed by tourists
Source: Developed for this research
Subsequently, the figure also illustrated that the skill of performing in commentary and
the skill of taking good care of customers’ needs are comparatively high rated with 84%
of respondents agreed or strongly agreed. Although Vietnamese tour guides are

87
considered as having knowledge to keep environment clean during a package tour when
receiving 85% of total respondents’ agreement or strong agreement, the skills of keeping
reminding tourists of environmental protection issues as well as safety issues are lacking
because there were 37% and 32% of respondents are neutral, disagreed or strongly
disagreed.
Vietnamese tour guides were also considered as able to generate rapport among tour’s
members when receiving 81% of total respondents’ agreement or strong agreement.
However, it seemed that foreign tourists did not appreciate much of the sense of humor
of tour guides due to the fact only 22% of respondents are neutral or disagreed or
strongly disagreed on this attribute. It can be explained by the lack of language skill of
tour guides that analyzed above.
Contrary to the above positive attributes, Figure 4.13 also showed that the skill of
meeting psychological needs of customers, the skill of willing to help customers, and the
skill of showing knowledge of destination’s culture and history as well as local people’s
lifestyle were not highly rated by tourists when receiving less than 75% of respondents’
agreement or strong agreement. In terms of the skill of understanding the culture of
customers that tour guides are serving, specifically, there were 33% of total respondents
assessed ‘neutral’ or ‘disagreed’, and 5% were ‘strongly disagreed’. It is one of the big
weaknesses of Vietnamese tour guides that was also reported in conducted focus group
interviews.
Similar results could be found in tour guide’s skills of handling customers’ complaints
and solving problems in the tour, as well as coping with unexpected or urgent incidents
when receiving less than 67% of respondents’ agreement or strong agreement. Moreover,
the skills of tour guides to reconcile historical arguments among tourists and to show
sound judgment in historical arguments with customers are lacking when there were less
than 52% of total respondents agreed or strongly agreed. Especially, skill of reconciling
historical arguments among tourists received 21% of disagreement and strong
disagreement from tourists.

88
4.3.1.4 Tourist satisfaction and destination loyalty
In general, although there were various assessments of tourists on tour guide, tourist
satisfaction on guiding service was high when a density of 94% of total respondents
were ‘agree’ or ‘strongly agree’. However, this figure has been decreased to 84% and
78% in tourist satisfaction on tour services and overall tour experience (see Figure 4.14).
Figure 4.14: Tourist satisfaction on guiding service, tour services and overall tour
experience
Source: Developed for this research
Furthermore, in terms of destination loyalty of foreign tourists, it can be said that most
of tourists (about 94%) are willing to revisit Vietnam for tourism in the future or to
recommend others to travel to the country, additionally only 72% of total respondents
stated that they will stay longer to travel in Vietnam if they have the chance to come
again on a business trip (see Figure 4.15).

89
Figure 4.15: Destination loyalty of tourists
Source: Developed for this research
4.3.2 Exploratory Factor Analysis
4.3.2.1 Tourist satisfaction
In terms of ‘tourist satisfaction’ definition, with KMO = .681 (>= .5) and Sig. < .05 in
Bartlett’s test, along with the cumulative percentage of total variance was 82.885% and
factor loading of every item (including satisfaction with guiding service, satisfaction
with tour services, and satisfaction with the overall tour experience) was higher than .5
each, it can be said that ‘tourist satisfaction’ was explained by the above three attributes
(see Table A12.1). Cronbach’s Alpha analysis also showed the reliability of used scales
when all factors were higher than .6 (see Table A12.2).
4.3.2.2 Destination loyalty of tourists
The same results had been found in ‘destination loyalty’ definition, indicating that the
definition was measured by the willingness to revisit the country, the willingness to stay

90
longer to travel if having a chance in future, and the willingness to recommend others to
travel to the country (see Table A13.1 and A13.2).
4.3.2.3 Intrapersonal servability of tour guide
In the next step, exploratory factor analysis (EFA) was conducted to identify tour guide
performance dimensions using the Principal Axis Factoring with Promax rotation. In
terms of intrapersonal servability of tour guide, factor loading of every item was higher
than .5, except the item v1.6 – ‘tour guides had good health’ – with factor loading was
only .253 (see Table A14.1). This item, after that, was eligible to be deleted and the EFA
was conducted again without this item (see Table A14.2). The result showed that in
terms of intrapersonal servability of tour guide, there were three groups of attributes
generated that indicating in Table 4.1. The further Cronbach’s Alpha analyses in each
group also revealed the reliability of used scales (see Table A14.3).
Table 4.1: Factor loading from Pattern Matrix of ‘intrapersonal servability’
Factor
app work com
v1.1 .825
v1.3 .778
v1.2 .718
v1.5 .665
v1.4 .642
v1.7 .914
v1.8 .838
v1.10 .820
v1.9 .580
Source: Developed for this research
Factors from v1.1 to v1.5, after that, were named as ‘appearance’ because of its
relevance to the physical appearance of tour guides, while v1.7 and v.18 were named as
‘work attitude’ when they are closed to the career’s responsibility of tour guide, and v1.9
and v1.10 were named as ‘communication skill’ as they are related to the language
ability of tour guide. These classifications are somewhat different from the results of

91
Huang et al. (2010) because this study affirmed three factors (v1.1, v1.3, and v1.4) that
were eliminated from Huang’s model.
4.3.2.4 Interpersonal servability and organizational skills of tour guide
In terms of interpersonal servability and organizational skills of tour guide, there were
six groups of attributes generated. However, with factor loadings are lower than .4 or the
difference between highest loading and others are lower than .3, there are 4 items that
should be deleted respectively, including v2.7 ‘tour guides performed well in
commentary’, v2.8 ‘tour guides had a good sense of humor’, v2.9 ‘tour guides were able
to generate rapport among tour’s members’, and v2.15 ‘tour guides followed the
itinerary and schedule’ (see Table A15.1). After deleted three items v2.7, v2.8 and v2.9,
the result stated that item v2.15 was not appropriate because the difference between
highest loading with others reached only .155 although factor loading was .424. Hence,
item v2.15 was also deleted afterwards (see Table A15.2). Table A15.3 showed that item
v2.16 and v2.18 should be eliminated because factor loadings were lower than .5 or the
difference between highest loading and others were lower than .3. However, according
to Hair et al. (1998, p.111), if the number of samples is from 350, factor loading of .3
can be used while this research has a sample of 451 respondents. The two items,
moreover, were implied their importance in focus group interviews that conducted
before. Hence, item v2.16 and v2.18 were kept in the model (see Table 4.2). The further
Cronbach’s Alpha analyses in each group also indicated the reliability of used scales
(see Table A15.4).

92
Table 4.2: Factor loading from Pattern Matrix of ‘interpersonal servability and
organizational skills’
Factor
solv intro prof emp envi org
v2.12 .882
v2.11 .875
v2.13 .810
v2.10 .683
v2.14 .639
v2.26 .795
v2.25 .767
v2.23 .743
v2.24 .684
v2.22 .633
v2.5 1.004
v2.4 .956
v2.6 .259 .684
v2.3 .888
v2.2 .873
v2.1 .831
v2.20 .933
v2.21 .762
v2.19 .680
v2.17 .922
v2.16 .239 .478
v2.18 .396
Source: Developed for this research
Factors from v2.1 to v2.3, in the next step, were named as ‘empathy’. This was also
comparable to the result of Huang et al. (2010) when they grouped 3 factors, especially
the ability of tour guide to meet tourists’ psychological needs. Factor from v2.4 to v2.6,
in addition, were named as ‘professional competence’. This classification is partly
different from previous research of Huang et al. (2010, p.20) because the attribute ‘sense
of humor’ of tour guide was firstly deleted from the model after conducting focus group
interviews, while attributes related to language ability of tour guide were grouped as
‘communication skill’ in intrapersonal servability of tour guide above. Factors from

93
v2.10 to v2.14 were named as ‘solving problems’, as well as factors from v2.16 to 2.18
were named as ‘organizational skill’, indicating the similar result from research of
Huang et al. (2010). However, factors from v2.19 to v2.21 that named as ‘environmental
protection skill’, and factors from v2.22 to v2.26 that named as ‘entertainment
introduction skill’, are new results when compared with previous research as they were
raised from the focus group interviews.
In conclusion, in terms of intrapersonal servability dimension, three factors were derived
from the factor analysis. The final solution retained 9 performance items. The three
factors explained 58.79% of the total variance of the remaining items. The three factors
were labeled as ‘appearance’ (v1.1 to v1.5), ‘work attitude’ (v1.7 and v1.8), and
‘communication skill’ (v1.9 and v1.10). On the other hand, in terms of interpersonal and
organizational skills dimension, six factors were derived from factor analysis with 22
performance items were kept. The six factors explained 65.01% of the total variance of
the remaining items. The six factor were also labeled as ‘empathy’ (v2.1 to v2.3),
‘professional competence’ (v2.4 to v2.6), ‘solving problems’ (v2.10 to v2.14),
‘organizational skill’ (v2.16 to v2.18), ‘environmental protection skill’ (v2.19 to v2.21),
and ‘entertainment introduction skill’ (v2.22 to v2.26). This result also supports existing
theories and the previous research of Zhang and Chow (2004) and Huang et al. (2010).
4.3.3 Confirmatory Factor Analysis and Structural Equation Modeling
The proposed model of this research generally held with data from foreign tourist
sample. The model fit indices after modification suggested 21 error covariance between
items showed that Chi-square/df = 2.744; RMSEA = .062; IFI = .906; CFI = .905; TLI
= .886, demonstrating a reasonable fit between the model and the data (see Table A16
and Figure A1 in Appendix 5). Because of this, no more model modification was
attempted. The error covariance between items could very well reflect the noise between
factors. As shown in Table A17, it can be said that tour guide performance, tourist
satisfaction, and tourist loyalty have significant positive effect on all related items when
all standardized regression weights were higher than .5, showing the achieved
convergent validity.

94
Next, the results of structural equation modeling show that the theoretical model
received an acceptable model fit with chi-square/df = 2.737 (less than 5), CFI = .903
(greater than 0.9), TLI = .886 (not high at standard of .9 recommended levels, but
acceptable at moderate fit (Hair et al., 1995)), IFI = .904 (greater than .9) and RMSEA
= .062 (less than 0.08) (see Figure A2). However, there are four factors that have to be
deleted from the model as the P-value in regression weights (Table 4.3) are higher
than .1, including ‘work’, ‘com’, ‘envi’, and ‘emp’.
Table 4.3: Regression weights of SEM
Estimate S.E. C.R. P Label
satis <--- app .221 .066 3.342 ***
satis <--- work .052 .039 1.337 .181
satis <--- com -.126 .092 -1.371 .171
satis <--- prof .073 .029 2.543 .011
satis <--- solv .121 .054 2.239 .025
satis <--- org .375 .119 3.147 .002
satis <--- envi .023 .042 .544 .586
satis <--- intro .183 .034 5.300 ***
satis <--- emp .035 .041 .855 .393
loyal <--- satis .451 .050 8.995 ***
Source: Developed for this research
After eliminating respectively the above variables, SEM was employed again and the
result was shown in Figure A3, indicating the model was regarded as acceptable. The
following tables (from Table 4.4 to 4.6) also showed the relationship between tour guide
performance and tourist satisfaction as well as tourist satisfaction and destination
loyalty; and the direct and indirect effect of tour guide performance on tourists’
satisfaction and their loyalty.

95
Table 4.4: Regression weights of SEM after deleting four factors of tour guide
performance
Estimate S.E. C.R. P Label
satis <--- app .212 .059 3.613 ***
satis <--- prof .087 .027 3.218 .001
satis <--- solv .104 .050 2.082 .037
satis <--- org .350 .094 3.721 ***
satis <--- intro .186 .034 5.519 ***
loyal <--- satis .453 .050 8.994 ***
Source: Developed for this research
Table 4.5: Standardized regression weights of SEM after deleting four factors of tour
guide performance
Estimate
satis <--- app .187
satis <--- prof .157
satis <--- solv .114
satis <--- org .282
satis <--- intro .243
loyal <--- satis .543
Source: Developed for this research
Table 4.6: Direct and indirect effect of tour guide performance on tourists’ satisfaction
and their loyalty
intro org solv prof app satis
satis .243 .282 .114 .157 .187 .000
loyal .132 .153 .062 .085 .102 .543
Source: Developed for this research
4.3.4 Hypothesis testing
H1: Intrapersonal servability of tour guide is positively related to tourist
satisfaction
This hypothesis suggests that foreign tourists will be more satisfied with a package tour
if tour guide has a positive image of intrapersonal servability.
96
The results of the structural equation modeling in Table 4.4 and 4.5 showed that the
standardized regression weight of the structural path between intrapersonal servability,
which is known by ‘appearance’ (that revealed by the friendliness, clothes, politeness,
honesty, reliability, and personality), and tourist satisfaction was positive and significant
(.187, SE =.059, p=.000), demonstrating that hypothesis 1 is supported by the data. This
finding confirms a positive relationship between intrapersonal servability of tour guide
and tourist satisfaction. In other words, the more positive intrapersonal servability tour
guides have, the more satisfaction the tourists achieve.
H2: Interpersonal servability and organizational skills are positively related to
tourist satisfaction
Hypothesis 2 suggests that foreign tourists will be more satisfied with a package tour if
tour guide has a positive image of interpersonal servability and organizational skills.
In this study, interpersonal servability and organizational skills were understood as
professional competence skill, solving problems skill, introduction skill, and
organizational skills of tour guide.
The results of the structural equation modeling in Table 4.4 and 4.5 showed that the
standardized regression weight of the structural path between professional competence
skill (that revealed by the knowledge of destination’s culture and history, the knowledge
of local people’s lifestyle, and the ability to understand the culture of tourists) and tourist
satisfaction was positive and significant (.157, SE =.027, p=.001). Additionally, the
standardized regression weight of the structural path between solving problems skill
(that revealed by the ability to handle customers’ complaints, the ability to solve any
problems and conflicts, the ability to cope with unexpected incidents, and the ability to
reconcile and show sound judgment in historical arguments among tourists) and tourist
satisfaction was positive and significant (.114, SE =.050, p=.037). The standardized
regression weight of the structural path between introduction skill (that revealed by the
skill to introduce restaurants with tasty and traditional Vietnamese foods, the skill to
introduce traditional or special products, and the skill to introduce interesting
entertainment places and reliable shops) and tourist satisfaction was positive and

97
significant (.243, SE =.034, p=.000). And last, the standardized regression weight of the
structural path between organizational skills (that revealed by the time management skill,
the ability to organize activities in a tour, and the ability to cooperate with other staff)
and tourist satisfaction was positive and significant (.282, SE =.094, p=.000).
In conclusion, the above findings confirm a positive relationship between interpersonal
servability as well as organizational skills of tour guide and tourist satisfaction. In other
words, the more positive interpersonal servability and organizational skills tour guides
have, the more satisfaction the tourists achieve.
H3: Tourist satisfaction is positively related to destination loyalty
This hypothesis suggests that foreign tourists will have the destination loyalty if they are
satisfied with tour guide performance in a package tour.
The results of the structural equation modeling in Table 4.4 and 4.5 showed that the
standardized regression weight of the structural path between tourist satisfaction and
destination loyalty was positive and significant (.543, SE =.050, p=.000).
The finding confirms a positive relationship between tourist satisfaction and tourists’
destination loyalty. In other words, the more positive tourist satisfaction is, the more
destination loyalty level the tourists achieve.
H41 and H42: Intrapersonal servability and interpersonal servability and
organizational skills of tour guides are positively related to destination loyalty of
tourists
The two hypotheses suggest that intrapersonal servability, and interpersonal servability
and organizational skills of tour guides will indirectly lead to the destination loyalty of
tourists in a package tour.
The results of the structural equation modeling in Table 4.6 showed that the indirect
effects of tour guide performance (including intrapersonal servability, and interpersonal
servability and organizational skills) on tourists destination was positive and significant
(.102, .085, .062, .132, .153 respectively). The finding proves a positive relationship

98
between tour guide performance and tourists’ destination loyalty. In other words, the
more positive tour guide performance is, the more destination loyalty level the tourists
achieve.
Nevertheless, in terms of SEM to identify the relationship between constructs, four
factors had been eliminated from the model, including ‘work attitude’, ‘communication
skill’, ‘empathy’, and ‘environmental protection skill’. Although these factors, especially
communication skill and environmental protection skill of tour guide, were raised from
focus group interviews and reality, however, with the availability of the existing data, it
can be said there is not enough evidence to prove the relationship between these factors
and tourist satisfaction in this study. This could be considered as one of the limitations
of the study that will be described fully in the chapter 5.
4.4 Summary and conclusion
Along with the descriptive statistics analysis of foreign tourists, this chapter has
presented the two-stage approach of structural equation modeling to test the theoretical
model. The measurement model was assessed through preliminary exploratory analysis
and confirmatory factor analysis to ensure the model satisfied the first step of structural
equation modeling. The revised theoretical model afterward satisfied the fit conditions
and was used to further analyze the theoretical hypotheses. A summary of the results of
the hypotheses testing is presented in Table 4.7.
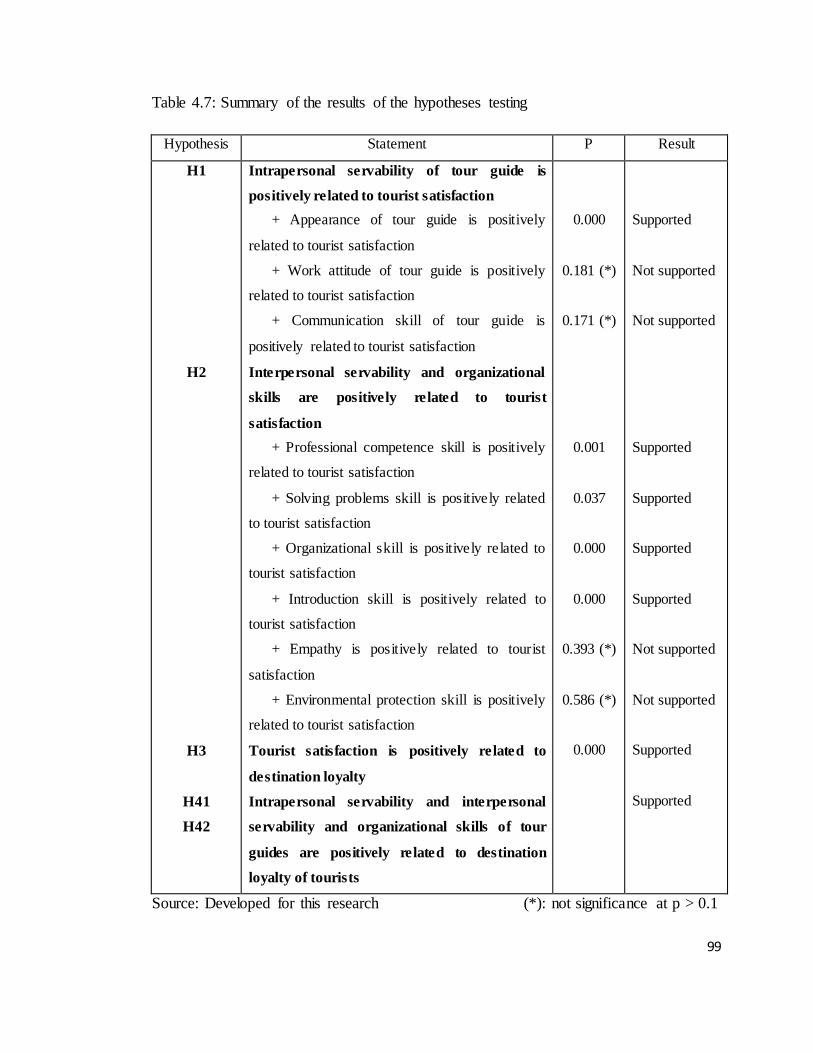
99
Table 4.7: Summary of the results of the hypotheses testing
Hypothesis Statement P Result
H1
H2
H3
H41
H42
Intrapersonal servability of tour guide is
positively related to tourist satisfaction
+ Appearance of tour guide is positively
related to tourist satisfaction
+ Work attitude of tour guide is positively
related to tourist satisfaction
+ Communication skill of tour guide is
positively related to tourist satisfaction
Interpersonal servability and organizational
skills are positively related to tourist
satisfaction
+ Professional competence skill is positively
related to tourist satisfaction
+ Solving problems skill is positively related
to tourist satisfaction
+ Organizational skill is positively related to
tourist satisfaction
+ Introduction skill is positively related to
tourist satisfaction
+ Empathy is positively related to tourist
satisfaction
+ Environmental protection skill is positively
related to tourist satisfaction
Tourist satisfaction is positively related to
destination loyalty
Intrapersonal servability and interpersonal
servability and organizational skills of tour
guides are positively related to destination
loyalty of tourists
0.000
0.181 (*)
0.171 (*)
0.001
0.037
0.000
0.000
0.393 (*)
0.586 (*)
0.000
Supported
Not supported
Not supported
Supported
Supported
Supported
Supported
Not supported
Not supported
Supported
Supported
Source: Developed for this research (*): not significance at p > 0.1

100
The implications of the hypotheses testing results presented in this chapter will be
discussed further in Chapter 5, along with consideration of the study limitations and
future research directions.

101
CHAPTER 5
CONCLUSIONS AND IMPLICATIONS
5.1 Introduction
In the end of Chapter 1, three research questions were identified as follows:
Q1: What are factors influencing tour guide performance in tourism industry in
Vietnam?
Q2: What is relationship between tour guide performance and tourist satisfaction in
tourism industry in Vietnam?
Q3: What is the relationship between tourist satisfaction on tour guide performance
and destination loyalty?
To answer these questions, Chapter 2 reviewed the literature in relation to tour guide
performance, tourist satisfaction, and tourist destination loyalty. Five hypotheses were
proposed to answer the three research questions. Chapter 3 provided details on the
research methodology used in this study. The survey method was used to test the
theoretical model. One pilot study and one main survey were conducted with
independent foreign tourists in Vietnam. This chapter also discussed the analysis
methods used to test the model and considered the ethical aspects of the study.
The previous chapter, Chapter 4 reported the results of the quantitative and qualitative
data analysis by reviewing the data relating to the research questions and the relationship
between the Vietnamese tour guide performance and foreign tourists’ satisfaction as well
as their loyalty in a package tour. The theoretical model was evaluated by using
structural equation modeling which was used to test the hypotheses proposed in Chapter
2. This chapter, Chapter 5, presents the discussion of the research findings, comparing
with the results with those from other existing research. The chapter also discusses the
102
theoretical and practical implications of the research undertaken in this study and, from this,
draws conclusions which are then discussed in detail.
5.2 Conclusions from the research questions
5.2.1 Question 1: What are factors influencing tour guide performance in
tourism industry in Vietnam?
After conducting exploratory factor analysis, 9 factors with 31 items that affect tour
guide performance in the context of Vietnam were generated, including ‘appearance’,
‘work attitude’, ‘communication skill’, ‘empathy’, ‘professional competence’, ‘solving
problems’, ‘organizational skill’, ‘environmental protection skill’, and ‘entertainment
introduction skill’. Comparing with existing literature as well as the research of Zhang
and Chow (2004) on tour guide performance in Hong Kong of Chinese tourists, the
research of Huang et al. (2010) on tour guide performance in Shanghai – China of
foreign tourists, and the research of Chang (2014) on Taiwanese tour guide performance
in the case of tourists from China, it can be said some differences that should be
mentioned have been found as follows:
First, the ‘environmental protection skill’ factor in this research was derived from focus
group interviews and confirmed by EFA with factor loadings of items from .68 to .93
(see Table A15.3). However, this factor was not found in research of Zhang and Chow
(2004), Huang et al. (2010), and Chang (2014). It can be explained by the fact that
environmental problems in Vietnam are current issue while the awareness of Vietnamese
people of keeping environment clean is still poor. In particular, many foreign tourists
complain about this, especially when they are faced with garbage or trashes in
destinations. Moreover, some tour guides did not ask tourists to keep remembering about
environmental protection or they themselves are the people who leave litter in a package
tour.
Second, both research of Huang et al. (2010) and Chang (2014) indicated that ‘sense of
humor’ of tour guide is one of the important factors affecting foreign tourist satisfaction

103
with factor loading of .72 (in the research of Huang et al. (2010)), while in this research
that indicator was only .38. In fact, Vietnamese tour guides are not good in showing a
sense of humor due to their English ability and/or the differences between their and the
tourists’ culture. Because of this reason, along with factor loadings from .35 to .41 of
every item (see Table A15.1), ‘sense of humor’ was eliminated from the model.
Third, research of Zhang and Chow (2004) and Chang (2014) showed that
‘entertainment introduction skill’ is not a significant factor of tour guide performance
because the mean score is much lower than other factors, while Huang et al. (2010)
deleted that factor from their model due to low factor loading indicator. However, in this
research, this factor is significant with factor loadings from .63 to .79 for every item (see
Table A15.3). Many foreign tourists, in particular, agreed that Vietnamese food and
traditional/special products are interesting to try or buy. On the other hand, tour guides
seldom introduced interesting entertainment places (e.g., casino) that many Asian
tourists want to visit.
Fourth, in this research, ‘communication skill’ that measured by language ability and
communication ability is one of the important factor of tour guide perfo rmance with
factor loadings of .58 and .82 (see Table A14.2). It is also indicated by the fact that
many tourists complain about the communication skill of their tour guide during a
package tour. However, in research of Huang et al (2010), this factor was eliminated due
to the low factor loading.
Fifth, research of Zhang and Chow (2004) stated that ‘professional competence’ factor
that included the knowledge of local people’s lifestyle is not important when receiving
one of the lowest mean scores in the study. However, in Vietnamese context, this factor
is significant due to the fact that the country has 54 ethnic groups from the North to the
South, making the diversification in culture in every destination. Understanding the
culture of destination is not only interesting for tourists and but also one of the main
reasons leading to the success of a package tour. Because of this reason, along with
factor loading of .68 to 1 (see Table A15.3), ‘professional competence’ was kept as a
factor of tour guide performance in this research.

104
Last, research of Huang et al. (2010) revealed that ‘appearance’ that including friendly,
punctual, polite, and honest is not a significant factor for tour guide performance when
factor loadings were low, while this factor also received low mean ranking in research of
Zhang and Chow (2004). Nevertheless, in this research, ‘appearance’ is important factor
with factor loadings from .64 to .82 (see Table A14.2). The same result also can be
found in research of Chang (2014). In fact, the appearance of Vietnamese tour guide was
also highly appreciated by foreign tourists.
The results of the findings from tour guide performance attributes, in addition,
reconfirmed the existing literature on the role of tour guide that had been discussed in
Chapter 2. With the above 9 factors influencing tour guide performance, it can be said
that tour guide was considered as an interpreter, an information giver, an organizer, a
navigator, and a cultural broker in a package tour.
5.2.2 Question 2: What is the relationship between tour guide
performance and tourist satisfaction in tourism
industry in Vietnam?
The major objective of the study is to examine the relationship between tour guide
performance and tourist satisfaction, leading to the need of testing the two following
hypotheses:
H1: Intrapersonal servability is positively related to tourist satisfaction
H2: Interpersonal servability and organizational skills are positively related
to tourist satisfaction
Initially, it can be said that three constructs of tourist satisfaction were satisfied as
shown by the validity and reliability test, as shown by the EFA model in chapter 4. This
result is also supported by the research of Huang et al. (2010). In general, the findings
confirmed that the above hypotheses were significantly supported by the data. However,
some points to be discussed are as follows:

105
First, in order to measure the relationship between tour guide performance and tourist
satisfaction by using CFA and SEM, two factors of intrapersonal servability construct
had been eliminated from the model, including ‘work attitude’ and ‘communication
skill’, due to the P-value is higher than .1, leading to the result that intrapersonal
servability of tour guide is only revealed by ‘appearance’ factor. ‘Work attitude’ factor,
in other research of Wong (2001), Zhang and Chow (2004), and Huang et al. (2010),
was also removed when examining the relationship between tour guide
performance/attribute and tourist satisfaction. However, ‘communication skill’ was
emphasized in some research, such as Wong (2001) and Chang (2014), while research of
Huang et al. (2010) deleted this factor after conducting CFA and SEM. In particular,
although communication skill of tour guide in Vietnam, which is primarily measured by
language proficiency, has been raised in focus group interviews, the result of CFA and
SEM has rejected the factor based on the P-value. It can be explained that there is not
enough evidence to prove the relationship between this factor and tourist satisfaction in
the context of Vietnam, however, it will be different from the other contexts, for
example Hong Kong, from the research of Chang (2014). This result, therefore, is also
considered as one of the findings of the study.
Second, in terms of the construct of interpersonal servability and organizational skills,
two factors were eliminated from the model, including ‘empathy’ and ‘environmental
protection skill’. This result is consistent with the findings from existing literature when
the factor was also removed in research of Zhang and Chow (2004), Huang et al. (2010),
and Chang (2014). The ‘environmental protection skill’ factor, in this research, is a new
factor derived from focus group interviews and has not been mentioned in other existing
research. Unfortunately, this factor, again, was removed because the P-value is higher
than .1. It can be explained that there is not enough evidence to prove the relationship
between the factor and tourist satisfaction in the context of Vietnam. However, in future
research, especially research on developing countries, this factor might be raised because
environment is becoming one of the hot issues in these countries.
The four remaining factors related to interpersonal servability and organizational skills
that influence tourist satisfaction found after conducting CFA and SEM are ‘professional

106
competence’, ‘solving problems’, ‘organizational skill’, and ‘entertainment introduction
skill’. The first three factors were also supported by existing literature by research of
Wong (2001), Zhang and Chow (2004), Huang et al. (2010), and Chang (2014).
Especially, the last factor, ‘entertainment introduction skill’ is considered as a new
factor that has not been studied by other researchers. Research of Zhang and Chow
(2004) and Huang et al. (2010) partly mentioned this factor by measuring the unique
item ‘introduce reliable shop to customers’. Therefore, it can be said that exploring this
factor in the relationship with tourist satisfaction is one of the contributions of the study.
In conclusion, the proposed research model on the relationship between tour guide
performance and tourist satisfaction presented in chapter 2 is revised to be the final
model as shown in Figure 5.1.

107
Figure 5.1: The effect of tour guide performance on tourist satisfaction
Source: Developed for this research
The above figure also indicates the level of effect of each attribute of tour guide
performance on tourist satisfaction. Specifically, organizational skill of tour guide,
including the skill of time management, the skill of activities organization, and the skill
of cooperation with other staff, has the strongest effect on tourist satisfaction. This result
emphasizes the role of tour guide as a tour organizer and is consistent with the result of
other authors (Cohen, 1985; Weiler and David, 1993; Howard et al., 2001; Huang et al.,
2010).
Tour guide
performance
Appearance
Professional
competence skill
Solving
problems skill
Organizational
skill
Entertainment
introduction
skill
Tourist
satisfaction
0.187
0.157
0.114
0.282
0.243

108
5.2.3 Question 3: What is the relationship between tourist satisfaction on
tour guide performance and destination loyalty?
In order to examine the relationship between tourist satisfaction and destination loyalty
as well as the relationship between tour guide performance and destination loyalty, the
three following hypotheses have been tested:
H3: Tourist satisfaction is positively related to destination loyalty
H41 and H42: Intrapersonal servability and interpersonal servability and
organizational skills of tour guides are positively related to
destination loyalty of tourists
The findings showed that hypothesis H3 was supported by the SEM result, with
coefficient of .543 and p=.000. This means that in order to build the destination loyalty
of foreign tourists as well as the image of the country in terms of tourism, it is needed to
increase the level of satisfaction of tourists in a package tour. This finding was also
consistent with the existing literature when many authors agreed that tourist satisfaction
with travel experiences contributes to destination loyalty (Oppermann, 2000; Alexandris
et al., 2006; Faullant et al., 2008; Truong and King, 2009; XiaoXia et al., 2013).
The findings of the study, moreover, showed that hypotheses H41 and H42 were
supported by the SEM result. This means that tour guide performance contributes to the
destination loyalty of foreign tourists. This finding can be considered as one of the
contributions of the study as no existing research had examined this relationship. The
result also showed the level of effect of each tour guide performance’s attribute on
destination loyalty of tourists as shown in Figure 5.2.

109
Figure 5.2: The effect of tour guide performance and tourist satisfaction on destination
loyalty of foreign tourists
Source: Developed for this research
Figure 5.2 again demonstrates the significance of organizational skill of tour guide as it
has the strongest effect on destination loyalty of tourists. Organizational skill of tour
guide, therefore, not only is the largest influence to tourists’ satisfaction but also
tourists’ destination loyalty. This finding is one of the important foundations to carry out
the implications for the study in the next section.
Appearance
Professional
competence skill
Solving
problems skill
Organizational
skill
Entertainment
introduction
skill
Tourist
satisfaction
0.187
0.157
0.114
0.282
0.243
Destination
loylaty 0.543
0.102
0.085
0.062
0.153
0.132

110
5.3 Contributions of the research findings
5.3.1 Theoretical contribution
Tourist satisfaction and destination loyalty have gained great attention in the literature
on tourism research. This research stream, however, has not yet reached a consensus
about the relationship between tour guide performance and destination loyalty. Most
research has been conducted in the relationship between tourist satisfaction in general
and destination loyalty of tourists and, in particular, the performance of tour guide has
been left out of the factors that affect both tourist satisfaction and destination loyalty,
which has been recognized as a knowledge gap in the research on tourism. In order to
make a contribution to overcoming this gap, this study has focused on the issue of
tourist satisfaction and destination loyalty from the perspective of tour guide
performance.
The study has confirmed support of the theoretical model proposed for this study. The
findings show that intrapersonal servability, interpersonal servability, and organizational
skill of tour guide are all sub-dimensions of tour guide performance. This study contributes
to the complete picture of tour guide performance, which consists of 9 factors, from the
perspective of foreign tourists. Following Zhang and Chow (2004), Huang et al. (2010),
and Chang (2014), this study has investigated the concept of tour guide performance and
the relationship among tour guide performance, tourist satisfaction, and destination loyalty.
It has found that organizational skill of tour guide is the most important dimension of tour
guide performance that affects both tourist satisfaction and destination loyalty. This finding
of the study indicates that tour guides should focus on their organization skill, including
time management, activities organization, and cooperation with other staff, in order to build
their image, which contributes to the satisfaction of foreign tourists and their destination
loyalty as well as the success of a package tour. In addition, by measuring and assessing the
nine key components of tour guide performance, tour guides can evaluate how significant
their role is from foreign tourist’s perspective. This can act as a performance ‘health check’,
as the measurement scale of tour guide performance that can be adapted to test using other
markets from various of countries, even in Vietnam, to see how important a tour guide is

111
from the tourist’s perspective. The results of performance health checking will not only help
tour guides to identify what attributes of their performance need to be improved, but also
help tour managers/tour operators to find out ways to improve the competence of tour guides
in order to satisfy the clients.
The second contribution of the study is that it contributes to filling the gap related to the
effect of tour guide performance on tourists’ destination loyalty. The findings indicate that
both tour guide performance has a positive and significant effect on tourist’s destination
loyalty. The current study is one of the first known studies in the tourism literature to focus
on this issue. Moreover, organizational skill and entertainment introduction skill of tour
guide have the highest effect on destination loyalty of tourists. This contribution will help
tour guides and tour managers/tour operators understand the important role of all tour guide
performance dimensions. Therefore, based on short-term or long-term strategies, tour
managers/tour operators can focus on different dimensions of tour guide to improve their
performance in a package tour. Furthermore, combined with performance health checks,
tour managers/tour operators can track how their business image is positioned in the tourism
sector and determine what programs related to reinforce tour guide performance (e.g.
training) need to be put in place to support tour guides in improving their competence in
order to build the tourists’ destination loyalty in the future.
5.3.2 Methodological contribution
A number of contributions to methodology have been made by this study. First ly, all the
scales used to measure the constructs in this study, including tour guide performance, tourist
satisfaction, and destination loyalty were developed and tested in various countries such as
Hong Kong (Zhang and Chow, 2004), China (Huang et al., 2010), and Taiwan (Chang,
2014). This study makes a contribution to the literature by modifying and testing them
within the context of a developing country – Vietnam. The findings confirmed that most of
the instruments adapted from studies conducted in other countries satisfied the reliability
and validity of measures in the developing market, although some items were deleted to suit
the tourism sector in terms of inbound customers in Vietnam.
Secondly, the two-step approach in structural equation modeling has been used in this study
as an effective tool for testing the measurement and the structural model. This study

112
provides further evidence of the effectiveness of applying structural equation modeling to
marketing research.
The following section outlines and discusses the practical implications of the research
outcomes from the perspective of tour guide and tour manager/tour operator.
5.4 Implications of the research
Tour guide performance is one of the keys concern to the success of a package tour. This
study has focused on tour guide performance from the foreign tourist’s perspective and its
effects on tourist satisfaction as well as destination loyalty of tourists. The results of this
study suggest a number of implications for tour guide and tour manager/tour operator.
The study provides some guidance on strategies from the tour guide performance
perspective. The current research has also indicated that good tour guides are based on five
components: organizational skill, entertainment introduction skill, appearance, professional
competence skill, and solving problems skill. Moreover, tour guide performance is
significantly and positively related to tourist satisfaction and destination loyalty. First, in
terms of organizational skill, tour guides should concentrate on improving the ability on
time management and activities organization by understanding deeply about the package
tour they are guiding. Tour manager/tour operator, at the same time, has to design the
appropriate program for a tour in terms of schedule and activities. Tour guides, on the other
hand, have to build a good relationship with other staff, for example, driver, or domestic tour
guide in the destination, or staff in hotels. Moreover, foreign tourists in the country mostly
love to try Vietnamese food as well as entertainment spaces, leading to the fact that tour
guides should have the skill to introduce them to reliable places by improving and updating
the newest and interesting restaurants, festivals, shopping malls, casinos, etc.
Second, in terms of professional competence skill, tour guides need to enhance the
knowledge of the destination’s culture and history as well as the knowledge of culture of
customers they are serving by learning and reading books/news/magazines. Tour
manager/tour operator, therefore, might also provide internal short courses to improve this
knowledge for tour guides. Additionally, the ability of tour guides to handle complaints and
to solve problems or conflicts in the tour is a significant factor leading to the success of a

113
package tour. Because of this reason, tour guides have to be keen to realize all of abnormal
things that happened in a tour. They also should show sound judgment in solving the
problems to avoid the disagreement among tourists that may break the tour’s atmosphere.
Consequently, understanding the culture of tourists in various countries, again, is an
important skill of tour guides.
Third, in terms of appearance, it can be said that tour guides should practice showing their
honest, good personality, friendliness that lead to the reliability from foreign tourists. For
this reason, the role of tour manager/tour operator is also very important in providing
training programs for tour guides. Tour guides, moreover, should attach much importance to
their clothes to be neat and appropriate.
Last, the study also shows an implication for the people who are leaders in tourism industry
in Vietnam. In company with the endeavor of tour guides and the support from tour
manager/tour operator, there should be a new and innovate system/certificate to evaluate a
qualified tour guide for inbound market. That system/certificate has to stress the significant
knowledge and skills of tour guide, including the knowledge of culture and history of
destinations, the knowledge of understanding culture of foreign tourists, the skill of solving
problems and conflicts, the skill of time management and activities organization, and the
skill of introduction traditional food and entertainment places. This not only fulfills the tour
guide attributes but also enhances the level of foreign tourists’ satisfaction in a package tour
and increases their level of destination loyalty.
5.5 Limitations of the research and further research
As with any research, this study has several limitations, suggesting that different approaches
for future research may be useful when further exploring the issues investigated in this study.
These limitations must also be acknowledged as having the potential to affect the direct
generalization of the study findings beyond the context of the current research.
First of all, the measurement of tour guide performance, which comprised communication
skill and environmental protection skill, needs further investigation to confirm whether they
are important in tourist satisfaction and destination loyalty. Communication skill and
environmental protection skill scales were adapted to measure satisfaction of tourists in this

114
study because they have been the most common measures used in the literature (Cohen,
1985; Weiler and David, 1993), and they also had been found in focus group interviews of
the current research. However, the results of this study were unexpected as these skills of
tour guide were not found to be significant factors. Therefore, it is suggested that other
measures of communication skill and environmental protection skill should be explored in
further research. In addition, expanding sample size and number of tourism destinations in
further research might also be considered to apply to test and confirm whether
communication skill and environmental protection skill do in fact play important role in the
relationship with tourist satisfaction and destination loyalty.
Secondly, this study has focused on foreign tourists in big cities/provinces that attract many
customers to build the model. This type of destinations has significantly different
characteristics that may influence the role and the performance of tour guide. Consequently,
the evaluation of tourists in this research cannot be generalized to the whole population of
tourists in various destinations in Vietnam. It would therefore be useful to conduct empirical
research on different destinations to make further improvements and refinements on the
model of the relationship between tour guide performance and tourist satisfaction.
Furthermore, as the research has specifically focused on foreign tourists in the context of
Vietnam, it is acknowledged that the results may not be generalized directly to all other
countries.
Finally, because the data were collected through a questionnaire survey, the researc h
may suffer from common method variance effect. On the other hand, the sample size
was also not large enough to verify the factor structures derived with a CFA. Moreover,
because data collection was not fully completed by researcher himself, the non-response
bias could not be effectively controlled. Therefore, further studies can test the
dimensions of tour guide performance in other ethnic and cultural contexts with a larger
size of sample, in company with the data should be collected by the researcher only. In
Vietnam’s tourism industry, tour guides’ unethical behaviors have caused many public
debates and drawn policy makers’ attention. Future studies of tour guides could also
explore the impacts of tour guides’ abnormal or unexpected behaviors on tourist
satisfaction.

115
5.6 Conclusion
This study has confirmed the re lationship among tour guide performance, foreign tourists’
satisfaction, and destination loyalty of foreign tourists in a package tour in the context of
Vietnam. The study also proposed a multidimensional construct consisting of five
components of tour guide performance (organizational skill, entertainment introduction skill,
appearance, professional competence skill, and solving problems skill). These components
can be found as the most effective factors for building the tourist satisfaction and destination
loyalty. The positive image of tour guide performance is not only positively and
significantly related to the satisfaction of tourists but also is one of the factors that determine
the destination loyalty of customers. The study, moreover, has proposed a number of
suggestions for both tour guide and tour manager/tour operator in order to identify the
advantages and disadvantages of tour guide attributes in a tourism company, and then to
foster and enhance the performance of employees to reach the higher level of customers’
satisfaction as well as their destination loyalty. The suggestions, in addition, also help the
policy makers in Vietnam to set up an innovative standard system of qualifications for
inbound tour guide staff that appropriated worldwide standard in global perspective. Tour
guide performance, in fact, is not only the factor affects the success of a package tour, but
also plays an important role to build the image of the tourism industry in Vietnam.
116
List of References
Aaker, D., Kumar, V. and Day, G. S. (1995), Marketing Research: 5th ed. John Wiley &
Sons, Inc.New York.
Alexandris, K., Kouthouris, C. and Meligdis, A. (2006), ‘Increasing Customers’ Loyalty
In A Skiing Resort: The Contribution Of Place Attachment And Service Quality’,
International Journal of Contemporary Hospitality Management, 18 (5), pp. 414-425.
Anderson, J. C. and Gerbing, D. W. (1988), ‘An Update Paradigm For Scale
Development Incorporating Unidimensionality And Its Assessments’, Journal of
Marketing Research, 25 (2), pp. 186-192.
Ansett Airlines of Australia (1977), ‘Submission To Select Committee On Tourism’,
House of Representatives Select Committee on Tourism, Official Hansard Reports,
Canberra: Commonwealth Government Printer pp. 766-829.
Antony, F. and Ghosh, S. (2004), ‘Evaluating Service Quality In A UK Hotel Chain: A
Case Study’, International Journal of Contemporary Hospitality Management, 16, pp.
380-384.
Aloudat, A. S. (2010), The World View Of Tour Guides: A Grounded Theory Study. PhD
thesis, University of Bedfordshire.
Australian Department of Tourism and Recreation (1975), Development Of Tourism In
Australia, Australian Government Publishing Service.
Babbie, E. (1995), The Practice Of Social Research. Belmont, CA: Wadsworth
Publishing.
Bagozzi, R. P. (1994), ‘The Effects of Arousal On the Organization Of Positive And
Negative Affect And Cognitions: Application To Attitude Theory, Structural Equation
Modeling, 1, pp. 222-52.

117
Bagozzi, R. P. and Foxall, G. R. (1996), ‘Construct Validation Of A Measure Of
Adaptive-Innovative Cognitive Styles In Consumption, International Journal of
Research in Marketing, 13, pp. 201-213.
Ballantyne, R., and Hughes, K. (2001), ‘Interpretation In Ecotourism Settings:
Investigating Tour Guides’ Perceptions Of Their Role, Responsibilities And Training
Needs’, The Journal of Tourism Studies, 1 (2), pp. 2-9.
Ballantyne, R., Packer, J., and Axelsen, M. (2009), ‘Trends In Tourism Research’,
Annals of Tourism Research, 36 (1), pp. 149-152.
Baloglu, S., Pekcan A., Chen, S. L. and Santos, J. (2003), ‘The Relationship Between
Destination Performance, Overall Satisfaction, And Behavioral Intention For Distinct
Segments’, Journal of Quality Assurance in Hospitality and Tourism, 4, pp. 149-165.
Baum, T. (1997), ‘Making Or Breaking The Tourist Experience: The Role Of Human
Resource Management’, in C. Ryan (ed.), The Tourist Experience: A New Introduction,
Cassell, pp. 92-111.
Baum, T. (2002), ‘Skill And Training For The Hospitality Sector: A Review Of Issues’,
Journal of Vocational Education and Training, 54 (3), pp. 343-364.
Baum, T. (2007), ‘Human Resource In Tourism: Still Waiting For Change’, Tourism
Management, 28, pp. 1383-1399.
Baum, T. (2012), ‘Human Resource Management In Tourism: A Small Island
Perspective’, International Journal of Culture, Tourism and Hospitality Research, 6 (2),
pp. 124-132.
Baum, T. and Hagan, L. (1999), ‘Responses To Seasonality In Tourism: The
Experiences Of Peripheral Destinations’, Paper presented at International Tourism
Research Conference on Peripheral Area Tourism, Bornholm.

118
Baumgarther, H. and Homburg, C. (1996), ‘Application Of Structural Equation
Modeling In Marketing And Consumer Research: A Review, International Journal of
Research in Marketing, 13 (2), pp. 139-61.
Beck, L. C, Trombetta, W. L. and Share, S. (1986), ‘Using Focus Group Sessions Before
Decisions Are Made’, North Carolina Medical Journal, 47 (2), pp.73-74
Berman, J. M. (2004), ‘Industry Output And Employment Projections To 2012’,
Monthly Labor Review, 127 (2), pp. 58–79.
Berry, L. L., Zeithaml, V. A. and Parasuraman, A. (1989), ‘Five Imperatives For
Improving Service Quality’, Sloan Management Review, pp. 89-91.
Bhat, M. A. (2012), ‘Tourism Service Quality: A Dimension-Specific Assessment Of
SERVQUAL’, Global Business Review, 13 (2), pp. 327-37.
Biernacki, P. and Waldord, D. (1981), ‘Snowball Sampling: Problems And Techniques
Of Chain Referral Sampling’, Socio Logical Methods and Research 10 (November), pp.
141-63.
Binh, N. (2010), ‘Vietnam Placed Among Top Growth Tourism Markets in Asia’, The
Saigon Times Daily, 2010, available at
http://english.thesaigontimes.vn/Home/business/tourism/13167/ (accessed on 8/3/2012).
Black, R. and Weiler, B. (2005), ‘Quality Assurance And Regulatory Mechanisms In
The Tour Guiding Industry: A Systematic Review’, The Journal of Tourism Studies, 16
(1), pp. 24-37.
Bollen, K. A. (1989), Structural Equation With Latent Variables, John
Wiley&Sons.New York.
Bouma, G. D (2001), The Research Process, 4th ed., Oxford University Press,
Melbourne

119
Bramwell, B. (1998), ‘User Satisfaction And Product Development In Urban Tourism’,
Tourism Management, 19 (1), pp. 35-47.
Bras, K. (2000), ‘Image-Building And Guiding On Lombok: The Social Construction Of
A Tourist Destination’, PhD dissertation. Tilburg University, The Netherlands.
Brodigan, D. L (1992), Focus Group Interviews: Applications For Institutional
Research, Carleton College, Institutional Research, Carleton, MN.
Bryne, B. M. (1989), A Primer of LISREL: Basic Application and Programming for
Confirmatory Factor Analytic Models, Springer-Varlag. New York.
Buckley, R. (2012), ‘Sustainable Tourism: Research And Reality’, Annals of Tourism
Research, 39 (2), pp. 528-546.
Byrne, B. M. (2005), ‘Factor Analytic Models: Viewing The Structure Of An
Assessment Instrument From Three Perspectives’, Journal of Personality Assessment,
85 (1), 17-32.
Campos-Soria, J. A., Garcia, L. G. and Garcia, M. A. R. (2005), ‘Service Quality And
Competitiveness In The Hospitality Sector’, Tourism Economics, 11, pp. 85-102.
Carey, L. E. (1999), ‘Ethical Dimensions Of A Strategic Approach To HRM: An
Australian Perspective’, Asia Pacific Journal of Human Resources, 37, pp. 53-69.
Carmel, H. and Lester, W. J. (2010), ‘The Relationship-Service-Profit Chain:
Conceptual Framework And Propositions’, International Journal of Services Technology
and Management 14 (2), pp. 144-162.
Chan, A. (2004), ‘Towards An Improved Understanding Of Tour Services And Customer
Satisfaction In Package Tours’, Paper presented at the Second Asia-Pacific CHRIE
(APacCHRIE) Conference and Sixth Biennial Conference on Tourism in Asia, Phuket,
Thailand.

120
Chan, L. L. M., Shaffer, M. A. and Snape, E. (2004), ‘In Search Of Sustained
Competitive Advantage: The Impact Of Organizational Culture, Competitive Strategy
And Human Resource Management Practices On Firm Performance’, International
Journal of Human Resource Management 15 (1), pp. 17–35.
Chang, K. C (2014), ‘Examining The Effect Of Tour Guide Performance, Tourist Trust,
Tourist Satisfaction, And Flow Experience On Tourists' Shopping Behavior’, Asia
Pacific Journal of Tourism Research, 19 (2), pp. 219-47.
Chen, C. and Chen, F. (2010), ‘Experience Quality, Perceived Value, Satisfaction And
Behavioral Intention For Heritage Tourists’, Tourism Management, 31, pp. 29-35.
Chen, C. C and Lin, Y. H. (2012), ‘Segmenting Mainland Chinese Tourists To Taiwan
By Destination Familiarity: A Factor-cluster Approach’, International Journal of
Tourism Research, 14 (4), pp. 339-352.
Chen, C.F., and Chen, F.S. (2010), ‘Experience Quality, Perceived Value, Satisfaction
And Behavioral Intentions For Heritage Tourists’, Tourism Management, 31, pp. 29-35.
Cheng, C., Li, X., Petrick, J. F. and O’Leary, J. T. (2011), ‘An Examination Of Tourism
Journal Development’, Tourism Management, 32 (1), pp. 53-61.
Cho, S., Woods, R. H., Jang, S. and Erdem, M. (2006), ‘Measuring The Impact Of
Human Resource Management Practices On Hospitality Firms’ Performances’,
International Journal of Hospitality Management, 25, pp. 262-277.
Christina, G. C. and Hailin, Q. (2008), ‘Examining The Structural Relationship Of
Destination Image, Tourist Satisfaction And Destination Loyalty: An Integrated
Approach’, Journal of Tourism Management, 29, pp. 624-636.
Churchill, G. A. (1979), A Paradigm For Developing Better Measures Of Marketing
Constructs’, Journal of Marketing Research, 16, pp. 64-73.
121
Cohen, E. (1985), ‘The Tourism Guide: The Origins, Structure And Dynamics Of A
Role’, Annals of Tourism Research, 12, pp. 5-29.
Cohen, E. (2012), ‘Globalization, Global Crises And Tourism’, Tourism Recreation
Research, 37 (2), pp. 103-111.
Cohen, L. and Manion, L. (1994), Research Methods in Education, Fourth Edition,
Routiedge.
Crompton, J. and Love, L. (1995), ‘The Predictive Validity Of Alternative Approaches
To Evaluating Quality Of A Festival’, Journal of Travel Research, 34, pp. 11-24.
Cronin, J. J., Brady, M. K. and Hult, G. T. M. (2000), ‘Assessing The Effects Of Quality,
Value And Customer Satisfaction On Consumer Behavioral Intentions In Service
Environment’, Journal of Retailing, 76 (2), pp. 193-218.
Cuccia, T. and Rizzo, I. (2011), ‘Tourism Seasonality In Cultural Destinations:
Empirical Evidence From Sicily’, Tourism Management, 32 (3), pp. 589-595
D’Annunzio-Green, Maxwell, G. and Watson, S. (2002), Human Resource
Management: International Perspectives in Hospitality and Tourism, Thomson Learning,
London.
Davis, D. (2000), Business Research for Decision Making, Canada Brooks/Cole:
Thomson.
Davidson, M. C. G., McPhail, R. and Barry, S. (2010), ‘Hospitality HRM: Past, Present
And The Future’, International Journal of Contemporary Hospitality Management, 23
(4), pp. 498-516.
Davies, D., Taylor, R. and Savery, L. (2001), ‘The Role Of Appraisal, Remuneration
And Training In Improving Staff Relations In The Western Australian Accommodation
Industry: A Comparative Study’, Journal of European Industrial Training, 25 (6/7), pp.
366–374.

122
DeVellis, F. R. (1991), Scale Development: Theory And Applications, Sage. Newbury
Park, CA
Dey, I. (1993), Qualitative Data Analysis: A User Friendly Guide For Social Scientists,
Routledge, London.
Duyen, H. (2009), ‘Human Resources For Tourism – Redundant Yet Deficient’,
VNExpress Newspaper, 2010, available at http://vnexpress.net/gl/xa-hoi/giao-
duc/2009/11/3ba15fc2/ (accessed on 1/5/2012).
Ekinci, Y. (2002), ‘A Review Of Theoretical Debates On The Measurement Of Service
Quality: Implications For Hospitality Research’, Journal of Hospitality & Tourism
Research, 26 (3), pp. 199–216.
Ekinci, Y. (2003), ‘Which Comparison Standard Should Be Used For Service Quality
And Customer Satisfaction?’, Journal of Quality Assurance in Hospitality & Tourism, 4,
pp. 61-75.
Elmore, P. E. and Beggs, D. L. (1975), ‘Salience Of Concepts And Commitment To
Extreme Judgements In Response Pattern Of Teachers’, Education, 95 (4), pp. 325-334.
Enz, C. (2009), ‘Key Issues Of Concern In The Lodging Industry: What Worries
Managers’, Cornell Hospitality Report, 9 (4), pp. 1-17.
Euromonitor (2009), Vietnam Tourism Flows Inbound, Euromonitor International, 2009.
Euromonitor (2011), Travel and Tourism in Vietnam 2011, Euromonitor International:
Country Market Insight, 2011.
Faullant, R., Matzler, K. and Fuller, J. (2008), ‘The Impact Of Satisfation And Image On
Loyalty: The Case Of Alpine Ski Resorts’, Managing Service Quality, 18 (2), pp. 163-
178.
Fennell, D. (2013), ‘The Ethics Of Excellence In Tourism Research’, Journal of Travel
Research, 52, pp. 417-25.

123
Field, A. (2005), Discovering statistics using SPSS, London, UK: Sage Publications Ltd.
Font, X. and Buckley, R. C. (2001), Tourism Ecolabelling: Certification And Promotion
Ofsustainable Management, Wallingford, Oxon, UK: CABI Publishing.
Fornell, C. (1982), A Second Generation Of Multivariate Analysis: An Overview. A
Second Generation Of Multivariate Analysis: Methods. In C. Fornell, (Ed.). Praeger. 1.
Fornell, C., Johnson, M. D., Anderson, E. W., Cha, J. and Bryant, B. E. (1996), ‘The
American Customer Satisfaction Index: Nature, Purpose, And Findings’, Journal of
Marketing, 60, pp. 7-18.
Fuchs, M. and Weiermair, K. (2004), ‘Destination Benchmarking: An Indicator-
System’s Potential For Exploring Guest Satisfaction’, Journal of Travel Research, 42 (3),
pp. 212–225.
Gaborit, A. (2001), Northern Territory Brolga Awards, Darwin, Northern Territory:
Institute of Australian Tour Guides Association.
Gerbing, D. W., and Anderson, J. C. (1988), ‘An Update Paradigm For Scale
Development Incorporating Unidimensionality And Its Assessments. Journal of
Marketing Research, 25 (2), pp. 186-92.
Geva, A. and Goldman A. (1991), ‘Satisfaction Measurement In Guided Tours’, Annals
of Tourism Research, 18, pp. 177-185.
Glaser, B. G (1992), Basic of Grounded Theory Analysis, California: The Sociology
Press.
Goeldner, C. R. and Ritchie, J. R. B. (2012), Tourism: Principles, Practices,
Philosophies, John Wiley & Sons, New York, 12th edition.
Goodwin, C. and Ross, I. (1990), ‘Consumer Evaluations Of Responses To Complaints:
What’s Fair And Why?’, Journal of Consumer Marketing, 7 (2), pp. 39-47.

124
Grant, C., Simon, W. and Lucinda, H. (2008), ‘Training And Service Quality – A Case
Study Analysis Of Regional Australian Restaurants’, Tourism and Hospitality Planning
and Development, 5 (2), pp. 149-163
Gronroos, C. (1984), ‘A Service Quality Model And Its Marketing Implications’,
European Journal of Marketing, 18 (4), pp. 36–44.
Guild of Registered Tourist Guides (2001), Code Of Conduct, London, UK: Guild of
Registered Tourist Guides.
Ha, L. T. (2010), ‘Tourism Contributes Indirectly 738,600 Billion VND To GDP In
2020’, Electronic Culture Newspaper – Ministry of Culture, Sports, and Tourism, 2010,
available at http://www.baomoi.com/Home/DuLich/www.baovanhoa.vn/Du-lich-dong-gop-
gian-tiep-738600-ty-dong-vao-GDP-nam-2020/5338601.epi (accessed on 28/4/2012).
Hanquin, Z. Q., Lam, T. and Bauer, T. (2001), ‘Analysis Of Training And Educational
Needs Of Mainland Chinese Tourism In The Twenty-First Century’, International
Journal of Contemporary Hospitality Management, 13 (6), pp. 274–280.
Hair, J. F., Anderson, R.E., Tatham, R.L., & Black, W.C. (1995), Multivariable Data
Analysis Reading, USA: Prentice Hall International Editions.
Hair, J., Black, W., Babin, B., & Anderson, R. (2010), Multivariate Data Analysis
(Seventh ed.), Upper Saddle River, NJ: Prentice Hall.
Hair, J. F., Jr, Bush, R. P. and Ortinau, D. J. (2006), Marketing Research Within A
Changing Information Environment, 3ed., New York: McGraw-Hill Irwin.
Henderson, J. (2003), ‘Ethnic Heritage As A Tourist Attraction: The Peranakans Of
Singapore’, International Journal of Sustainable Development and World Ecology, 1,
pp.22-23.
Henry, G. T. (1990), Practical Sampling, New-Bury Park, CA: Sage Publications

125
Heung, V. C. S (2008), ‘Effects Of Tour Leader's Service Quality On Agency's
Reputation And Customers' Word-Of-Mouth’, Journal of Vacation Marketing, 14 (4),
pp. 305-15.
Heung, V. C. S., Wong, M. Y. and Qu, H. (2000), ‘Airport-Restaurant Service Quality
In Hong Kong: An Application Of SERVQUAL’, Cornell Hotel and Restaurant
Administration Quarterly, 41, pp. 86-96.
Hoa, P. T. (2011), Tourism interview personal communication
Holjevac, I. A. (2003), ‘A Vision Of Tourism And The Hotel Industry In The 21 st
Century’, Hospitality Management, 22, pp. 129-134
Hooper, D., Coughlan, J., and Mullen, M. (2008), ‘Structural Equation Modelling:
Guidelines For Determining Model Fit’, Electronic Journal of Business Research
Methods, 6 (1), pp. 53-60.
Houge M. S. and Kerr, J. H. (2013), ‘Stress And Emotions At Work: An Adventure
Tourism Guide’s Experiences’, Tourism Management, 36, pp. 3-14.
Howard, J., Thwaites, R. and Smith, B. (2001), ‘Investigating The Roles Of Indigenous
Tour Guides’, The Journal of Tourism Studies, 12 (2), pp. 32-39.
Howey, R. M., Savage, K. S., Verbeeten, M. J. and Hoof, H. B. V. (1999), ‘Tourism
And Hospitality Research Journals: Cross-Citations Among Research Communities’,
Tourism Management, 20, pp. 133–139.
Hoyle, R. H. (1995), Structural Equation Modeling,. Thousand Oaks, CA: SAGE
Publications, Inc.
Hu, W. and Wall, G. (2013), ‘Tour Guide Management In Hainan, China: Problems,
Implications And Solutions’, Asia Pacific Journal of Tourism Research, 18 (3), pp. 205-
19.

126
Huang, S., Cathy, H. C. and Chan, A. (2010), ‘Tour Guide Performance And Tourist
Satisfaction: A Study Of The Package Tours In Shang Hai’, Journal of Hospitality and
Tourism Research, 34, pp. 3-33.
Huang, S. and Weiler, B. (2010), ‘A Review And Evaluation Of China's Quality
Assurance System For Tour Guiding’, Journal of Sustainable Tourism, 18 (7), pp. 845-
60.
Hughes, H. and Allen, D. (2005), ‘Cultural Tourism in Central And Eastern Europe: The
Views Of Induce Image Formation Agents’, Tourism Management 26 (2), pp. 173-183.
Hung-Jen Su, Kong-Fah Cheng and Hui-Hsiung Huang (2011), ‘Empirical Study Of
Destination Loyalty And Its Antecedent: The Perspective Of Place Attachment’, The
Service Industries Journal, 31:16, pp. 2721-39
Hunt, S. D., Parkman, R. D. and Wilcox, J. B. (1982), ‘The Pretest In Survey Research:
Issues And Preliminary Findings’, Journal of Marketing Research, 19 (2), pp. 269-73.
Hurmerinta, P. L., and Nummela, N. (2006), ‘Mixed Methods In International Business
Research: A Value-Added Perspective’, Management International Review, 46 (4), pp.
439-459.
Hussey, J. and Hussey, R. (1997), Business Research: A Practical Guide For
Undergraduate And Postgraduate Students, Macmillan Press Ltd.
Issaverdis, J. P. (2001), ‘The Pursuit Of Excellence: Benchmarking, Accreditation, Best
Practice And Auditing’, In D. Weaver (Ed.), The Encyclopedia of Ecotourism, pp. 579-
94), Oxford, UK: CAB International
Jamal, T., Smith, B. and Watson, E. (2008), ‘Ranking, Rating And Scoring Of Tourism
Journals: Interdisciplinary Challenges And Innovations’, Tourism Management, 29, pp.
66-78

127
Jean-Jacques, N., Sylvain, P. and Mondher, S. (2010), ‘Tourism And Globalization: The
International Division Of Tourism Production’, Journal of Travel Research, 49, pp. 228-
245.
Jogaratnam, G., McCleary, K., Mena, M. and Yoo, J. (2005), ‘An Analysis Of
Hospitality And Tourism Research Institutional Contributions’, Journal of Hospitality
and Tourism Research, 29 (3), pp. 356–371.
Johns, N., Avci, T. and Karatepe, O. M. (2004), ‘Measuring Service Quality Of Travel
Agents: Evidence From Northern Cyprus’, The Service Industries Journal, 24, pp. 82-
100.
Joreskog, G. K. and Sorbom, D. (1996). LIREL 8, User's reference guide, Scientific
Software International. Lawrence. Erlbaum, Hillsdale, NJ.
José, G., Pablo, C., Luis, O. and Jesús, M. (2009), ‘Technology Revenue Management
System For Customer Groups In Hotels’, Journal of Business Research, 63 (5), pp. 519-
527.
Kidder, L. H., Charles M. J. and Eliot R. S. (1991), Research Methods In Social
Relations, Fort Worth, TX: Brace Jovanovich College Publishers, 132.
Kim, H. J., Chen, M. H. and Jang, S. S. (2006), ‘Tourism Expansion And Economic
Development: The Case Of Taiwan’, Tourism Management, 27 (5), pp. 925–933.
Kline, R. B. (1998), Principles And Practice Of Structural Equation Modeling, New
York: Guilford press.
Kozak, M. and Rimmington, M. (1999), ‘Measuring Tourist Destination
Competitiveness: Conceptual Considerations And Empirical Findings’, International
Journal of Hospitality Management, 18 (3), pp. 273–283.
Kriegl, U. (2000), ‘International Hospitality Management’, Cornell Hotel and
Restaurant Quarterly, 41 (2), pp. 64-71.

128
Kumar, N. and Dillon, W. R. (1987), ‘The Interaction Of Measurement And Structure In
Simultaneous Equation Models In Unobserved Variable, Journal of Marketing Research,
24 (1), pp. 98-105.
Kumar, V., Pozza, I. D. and Ganesh, J. (2013), ‘Revisiting The Satisfaction–Loyalty
Relationship: Empirical Generalizations And Directions For Future Research’, Journal
of Retailing, 89 (3), pp. 246-62.
Kuo, N. T., Chang, K. C., Cheng, Y. S. and Lai, C. H. (2013), ‘How Service Quality
Affects Customer Loyalty In The Travel Agency: The Effects Of Customer Satisfaction,
Service Recovery, And Perceived Value’, Asia Pacific Journal of Tourism Research, 18
(7), pp. 803-22
Kusluvan, S., Kusluvan, Z., Ilhan, I. and Buyruk, L. (2010 ), ‘The Human Dimension: A
Review Of Human Resources Management Issues In the Tourism And Hospitality
Industry’, Cornell Hospitality Quarterly 51, pp. 171-214.
Law, R., and Cheung, P. (2008), ‘An Analysis Of Publications In Leading Tourism
Journals And Its Implications On China Tourism Research’, Journals of China Tourism
Research, 4 (1), pp.78–97.
Leclerc, D. and Martin, J. N (2004), ‘Tour Guide Communication Competence: French,
German And American Tourists' Perceptions’, International Journal of Intercultural
Relations, 28 (3), pp. 181-200.
Lee, S., Jeon, S. and Kim, D. (2011), ‘The Impact Of Tour Quality And Tourist
Satisfaction On Tourist Loyalty: The Case Of Chinese Tourists In Korea’, Tourism
Management, 32, pp. 1115-1124.
Lee-Ross, D. (ed.) (2000), HRM In Tourism And Hospitality – International
Perspectives On Small To Medium-Sized Enterprises, London: Cassell.
Lehto, X. Y., O’Leary, J. T. and Morrison, A. M. (2004), ‘The Effect Of Prior
Exeperience On Vacation Behavior’, Annals of Tourism Research, 31 (4), pp. 801-818.

129
Leiper, N. (1975), ‘The Framework Of Tourism: Towards A Definition Of Tourism,
Tourist And The Tourist Industry’, Annals of Tourism Research, 6 (4), pp. 390-407
Leung, D., Leung, R., Bai, B. and Law, R. (2011), ‘Asian Wave In Travel And Tourism
Research’, Journal of Travel and Tourism Marketing, 28 (2), pp. 196-209.
Li, X., Cheng, C., Kim, H. and Petrick, J. F. (2008), ‘A Systematic Comparison Of First-
time And Repeat Visitors Via A Two-phase Online Survey’, Tourism Management, 29
(2), pp. 278-293.
Lin, C. T., Wang, K. C., and Chen, W. Y. (2008), ‘Female Tour Leaders As Advertising
Endorsers’, Service Industries Journal, 28(9), pp. 1265-75.
Lin, L., Horng, J. S., Chen, Y. C. and Tsai, C. Y. (2011), ‘Factors Affecting Hotel
Human Resource Demand In Taiwan’, International Journal of Hospitality
Management, 30 (2), pp. 312-318.
Liu, A. and Wall, G. (2006), ‘Planning Tourism Employment: A Developing Country
Perspective’, Tourism Management, 27 (1), pp. 159-170
Liu, C., Lin, W. and Wang, Y. (2012), ‘Relationship Between Self-congruity And
Destination Loyalty: Differences Between First-time And Repeat Visitors’, Journal of
Destination Marketing and Management, 1, pp. 118-123.
Lucas, R. and Deery, M. (2004), ‘Significant Developments And Emerging Issues In
Human Resource Management’, International Journal of Hospitality Management, 23,
pp. 459-472.
Mak, A. H. N., Wong, K. K. F., & Chang, R. C. Y. (2010), ‘Factors Affecting The
Service Quality Of The Tour Guiding Profession In Macau’, International Journal of
Tourism Research, 12, pp. 205-218.

130
Mak, A. H. N., Wong, K. K. F., & Chang, R. C. Y. (2011), ‘Critical Issues Affecting
The Service Quality And Professionalism Of The Tour Guides In Hong Kong And
Macau’, Tourism Management, 32(6), pp. 1442-52.
Malhotra, N. K. (2004), Marketing Research: An Applied Orientation, 4th ed., Upper
Saddle River, NJ 07458: Pearson Prentice Hall.
Malhotra, N. K and Peterson, M. (2006), Basic Marketing Research: A Decision-Making
Approach, 2nd ed., Pearson Prentice Hall.
Martínez Caro, L. and Martínez García, J. A. (2008), ‘Developing a multidimensional
and hierarchical service quality model for the travel agency industry’, Tourism
Management, 29 (4), pp. 706-20.
Modlin, E. A., Alderman, D. H. and Gentry, G. W. (2011), ‘Tour Guides As Creators Of
Empathy: The Role Of Affective Inequality In Marginalizing The Enslaved At
Plantation House Museums’, Tourist Studies, 11(1), pp. 3-19.
MOIT (2011), ‘The Number Of Businesses In Vietnam In Terms Of Business Types’,
Ministry of Industry and Trade, 2011, available at
http://tttm.vecita.gov.vn/default.aspx?page=statistic_report&layout=body&do=detail&categor
y_id=3&id=309 (accessed on 6/12/2013)
Morse, J. M. (2005), ‘Evolving Trends In Qualitative Research: Advances In Mixed
Method Design’, Qualitative Health Research, 15 (5), pp. 583-85.
Mossberg, L. L. (1995), ‘Tour Leaders And Their Importance In Charter Tours’,
Tourism Management, 16, pp. 437-445.
Nankervis, A., Compton, R. and Baird, M. (2008), Human Resource Management:
Strategies And Processes, 6th ed., Thomson, Sydney.
Nickson, D. (2013), Human Resource Management for Hospitality, Tourism and Events,
Routledge.

131
Nunnally, J. C. (1978), Psychometric Theory, McGraw Hill. New York.
Oliver, R. L. (1980), ‘A Cognitive Model Of The Antecedents And Consequences Of
Satisfaction Decisions’, Journal of Marketing research, 17, pp. 460-469.
Olsen, M. D., Crawford-Welch, S. and Tse, E. C. Y. (1990), ‘The Hospitality Industry
Of The 1990’s: A Position Statement’ In: Proceedings of the Pro. Int. Contemporary
Hospitality Management Conference, Dorset, UK, pp. 1–25.
Oppermann, M. (1997), ‘First-time And Repeat Visitors To New Zealand’, Tourism
Management, 18 (3), pp. 177-181.
Oppermann, M. (2000), ‘Tourism Destination Loyalty’, Journal of Travel Research, 39
(1), pp. 78-84.
Ozdemir, B., Aksu, A., Ehtiyah, R., Cizel, B., Cizel, R. B. and Icigen, E. T. (2012),
‘Relationships Among Tourist Profile, Satisfaction And Destination Loyalty: Examining
Empirical Evidences In Antalya Region Of Turkey’, Journal of Hospitality Marketing
and Management, 21 (5), pp. 506-40.
Parasuraman, A., Zeithaml, A. and Berry, L. (1985), ‘A Concept Model Of Service
Quality And Its Implications For Future Research’, Journal of Marketing 49 (3), pp. 41–
50.
Parasuraman, A., Berry, L. and Zeithaml, A. (1988), ‘SERVQUAL: A Multiple-Item
Scale For Measuring Consumer Perceptions Of Service Quality’, Journal of Retailing,
64 (1), pp. 12-40.
Peter, J. P. (1979), ‘Construct Validity: A Review Of Basic Issues And Marketing
Practices’, Journal of Marketing Research, 28 (2), pp. 133-45.
Petrick, J. F., Morais, D. B. and Norman, W. (2001), ‘An Examination Of Determinants
Of Entertainment Vacationers’ Intentions To Visit’, Journal of Travel Research, 40 (1),
pp.41-48.

132
Poudel, S. and Nayaupane, G. P. (2013), ‘The Role Of Interpretative Tour Guiding In
Sustainable Destination Management: A Comparison Between Guided And Nonguided
Tourists’, Journal of Travel Research, 52, pp.659-72.
Price, A. (2004), Human Resource Management In A Business Context , Thomson
Learning, London.
Pucciani, K. K. and Murphy, H. C. (2011), ‘An Investigate Of Data Management And
Property Management Systems In Hotels’, Journal of Tourism and Hospitality
Management, 17 (1), pp. 101-114.
Ranjan, C. and Sanjeev, V. (2008), ‘A Framework For Determining Customer
Satisfaction: An Empirical Analysis’, International Journal of Electronic Marketing and
Retailing, 2 (2), pp. 190-201.
Raykov, T. and Widaman, K. F. (1995). ‘Issues In Applied Structural Equation
Modeling Research’, Structural Equation Modeling, 2 (4), pp. 289-318.
Reichheld, F. F. and Sasser, W. E. (1990), ‘Zero Defections: Quality Comes To
Services’, Havard Business Review, 68, pp. 105-111.
Reichheld, F. F. (1996), The Loyalty Effect, Boston, MA: Harvard Business School Press.
Roggenbuck, J., Williams, D. R. and Bobinski, C. T. (1992), ‘Public Private Partnership
To Increase Commercial Tour Guide's Effectiveness As Nature Interpreters’, Journal of
Park and Recreation Administration, 10 (2), pp. 41-50.
Romzi, A., Tarmizi, Ahmad, A. R, Mansur, T., Lynn, Anna, A. B, Anto and Budi, M. T.
(2011), ‘Loyalty (The National Principles): Strengthening Eco-Tourism Industry in
Sabah, Malaysia’, Journal of Sustainable Development, 4 (2), pp. 184-88.
Sadi, M. A. and Bartels, F. J. (1999), ‘Recent Developments In The Association Of
South East Asian Nations (ASEAN) Tourist Industry: Manpower Development,
Training Issues And Competitiveness’, Competitiveness Review, 9 (1), pp. 19–29.

133
Saleh, F., and Ryan, C. (1991), ‘Analysing Service Quality In The Hospitality Industry
Using The SERVQUAL Model’, Service Industry Journal, 11, pp. 324-343.
Schlesinger, L. A. and Hesket, J. L. (1991), ‘The Service Driven Service Company’,
Harvard Business Review, September-October, pp. 71-81.
Schreiber, J. B., Stage, F. K., King, J., Nora, A. and Barlow, E. A. (2006), ‘Reporting
Structural Equation Modeling And Confirmatory Factor Analysis Results: A Review’,
The Journal of Educational Research, 99 (6), pp.323-37.
Seldon, A. and Pappworth, J. (1983), By Word of Mouth: Elite Oral History, London:
Methuen Publishing.
Setó-Pamies, D. (2012), ‘Customer Loyalty To Service Providers: Examining The Role
Of Service Quality, Customer Satisfaction And Trust’, Total Quality Management &
Business Excellence, 23 (11-12), pp. 1257-71.
Severt, D., Tesone, D. V., Bottorff, T. J. and Carpenter, M. L. (2009), ‘A World Ranking
Of The Top 100 Hospitality And Tourism Programs’, Journal of Hospitality and
Tourism Research, 33 (4), pp. 451–470.
Shoemaker, S. and Lewis, L. C. (1999), ‘Customer Loyalty: The Future Of Hospitality
Marketing’, International Journal of Hospitality Management, 18, pp. 345-370.
Singh, N., Clark H. and Wesley S. R. (2007), ‘Text Mining A Decade Of Progress In
Hospitality Human Resource Management Research: Identifying Emerging Thematic
Development’, International Journal of Hospitality Management, 26 (1), pp. 131-47.
Solnet, D. (2012), ‘Service Management In Hospitality Education: Review And
Reflection’, Journal of Hospitality Marketing and Management, 21 (2), pp. 184-214
Spector, P. E. (1981), Research Design, Beverly Hills: Sage Publications

134
Steenkamp, J-B. E. M. and Van Trijp, H. C. M. (1991). The Use Of LISREL In
Validating Marketing Constructs, International Journal of Market Research, 8 (4), pp.
283-99.
Steiger, J. H. and Lind, J. C. (1980), Statistically-based test for the number of common
factors. In The Annual Spring Meeting of the Psychometric Society, Iowa City.
Storey, J. (2001), Human Resource Management: A Critical Text, Thomson learning,
London.
Sun, X., Chi, C. G. and Xu, H. (2013), ‘Developing Destination Loyalty: The Case Of
Hainan Island’, Annals of Tourism Research, 43, pp. 547-577.
Szivas, E., Riley, M., and Airey, D. (2003), ‘Labor Mobility Into Tourism: Attraction
And Satisfaction’, Annals of Tourism Research, 30(1), pp.64–76
Tansey, O. (2007), ‘Process Tracing And Elite Interviewing: A Case For Non-
Probability Sampling’, Political Science and Politics, 40 (4), pp. 765-72
The Economist (2008), ‘Revealing Its Hidden Charm’, The Economist Electronic
Newspaper, available at http://www.economist.com/node/11041725?story_id=11041725
(accessed on 20/7/2012).
Thu, H. (2012), ‘80%-85% Of International Tourists Does Not Intend To Revisit’, The
Saigon Times Newspaper, available online at
http://www.thesaigontimes.vn/Home/xahoi/sukien/88284/ (accessed on 20/12/2012).
Truong, T. H. and Foster, D. (2006), ‘Using HOLSAT To Evaluate Tourist Satisfaction
At Destinations: The Case Of Australian Holidaymakers In Vietnam’, Tourism
Management, 27, pp. 842-855.
Truong, T. H. and King, B. (2009), ‘An Evaluation Of Satisfaction Levels Among
Chinese Tourists In Vietnam’, International Journal of Tourism Research, 11, pp. 521-
535.
135
Tsang, N. K. F. and Hsu, C. H. C (2011), ‘Thirty Years Of Research On Tourism And
Hospitality Management In China: A Review And Analysis Of Journal Publications’,
International Journal of Hospitality Management 30 (4), pp. 886-896.
Tourism Council of Australia (2000), Western Australian Tourism Awards, Perth, WA:
Tourism Council of Australia Western Australia.
Ullman, J. B. (2006), ‘Structural Equation Modeling: Reviewing The Basics And
Moving Forward’, Journal of Personality Assessment, 87 (1), pp. 35-50.
Um, S., Chon, K. and Ro, Y. H. (2006), ‘Antecedents O f Revisit Intention’, Annals of
Tourism Research, 33 (4), pp. 1141-1158.
Vi, T. (2010), ‘Human Resource In Tourism Industry: Still Lack And Weak’, The
Saigon Times Online Newspaper, 2010, available at
http://www.thesaigontimes.vn/home/doanhnghiep/quantri/38450/ (accessed on 1/5/2012).
VNAT (2011a), Strategy To Develop Vietnam Tourism Industry To 2020 And Vision To
2030, avalaible at
http://www.itdr.org.vn/library/duan/fb/2011_chienluoc2020_bcth/index.vdl (accessed on
10/4/2012).
VNAT (2011b), Statistics On International Tourism Companies, available at
http://www.vietnamtourism.gov.vn/index.php?cat=202036&itemid=10286 (accessed on
19/11/2013).
VNAT (2011c), Should We “Loosen” The Criteria For International Tour Guide?,
available at http://www.vietnamtourism.gov.vn/index.php?cat=1005&itemid=9751
(accessed on 9/11/2013).
Wang, D. (2004), ‘Tourist Behavior And Repeat Visitation To Hong Kong’, Tourism
Geographies, 6 (1), pp. 99-118.
136
Wang, K. C., Hsieh, A. T. and Huan, T. C. (2000), ‘Critical Service Features In Group
Package Tour: A Exploratory Research’, Tourism Management, 21, pp. 177-189.
Wang, K. C., Hsieh, A. T., Chou, S. H. and Lin, Y. S. (2007), ‘GPTCCC: An Instrument
For Measuring Group Package Tour Service’, Tourism Management, 28 (2), pp. 361-76.
Weiler, B., Black, R. and Torland, M. (2014), ‘Tour Guiding Research And Scholarship:
A Review Of 50 Years Of Research’ [online], In: Chien, P.Monica. CAUTHE 2014:
Tourism and Hospitality in the Contemporary World: Trends, Changes and Complexity,
Brisbane: School of Tourism, The University of Queensland, 2014, pp. 1181-85.
Weiler, B. and Davis, D. (1993), ‘An Exploratory Investigation Into The Roles Of The
Nature-Based Tour Leader’, Tourism Management, 14 (2), pp. 91-98.
Weiler, B., Davis, D. and Johnson, T. (1992), ‘Roles Of The Tour Leader In
Environmentally Responsible Tourism’, In B. Weiler (Ed.), Ecotourism Incorporating
The Global Classroom, Conference Proceedings, University of Queensland, Brisbane pp.
228-33.
Weiler, B. and Ham, S.H. (2001), ‘Tour Guides And Interpretation’, In D. Weaver (Ed.),
Encyclopedia of Ecotourism (pp. 549-563). Wallingford, Oxon, UK: CABI Publishing.
Weiler, B. and Walker, K. (2014), ‘Enhancing The Visitor Experience:
Reconceptualising The Tour Guide's Communicative Role’ Journal of Hospitality &
Tourism Management, available at
http://epubs.scu.edu.au/cgi/viewcontent.cgi?article=4143&context=tourism_pubs
(accessed on 02/10/2014)
Weiler, B. and Yu, X. (2007), ‘Dimensions Of Cultural Mediation In Guiding Chinese
Tour Groups: Implications For Interpretation’, Tourism Recreation Research, 32 (3), pp.
13-22.
137
Whinney, C. (1996), ‘Good Intentions In A Competitive Market: Training For People
And Tourism In Fragile Environments’, In M. F. Price (Ed.), People and tourism in
fragile environments, pp. 222-29), Chichester, UK John Wiley and Sons Ltd.
Wiley, J. W. (1990), ‘Customer Satisfaction: A Supportive Work Environment And Its
Financial Cost’, Human Resource Planning, 14, pp. 117-27.
Wong, A. (2001), ‘Satisfaction With Local Tour Guides In Hong Kong’, Pacific
Tourism Review, 5, pp. 59-67.
Wong, C. S. and Kwong, W. Y. Y. (2004), ‘Outbound Tourists’ Selection Criteria For
Choosing All-Inclusive Package Tours’, Tourism Management, 25, pp. 581-592.
World Economic Forum (2005), The Travel & Tourism Competitiveness Report 2005,
available at http://www.weforum.org/issues/travel-and-tourism-competitiveness/
(accessed on 15/7/2011).
World Economic Forum (2009), The Travel & Tourism Competitiveness Report 2009,
available at http://www.weforum.org/issues/travel-and-tourism-competitiveness/
(accessed on 15/7/2011).
World Federation of Tourist Guide Associations (2003), ‘What Is The Tourist Guide?’
WFTGA website, available at http://wftga.org/tourist-guiding/what-tourist-guide (accessed
on 30/8/2011).
World Travel and Tourism Council (2011), Tourism Satellite Account Research, World
Travel and Tourism Council, Geneva.
World Travel and Tourism Council (2014), Travel And Tourism – Economic Impact
2013 – Vietnam, World Travel and Tourism Council, London.
Wright, P. M., McMahan, G. C. and McWilliams, A. (1994), ‘Human Resources And
Sustained Competitive Advantage: A Resource-Based Perspective’, International
Journal of Human Resource Management, 5 (2), pp. 301–326.

138
XiaoXia, S., GengQing, C. and HongGang, X. (2013), ‘Developing Destination Loyalty:
The Case Of Hainan Island’, Annals of Tourism Research, 43, pp. 547-77.
Yamada, N. (2011), ‘Why Tour Guiding Is Important For Ecotourism: Enhancing
Guiding Quality With The Ecotourism Promotion Policy In Japan’, Asia Pacific Journal
of Tourism Research, 16 (2), pp. 139-152.
Yesiltas, M., Ozturk, Y. and Hemmington, N. (2010), ‘Tourism Education In Turkey
And Implications For Human Resources, International Journal of Tourism and
Hospitality Research, 21 (1), pp. 55-71.
Yu, X., Weiler, B. and Ham, S. (2002), ‘Intercultural Communication And Mediation: A
Framework Of Analysing Intercultura l Competence Of Chinese Tour Guides’, Journal
of Vacation Marketing, 8, pp. 75-87.
Yuksel, A. and Yuksel, F. (2001), ‘The Expectancy-Disconfirmation Paradigm: A
Critique’, Journal of Hospitality & Tourism Research, 25 (2), pp. 107–131.
Zhang, H. Q. and Chow, I. (2004), ‘Application Of Importance-Performance Model In
Tour Guides’ Performance: Evidence From Mainland Chinese Outbound Visitors In
Hong Kong’, Tourism Management, 25, pp. 81-91.
Zeithaml, V. A., Berry, L. L. and Parasuraman, A. (1996), The Behavioral
Consequences of Service Quality’, Journal of Marketing, 60 (4), pp. 31-46
Zikmund, W. G (1997), Business Research Method, Fort Worth, TX: The Dryden Press
Zikmund, W. G (2000), Business Research Methods (6th ed.), Dryden (Harcourt) Fort
Worth, Orlando.

139
Appendices
Appendix 1: PARTICIPANT CONSENT FORM
Project Title: The impacts of tour guide performance on foreign tourist satisfaction
and destination loyalty in Vietnam
I,…………………………......................., consent to participate in the research project
titled ‘The impacts of tour guide performance on foreign tourist satisfaction and
destination loyalty in Vietnam’.
I acknowledge that: I have read the participant information sheet and have been given
the opportunity to discuss the information and my involvement in the project with the
researcher, Hoang Le Nguyen.
The procedures required for the project and the time involved have been explained to me,
and any questions I have about the project have been answered to my satisfaction.
I consent to an interview, which may be recorded for purposes of transcription.
I understand that my involvement is confidential and that the information gained during
the study may be published anonymously, with no company or individual being
identifiable, and no information about me will be used in any way that reveals my
identity.
I understand that I can withdraw from the study at any time, without affecting my
relationship with the researcher now or in the future.
Signed __________________________________________
Name ___________________________________________
Date ___________________________________________

140
Appendix 2: PARTICIPANT INFORMATION SHEET
Project Title: The impacts of tour guide performance on foreign tourist satisfaction
and destination loyalty in Vietnam
You are invited to participate in a study conducted by Hoang Le Nguyen, a doctoral
candidate in the School of Business at the University of Western Sydney.
Who is carrying out the study?
Hoang Le Nguyen, a DBA candidate at the University of Western Sydney, Australia.
What is the study about?
The purpose of this study is to investigate the relationship among tour guide
performance, foreign tourist satisfaction and destination loyalty in the context of
Vietnam
This project uses publicly available information together with information provided by
people working for tourism companies and foreign tourists in Vietnam.
The aim of this project is to better understand the attributes of tour guide performance in
a package tour. The study also examines the impact tour guides have on the satisfaction
of tourists who are choosing Vietnam as a tourism destination as well as their destination
loyalty. From the findings of the project, I will make a contribution as a number of
suggestions for both tour guide and tour manager/tour operator in order to identify the
advantages and disadvantages of tour guide attributes, and then to foster and enhance the
performance of this force to reach the higher level of customer satisfaction as well as
destination loyalty.
What does the study involve?
In participating in this study I will ask you to undertake an interview with me at the time
and place of your choosing. The interview will be recorded, with your permission, so
that the spoken content can be assessed later.
141
This interview covers the background of your organisation’s involvement, your role in
the organisation, and your assessment and opinion about attributes of tour guide
performance in a package tour in Vietnam.
The information (interview and any documents) you provide will be completely
confidential, neither you nor the organisation (or any other person or organisation that
we discussed) will be disclosed in the results of the research. The material will be kept at
the University of Western Sydney for exclusive use in this research. After the interview
we will discuss all the data/information you have provided and how I will ensure that
your privacy is protected. At that time you may instruct me to exclude any particular
types of data from the project. You may also stop the interview at any time.
How much time will the study take?
The interview will last between one and two hours, depending on your availability and
the amount of discussion resulting from it.
Will the study benefit me?
I believe you will find benefits of participation through strategic insights that emerge
from the process of analysing tour guide performance. As a tourist, you will also receive
a better service in a package tour from tourism companies when they have strategies to
enhance the performance of tour guide from the findings and implications of my study.
Will the study involve any discomfort for me?
No, not at all.
How is this study being paid for?
The study is being supported by the University's research funds, a scholarship, and my
personal income.
Will anyone else know the results? How will the results be disseminated?

142
All aspects of the study, including results, will be confidential and only the researchers
will have access to information on participants. Furthermore, the data obtained from the
interviews will 'de-identified', that is, rendered anonymous, so that no-one will be aware
of the source of the material.
Can I withdraw from the study?
Participation is entirely voluntary: you are not obliged to be involved and - if you do
participate - you can withdraw at any time without giving any reason and without any
consequences.
Can I tell other people about the study?
Yes, you are welcome to tell other people about the study and provide them with my
contact details. In fact, it would be appreciated if other individuals and organizations are
made aware of this study so that they may consider being a part of it. They can contact
me to discuss their participation in the research project and obtain an information sheet.
What if I require further information?
When you have read this information, I will discuss it with you further and answer any
questions you may have. If you would like to know more at any stage, please feel free to
contact me, Hoang Le Nguyen, at the University of Western Sydney at
[email protected], or my telephone number in Vietnam +84936337799. The
University's Human Research Ethics Committee's contact details are also shown below
and you are welcome to contact them.
What if I have a complaint?
This study has been approved by the University of Western Sydney Human Research
Ethics Committee. The Approval number is ….. If you have any complaints or
reservations about the ethical conduct of this research, you may contact my principal
supervisor, Ass. Prof. Terry Sloan, at the School of Business, University of Western
Sydney, [email protected] or 0424 508 528. Alternatively you can contact the Ethics
Committee through the Office of Research Services on 61 2 4736 0083 or email
143
[email protected]. Any issues you raise will be treated in confidence and
investigated fully, and you will be informed of the outcome.
If you agree to participate in this study, I will ask you to sign the Participant Consent
Form.
Thank you for taking the time to consider participating in this study.
Hoang Le Nguyen
School of Business
University of Western Sydney

144
Appendix 3: FOCUS GROUP INTERVIEW PROFORMA
Question 1: What do you think about the role of tour guide in a package tour?
Question 2: Do you think the appearance of a tour guide is significant? How can you
assess the appearance of a tour guide?
Question 3: How do you think about the foreign language level of tour guide? Do you
have any good or bad experience about that?
Question 4: In some cases, there have been some complaints about the responsibility of
tour guide in a package tour when serving customers. Do you think responsibility of tour
guide is a one of the factors that leads to the satisfaction of tourists?
Question 5: Many tourists affirmed tour guide has to have a good knowledge of culture
and history of destination. How do you think about this? Is there any other knowledge
that tour guide should have?
Question 6: In order to make a joyful atmosphere for a tour, do you think tour guides
need to have a sense of humor?
Question 7: How tour guide can handle complaints from tourists? Can you show me
some examples in particular? Do you think the skill of solving problems in a tour of tour
guide is significant?
Question 8: It is said that activities organization skill of tour guide is important. What is
your opinion about that? What should tour guides do in order to organize the activities in
a tour? Should they have a good relationship with other staff, for example, driver?
Question 9: Nowadays there are many complaints about the environment of tourism
destinations in Vietnam. How do you think about this? Should tour guide need to have
knowledge to keep the environment clean? Did they keep reminding tourists of
environmental protection issues and safety issues?
145
Question 10: Vietnam has a lot of tasty and traditional foods. Do you think that tour
guide has an important role to introduce them to foreign tourists in a tour? Are there any
others products that tour guide can introduce to tourists?
Question 11: What are other significant attributes of tour guide performance that lead to
the success of a package tour? What skill/knowledge should tour guide need to equip?

146
Appendix 4: QUESTIONNAIRE
QUESTIONNAIRE FOR TOURIST SATISFACTION ON TOUR GUIDE
PERFORMANCE IN VIETNAM
Dear Sir/Madame,
We are conducting an academic survey regarding your satisfaction with the
performance of your tour guide in Vietnam. Please indicate your level of agreement
with each of the following statements. Your comments are not only highly important to
this academic research, but will also help us to improve the performance of tour guides
in the future. The data collected in this survey will be treated with confidentiality, and no
individual responses will be identified.
Thank you very much for your assistance.
Hoang Le Nguyen – DBA student
School of Business – University of Western Sydney
Phone: (+84) 936.337799 Email: [email protected]
Please circle the number that indicates your level of agreement with each of the
following statements, where (1) is Strongly disagree; (2) is Disagree; (3) is Neutral;
(4) is Agree; (5) is Strongly agree. The higher number you choose, the higher level of
your agreement with the statement.
SECTION 1: INTRAPERSONAL SERVABILITY
IN THIS TOUR I FOUND … ASSESSMENT
1. Tour guides were friendly 1 2 3 4 5
2. Tour guides’ clothes and appearance were neat and appropriate 1 2 3 4 5
3. Tour guides were polite 1 2 3 4 5
4. Tour guides were honest and reliable 1 2 3 4 5
5. Tour guides had good personality 1 2 3 4 5
6. Tour guides had good health 1 2 3 4 5
7. Tour guides showed passion of their work 1 2 3 4 5
147
8. Tour guides showed a sense of responsibility 1 2 3 4 5
9. Tour guides were fluent in the language of the tour group 1 2 3 4 5
10. Tour guides were good at communication 1 2 3 4 5
Other comments:
…………………………………………………………...........................................................
……………………………………………………………………………………………………
SECTION 2: INTERPERSONAL SERVABILITY AND ORGANIZATIONAL SKILLS
IN THIS TOUR I FOUND … ASSESSMENT
1. Tour guides took good care of customers’ needs 1 2 3 4 5
2. Tour guides were able to meet psychological needs of customers 1 2 3 4 5
3. Tour guides were willing to help customers 1 2 3 4 5
4. Tour guides had a knowledge of the destination’s culture and history 1 2 3 4 5
5. Tour guides had knowledge of local people’s lifestyle 1 2 3 4 5
6. Tour guides understood the culture of customers they were serving 1 2 3 4 5
7. Tour guides performed well in commentary 1 2 3 4 5
8. Tour guides had a good sense of humor 1 2 3 4 5
9. Tour guides were able to generate rapport among tour’s members 1 2 3 4 5
10. Tour guides were able to handle customers’ complaints 1 2 3 4 5
11. Tour guides were flexible in solving any problems and conflicts in the
tour
1 2 3 4 5
12. Tour guides were able to cope with unexpected and urgent incidents 1 2 3 4 5
13. Tour guides were able to reconcile historical arguments among
customers
1 2 3 4 5
14. Tour guides showed sound judgment in historical arguments with
customers
1 2 3 4 5
15. Tour guides followed the itinerary and schedule 1 2 3 4 5
16. Tour guides were good at time management 1 2 3 4 5
17. Tour guides were able to organize activities in a tour 1 2 3 4 5
18. Tour guides were able to cooperate with other staff (e.g., driver) 1 2 3 4 5
19. Tour guides had knowledge to keep environment clean during a tour 1 2 3 4 5

148
20. Tour guides kept reminding tourists of environmental protection issues 1 2 3 4 5
21. Tour guides kept reminding tourists of safety issues 1 2 3 4 5
22. Tour guides introduced restaurants with tasty foods to customers 1 2 3 4 5
23. Tour guides introduced Vietnamese traditional and original foods to
customers
1 2 3 4 5
24. Tour guides introduced interesting entertainment places to tourists
(e.g., casino)
1 2 3 4 5
25. Tour guides introduced Vietnamese traditional or special products to
customers
1 2 3 4 5
26. Tour guides introduced reliable shops to customers 1 2 3 4 5
Other comments:
…………………………………………………………............................................................
…………………………………………………………………………………………………….
SECTION 3: TOURIST SATISFACTION
IN THIS TOUR … ASSESSMENT
1. I was satisfied with guiding service 1 2 3 4 5
2. I was satisfied with tour services 1 2 3 4 5
3. I was satisfied with the overall tour experience 1 2 3 4 5
Other comments:
…………………………………………………………............................................................
……………………………………………………………………………………………………
SECTION 4: DESTIONATION LOYALTY OF TOURIST
STATEMENT OF TOURIST ASSESSMENT
1. I am willing to revisit Vietnam for tourism in the future 1 2 3 4 5
2. If I have a chance to come to Vietnam in a business trip, I will stay longer
to travel
1 2 3 4 5
3. I am willing to recommend others to travel to Vietnam 1 2 3 4 5
149
Other comments:
…………………………………………………………...........................................................
……………………………………………………………………………………………………
SECTION 5: RESPONDENT PROFILE OF TOURIST
1. Which country are you from? ………………… (please specify)
2. What is your gender? Male Female
3. What is your marital status?
Never married Married Divorced Separated Widowed
4. What is your age?
≤18 19-29 30-39 40-49 50-59 ≥60
5. What is your highest level of education?
Never attended school Some Primary school Completed Primary School
Some High School Completed High School Some College/University
Completed College/University Postgraduate (MA, MS, MD, PhD,...)
Other (please specify) …………………
6. What is your occupation?
Business person Civil servant Teacher/Lecturer Clerk/white-collar worker
Blue-collar worker Retired Unemployed Other (please specify) …………………………
7. What is your annual household income (before tax) (US$)?
<20,000 20,000-30,999 40,000-59,999 60,000-79,999
80,000-99,999 ≥100,000

150
8. How many times have you visited Vietnam?
First time Two times Three times More than three times
9. Do you have any other purposes other than tourism on this visit to Vietnam?
No, only for travel Visit relative(s) Business trip Study/Exchange student
MICE (Meetings, Incentives, Conferencing, Exhibitions)
Other (please specify) ………………..
10. Who are you travelling with on this trip to Vietnam?
Alone Family Partner(s) Friend(s)
Co-worker(s)/Colleague(s) Other (please specify) ………………..
11. How long do you intend to stay in Vietnam?
1-3 days 4-7 days 8-10 days 11-14 days More than 14 days
THANK YOU VERY MUCH FOR YOUR COOPERATION AND HAVE A GOOD TRIP!

151
Appendix 5: RESEARCH DOCUMENTATION
Table A0.1: ASEAN countries' Travel & Tourism Competitiveness Index 2009 C
ou
ntr
y
Ov
era
ll R
an
k
Po
licy
ru
les
an
d reg
ula
tio
ns
En
vir
on
men
tal re
gu
lati
on
Safe
ty a
nd
secu
rity
Healt
h a
nd
hy
gie
ne
Pri
ori
tizati
on
of
Tra
vel
& T
ou
rist
Air
tra
nsp
ort
in
frast
ructu
re
Gro
un
d t
ran
spo
rt i
nfr
ast
ructu
re
To
uri
sm i
nfr
ast
ructu
re
ICT
in
frast
ructu
re
Pri
ce c
om
peti
tiv
en
ess
in
th
e in
du
stry
Hu
man
reso
urc
es
Nati
on
al to
uri
sm p
erc
ep
tio
n
Natu
ral
reso
urc
es
Cu
ltu
ral re
sou
rces
Cambodia 108 122 107 88 126 18 106 107 125 122 21 108 15 58 77
3.43 3.33 4.00 4.68 1.56 5.44 2.39 2.67 1.27 1.60 5.30 4.37 5.52 3.45 2.00
Indonesia 81 72 73 113 87 59 60 89 88 102 3 42 78 28 37
3.79 3.27 3.40 3.91 2.58 5.70 3.22 2.97 2.10 2.06 5.86 5.26 4.63 4.43 3.12
Malaysia 32 9 54 59 69 23 35 28 77 46 4 30 21 21 32
4.71 5.38 4.69 5.29 4.47 5.31 4.19 4.80 2.74 3.63 5.85 5.50 5.43 4.62 3.89
Philippines 86 123 130 119 110 10 73 90 96 92 16 69 53 65 63
3.73 4.34 4.38 4.12 4.02 4.51 2.87 2.95 1.94 2.20 5.37 5.05 4.87 3.14 2.38
Singapore 10 1 42 10 53 2 15 4 37 17 27 1 10 94 29
5.24 6.24 4.85 6.33 5.19 6.26 5.03 6.50 4.37 5.11 5.23 6.29 5.66 2.72 4.07
Thailand 39 62 99 118 71 22 25 56 39 71 19 57 22 24 33
4.45 4.48 4.13 3.94 4.42 5.34 4.54 3.82 4.27 2.74 5.35 5.16 5.41 4.54 3.84
Vietnam 89 96 100 100 95 61 84 80 109 79 11 82 81 52 68
3.70 3.92 4.13 4.53 3.77 4.42 2.69 3.19 1.65 2.59 5.49 4.91 4.61 3.60 2.19
Source: World Economic Forum, the Travel & Tourism Competitiveness Report, 2009

152
Table A0.2: The hierarchical frame work of critical service features in group
package tour (GPT)
Source: Wang et al. (2000)

153
Table A1.1: Nationality of tourists and their satisfaction on guiding service
Analysis of Variance
Source SS df MS F Prob > F
-----------------------------------------------------------------------
Between groups 7.44719625 7 1.06388518 2.50 0.0157
Within groups 183.550531 432 .424885488
-----------------------------------------------------------------------
Total 190.997727 439 .43507455
Bartlett's test for equal variances: chi2(7) = 29.1482 Prob>chi2 =
0.000
Table A1.2: Nationality of tourists and their satisfaction on tour services
Analysis of Variance
Source SS df MS F Prob > F
-----------------------------------------------------------------------
Between groups 6.51861039 7 .931230056 1.59 0.1360
Within groups 252.223986 431 .585206465
-----------------------------------------------------------------------
Total 258.742597 438 .590736522
Bartlett's test for equal variances: chi2(7) = 14.0728 Prob>chi2 =
0.050

154
Table A1.3: Nationality of tourists and their satisfaction on overall tour experience
Analysis of Variance
Source SS df MS F Prob > F
-----------------------------------------------------------------------
Between groups 10.4236248 7 1.48908926 2.35 0.0233
Within groups 273.653824 431 .634927666
-----------------------------------------------------------------------
Total 284.077449 438 .64857865
Bartlett's test for equal variances: chi2(7) = 6.1894 Prob>chi2 =
0.518
Table A1.4: t-test for nationalities of tourists and their satisfaction on guiding
service
. ttest guidesatisfaction if country==1 | country==6, by(country)
Two-sample t test with equal variances
------------------------------------------------------------------------------
Group | Obs Mean Std. Err. Std. Dev. [95% Conf. Interval]
---------+--------------------------------------------------------------------
1 | 225 4.426667 .0390969 .5864542 4.349622 4.503712
6 | 61 4.672131 .0690344 .5391757 4.534042 4.81022
---------+--------------------------------------------------------------------
combined | 286 4.479021 .0345634 .58452 4.410989 4.547053
---------+--------------------------------------------------------------------
diff | -.2454645 .0832614 -.4093522 -.0815768
------------------------------------------------------------------------------
diff = mean(1) - mean(6) t = -2.9481
Ho: diff = 0 degrees of freedom = 284

155
Ha: diff < 0 Ha: diff != 0 Ha: diff > 0
Pr(T < t) = 0.0017 Pr(|T| > |t|) = 0.0035 Pr(T > t) = 0.9983
. ttest guidesatisfaction if country==2 | country==6, by(country)
Two-sample t test with equal variances
------------------------------------------------------------------------------
Group | Obs Mean Std. Err. Std. Dev. [95% Conf. Interval]
---------+--------------------------------------------------------------------
2 | 35 4.228571 .1644227 .9727376 3.894424 4.562718
6 | 61 4.672131 .0690344 .5391757 4.534042 4.81022
---------+--------------------------------------------------------------------
combined | 96 4.510417 .076941 .7538643 4.35767 4.663164
---------+--------------------------------------------------------------------
diff | -.4435597 .1540548 -.749439 -.1376804
------------------------------------------------------------------------------
diff = mean(2) - mean(6) t = -2.8792
Ho: diff = 0 degrees of freedom = 94
Ha: diff < 0 Ha: diff != 0 Ha: diff > 0
Pr(T < t) = 0.0025 Pr(|T| > |t|) = 0.0049 Pr(T > t) = 0.9975
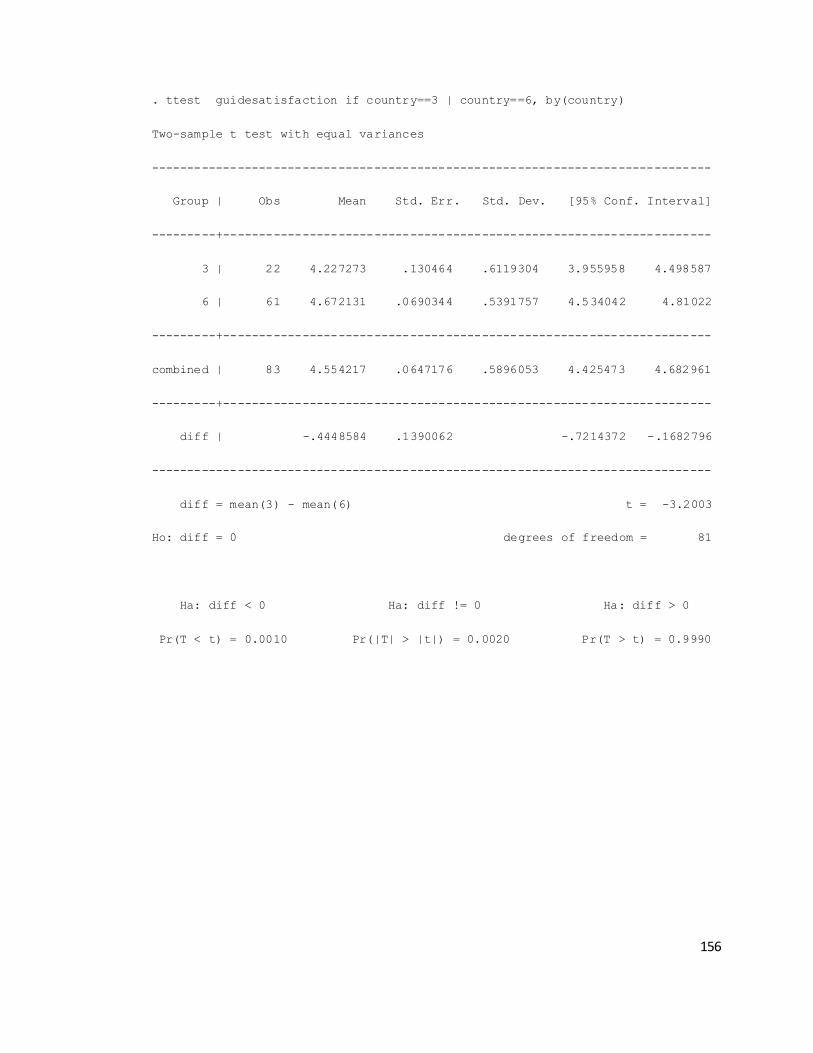
156
. ttest guidesatisfaction if country==3 | country==6, by(country)
Two-sample t test with equal variances
------------------------------------------------------------------------------
Group | Obs Mean Std. Err. Std. Dev. [95% Conf. Interval]
---------+--------------------------------------------------------------------
3 | 22 4.227273 .130464 .6119304 3.955958 4.498587
6 | 61 4.672131 .0690344 .5391757 4.534042 4.81022
---------+--------------------------------------------------------------------
combined | 83 4.554217 .0647176 .5896053 4.425473 4.682961
---------+--------------------------------------------------------------------
diff | -.4448584 .1390062 -.7214372 -.1682796
------------------------------------------------------------------------------
diff = mean(3) - mean(6) t = -3.2003
Ho: diff = 0 degrees of freedom = 81
Ha: diff < 0 Ha: diff != 0 Ha: diff > 0
Pr(T < t) = 0.0010 Pr(|T| > |t|) = 0.0020 Pr(T > t) = 0.9990

157
Table A1.5: t-test for nationalities of tourists and their satisfaction on overall tour
experience
. ttest overallsatisfaction if country==1 | country==5, by(country)
Two-sample t test with equal variances
------------------------------------------------------------------------------
Group | Obs Mean Std. Err. Std. Dev. [95% Conf. Interval]
---------+--------------------------------------------------------------------
1 | 225 4.062222 .0517796 .7766943 3.960185 4.16426
5 | 50 4.34 .1198979 .8478063 4.099056 4.580944
---------+--------------------------------------------------------------------
combined | 275 4.112727 .047986 .7957585 4.018259 4.207195
---------+--------------------------------------------------------------------
diff | -.2777778 .1235033 -.5209176 -.0346379
------------------------------------------------------------------------------
diff = mean(1) - mean(5) t = -2.2492
Ho: diff = 0 degrees of freedom = 273
Ha: diff < 0 Ha: diff != 0 Ha: diff > 0
Pr(T < t) = 0.0126 Pr(|T| > |t|) = 0.0253 Pr(T > t) = 0.9874

158
. ttest overallsatisfaction if country==2 | country==8, by(country)
Two-sample t test with equal variances
------------------------------------------------------------------------------
Group | Obs Mean Std. Err. Std. Dev. [95% Conf. Interval]
---------+--------------------------------------------------------------------
2 | 35 3.971429 .161327 .9544236 3.643573 4.299285
8 | 24 4.458333 .1471858 .72106 4.153856 4.76281
---------+--------------------------------------------------------------------
combined | 59 4.169492 .1163253 .8935119 3.936641 4.402342
---------+--------------------------------------------------------------------
diff | -.4869048 .2300002 -.9474722 -.0263373
------------------------------------------------------------------------------
diff = mean(2) - mean(8) t = -2.1170
Ho: diff = 0 degrees of freedom = 57
Ha: diff < 0 Ha: diff != 0 Ha: diff > 0
Pr(T < t) = 0.0193 Pr(|T| > |t|) = 0.0386 Pr(T > t) = 0.9807
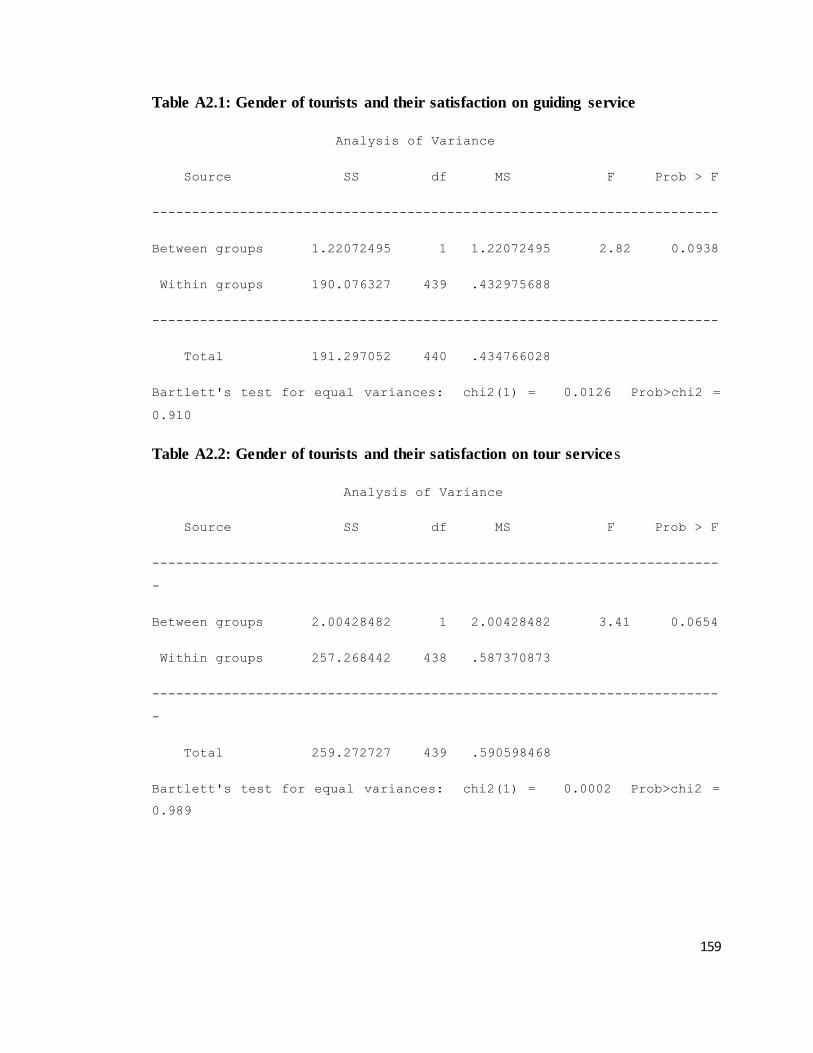
159
Table A2.1: Gender of tourists and their satisfaction on guiding service
Analysis of Variance
Source SS df MS F Prob > F
-----------------------------------------------------------------------
Between groups 1.22072495 1 1.22072495 2.82 0.0938
Within groups 190.076327 439 .432975688
-----------------------------------------------------------------------
Total 191.297052 440 .434766028
Bartlett's test for equal variances: chi2(1) = 0.0126 Prob>chi2 =
0.910
Table A2.2: Gender of tourists and their satisfaction on tour services
Analysis of Variance
Source SS df MS F Prob > F
-----------------------------------------------------------------------
-
Between groups 2.00428482 1 2.00428482 3.41 0.0654
Within groups 257.268442 438 .587370873
-----------------------------------------------------------------------
-
Total 259.272727 439 .590598468
Bartlett's test for equal variances: chi2(1) = 0.0002 Prob>chi2 =
0.989

160
Table A2.3: Gender of tourists and their satisfaction on overall tour experience
Analysis of Variance
Source SS df MS F Prob > F
-----------------------------------------------------------------------
Between groups 3.16869234 1 3.16869234 4.93 0.0269
Within groups 281.629035 438 .642988664
-----------------------------------------------------------------------
Total 284.797727 439 .648741976
Bartlett's test for equal variances: chi2(1) = 0.7149 Prob>chi2 =
0.398
Table A2.4: t-test for gender of tourists and their satisfaction on overall tour
experience
. ttest overallsatisfaction, by(gender)
Two-sample t test with equal variances
------------------------------------------------------------------------------
Group | Obs Mean Std. Err. Std. Dev. [95% Conf. Interval]
---------+--------------------------------------------------------------------
1 | 234 4.07265 .0509916 .7800213 3.972186 4.173113
2 | 206 4.242718 .0575496 .8259926 4.129253 4.356184
---------+--------------------------------------------------------------------
combined | 440 4.152273 .0383981 .8054452 4.076806 4.22774
---------+--------------------------------------------------------------------
diff | -.1700689 .0766102 -.3206381 -.0194996
------------------------------------------------------------------------------
diff = mean(1) - mean(2) t = -2.2199
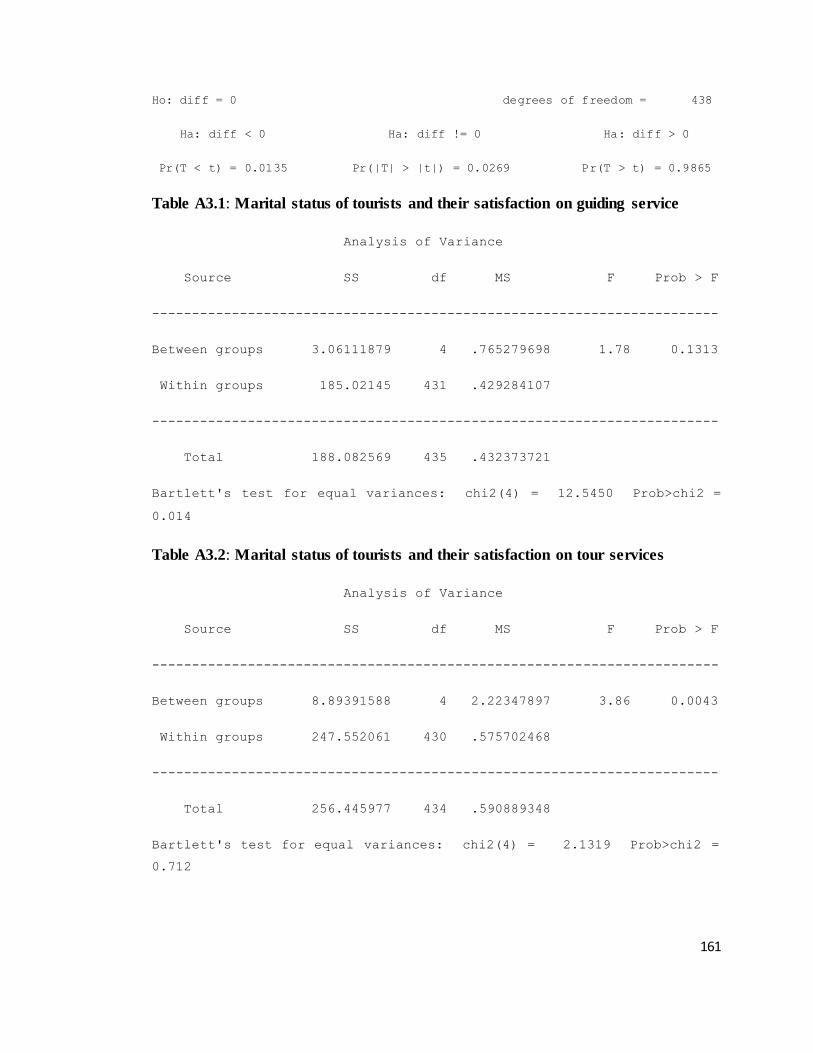
161
Ho: diff = 0 degrees of freedom = 438
Ha: diff < 0 Ha: diff != 0 Ha: diff > 0
Pr(T < t) = 0.0135 Pr(|T| > |t|) = 0.0269 Pr(T > t) = 0.9865
Table A3.1: Marital status of tourists and their satisfaction on guiding service
Analysis of Variance
Source SS df MS F Prob > F
-----------------------------------------------------------------------
Between groups 3.06111879 4 .765279698 1.78 0.1313
Within groups 185.02145 431 .429284107
-----------------------------------------------------------------------
Total 188.082569 435 .432373721
Bartlett's test for equal variances: chi2(4) = 12.5450 Prob>chi2 =
0.014
Table A3.2: Marital status of tourists and their satisfaction on tour services
Analysis of Variance
Source SS df MS F Prob > F
-----------------------------------------------------------------------
Between groups 8.89391588 4 2.22347897 3.86 0.0043
Within groups 247.552061 430 .575702468
-----------------------------------------------------------------------
Total 256.445977 434 .590889348
Bartlett's test for equal variances: chi2(4) = 2.1319 Prob>chi2 =
0.712

162
Table A3.3: Marital status of tourists and their satisfaction on overall tour
experience
Analysis of Variance
Source SS df MS F Prob > F
-----------------------------------------------------------------------
Between groups 15.9526043 4 3.98815108 6.45 0.0000
Within groups 266.033603 430 .618682797
-----------------------------------------------------------------------
Total 281.986207 434 .649737804
Bartlett's test for equal variances: chi2(4) = 1.8376 Prob>chi2 =
0.766
Table A3.4: t-test for marital status of tourists and their satisfaction on tour
services
. ttest toursatisfaction if maritalstatus==1 | maritalstatus==3,
by(maritalstatus)
Two-sample t test with equal variances
------------------------------------------------------------------------------
Group | Obs Mean Std. Err. Std. Dev. [95% Conf. Interval]
---------+--------------------------------------------------------------------
1 | 177 4.316384 .0578579 .7697494 4.2022 4.430569
3 | 82 3.987805 .0822996 .745255 3.824054 4.151555
---------+--------------------------------------------------------------------
combined | 259 4.212355 .0482119 .7758977 4.117416 4.307294
---------+--------------------------------------------------------------------
diff | .3285793 .1018067 .1280977 .5290609
------------------------------------------------------------------------------

163
diff = mean(1) - mean(3) t = 3.2275
Ho: diff = 0 degrees of freedom = 257
Ha: diff < 0 Ha: diff != 0 Ha: diff > 0
Pr(T < t) = 0.9993 Pr(|T| > |t|) = 0.0014 Pr(T > t) = 0.0007
. ttest toursatisfaction if maritalstatus==2 | maritalstatus==3,
by(maritalstatus)
Two-sample t test with equal variances
------------------------------------------------------------------------------
Group | Obs Mean Std. Err. Std. Dev. [95% Conf. Interval]
---------+--------------------------------------------------------------------
2 | 163 4.349693 .0600019 .7660524 4.231207 4.46818
3 | 82 3.987805 .0822996 .745255 3.824054 4.151555
---------+--------------------------------------------------------------------
combined | 245 4.228571 .0496222 .7767102 4.130829 4.326314
---------+--------------------------------------------------------------------
diff | .3618884 .1027848 .1594255 .5643513
------------------------------------------------------------------------------
diff = mean(2) - mean(3) t = 3.5208
Ho: diff = 0 degrees of freedom = 243
Ha: diff < 0 Ha: diff != 0 Ha: diff > 0
Pr(T < t) = 0.9997 Pr(|T| > |t|) = 0.0005 Pr(T > t) = 0.0003

164
. ttest toursatisfaction if maritalstatus==3 | maritalstatus==5,
by(maritalstatus)\
Two-sample t test with equal variances
------------------------------------------------------------------------------
Group | Obs Mean Std. Err. Std. Dev. [95% Conf. Interval]
---------+--------------------------------------------------------------------
3 | 82 3.987805 .0822996 .745255 3.824054 4.151555
5 | 7 4.571429 .2020305 .5345225 4.077078 5.065779
---------+--------------------------------------------------------------------
combined | 89 4.033708 .0790156 .7454321 3.876681 4.190735
---------+--------------------------------------------------------------------
diff | -.5836237 .2885012 -1.157051 -.0101964
------------------------------------------------------------------------------
diff = mean(3) - mean(5) t = -2.0230
Ho: diff = 0 degrees of freedom = 87
Ha: diff < 0 Ha: diff != 0 Ha: diff > 0
Pr(T < t) = 0.0231 Pr(|T| > |t|) = 0.0461 Pr(T > t) = 0.9769

165
Table A3.5: t-test for marital status of tourists and their satisfaction on the overall
tour experience
. ttest overallsatisfaction if maritalstatus==1 | maritalstatus==3,
by(maritalstatus)
Two-sample t test with equal variances
------------------------------------------------------------------------------
Group | Obs Mean Std. Err. Std. Dev. [95% Conf. Interval]
---------+--------------------------------------------------------------------
1 | 176 4.238636 .0618905 .8210699 4.116489 4.360784
3 | 82 3.756098 .0805749 .7296367 3.595779 3.916416
---------+--------------------------------------------------------------------
combined | 258 4.085271 .0512452 .8231193 3.984357 4.186185
---------+--------------------------------------------------------------------
diff | .4825388 .1060653 .2736672 .6914104
------------------------------------------------------------------------------
diff = mean(1) - mean(3) t = 4.5495
Ho: diff = 0 degrees of freedom = 256
Ha: diff < 0 Ha: diff != 0 Ha: diff > 0
Pr(T < t) = 1.0000 Pr(|T| > |t|) = 0.0000 Pr(T > t) = 0.0000

166
. ttest overallsatisfaction if maritalstatus==2 | maritalstatus==3,
by(maritalstatus)
Two-sample t test with equal variances
------------------------------------------------------------------------------
Group | Obs Mean Std. Err. Std. Dev. [95% Conf. Interval]
---------+--------------------------------------------------------------------
2 | 164 4.256098 .0603136 .7723913 4.137001 4.375194
3 | 82 3.756098 .0805749 .7296367 3.595779 3.916416
---------+--------------------------------------------------------------------
combined | 246 4.089431 .050554 .7929087 3.989855 4.189007
---------+--------------------------------------------------------------------
diff | .5 .1025828 .2979392 .7020608
------------------------------------------------------------------------------
diff = mean(2) - mean(3) t = 4.8741
Ho: diff = 0 degrees of freedom = 244
Ha: diff < 0 Ha: diff != 0 Ha: diff > 0
Pr(T < t) = 1.0000 Pr(|T| > |t|) = 0.0000 Pr(T > t) = 0.0000

167
Table A4.1: Age of tourists and their satisfaction on guiding service
Analysis of Variance
Source SS df MS F Prob > F
-----------------------------------------------------------------------
Between groups 4.66019429 5 .932038857 2.17 0.0564
Within groups 186.337533 434 .429349154
-----------------------------------------------------------------------
Total 190.997727 439 .43507455
Bartlett's test for equal variances: chi2(5) = 5.6540 Prob>chi2 =
0.341
Table A4.2: Age of tourists and their satisfaction on tour services
Analysis of Variance
Source SS df MS F Prob > F
-----------------------------------------------------------------------
Between groups 13.2127917 5 2.64255834 4.66 0.0004
Within groups 245.529805 433 .56704343
-----------------------------------------------------------------------
Total 258.742597 438 .590736522
Bartlett's test for equal variances: chi2(5) = 1.4463 Prob>chi2 =
0.919

168
Table A4.3: Age of tourists and their satisfaction on overall tour experience
Analysis of Variance
Source SS df MS F Prob > F
-----------------------------------------------------------------------
Between groups 17.1253194 5 3.42506388 5.56 0.0001
Within groups 266.952129 433 .61651762
-----------------------------------------------------------------------
Total 284.077449 438 .64857865
Bartlett's test for equal variances: chi2(5) = 1.0863 Prob>chi2 =
0.955
Table A4.4: t-test for age of tourists and their satisfaction on tour services
. ttest toursatisfaction if age==2 | age==3, by(age)
Two-sample t test with equal variances
------------------------------------------------------------------------------
Group | Obs Mean Std. Err. Std. Dev. [95% Conf. Interval]
---------+--------------------------------------------------------------------
2 | 116 4.37931 .0666787 .7181519 4.247233 4.511388
3 | 145 4.034483 .0652242 .7854032 3.905562 4.163403
---------+--------------------------------------------------------------------
combined | 261 4.187739 .0479157 .7741019 4.093387 4.282092
---------+--------------------------------------------------------------------
diff | .3448276 .0942086 .1593153 .5303399
------------------------------------------------------------------------------
diff = mean(2) - mean(3) t = 3.6603
Ho: diff = 0 degrees of freedom = 259
Ha: diff < 0 Ha: diff != 0 Ha: diff > 0
Pr(T < t) = 0.9998 Pr(|T| > |t|) = 0.0003 Pr(T > t) = 0.0002

169
. ttest toursatisfaction if age==3 | age==4, by(age)
Two-sample t test with equal variances
------------------------------------------------------------------------------
Group | Obs Mean Std. Err. Std. Dev. [95% Conf. Interval]
---------+--------------------------------------------------------------------
3 | 145 4.034483 .0652242 .7854032 3.905562 4.163403
4 | 80 4.3125 .080728 .7220532 4.151815 4.473185
---------+--------------------------------------------------------------------
combined | 225 4.133333 .0515629 .7734431 4.031723 4.234944
---------+--------------------------------------------------------------------
diff | -.2780172 .1063425 -.487582 -.0684525
------------------------------------------------------------------------------
diff = mean(3) - mean(4) t = -2.6144
Ho: diff = 0 degrees of freedom = 223
Ha: diff < 0 Ha: diff != 0 Ha: diff > 0
Pr(T < t) = 0.0048 Pr(|T| > |t|) = 0.0095 Pr(T > t) = 0.9952
. ttest toursatisfaction if age==3 | age==5, by(age)
Two-sample t test with equal variances
------------------------------------------------------------------------------
Group | Obs Mean Std. Err. Std. Dev. [95% Conf. Interval]
---------+--------------------------------------------------------------------
3 | 145 4.034483 .0652242 .7854032 3.905562 4.163403
5 | 51 4.45098 .1095936 .7826551 4.230855 4.671106
---------+--------------------------------------------------------------------
combined | 196 4.142857 .0574169 .803837 4.029619 4.256095
---------+--------------------------------------------------------------------
diff | -.4164976 .1277498 -.6684545 -.1645408
------------------------------------------------------------------------------

170
diff = mean(3) - mean(5) t = -3.2603
Ho: diff = 0 degrees of freedom = 194
Ha: diff < 0 Ha: diff != 0 Ha: diff > 0
Pr(T < t) = 0.0007 Pr(|T| > |t|) = 0.0013 Pr(T > t) = 0.9993
. ttest toursatisfaction if age==3 | age==6, by(age)
Two-sample t test with equal variances
------------------------------------------------------------------------------
Group | Obs Mean Std. Err. Std. Dev. [95% Conf. Interval]
---------+--------------------------------------------------------------------
3 | 145 4.034483 .0652242 .7854032 3.905562 4.163403
6 | 34 4.5 .1284072 .7487363 4.238754 4.761246
---------+--------------------------------------------------------------------
combined | 179 4.122905 .0596308 .7978063 4.005231 4.240579
---------+--------------------------------------------------------------------
diff | -.4655172 .1483789 -.7583366 -.1726979
------------------------------------------------------------------------------
diff = mean(3) - mean(6) t = -3.1374
Ho: diff = 0 degrees of freedom = 177
Ha: diff < 0 Ha: diff != 0 Ha: diff > 0
Pr(T < t) = 0.0010 Pr(|T| > |t|) = 0.0020 Pr(T > t) = 0.9990

171
Table A4.5: t-test for age of tourists and their satisfaction on the overall tour
experience
. ttest overallsatisfaction if age==2 | age==3, by(age)
Two-sample t test with equal variances
------------------------------------------------------------------------------
Group | Obs Mean Std. Err. Std. Dev. [95% Conf. Interval]
---------+--------------------------------------------------------------------
2 | 116 4.258621 .071523 .7703267 4.116947 4.400294
3 | 145 3.910345 .0641159 .7720575 3.783615 4.037075
---------+--------------------------------------------------------------------
combined | 261 4.065134 .0488435 .7890908 3.968955 4.161313
---------+--------------------------------------------------------------------
diff | .3482759 .0960782 .1590821 .5374697
------------------------------------------------------------------------------
diff = mean(2) - mean(3) t = 3.6249
Ho: diff = 0 degrees of freedom = 259
Ha: diff < 0 Ha: diff != 0 Ha: diff > 0
Pr(T < t) = 0.9998 Pr(|T| > |t|) = 0.0003 Pr(T > t) = 0.0002
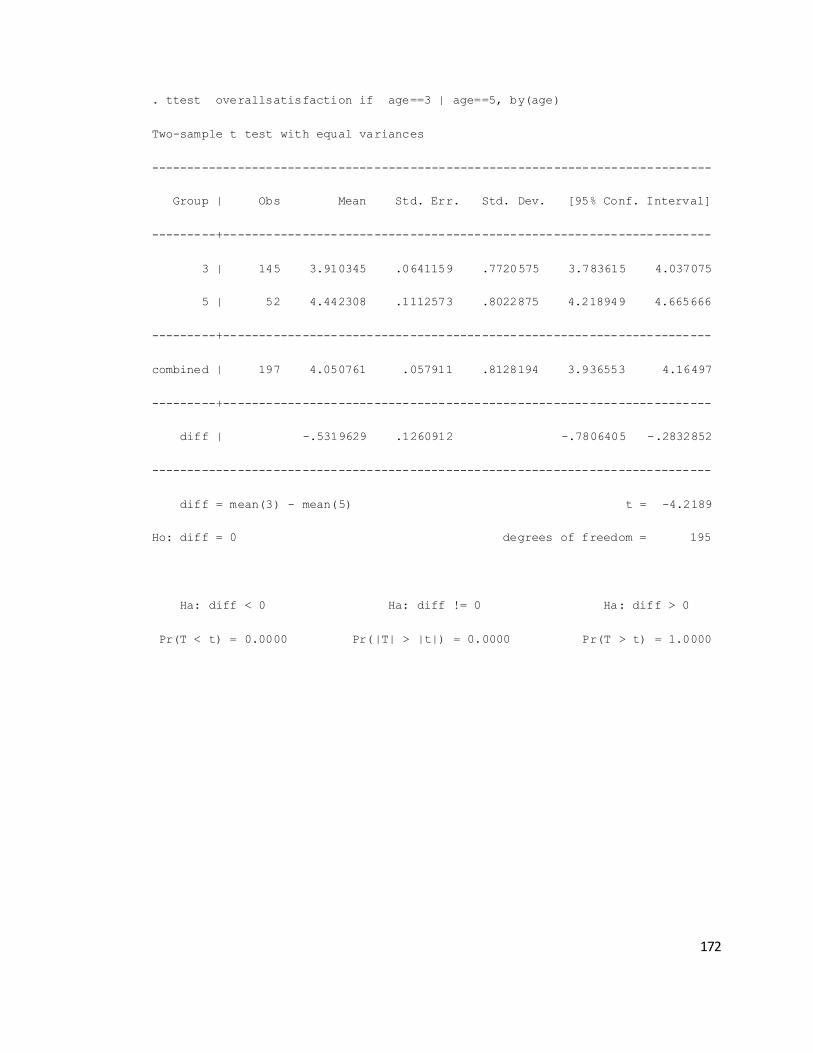
172
. ttest overallsatisfaction if age==3 | age==5, by(age)
Two-sample t test with equal variances
------------------------------------------------------------------------------
Group | Obs Mean Std. Err. Std. Dev. [95% Conf. Interval]
---------+--------------------------------------------------------------------
3 | 145 3.910345 .0641159 .7720575 3.783615 4.037075
5 | 52 4.442308 .1112573 .8022875 4.218949 4.665666
---------+--------------------------------------------------------------------
combined | 197 4.050761 .057911 .8128194 3.936553 4.16497
---------+--------------------------------------------------------------------
diff | -.5319629 .1260912 -.7806405 -.2832852
------------------------------------------------------------------------------
diff = mean(3) - mean(5) t = -4.2189
Ho: diff = 0 degrees of freedom = 195
Ha: diff < 0 Ha: diff != 0 Ha: diff > 0
Pr(T < t) = 0.0000 Pr(|T| > |t|) = 0.0000 Pr(T > t) = 1.0000

173
. ttest overallsatisfaction if age==3 | age==6, by(age)
Two-sample t test with equal variances
------------------------------------------------------------------------------
Group | Obs Mean Std. Err. Std. Dev. [95% Conf. Interval]
---------+--------------------------------------------------------------------
3 | 145 3.910345 .0641159 .7720575 3.783615 4.037075
6 | 34 4.441176 .1279983 .7463518 4.180762 4.701591
---------+--------------------------------------------------------------------
combined | 179 4.011173 .0592829 .7931506 3.894186 4.128161
---------+--------------------------------------------------------------------
diff | -.5308316 .1462128 -.8193763 -.242287
------------------------------------------------------------------------------
diff = mean(3) - mean(6) t = -3.6305
Ho: diff = 0 degrees of freedom = 177
Ha: diff < 0 Ha: diff != 0 Ha: diff > 0
Pr(T < t) = 0.0002 Pr(|T| > |t|) = 0.0004 Pr(T > t) = 0.9998

174
. ttest overallsatisfaction if age==4 | age==5, by(age)
Two-sample t test with equal variances
------------------------------------------------------------------------------
Group | Obs Mean Std. Err. Std. Dev. [95% Conf. Interval]
---------+--------------------------------------------------------------------
4 | 79 4.113924 .0918407 .8162978 3.931083 4.296765
5 | 52 4.442308 .1112573 .8022875 4.218949 4.665666
---------+--------------------------------------------------------------------
combined | 131 4.244275 .0719591 .8236093 4.101912 4.386637
---------+--------------------------------------------------------------------
diff | -.3283836 .1447863 -.614847 -.0419203
------------------------------------------------------------------------------
diff = mean(4) - mean(5) t = -2.2681
Ho: diff = 0 degrees of freedom = 129
Ha: diff < 0 Ha: diff != 0 Ha: diff > 0
Pr(T < t) = 0.0125 Pr(|T| > |t|) = 0.0250 Pr(T > t) = 0.9875

175
. ttest overallsatisfaction if age==4 | age==6, by(age)
Two-sample t test with equal variances
------------------------------------------------------------------------------
Group | Obs Mean Std. Err. Std. Dev. [95% Conf. Interval]
---------+--------------------------------------------------------------------
4 | 79 4.113924 .0918407 .8162978 3.931083 4.296765
6 | 34 4.441176 .1279983 .7463518 4.180762 4.701591
---------+--------------------------------------------------------------------
combined | 113 4.212389 .0758968 .806794 4.06201 4.362769
---------+--------------------------------------------------------------------
diff | -.3272524 .1632971 -.6508365 -.0036683
------------------------------------------------------------------------------
diff = mean(4) - mean(6) t = -2.0040
Ho: diff = 0 degrees of freedom = 111
Ha: diff < 0 Ha: diff != 0 Ha: diff > 0
Pr(T < t) = 0.0238 Pr(|T| > |t|) = 0.0475 Pr(T > t) = 0.9762

176
Table A5.1: Education level of tourists and their satisfaction on guiding service
Analysis of Variance
Source SS df MS F Prob > F
-----------------------------------------------------------------------
Between groups 1.29729756 5 .259459512 0.59 0.7052
Within groups 189.399741 433 .437412797
-----------------------------------------------------------------------
Total 190.697039 438 .435381367
Bartlett's test for equal variances: chi2(5) = 5.4663 Prob>chi2 =
0.362
Table A5.2: Education level of tourists and their satisfaction on tour services
Analysis of Variance
Source SS df MS F Prob > F
-----------------------------------------------------------------------
Between groups 15.3776651 5 3.07553301 5.47 0.0001
Within groups 242.832381 432 .562111992
-----------------------------------------------------------------------
Total 258.210046 437 .59086967
Bartlett's test for equal variances: chi2(5) = 8.0807 Prob>chi2 =
0.152

177
Table A5.3: Education level of tourists and their satisfaction on overall tour
experience
Analysis of Variance
Source SS df MS F Prob > F
-----------------------------------------------------------------------
Between groups 44.258871 5 8.8517742 15.99 0.0000
Within groups 239.09501 432 .553460672
-----------------------------------------------------------------------
Total 283.353881 437 .648407051
Bartlett's test for equal variances: chi2(5) = 14.7081 Prob>chi2 =
0.012
Table A5.4: t-test for education level of tourists and their satisfaction on the tour
services
. ttest toursatisfaction if education==5 | education==7, by(education)
Two-sample t test with equal variances
------------------------------------------------------------------------------
Group | Obs Mean Std. Err. Std. Dev. [95% Conf. Interval]
---------+--------------------------------------------------------------------
5 | 79 4.037975 .096082 .8539957 3.84669 4.229259
7 | 113 4.451327 .0628434 .6680348 4.326811 4.575844
---------+--------------------------------------------------------------------
combined | 192 4.28125 .0559535 .7753145 4.170884 4.391616
---------+--------------------------------------------------------------------
diff | -.4133528 .1099881 -.6303074 -.1963981
------------------------------------------------------------------------------

178
diff = mean(5) - mean(7) t = -3.7582
Ho: diff = 0 degrees of freedom = 190
Ha: diff < 0 Ha: diff != 0 Ha: diff > 0
Pr(T < t) = 0.0001 Pr(|T| > |t|) = 0.0002 Pr(T > t) = 0.9999
. ttest toursatisfaction if education==5 | education==8, by(education)
Two-sample t test with equal variances
------------------------------------------------------------------------------
Group | Obs Mean Std. Err. Std. Dev. [95% Conf. Interval]
---------+--------------------------------------------------------------------
5 | 79 4.037975 .096082 .8539957 3.84669 4.229259
8 | 69 4.478261 .0815679 .6775539 4.315495 4.641027
---------+--------------------------------------------------------------------
combined | 148 4.243243 .0661649 .8049306 4.112486 4.374
---------+--------------------------------------------------------------------
diff | -.4402862 .1280008 -.6932601 -.1873123
------------------------------------------------------------------------------
diff = mean(5) - mean(8) t = -3.4397
Ho: diff = 0 degrees of freedom = 146
Ha: diff < 0 Ha: diff != 0 Ha: diff > 0
Pr(T < t) = 0.0004 Pr(|T| > |t|) = 0.0008 Pr(T > t) = 0.9996

179
. ttest toursatisfaction if education==6 | education==7, by(education)
Two-sample t test with equal variances
------------------------------------------------------------------------------
Group | Obs Mean Std. Err. Std. Dev. [95% Conf. Interval]
---------+--------------------------------------------------------------------
6 | 164 4.140244 .0610933 .7823764 4.019608 4.26088
7 | 113 4.451327 .0628434 .6680348 4.326811 4.575844
---------+--------------------------------------------------------------------
combined | 277 4.267148 .0452053 .7523659 4.178157 4.356139
---------+--------------------------------------------------------------------
diff | -.3110835 .0902206 -.4886942 -.1334728
------------------------------------------------------------------------------
diff = mean(6) - mean(7) t = -3.4480
Ho: diff = 0 degrees of freedom = 275
Ha: diff < 0 Ha: diff != 0 Ha: diff > 0
Pr(T < t) = 0.0003 Pr(|T| > |t|) = 0.0007 Pr(T > t) = 0.9997

180
. ttest toursatisfaction if education==6 | education==8, by(education)
Two-sample t test with equal variances
------------------------------------------------------------------------------
Group | Obs Mean Std. Err. Std. Dev. [95% Conf. Interval]
---------+--------------------------------------------------------------------
6 | 164 4.140244 .0610933 .7823764 4.019608 4.26088
8 | 69 4.478261 .0815679 .6775539 4.315495 4.641027
---------+--------------------------------------------------------------------
combined | 233 4.240343 .0502585 .7671622 4.141322 4.339365
---------+--------------------------------------------------------------------
diff | -.338017 .1080557 -.5509176 -.1251163
------------------------------------------------------------------------------
diff = mean(6) - mean(8) t = -3.1282
Ho: diff = 0 degrees of freedom = 231
Ha: diff < 0 Ha: diff != 0 Ha: diff > 0
Pr(T < t) = 0.0010 Pr(|T| > |t|) = 0.0020 Pr(T > t) = 0.9990

181
Table A5.5: t-test for education level of tourists and their satisfaction on overall
tour experience
. ttest overallsatisfaction if education==4 | education==5, by(education)
Two-sample t test with equal variances
------------------------------------------------------------------------------
Group | Obs Mean Std. Err. Std. Dev. [95% Conf. Interval]
---------+--------------------------------------------------------------------
4 | 9 4.444444 .2421611 .7264832 3.88602 5.002869
5 | 79 3.810127 .0883987 .7857048 3.634138 3.986115
---------+--------------------------------------------------------------------
combined | 88 3.875 .0852382 .7996048 3.70558 4.04442
---------+--------------------------------------------------------------------
diff | .6343179 .2745464 .0885378 1.180098
------------------------------------------------------------------------------
diff = mean(4) - mean(5) t = 2.3104
Ho: diff = 0 degrees of freedom = 86
Ha: diff < 0 Ha: diff != 0 Ha: diff > 0
Pr(T < t) = 0.9884 Pr(|T| > |t|) = 0.0233 Pr(T > t) = 0.0116

182
. ttest overallsatisfaction if education==5 | education==7, by(education)
Two-sample t test with equal variances
------------------------------------------------------------------------------
Group | Obs Mean Std. Err. Std. Dev. [95% Conf. Interval]
---------+--------------------------------------------------------------------
5 | 79 3.810127 .0883987 .7857048 3.634138 3.986115
7 | 114 4.491228 .060075 .6414256 4.372209 4.610248
---------+--------------------------------------------------------------------
combined | 193 4.212435 .0560199 .7782531 4.101942 4.322929
---------+--------------------------------------------------------------------
diff | -.6811015 .1030482 -.8843602 -.4778428
------------------------------------------------------------------------------
diff = mean(5) - mean(7) t = -6.6095
Ho: diff = 0 degrees of freedom = 191
Ha: diff < 0 Ha: diff != 0 Ha: diff > 0
Pr(T < t) = 0.0000 Pr(|T| > |t|) = 0.0000 Pr(T > t) = 1.0000
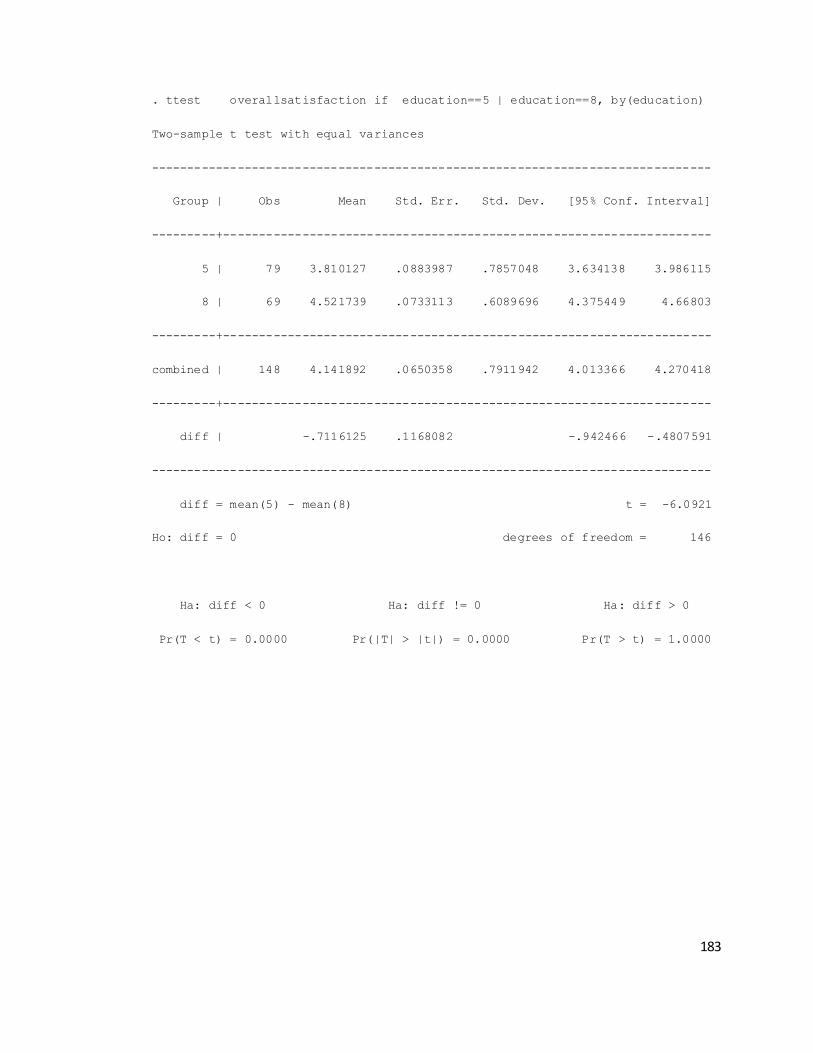
183
. ttest overallsatisfaction if education==5 | education==8, by(education)
Two-sample t test with equal variances
------------------------------------------------------------------------------
Group | Obs Mean Std. Err. Std. Dev. [95% Conf. Interval]
---------+--------------------------------------------------------------------
5 | 79 3.810127 .0883987 .7857048 3.634138 3.986115
8 | 69 4.521739 .0733113 .6089696 4.375449 4.66803
---------+--------------------------------------------------------------------
combined | 148 4.141892 .0650358 .7911942 4.013366 4.270418
---------+--------------------------------------------------------------------
diff | -.7116125 .1168082 -.942466 -.4807591
------------------------------------------------------------------------------
diff = mean(5) - mean(8) t = -6.0921
Ho: diff = 0 degrees of freedom = 146
Ha: diff < 0 Ha: diff != 0 Ha: diff > 0
Pr(T < t) = 0.0000 Pr(|T| > |t|) = 0.0000 Pr(T > t) = 1.0000

184
. ttest overallsatisfaction if education==6 | education==7, by(education)
Two-sample t test with equal variances
------------------------------------------------------------------------------
Group | Obs Mean Std. Err. Std. Dev. [95% Conf. Interval]
---------+--------------------------------------------------------------------
6 | 163 3.889571 .0657089 .8389156 3.759814 4.019327
7 | 114 4.491228 .060075 .6414256 4.372209 4.610248
---------+--------------------------------------------------------------------
combined | 277 4.137184 .0491633 .8182409 4.040401 4.233967
---------+--------------------------------------------------------------------
diff | -.6016575 .0932759 -.7852831 -.4180319
------------------------------------------------------------------------------
diff = mean(6) - mean(7) t = -6.4503
Ho: diff = 0 degrees of freedom = 275
Ha: diff < 0 Ha: diff != 0 Ha: diff > 0
Pr(T < t) = 0.0000 Pr(|T| > |t|) = 0.0000 Pr(T > t) = 1.0000

185
. ttest overallsatisfaction if education==6 | education==8, by(education)
Two-sample t test with equal variances
------------------------------------------------------------------------------
Group | Obs Mean Std. Err. Std. Dev. [95% Conf. Interval]
---------+--------------------------------------------------------------------
6 | 163 3.889571 .0657089 .8389156 3.759814 4.019327
8 | 69 4.521739 .0733113 .6089696 4.375449 4.66803
---------+--------------------------------------------------------------------
combined | 232 4.077586 .0544009 .8286103 3.970401 4.184772
---------+--------------------------------------------------------------------
diff | -.6321686 .1117449 -.8523431 -.4119941
------------------------------------------------------------------------------
diff = mean(6) - mean(8) t = -5.6572
Ho: diff = 0 degrees of freedom = 230
Ha: diff < 0 Ha: diff != 0 Ha: diff > 0
Pr(T < t) = 0.0000 Pr(|T| > |t|) = 0.0000 Pr(T > t) = 1.0000
Table A6.1: Occupation of tourists and their satisfaction on guiding service
Analysis of Variance
Source SS df MS F Prob > F
-----------------------------------------------------------------------
Between groups 2.28177551 7 .32596793 0.74 0.6354
Within groups 187.706757 428 .438567188
-----------------------------------------------------------------------
Total 189.988532 435 .436755246

186
Bartlett's test for equal variances: chi2(7) = 23.8665 Prob>chi2 =
0.001
Table A6.2: Occupation of tourists and their satisfaction on tour services
Analysis of Variance
Source SS df MS F Prob > F
-----------------------------------------------------------------------
Between groups 6.74932712 7 .964189588 1.64 0.1219
Within groups 250.781707 427 .58731079
-----------------------------------------------------------------------
Total 257.531034 434 .59338948
Bartlett's test for equal variances: chi2(7) = 10.6242 Prob>chi2 =
0.156
Table A6.3: Occupation of tourists and their satisfaction on overall tour experience
Analysis of Variance
Source SS df MS F Prob > F
-----------------------------------------------------------------------
Between groups 31.0499022 7 4.43570031 7.53 0.0000
Within groups 251.534006 427 .589072613
-----------------------------------------------------------------------
Total 282.583908 434 .651114995
Bartlett's test for equal variances: chi2(7) = 13.3521 Prob>chi2 =
0.064

187
Table A6.4: t-test for occupation of tourists and their satisfaction on overall tour
experience
. ttest overallsatisfaction if occupation==1 | occupation==7,
by(occupation)
Two-sample t test with equal variances
------------------------------------------------------------------------------
Group | Obs Mean Std. Err. Std. Dev. [95% Conf. Interval]
---------+--------------------------------------------------------------------
1 | 132 4.318182 .0639133 .7343084 4.191746 4.444618
7 | 116 3.732759 .0685661 .7384797 3.596942 3.868575
---------+--------------------------------------------------------------------
combined | 248 4.044355 .0502235 .7909204 3.945434 4.143276
---------+--------------------------------------------------------------------
diff | .5854232 .0937005 .4008656 .7699808
------------------------------------------------------------------------------
diff = mean(1) - mean(7) t = 6.2478
Ho: diff = 0 degrees of freedom = 246
Ha: diff < 0 Ha: diff != 0 Ha: diff > 0
Pr(T < t) = 1.0000 Pr(|T| > |t|) = 0.0000 Pr(T > t) = 0.0000

188
. ttest overallsatisfaction if occupation==2 | occupation==7,
by(occupation)
Two-sample t test with equal variances
------------------------------------------------------------------------------
Group | Obs Mean Std. Err. Std. Dev. [95% Conf. Interval]
---------+--------------------------------------------------------------------
2 | 16 4.3125 .2695482 1.078193 3.737972 4.887028
7 | 116 3.732759 .0685661 .7384797 3.596942 3.868575
---------+--------------------------------------------------------------------
combined | 132 3.80303 .0700611 .8049408 3.664433 3.941628
---------+--------------------------------------------------------------------
diff | .5797414 .2094046 .1654594 .9940234
------------------------------------------------------------------------------
diff = mean(2) - mean(7) t = 2.7685
Ho: diff = 0 degrees of freedom = 130
Ha: diff < 0 Ha: diff != 0 Ha: diff > 0
Pr(T < t) = 0.9968 Pr(|T| > |t|) = 0.0065 Pr(T > t) = 0.0032

189
. ttest overallsatisfaction if occupation==3 | occupation==4,
by(occupation)
Two-sample t test with equal variances
------------------------------------------------------------------------------
Group | Obs Mean Std. Err. Std. Dev. [95% Conf. Interval]
---------+--------------------------------------------------------------------
3 | 71 4.126761 .1021491 .8607236 3.923031 4.330491
4 | 18 4.555556 .1205169 .51131 4.301287 4.809824
---------+--------------------------------------------------------------------
combined | 89 4.213483 .0867527 .818423 4.04108 4.385886
---------+--------------------------------------------------------------------
diff | -.428795 .2122942 -.8507526 -.0068374
------------------------------------------------------------------------------
diff = mean(3) - mean(4) t = -2.0198
Ho: diff = 0 degrees of freedom = 87
Ha: diff < 0 Ha: diff != 0 Ha: diff > 0
Pr(T < t) = 0.0232 Pr(|T| > |t|) = 0.0465 Pr(T > t) = 0.9768
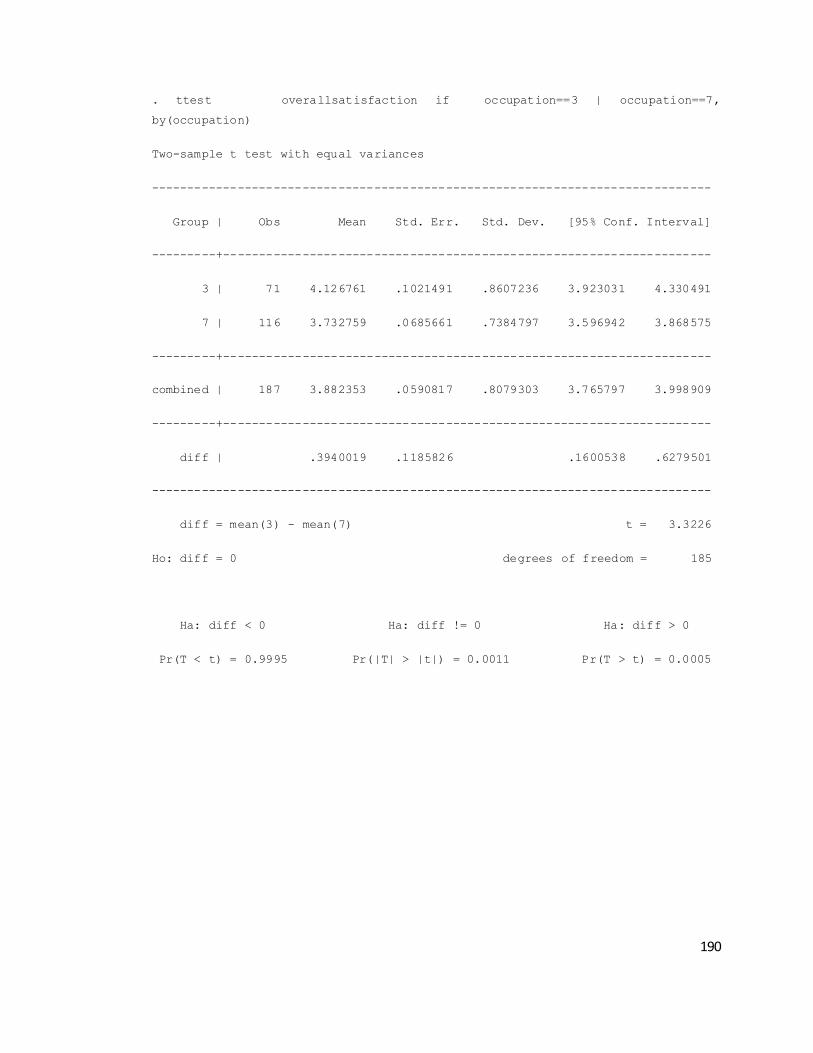
190
. ttest overallsatisfaction if occupation==3 | occupation==7,
by(occupation)
Two-sample t test with equal variances
------------------------------------------------------------------------------
Group | Obs Mean Std. Err. Std. Dev. [95% Conf. Interval]
---------+--------------------------------------------------------------------
3 | 71 4.126761 .1021491 .8607236 3.923031 4.330491
7 | 116 3.732759 .0685661 .7384797 3.596942 3.868575
---------+--------------------------------------------------------------------
combined | 187 3.882353 .0590817 .8079303 3.765797 3.998909
---------+--------------------------------------------------------------------
diff | .3940019 .1185826 .1600538 .6279501
------------------------------------------------------------------------------
diff = mean(3) - mean(7) t = 3.3226
Ho: diff = 0 degrees of freedom = 185
Ha: diff < 0 Ha: diff != 0 Ha: diff > 0
Pr(T < t) = 0.9995 Pr(|T| > |t|) = 0.0011 Pr(T > t) = 0.0005

191
. ttest overallsatisfaction if occupation==4 | occupation==7,
by(occupation)
Two-sample t test with equal variances
------------------------------------------------------------------------------
Group | Obs Mean Std. Err. Std. Dev. [95% Conf. Interval]
---------+--------------------------------------------------------------------
4 | 18 4.555556 .1205169 .51131 4.301287 4.809824
7 | 116 3.732759 .0685661 .7384797 3.596942 3.868575
---------+--------------------------------------------------------------------
combined | 134 3.843284 .0660324 .7643807 3.712674 3.973893
---------+--------------------------------------------------------------------
diff | .8227969 .1806989 .4653567 1.180237
------------------------------------------------------------------------------
diff = mean(4) - mean(7) t = 4.5534
Ho: diff = 0 degrees of freedom = 132
Ha: diff < 0 Ha: diff != 0 Ha: diff > 0
Pr(T < t) = 1.0000 Pr(|T| > |t|) = 0.0000 Pr(T > t) = 0.0000

192
. ttest overallsatisfaction if occupation==5 | occupation==7,
by(occupation)
Two-sample t test with equal variances
------------------------------------------------------------------------------
Group | Obs Mean Std. Err. Std. Dev. [95% Conf. Interval]
---------+--------------------------------------------------------------------
5 | 13 4.230769 .2570505 .9268087 3.670704 4.790834
7 | 116 3.732759 .0685661 .7384797 3.596942 3.868575
---------+--------------------------------------------------------------------
combined | 129 3.782946 .0678087 .7701587 3.648775 3.917117
---------+--------------------------------------------------------------------
diff | .4980106 .2217802 .0591476 .9368736
------------------------------------------------------------------------------
diff = mean(5) - mean(7) t = 2.2455
Ho: diff = 0 degrees of freedom = 127
Ha: diff < 0 Ha: diff != 0 Ha: diff > 0
Pr(T < t) = 0.9868 Pr(|T| > |t|) = 0.0265 Pr(T > t) = 0.0132

193
. ttest overallsatisfaction if occupation==6 | occupation==7,
by(occupation)
Two-sample t test with equal variances
------------------------------------------------------------------------------
Group | Obs Mean Std. Err. Std. Dev. [95% Conf. Interval]
---------+--------------------------------------------------------------------
6 | 24 4.333333 .1554175 .761387 4.011828 4.654839
7 | 116 3.732759 .0685661 .7384797 3.596942 3.868575
---------+--------------------------------------------------------------------
combined | 140 3.835714 .0653952 .773767 3.706416 3.965012
---------+--------------------------------------------------------------------
diff | .6005747 .1664701 .2714128 .9297366
------------------------------------------------------------------------------
diff = mean(6) - mean(7) t = 3.6077
Ho: diff = 0 degrees of freedom = 138
Ha: diff < 0 Ha: diff != 0 Ha: diff > 0
Pr(T < t) = 0.9998 Pr(|T| > |t|) = 0.0004 Pr(T > t) = 0.0002

194
. ttest overallsatisfaction if occupation==7 | occupation==8,
by(occupation)
Two-sample t test with equal variances
------------------------------------------------------------------------------
Group | Obs Mean Std. Err. Std. Dev. [95% Conf. Interval]
---------+--------------------------------------------------------------------
7 | 116 3.732759 .0685661 .7384797 3.596942 3.868575
8 | 45 4.4 .1024941 .6875517 4.193437 4.606563
---------+--------------------------------------------------------------------
combined | 161 3.919255 .0616638 .7824254 3.797475 4.041035
---------+--------------------------------------------------------------------
diff | -.6672414 .1272807 -.9186204 -.4158624
------------------------------------------------------------------------------
diff = mean(7) - mean(8) t = -5.2423
Ho: diff = 0 degrees of freedom = 159
Ha: diff < 0 Ha: diff != 0 Ha: diff > 0
Pr(T < t) = 0.0000 Pr(|T| > |t|) = 0.0000 Pr(T > t) = 1.0000
Table A7.1: Income of tourists and their satisfaction on guiding service
Analysis of Variance
Source SS df MS F Prob > F
-----------------------------------------------------------------------
Between groups .923029069 5 .184605814 0.41 0.8395
Within groups 179.545108 402 .446629622
-----------------------------------------------------------------------
Total 180.468137 407 .443410657

195
Bartlett's test for equal variances: chi2(5) = 16.3604 Prob>chi2 =
0.006
Table A7.2: Income of tourists and their satisfaction on tour services
Analysis of Variance
Source SS df MS F Prob > F
-----------------------------------------------------------------------
Between groups 7.84942092 5 1.56988418 2.67 0.0216
Within groups 235.580555 401 .58748268
-----------------------------------------------------------------------
Total 243.429975 406 .59958122
Bartlett's test for equal variances: chi2(5) = 1.5681 Prob>chi2 =
0.905
Table A7.3: Income of tourists and their satisfaction on overall tour experience
Analysis of Variance
Source SS df MS F Prob > F
-----------------------------------------------------------------------
Between groups 14.183401 5 2.8366802 4.53 0.0005
Within groups 250.604776 400 .626511941
-----------------------------------------------------------------------
Total 264.788177 405 .653797969
Bartlett's test for equal variances: chi2(5) = 0.8903 Prob>chi2 =
0.971

196
Table A7.4: t-test for income of tourists and their satisfaction on tour service
. ttest toursatisfaction if income==1 | income==3, by(income)
Two-sample t test with equal variances
------------------------------------------------------------------------------
Group | Obs Mean Std. Err. Std. Dev. [95% Conf. Interval]
---------+--------------------------------------------------------------------
1 | 54 4.444444 .0977263 .7181388 4.24843 4.640459
3 | 119 4.05042 .0694339 .7574348 3.912922 4.187918
---------+--------------------------------------------------------------------
combined | 173 4.17341 .058202 .765528 4.058528 4.288293
---------+--------------------------------------------------------------------
diff | .3940243 .122317 .1525786 .63547
------------------------------------------------------------------------------
diff = mean(1) - mean(3) t = 3.2213
Ho: diff = 0 degrees of freedom = 171
Ha: diff < 0 Ha: diff != 0 Ha: diff > 0
Pr(T < t) = 0.9992 Pr(|T| > |t|) = 0.0015 Pr(T > t) = 0.0008

197
. ttest toursatisfaction if income==2 | income==3, by(income)
Two-sample t test with equal variances
------------------------------------------------------------------------------
Group | Obs Mean Std. Err. Std. Dev. [95% Conf. Interval]
---------+--------------------------------------------------------------------
2 | 86 4.267442 .0866214 .8032935 4.095215 4.439668
3 | 119 4.05042 .0694339 .7574348 3.912922 4.187918
---------+--------------------------------------------------------------------
combined | 205 4.141463 .0546493 .7824595 4.033713 4.249213
---------+--------------------------------------------------------------------
diff | .2170217 .1099655 .0002007 .4338427
------------------------------------------------------------------------------
diff = mean(2) - mean(3) t = 1.9735
Ho: diff = 0 degrees of freedom = 203
Ha: diff < 0 Ha: diff != 0 Ha: diff > 0
Pr(T < t) = 0.9751 Pr(|T| > |t|) = 0.0498 Pr(T > t) = 0.0249
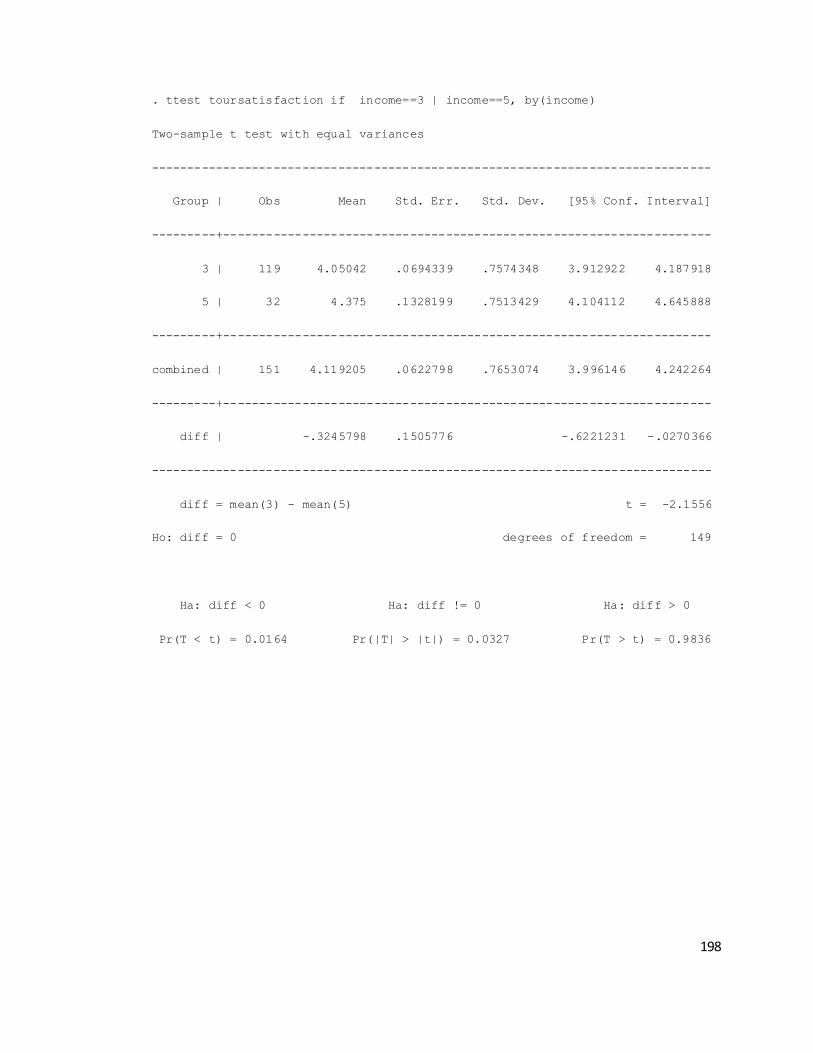
198
. ttest toursatisfaction if income==3 | income==5, by(income)
Two-sample t test with equal variances
------------------------------------------------------------------------------
Group | Obs Mean Std. Err. Std. Dev. [95% Conf. Interval]
---------+--------------------------------------------------------------------
3 | 119 4.05042 .0694339 .7574348 3.912922 4.187918
5 | 32 4.375 .1328199 .7513429 4.104112 4.645888
---------+--------------------------------------------------------------------
combined | 151 4.119205 .0622798 .7653074 3.996146 4.242264
---------+--------------------------------------------------------------------
diff | -.3245798 .1505776 -.6221231 -.0270366
------------------------------------------------------------------------------
diff = mean(3) - mean(5) t = -2.1556
Ho: diff = 0 degrees of freedom = 149
Ha: diff < 0 Ha: diff != 0 Ha: diff > 0
Pr(T < t) = 0.0164 Pr(|T| > |t|) = 0.0327 Pr(T > t) = 0.9836

199
. ttest toursatisfaction if income==3 | income==6, by(income)
Two-sample t test with equal variances
------------------------------------------------------------------------------
Group | Obs Mean Std. Err. Std. Dev. [95% Conf. Interval]
---------+--------------------------------------------------------------------
3 | 119 4.05042 .0694339 .7574348 3.912922 4.187918
6 | 51 4.352941 .1148692 .8203299 4.12222 4.583663
---------+--------------------------------------------------------------------
combined | 170 4.141176 .0603424 .7867684 4.022055 4.260298
---------+--------------------------------------------------------------------
diff | -.302521 .1299904 -.5591462 -.0458958
------------------------------------------------------------------------------
diff = mean(3) - mean(6) t = -2.3273
Ho: diff = 0 degrees of freedom = 168
Ha: diff < 0 Ha: diff != 0 Ha: diff > 0
Pr(T < t) = 0.0106 Pr(|T| > |t|) = 0.0211 Pr(T > t) = 0.9894

200
Table A7.5: t-test for income of tourists and their satisfaction on overall tour
experience
. ttest overallsatisfaction if income==1 | income==2, by(income)
Two-sample t test with equal variances
------------------------------------------------------------------------------
Group | Obs Mean Std. Err. Std. Dev. [95% Conf. Interval]
---------+--------------------------------------------------------------------
1 | 54 4.333333 .1089945 .8009428 4.114718 4.551949
2 | 86 4.034884 .0834412 .7738015 3.86898 4.200787
---------+--------------------------------------------------------------------
combined | 140 4.15 .0671892 .7949933 4.017155 4.282845
---------+--------------------------------------------------------------------
diff | .2984496 .1361822 .0291761 .5677231
------------------------------------------------------------------------------
diff = mean(1) - mean(2) t = 2.1915
Ho: diff = 0 degrees of freedom = 138
Ha: diff < 0 Ha: diff != 0 Ha: diff > 0
Pr(T < t) = 0.9850 Pr(|T| > |t|) = 0.0301 Pr(T > t) = 0.0150

201
. ttest overallsatisfaction if income==1 | income==3, by(income)
Two-sample t test with equal variances
------------------------------------------------------------------------------
Group | Obs Mean Std. Err. Std. Dev. [95% Conf. Interval]
---------+--------------------------------------------------------------------
1 | 54 4.333333 .1089945 .8009428 4.114718 4.551949
3 | 119 3.87395 .0731362 .7978214 3.72912 4.018779
---------+--------------------------------------------------------------------
combined | 173 4.017341 .0626916 .8245787 3.893597 4.141085
---------+--------------------------------------------------------------------
diff | .4593838 .1310646 .2006709 .7180966
------------------------------------------------------------------------------
diff = mean(1) - mean(3) t = 3.5050
Ho: diff = 0 degrees of freedom = 171
Ha: diff < 0 Ha: diff != 0 Ha: diff > 0
Pr(T < t) = 0.9997 Pr(|T| > |t|) = 0.0006 Pr(T > t) = 0.0003

202
. ttest overallsatisfaction if income==2 | income==6, by(income)
Two-sample t test with equal variances
------------------------------------------------------------------------------
Group | Obs Mean Std. Err. Std. Dev. [95% Conf. Interval]
---------+--------------------------------------------------------------------
2 | 86 4.034884 .0834412 .7738015 3.86898 4.200787
6 | 51 4.352941 .1182338 .8443584 4.115462 4.590421
---------+--------------------------------------------------------------------
combined | 137 4.153285 .0694165 .812499 4.016009 4.29056
---------+--------------------------------------------------------------------
diff | -.3180575 .1415056 -.597912 -.038203
------------------------------------------------------------------------------
diff = mean(2) - mean(6) t = -2.2477
Ho: diff = 0 degrees of freedom = 135
Ha: diff < 0 Ha: diff != 0 Ha: diff > 0
Pr(T < t) = 0.0131 Pr(|T| > |t|) = 0.0262 Pr(T > t) = 0.9869
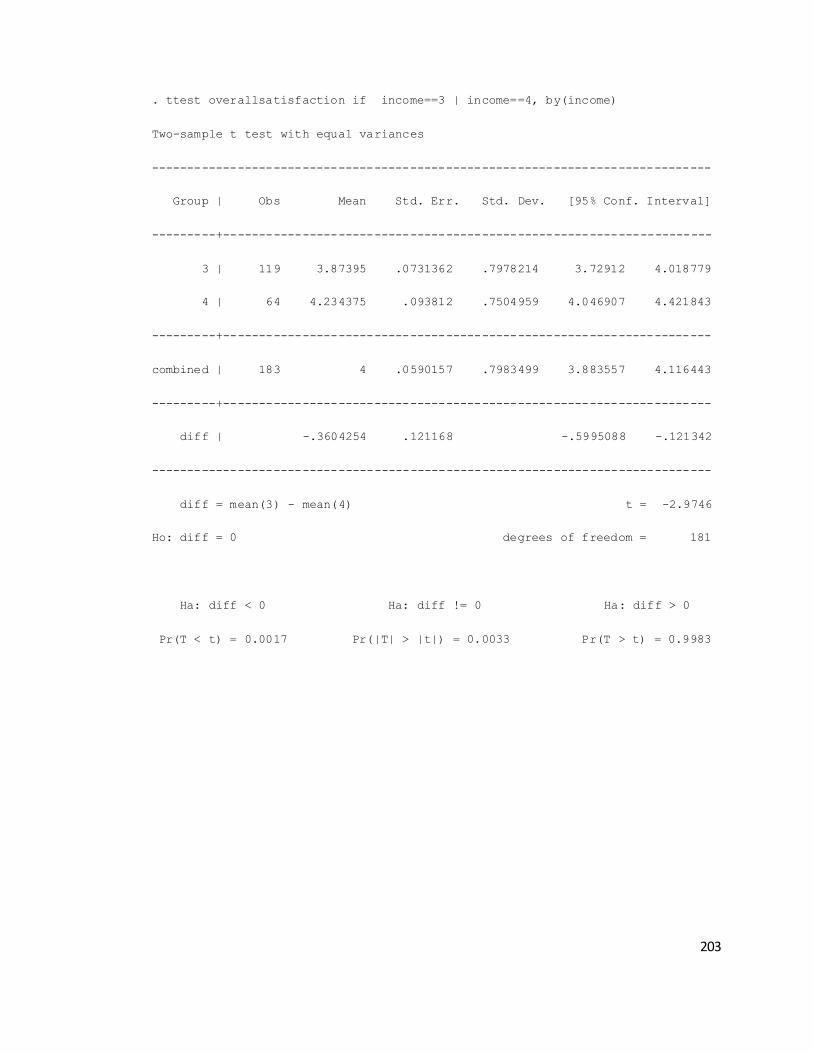
203
. ttest overallsatisfaction if income==3 | income==4, by(income)
Two-sample t test with equal variances
------------------------------------------------------------------------------
Group | Obs Mean Std. Err. Std. Dev. [95% Conf. Interval]
---------+--------------------------------------------------------------------
3 | 119 3.87395 .0731362 .7978214 3.72912 4.018779
4 | 64 4.234375 .093812 .7504959 4.046907 4.421843
---------+--------------------------------------------------------------------
combined | 183 4 .0590157 .7983499 3.883557 4.116443
---------+--------------------------------------------------------------------
diff | -.3604254 .121168 -.5995088 -.121342
------------------------------------------------------------------------------
diff = mean(3) - mean(4) t = -2.9746
Ho: diff = 0 degrees of freedom = 181
Ha: diff < 0 Ha: diff != 0 Ha: diff > 0
Pr(T < t) = 0.0017 Pr(|T| > |t|) = 0.0033 Pr(T > t) = 0.9983

204
. ttest overallsatisfaction if income==3 | income==5, by(income)
Two-sample t test with equal variances
------------------------------------------------------------------------------
Group | Obs Mean Std. Err. Std. Dev. [95% Conf. Interval]
---------+--------------------------------------------------------------------
3 | 119 3.87395 .0731362 .7978214 3.72912 4.018779
5 | 32 4.21875 .140092 .7924798 3.933031 4.504469
---------+--------------------------------------------------------------------
combined | 151 3.94702 .0656353 .8065406 3.817331 4.076709
---------+--------------------------------------------------------------------
diff | -.3448004 .1586507 -.6582962 -.0313046
------------------------------------------------------------------------------
diff = mean(3) - mean(5) t = -2.1733
Ho: diff = 0 degrees of freedom = 149
Ha: diff < 0 Ha: diff != 0 Ha: diff > 0
Pr(T < t) = 0.0157 Pr(|T| > |t|) = 0.0313 Pr(T > t) = 0.9843

205
. ttest overallsatisfaction if income==3 | income==6, by(income)
Two-sample t test with equal variances
------------------------------------------------------------------------------
Group | Obs Mean Std. Err. Std. Dev. [95% Conf. Interval]
---------+--------------------------------------------------------------------
3 | 119 3.87395 .0731362 .7978214 3.72912 4.018779
6 | 51 4.352941 .1182338 .8443584 4.115462 4.590421
---------+--------------------------------------------------------------------
combined | 170 4.017647 .0643441 .838945 3.890625 4.144669
---------+--------------------------------------------------------------------
diff | -.4789916 .1358925 -.7472685 -.2107146
------------------------------------------------------------------------------
diff = mean(3) - mean(6) t = -3.5248
Ho: diff = 0 degrees of freedom = 168
Ha: diff < 0 Ha: diff != 0 Ha: diff > 0
Pr(T < t) = 0.0003 Pr(|T| > |t|) = 0.0005 Pr(T > t) = 0.9997
Table A8.1: Times of visit of tourists and their satisfaction on guiding service
Analysis of Variance
Source SS df MS F Prob > F
-----------------------------------------------------------------------
Between groups 2.43483085 3 .811610284 1.87 0.1332
Within groups 187.960146 434 .433087895
-----------------------------------------------------------------------
Total 190.394977 437 .435686447

206
Bartlett's test for equal variances: chi2(2) = 12.7774 Prob>chi2 =
0.002
Table A8.2: Times of visit of tourists and their satisfaction on tour service
Analysis of Variance
Source SS df MS F Prob > F
-----------------------------------------------------------------------
Between groups 2.39583643 3 .798612143 1.35 0.2562
Within groups 255.279221 433 .589559401
-----------------------------------------------------------------------
Total 257.675057 436 .590997838
Bartlett's test for equal variances: chi2(2) = 6.9142 Prob>chi2 =
0.032
Table A8.3: Times of visit of tourists and their satisfaction on overall tour
experience
Analysis of Variance
Source SS df MS F Prob > F
-----------------------------------------------------------------------
Between groups 4.11904173 3 1.37301391 2.13 0.0952
Within groups 278.507961 433 .643205452
-----------------------------------------------------------------------
Total 282.627002 436 .648227069
Bartlett's test for equal variances: chi2(3) = 1.4075 Prob>chi2 =
0.704

207
Table A9.1: Purpose of tourists and their satisfaction on guiding service
Analysis of Variance
Source SS df MS F Prob > F
-----------------------------------------------------------------------
Between groups 1.65236396 5 .330472792 0.75 0.5840
Within groups 187.322232 427 .438693751
-----------------------------------------------------------------------
Total 188.974596 432 .437441194
Bartlett's test for equal variances: chi2(4) = 10.2169 Prob>chi2 =
0.037
Table A9.2: Purpose of tourists and their satisfaction on tour services
Analysis of Variance
Source SS df MS F Prob > F
-----------------------------------------------------------------------
Between groups .659486166 5 .131897233 0.22 0.9538
Within groups 255.257181 426 .599195259
-----------------------------------------------------------------------
Total 255.916667 431 .593774169
Bartlett's test for equal variances: chi2(4) = 1.0276 Prob>chi2 =
0.906

208
Table A9.3: Purpose of tourists and their satisfaction on overall tour experience
Analysis of Variance
Source SS df MS F Prob > F
-----------------------------------------------------------------------
Between groups 2.5275501 5 .50551002 0.78 0.5681
Within groups 277.859024 426 .65225123
-----------------------------------------------------------------------
Total 280.386574 431 .650548896
Bartlett's test for equal variances: chi2(5) = 2.3526 Prob>chi2 =
0.799
Table A10.1: Companion of tourists and their satisfaction on guiding service
Analysis of Variance
Source SS df MS F Prob > F
-----------------------------------------------------------------------
Between groups 4.28597273 5 .857194547 1.99 0.0794
Within groups 185.906247 431 .431337
-----------------------------------------------------------------------
Total 190.19222 436 .436220687
Bartlett's test for equal variances: chi2(5) = 3.2270 Prob>chi2 =
0.665
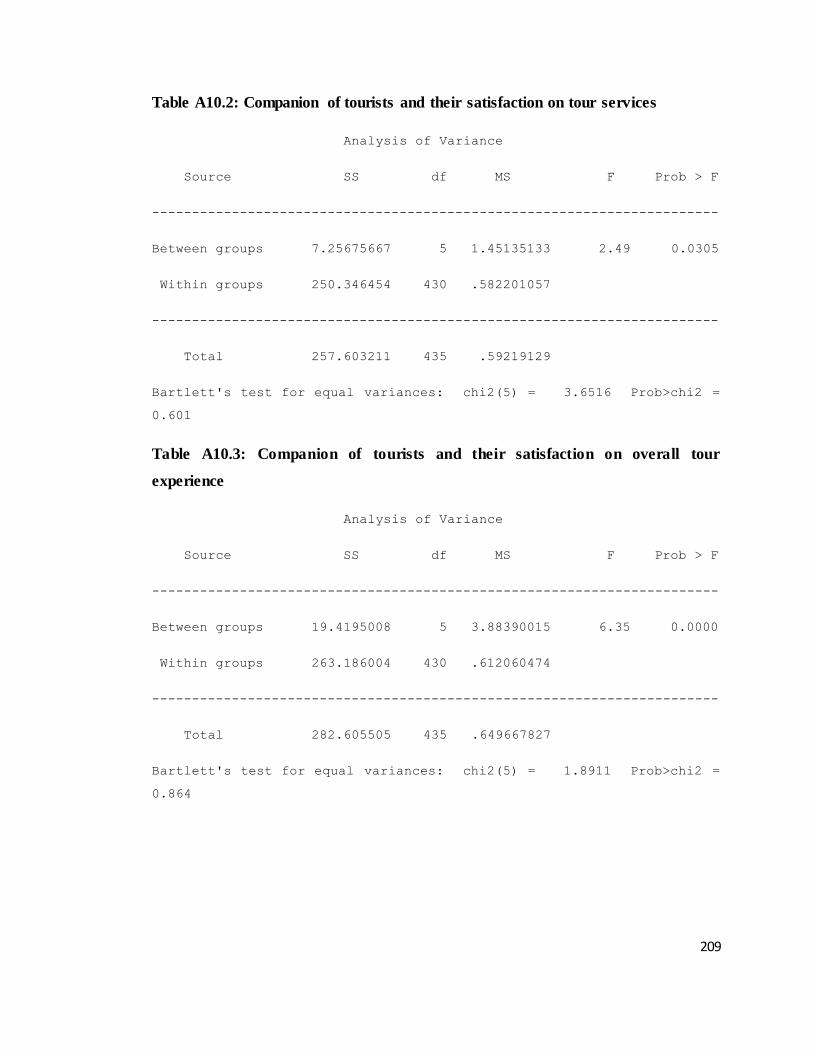
209
Table A10.2: Companion of tourists and their satisfaction on tour services
Analysis of Variance
Source SS df MS F Prob > F
-----------------------------------------------------------------------
Between groups 7.25675667 5 1.45135133 2.49 0.0305
Within groups 250.346454 430 .582201057
-----------------------------------------------------------------------
Total 257.603211 435 .59219129
Bartlett's test for equal variances: chi2(5) = 3.6516 Prob>chi2 =
0.601
Table A10.3: Companion of tourists and their satisfaction on overall tour
experience
Analysis of Variance
Source SS df MS F Prob > F
-----------------------------------------------------------------------
Between groups 19.4195008 5 3.88390015 6.35 0.0000
Within groups 263.186004 430 .612060474
-----------------------------------------------------------------------
Total 282.605505 435 .649667827
Bartlett's test for equal variances: chi2(5) = 1.8911 Prob>chi2 =
0.864

210
Table A10.4: t-test for companion of tourists and their satisfaction on tour service
. ttest toursatisfaction if companions==1 | companions==2, by(companions)
Two-sample t test with equal variances
------------------------------------------------------------------------------
Group | Obs Mean Std. Err. Std. Dev. [95% Conf. Interval]
---------+--------------------------------------------------------------------
1 | 79 4.075949 .080109 .7120241 3.916465 4.235434
2 | 124 4.370968 .0710232 .7908804 4.230382 4.511554
---------+--------------------------------------------------------------------
combined | 203 4.256158 .0542492 .7729326 4.14919 4.363125
---------+--------------------------------------------------------------------
diff | -.2950184 .1095849 -.511102 -.0789348
------------------------------------------------------------------------------
diff = mean(1) - mean(2) t = -2.6921
Ho: diff = 0 degrees of freedom = 201
Ha: diff < 0 Ha: diff != 0 Ha: diff > 0
Pr(T < t) = 0.0038 Pr(|T| > |t|) = 0.0077 Pr(T > t) = 0.9962

211
. ttest toursatisfaction if companions==1 | companions==3, by(companions)
Two-sample t test with equal variances
------------------------------------------------------------------------------
Group | Obs Mean Std. Err. Std. Dev. [95% Conf. Interval]
---------+--------------------------------------------------------------------
1 | 79 4.075949 .080109 .7120241 3.916465 4.235434
3 | 105 4.4 .0684737 .7016464 4.264214 4.535786
---------+--------------------------------------------------------------------
combined | 184 4.26087 .0532498 .7223151 4.155807 4.365932
---------+--------------------------------------------------------------------
diff | -.3240506 .1051658 -.5315517 -.1165496
------------------------------------------------------------------------------
diff = mean(1) - mean(3) t = -3.0813
Ho: diff = 0 degrees of freedom = 182
Ha: diff < 0 Ha: diff != 0 Ha: diff > 0
Pr(T < t) = 0.0012 Pr(|T| > |t|) = 0.0024 Pr(T > t) = 0.9988

212
. ttest toursatisfaction if companions==3 | companions==4, by(companions)
Two-sample t test with equal variances
------------------------------------------------------------------------------
Group | Obs Mean Std. Err. Std. Dev. [95% Conf. Interval]
---------+--------------------------------------------------------------------
3 | 105 4.4 .0684737 .7016464 4.264214 4.535786
4 | 121 4.181818 .074227 .8164966 4.034854 4.328782
---------+--------------------------------------------------------------------
combined | 226 4.283186 .0513105 .7713656 4.182075 4.384296
---------+--------------------------------------------------------------------
diff | .2181818 .1020727 .0170361 .4193275
------------------------------------------------------------------------------
diff = mean(3) - mean(4) t = 2.1375
Ho: diff = 0 degrees of freedom = 224
Ha: diff < 0 Ha: diff != 0 Ha: diff > 0
Pr(T < t) = 0.9832 Pr(|T| > |t|) = 0.0336 Pr(T > t) = 0.0168

213
Table A10.5: t-test for companion of tourists and their satisfaction on overall tour
experience
. ttest overallsatisfaction if companions==1 | companions==2, by(companions)
Two-sample t test with equal variances
------------------------------------------------------------------------------
Group | Obs Mean Std. Err. Std. Dev. [95% Conf. Interval]
---------+--------------------------------------------------------------------
1 | 78 3.794872 .0843359 .7448346 3.626938 3.962806
2 | 125 4.256 .0735321 .8221137 4.110459 4.401541
---------+--------------------------------------------------------------------
combined | 203 4.078818 .0577461 .8227547 3.964955 4.19268
---------+--------------------------------------------------------------------
diff | -.4611282 .1144821 -.6868681 -.2353883
------------------------------------------------------------------------------
diff = mean(1) - mean(2) t = -4.0280
Ho: diff = 0 degrees of freedom = 201
Ha: diff < 0 Ha: diff != 0 Ha: diff > 0
Pr(T < t) = 0.0000 Pr(|T| > |t|) = 0.0001 Pr(T > t) = 1.0000

214
. ttest overallsatisfaction if companions==1 | companions==3, by(companions)
Two-sample t test with equal variances
------------------------------------------------------------------------------
Group | Obs Mean Std. Err. Std. Dev. [95% Conf. Interval]
---------+--------------------------------------------------------------------
1 | 78 3.794872 .0843359 .7448346 3.626938 3.962806
3 | 105 4.4 .0723747 .7416198 4.256478 4.543522
---------+--------------------------------------------------------------------
combined | 183 4.142077 .0590935 .7994023 4.02548 4.258673
---------+--------------------------------------------------------------------
diff | -.6051282 .1110621 -.8242713 -.3859851
------------------------------------------------------------------------------
diff = mean(1) - mean(3) t = -5.4486
Ho: diff = 0 degrees of freedom = 181
Ha: diff < 0 Ha: diff != 0 Ha: diff > 0
Pr(T < t) = 0.0000 Pr(|T| > |t|) = 0.0000 Pr(T > t) = 1.0000

215
. ttest overallsatisfaction if companions==1 | companions==4, by(companions)
Two-sample t test with equal variances
------------------------------------------------------------------------------
Group | Obs Mean Std. Err. Std. Dev. [95% Conf. Interval]
---------+--------------------------------------------------------------------
1 | 78 3.794872 .0843359 .7448346 3.626938 3.962806
4 | 121 4.041322 .0727241 .7999656 3.897334 4.185311
---------+--------------------------------------------------------------------
combined | 199 3.944724 .0557336 .7862196 3.834816 4.054631
---------+--------------------------------------------------------------------
diff | -.2464505 .1130988 -.4694903 -.0234107
------------------------------------------------------------------------------
diff = mean(1) - mean(4) t = -2.1791
Ho: diff = 0 degrees of freedom = 197
Ha: diff < 0 Ha: diff != 0 Ha: diff > 0
Pr(T < t) = 0.0153 Pr(|T| > |t|) = 0.0305 Pr(T > t) = 0.9847

216
. ttest overallsatisfaction if companions==2 | companions==4, by(companions)
Two-sample t test with equal variances
------------------------------------------------------------------------------
Group | Obs Mean Std. Err. Std. Dev. [95% Conf. Interval]
---------+--------------------------------------------------------------------
2 | 125 4.256 .0735321 .8221137 4.110459 4.401541
4 | 121 4.041322 .0727241 .7999656 3.897334 4.185311
---------+--------------------------------------------------------------------
combined | 246 4.150407 .0520741 .8167506 4.047836 4.252977
---------+--------------------------------------------------------------------
diff | .2146777 .1034665 .0108763 .4184791
------------------------------------------------------------------------------
diff = mean(2) - mean(4) t = 2.0749
Ho: diff = 0 degrees of freedom = 244
Ha: diff < 0 Ha: diff != 0 Ha: diff > 0
Pr(T < t) = 0.9805 Pr(|T| > |t|) = 0.0390 Pr(T > t) = 0.0195

217
. ttest overallsatisfaction if companions==3 | companions==4, by(companions)
Two-sample t test with equal variances
------------------------------------------------------------------------------
Group | Obs Mean Std. Err. Std. Dev. [95% Conf. Interval]
---------+--------------------------------------------------------------------
3 | 105 4.4 .0723747 .7416198 4.256478 4.543522
4 | 121 4.041322 .0727241 .7999656 3.897334 4.185311
---------+--------------------------------------------------------------------
combined | 226 4.207965 .0527001 .792256 4.104116 4.311813
---------+--------------------------------------------------------------------
diff | .3586777 .1031536 .155402 .5619534
------------------------------------------------------------------------------
diff = mean(3) - mean(4) t = 3.4771
Ho: diff = 0 degrees of freedom = 224
Ha: diff < 0 Ha: diff != 0 Ha: diff > 0
Pr(T < t) = 0.9997 Pr(|T| > |t|) = 0.0006 Pr(T > t) = 0.0003
Table A11.1: Intention to stay of tourists and their satisfaction on guiding service
Analysis of Variance
Source SS df MS F Prob > F
-----------------------------------------------------------------------
Between groups 1.9830958 4 .495773949 1.14 0.3388
Within groups 187.603111 430 .436286305
-----------------------------------------------------------------------
Total 189.586207 434 .436834578

218
Bartlett's test for equal variances: chi2(4) = 10.7511 Prob>chi2 =
0.030
Table A11.2: Intention to stay of tourists and their satisfaction on tour services
Analysis of Variance
Source SS df MS F Prob > F
-----------------------------------------------------------------------
Between groups 2.84124757 4 .710311893 1.20 0.3096
Within groups 253.686402 429 .591343595
-----------------------------------------------------------------------
Total 256.52765 433 .592442609
Bartlett's test for equal variances: chi2(4) = 6.2156 Prob>chi2 =
0.184
Table A11.3: Intention to stay of tourists and their satisfaction on overall tour
experience
Analysis of Variance
Source SS df MS F Prob > F
-----------------------------------------------------------------------
Between groups 11.7356159 4 2.93390398 4.67 0.0011
Within groups 269.407241 429 .627988907
-----------------------------------------------------------------------
Total 281.142857 433 .649290663
Bartlett's test for equal variances: chi2(4) = 3.1851 Prob>chi2 =
0.527

219
Table A11.4: t-test for intention to stay of tourists and their satisfaction on overall
tour experience
. ttest overallsatisfaction if stay==2 | stay==4, by(stay)
Two-sample t test with equal variances
------------------------------------------------------------------------------
Group | Obs Mean Std. Err. Std. Dev. [95% Conf. Interval]
---------+--------------------------------------------------------------------
2 | 135 3.977778 .0701153 .8146666 3.839102 4.116454
4 | 81 4.358025 .0791713 .712542 4.200469 4.515581
---------+--------------------------------------------------------------------
combined | 216 4.12037 .0542886 .7978762 4.013364 4.227376
---------+--------------------------------------------------------------------
diff | -.3802469 .1093529 -.5957937 -.1647002
------------------------------------------------------------------------------
diff = mean(2) - mean(4) t = -3.4772
Ho: diff = 0 degrees of freedom = 214
Ha: diff < 0 Ha: diff != 0 Ha: diff > 0
Pr(T < t) = 0.0003 Pr(|T| > |t|) = 0.0006 Pr(T > t) = 0.9997

220
. ttest overallsatisfaction if stay==2 | stay==5, by(stay)
Two-sample t test with equal variances
------------------------------------------------------------------------------
Group | Obs Mean Std. Err. Std. Dev. [95% Conf. Interval]
---------+--------------------------------------------------------------------
2 | 135 3.977778 .0701153 .8146666 3.839102 4.116454
5 | 72 4.361111 .0891306 .7562985 4.18339 4.538833
---------+--------------------------------------------------------------------
combined | 207 4.111111 .0565665 .8138499 3.999588 4.222635
---------+--------------------------------------------------------------------
diff | -.3833333 .1160071 -.6120533 -.1546134
------------------------------------------------------------------------------
diff = mean(2) - mean(5) t = -3.3044
Ho: diff = 0 degrees of freedom = 205
Ha: diff < 0 Ha: diff != 0 Ha: diff > 0
Pr(T < t) = 0.0006 Pr(|T| > |t|) = 0.0011 Pr(T > t) = 0.9994

221
. ttest overallsatisfaction if stay==3 | stay==4, by(stay)
Two-sample t test with equal variances
------------------------------------------------------------------------------
Group | Obs Mean Std. Err. Std. Dev. [95% Conf. Interval]
---------+--------------------------------------------------------------------
3 | 120 4.058333 .0769661 .8431218 3.905933 4.210734
4 | 81 4.358025 .0791713 .712542 4.200469 4.515581
---------+--------------------------------------------------------------------
combined | 201 4.179104 .0567688 .8048361 4.067162 4.291047
---------+--------------------------------------------------------------------
diff | -.2996914 .114066 -.5246245 -.0747582
------------------------------------------------------------------------------
diff = mean(3) - mean(4) t = -2.6274
Ho: diff = 0 degrees of freedom = 199
Ha: diff < 0 Ha: diff != 0 Ha: diff > 0
Pr(T < t) = 0.0046 Pr(|T| > |t|) = 0.0093 Pr(T > t) = 0.9954

222
. ttest overallsatisfaction if stay==3 | stay==5, by(stay)
Two-sample t test with equal variances
------------------------------------------------------------------------------
Group | Obs Mean Std. Err. Std. Dev. [95% Conf. Interval]
---------+--------------------------------------------------------------------
3 | 120 4.058333 .0769661 .8431218 3.905933 4.210734
5 | 72 4.361111 .0891306 .7562985 4.18339 4.538833
---------+--------------------------------------------------------------------
combined | 192 4.171875 .0593853 .8228673 4.05474 4.28901
---------+--------------------------------------------------------------------
diff | -.3027778 .1210107 -.5414749 -.0640807
------------------------------------------------------------------------------
diff = mean(3) - mean(5) t = -2.5021
Ho: diff = 0 degrees of freedom = 190
Ha: diff < 0 Ha: diff != 0 Ha: diff > 0
Pr(T < t) = 0.0066 Pr(|T| > |t|) = 0.0132 Pr(T > t) = 0.9934
Table A12.1: Exploratory factor analysis for ‘tourist satisfaction’ definition
KMO and Bartlett's Test
Kaiser-Meyer-Olkin Measure of Sampling Adequacy. .681
Bartlett's Test of Sphericity
Approx. Chi-Square 917.886
df 3
Sig. .000

223
Total Variance Explained
Component Initial Eigenvalues Extraction Sums of Squared Loadings
Total % of Variance Cumulative % Total % of Variance Cumulative %
1 2.487 82.885 82.885 2.487 82.885 82.885
2 .375 12.506 95.392
3 .138 4.608 100.000
Extraction Method: Principal Component Analysis.
Component Matrixa
Component
1
v3.2 .952
v3.3 .906
v3.1 .870
Extraction Method:
Principal Component
Analysis.
a. 1 components
extracted.
Table A12.2: Cronbach’s Alpha analysis for tourist satisfaction
Cronbach's
Alpha
N of Items
.895 3
Item-Total Statistics
Scale Mean if
Item Deleted
Scale Variance
if Item Deleted
Corrected Item-
Total
Correlation
Cronbach's
Alpha if Item
Deleted
v3.1 8.3659 2.348 .724 .910
v3.2 8.5455 1.844 .884 .768
v3.3 8.6630 1.899 .791 .857

224
Table A13.1: Exploratory factor analysis for ‘destination loyalty’ definition
KMO and Bartlett's Test
Kaiser-Meyer-Olkin Measure of Sampling Adequacy. .685
Bartlett's Test of Sphericity
Approx. Chi-Square 285.632
df 3
Sig. .000
Communalities
Initial Extraction
v4.1 1.000 .675
v4.2 1.000 .643
v4.3 1.000 .643
Extraction Method: Principal
Component Analysis.
Total Variance Explained
Component Initial Eigenvalues Extraction Sums of Squared Loadings
Total % of Variance Cumulative % Total % of Variance Cumulative %
1 1.960 65.342 65.342 1.960 65.342 65.342
2 .544 18.118 83.460
3 .496 16.540 100.000
Extraction Method: Principal Component Analysis.
Table A13.2: Cronbach’s Alpha analysis for destination loyalty
Reliability Statistics
Cronbach's
Alpha
N of Items
.723 3

225
Item-Total Statistics
Scale Mean if
Item Deleted
Scale Variance
if Item Deleted
Corrected Item-
Total
Correlation
Cronbach's
Alpha if Item
Deleted
v4.1 8.5322 1.858 .574 .607
v4.2 9.0510 1.409 .549 .659
v4.3 8.5366 1.960 .545 .643
Table A14.1: Exploratory factor analysis for “intrapersonal servability” factor
KMO and Bartlett's Test
Kaiser-Meyer-Olkin Measure of Sampling Adequacy. .802
Bartlett's Test of Sphericity
Approx. Chi-Square 1788.850
df 45
Sig. .000
Total Variance Explained
Factor Initial Eigenvalues Extraction Sums of Squared Loadings Rotation Sums
of Squared
Loadingsa
Total % of Variance Cumulative % Total % of Variance Cumulative % Total
1 4.172 41.722 41.722 3.739 37.387 37.387 3.390
2 1.408 14.078 55.800 1.110 11.098 48.485 2.243
3 1.105 11.047 66.848 .615 6.149 54.634 2.318
4 .843 8.430 75.277
5 .658 6.584 81.861
6 .502 5.016 86.877
7 .429 4.291 91.167
8 .394 3.939 95.106
9 .269 2.694 97.801
10 .220 2.199 100.000
Extraction Method: Principal Axis Factoring.
a. When factors are correlated, sums of squared loadings cannot be added to obtain a total variance.

226
Pattern Matrixa
Factor
1 2 3
v1.1 .830
v1.3 .778
v1.2 .724
v1.5 .660
v1.4 .632 .213
v1.7 .928
v1.8 .820
v1.10 .775
v1.9 .619
v1.6 .248 .253
Extraction Method: Principal Axis Factoring.
Rotation Method: Promax with Kaiser
Normalization.
a. Rotation converged in 5 iterations.
Table A14.2: Exploratory factor analysis for ‘intrapersonal servability’ factor after
deleted item v1.6
KMO and Bartlett's Test
Kaiser-Meyer-Olkin Measure of Sampling Adequacy. .793
Bartlett's Test of Sphericity
Approx. Chi-Square 1673.975
df 36
Sig. .000

227
Communalities
Initial Extraction
v1.1 .516 .602
v1.2 .411 .446
v1.3 .498 .596
v1.4 .543 .547
v1.5 .570 .581
v1.7 .595 .793
v1.8 .607 .737
v1.9 .278 .366
v1.10 .313 .622
Extraction Method: Principal Axis
Factoring.
Total Variance Explained
Factor Initial Eigenvalues Extraction Sums of Squared Loadings Rotation Sums
of Squared
Loadingsa
Total % of Variance Cumulative % Total % of Variance Cumulative % Total
1 3.963 44.035 44.035 3.553 39.481 39.481 3.228
2 1.408 15.641 59.676 1.104 12.268 51.750 2.196
3 1.083 12.038 71.714 .634 7.043 58.792 2.066
4 .690 7.670 79.384
5 .507 5.629 85.013
6 .446 4.954 89.967
7 .402 4.467 94.434
8 .278 3.094 97.528
9 .222 2.472 100.000
Extraction Method: Principal Axis Factoring.
a. When factors are correlated, sums of squared loadings cannot be added to obtain a total variance.

228
Pattern Matrixa
Factor
1 2 3
v1.1 .825
v1.3 .778
v1.2 .718
v1.5 .665
v1.4 .642
v1.7 .914
v1.8 .838
v1.10 .820
v1.9 .580
Extraction Method: Principal Axis Factoring.
Rotation Method: Promax with Kaiser
Normalization.
a. Rotation converged in 5 iterations.
Table A14.3: Cronbach’s Alpha analyses for intrapersonal servability
Item-Total Statistics
Scale Mean if
Item Deleted
Scale Variance
if Item Deleted
Corrected Item-
Total
Correlation
Cronbach's
Alpha if Item
Deleted
v1.1 18.3814 4.205 .688 .817
v1.2 18.4568 4.213 .589 .841
v1.3 18.4390 4.096 .693 .815
v1.4 18.6297 3.905 .671 .820
v1.5 18.6164 3.810 .690 .815
Item-Total Statistics
Scale Mean if
Item Deleted
Scale Variance
if Item Deleted
Corrected Item-
Total
Correlation
Cronbach's
Alpha if Item
Deleted
v1.7 4.2860 .760 .761 .
v1.8 4.2661 .751 .761 .
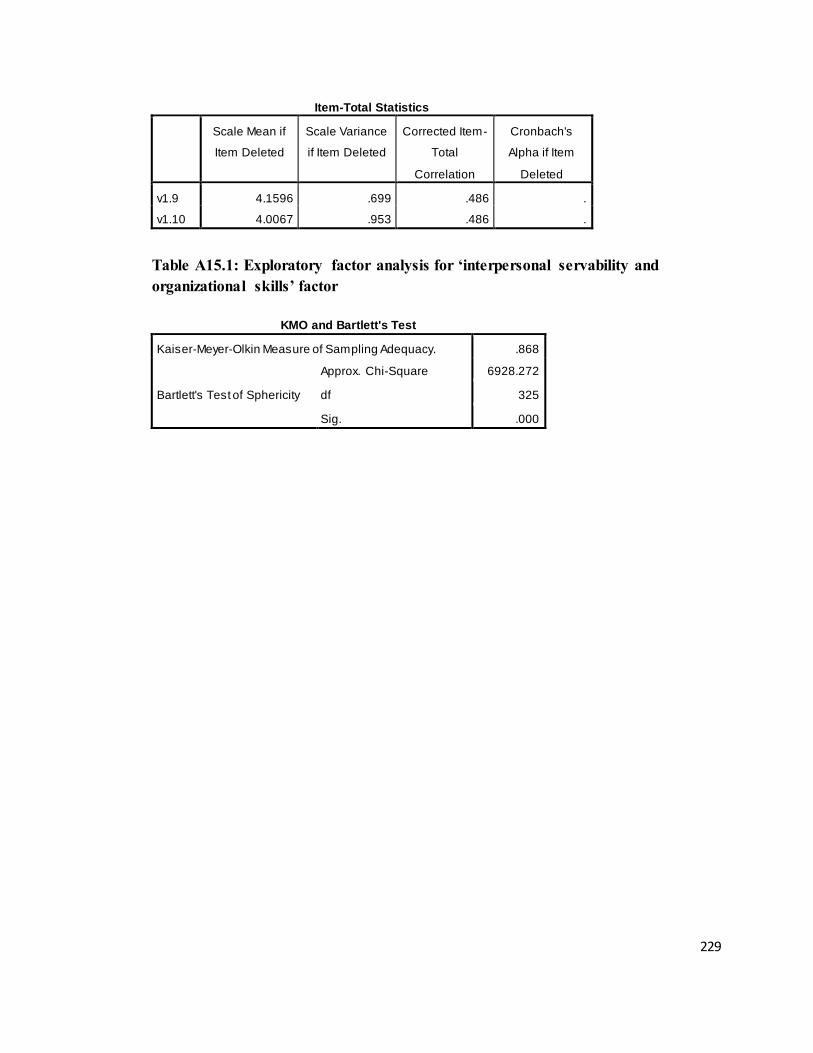
229
Item-Total Statistics
Scale Mean if
Item Deleted
Scale Variance
if Item Deleted
Corrected Item-
Total
Correlation
Cronbach's
Alpha if Item
Deleted
v1.9 4.1596 .699 .486 .
v1.10 4.0067 .953 .486 .
Table A15.1: Exploratory factor analysis for ‘interpersonal servability and
organizational skills’ factor
KMO and Bartlett's Test
Kaiser-Meyer-Olkin Measure of Sampling Adequacy. .868
Bartlett's Test of Sphericity
Approx. Chi-Square 6928.272
df 325
Sig. .000

230
Total Variance Explained
Factor Initial Eigenvalues Extraction Sums of Squared Loadings Rotation Sums
of Squared
Loadingsa
Total % of Variance Cumulative % Total % of Variance Cumulative % Total
1 7.965 30.634 30.634 7.587 29.182 29.182 5.561
2 3.382 13.009 43.643 3.009 11.574 40.756 3.695
3 1.992 7.663 51.306 1.649 6.341 47.097 4.327
4 1.669 6.418 57.724 1.329 5.111 52.207 4.768
5 1.402 5.392 63.116 1.090 4.194 56.401 3.646
6 1.190 4.576 67.692 .786 3.024 59.426 4.962
7 .962 3.699 71.391
8 .871 3.350 74.741
9 .736 2.831 77.572
10 .702 2.700 80.273
11 .613 2.357 82.629
12 .579 2.229 84.858
13 .498 1.915 86.773
14 .425 1.634 88.407
15 .406 1.563 89.970
16 .349 1.343 91.313
17 .335 1.288 92.601
18 .289 1.112 93.713
19 .278 1.068 94.781
20 .250 .962 95.743
21 .244 .940 96.683
22 .224 .860 97.544
23 .199 .766 98.309
24 .170 .653 98.963
25 .166 .637 99.600
26 .104 .400 100.000
Extraction Method: Principal Axis Factoring.
a. When factors are correlated, sums of squared loadings cannot be added to obtain a total variance.

231
Pattern Matrixa
Factor
1 2 3 4 5 6
v2.12 .875
v2.11 .850
v2.13 .830
v2.10 .655
v2.14 .642
v2.26 .807
v2.25 .768
v2.23 .739
v2.24 .677
v2.22 .208 .644
v2.5 .983
v2.4 .953
v2.6 .274 .658
v2.3 .922
v2.2 .844
v2.1 .795
v2.20 .923
v2.21 .774
v2.19 .670 .233
v2.17 .761
v2.18 .536
v2.16 -.202 .520
v2.15 .251 .482
v2.9 .229 .411
v2.8 .204 .387
v2.7 .355
Extraction Method: Principal Axis Factoring.
Rotation Method: Promax with Kaiser Normalization.
a. Rotation converged in 6 iterations.

232
Factor Correlation Matrix
Factor 1 2 3 4 5 6
1 1.000 .193 .506 .471 .265 .463
2 .193 1.000 -.029 .127 .373 .428
3 .506 -.029 1.000 .526 .166 .322
4 .471 .127 .526 1.000 .289 .508
5 .265 .373 .166 .289 1.000 .436
6 .463 .428 .322 .508 .436 1.000
Extraction Method: Principal Axis Factoring.
Rotation Method: Promax with Kaiser Normalization.
Table A15.2: Exploratory factor analysis for ‘interpersonal servability and
organizational skills’ factor after deleted item v2.7, v2.8 and v2.9
KMO and Bartlett's Test
Kaiser-Meyer-Olkin Measure of Sampling Adequacy. .855
Bartlett's Test of Sphericity
Approx. Chi-Square 6339.895
df 253
Sig. .000

233
Total Variance Explained
Factor Initial Eigenvalues Extraction Sums of Squared Loadings Rotation Sums
of Squared
Loadingsa
Total % of Variance Cumulative % Total % of Variance Cumulative % Total
1 7.191 31.266 31.266 6.855 29.806 29.806 5.130
2 3.280 14.259 45.525 2.909 12.648 42.455 3.447
3 1.959 8.517 54.042 1.629 7.083 49.538 4.294
4 1.661 7.220 61.262 1.328 5.776 55.314 4.348
5 1.296 5.637 66.899 1.040 4.524 59.837 3.358
6 1.179 5.126 72.024 .743 3.232 63.070 3.553
7 .877 3.813 75.837
8 .717 3.117 78.954
9 .627 2.726 81.680
10 .599 2.603 84.283
11 .513 2.231 86.514
12 .412 1.790 88.304
13 .402 1.749 90.053
14 .338 1.469 91.523
15 .291 1.263 92.786
16 .283 1.231 94.017
17 .252 1.096 95.114
18 .247 1.073 96.187
19 .229 .997 97.184
20 .201 .876 98.060
21 .171 .742 98.801
22 .168 .731 99.532
23 .108 .468 100.000
Extraction Method: Principal Axis Factoring.
a. When factors are correlated, sums of squared loadings cannot be added to obtain a tota l variance.

234
Pattern Matrixa
Factor
1 2 3 4 5 6
v2.12 .879
v2.11 .856
v2.13 .819
v2.10 .665
v2.14 .638
v2.26 .799
v2.25 .757
v2.23 .747
v2.24 .674
v2.22 .655
v2.5 1.000
v2.4 .954
v2.6 .257 .680
v2.3 .899
v2.2 .853
v2.1 .812
v2.20 .921
v2.21 .771
v2.19 .679
v2.17 .758
v2.16 .237 .525
v2.18 .479
v2.15 .269 .424
Extraction Method: Principal Axis Factoring.
Rotation Method: Promax with Kaiser Normalization.
a. Rotation converged in 6 iterations.
Table A15.3: Exploratory factor analysis for ‘interpersonal servability and
organizational skills’ factor after deleted item v2.7, v2.8, v2.9 and v2.15
KMO and Bartlett's Test
Kaiser-Meyer-Olkin Measure of Sampling Adequacy. .852
Bartlett's Test of Sphericity
Approx. Chi-Square 6189.805
df 231
Sig. .000

235
Total Variance Explained
Factor Initial Eigenvalues Extraction Sums of Squared Loadings Rotation Sums
of Squared
Loadingsa
Total % of Variance Cumulative % Total % of Variance Cumulative % Total
1 7.082 32.189 32.189 6.758 30.717 30.717 5.189
2 3.191 14.503 46.692 2.824 12.838 43.554 3.345
3 1.903 8.648 55.340 1.592 7.235 50.789 4.338
4 1.653 7.512 62.852 1.334 6.064 56.853 4.358
5 1.267 5.759 68.611 1.040 4.726 61.579 3.251
6 1.100 5.001 73.612 .756 3.438 65.017 3.269
7 .856 3.889 77.501
8 .702 3.192 80.692
9 .602 2.737 83.429
10 .517 2.348 85.778
11 .412 1.872 87.649
12 .404 1.838 89.487
13 .360 1.635 91.122
14 .291 1.322 92.444
15 .283 1.287 93.731
16 .253 1.148 94.879
17 .247 1.122 96.001
18 .230 1.043 97.045
19 .201 .916 97.960
20 .171 .778 98.739
21 .170 .772 99.511
22 .108 .489 100.000
Extraction Method: Principal Axis Factoring.
a. When factors are correlated, sums of squared loadings cannot be added to obtain a total variance.
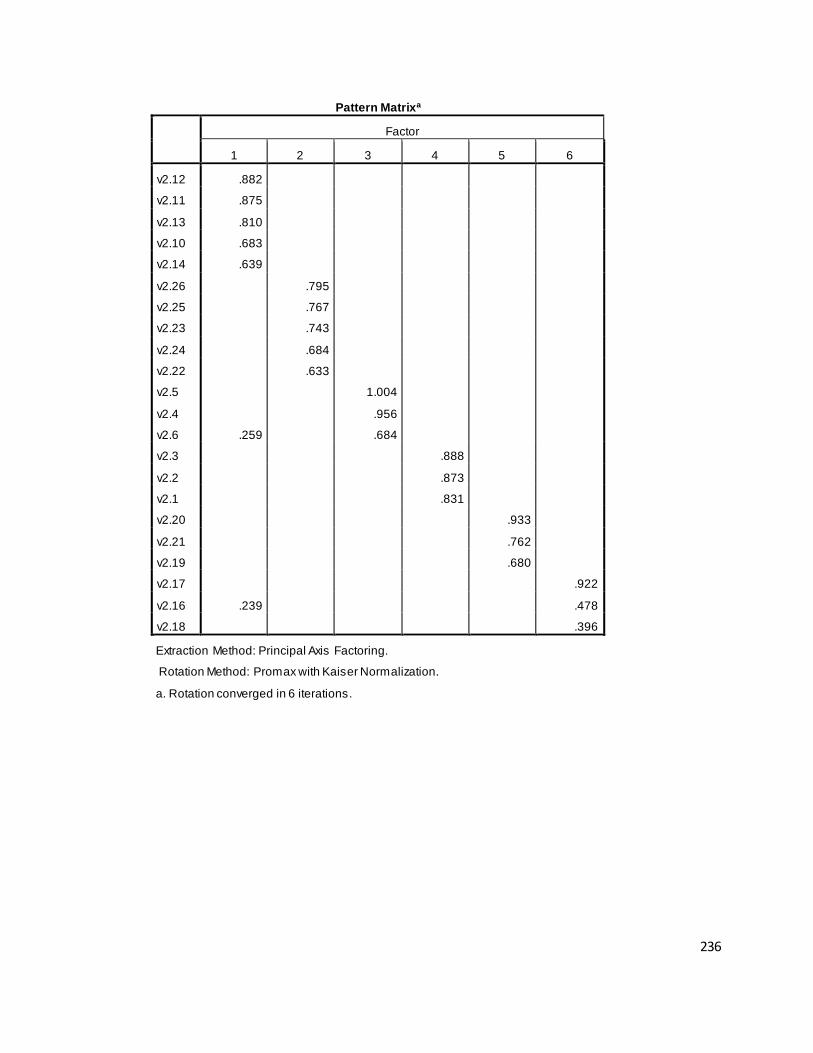
236
Pattern Matrixa
Factor
1 2 3 4 5 6
v2.12 .882
v2.11 .875
v2.13 .810
v2.10 .683
v2.14 .639
v2.26 .795
v2.25 .767
v2.23 .743
v2.24 .684
v2.22 .633
v2.5 1.004
v2.4 .956
v2.6 .259 .684
v2.3 .888
v2.2 .873
v2.1 .831
v2.20 .933
v2.21 .762
v2.19 .680
v2.17 .922
v2.16 .239 .478
v2.18 .396
Extraction Method: Principal Axis Factoring.
Rotation Method: Promax with Kaiser Normalization.
a. Rotation converged in 6 iterations.

237
Table A15.4: Cronbach’s Alpha analyses for interpersonal servability and
organizational skills
Item-Total Statistics
Scale Mean if
Item Deleted
Scale Variance
if Item Deleted
Corrected Item-
Total
Correlation
Cronbach's
Alpha if Item
Deleted
v2.1 8.0510 3.142 .775 .843
v2.2 8.3902 2.718 .794 .821
v2.3 8.2195 2.732 .769 .845
Item-Total Statistics
Scale Mean if
Item Deleted
Scale Variance
if Item Deleted
Corrected Item-
Total
Correlation
Cronbach's
Alpha if Item
Deleted
v2.4 7.7694 4.689 .865 .845
v2.5 7.8004 4.560 .863 .842
v2.6 8.2882 3.948 .770 .938
Item-Total Statistics
Scale Mean if
Item Deleted
Scale Variance
if Item Deleted
Corrected Item-
Total
Correlation
Cronbach's
Alpha if Item
Deleted
v2.10 14.5610 11.345 .609 .883
v2.11 14.7517 9.827 .764 .848
v2.12 14.8980 9.941 .797 .841
v2.13 15.0820 9.600 .765 .848
v2.14 14.9778 10.648 .673 .869

238
Item-Total Statistics
Scale Mean if
Item Deleted
Scale Variance
if Item Deleted
Corrected Item-
Total
Correlation
Cronbach's
Alpha if Item
Deleted
v2.16 8.7849 1.414 .519 .608
v2.17 8.4479 2.039 .564 .533
v2.18 8.4878 2.153 .467 .636
Item-Total Statistics
Scale Mean if
Item Deleted
Scale Variance
if Item Deleted
Corrected Item-
Total
Correlation
Cronbach's
Alpha if Item
Deleted
v2.19 7.9202 3.309 .663 .865
v2.20 8.3016 2.451 .812 .723
v2.21 8.2129 2.746 .740 .794
Item-Total Statistics
Scale Mean if
Item Deleted
Scale Variance
if Item Deleted
Corrected Item-
Total
Correlation
Cronbach's
Alpha if Item
Deleted
v2.22 16.8736 8.577 .566 .833
v2.23 16.3304 9.933 .689 .785
v2.24 16.5410 9.840 .603 .805
v2.25 16.3525 10.269 .661 .794
v2.26 16.6785 9.152 .712 .774
Table A16: Model fit indices of the model
Baseline Comparisons
Model NFI
Delta1 RFI
rho1 IFI
Delta2 TLI
rho2 CFI
Default model .860 .831 .906 .886 .905
Saturated model 1.000
1.000
1.000
Independence model .000 .000 .000 .000 .000

239
RMSEA
Model RMSEA LO 90 HI 90 PCLOSE
Default model .062 .059 .066 .000
Independence model .184 .181 .187 .000
Figure A1: Diagram of confirmatory factor analysis
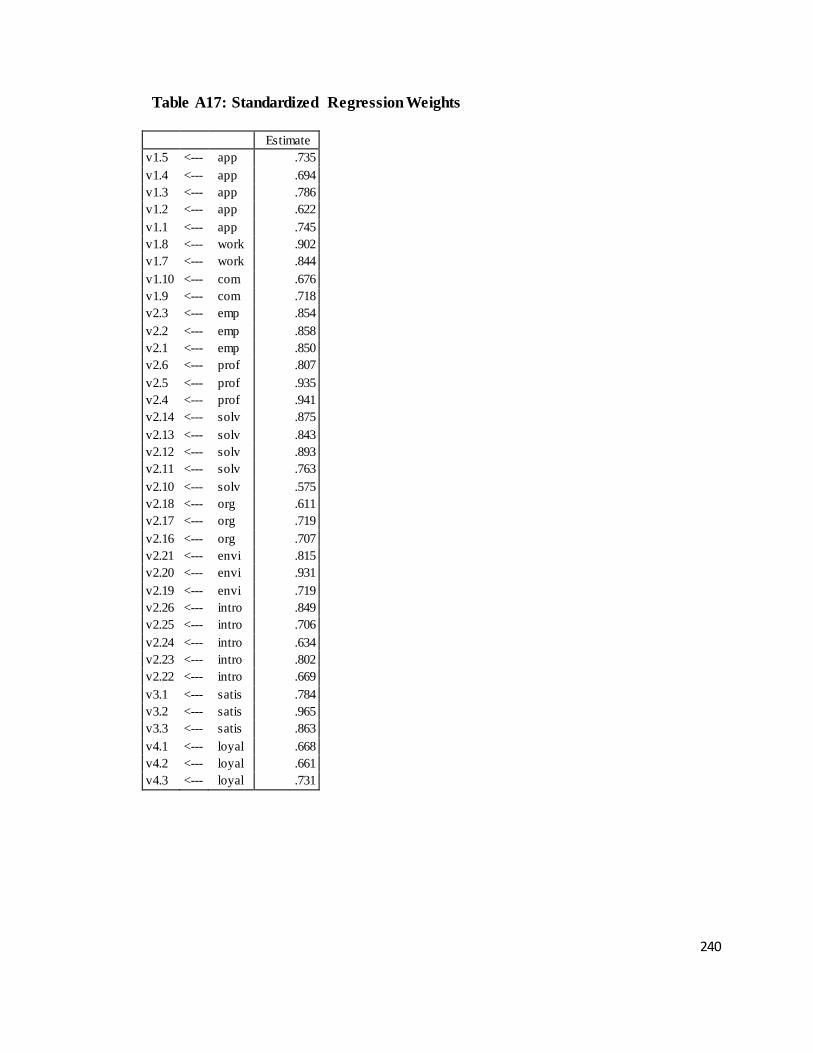
240
Table A17: Standardized Regression Weights
Estimate
v1.5 <--- app .735
v1.4 <--- app .694
v1.3 <--- app .786
v1.2 <--- app .622
v1.1 <--- app .745
v1.8 <--- work .902
v1.7 <--- work .844
v1.10 <--- com .676
v1.9 <--- com .718
v2.3 <--- emp .854
v2.2 <--- emp .858
v2.1 <--- emp .850
v2.6 <--- prof .807
v2.5 <--- prof .935
v2.4 <--- prof .941
v2.14 <--- solv .875
v2.13 <--- solv .843
v2.12 <--- solv .893
v2.11 <--- solv .763
v2.10 <--- solv .575
v2.18 <--- org .611
v2.17 <--- org .719
v2.16 <--- org .707
v2.21 <--- envi .815
v2.20 <--- envi .931
v2.19 <--- envi .719
v2.26 <--- intro .849
v2.25 <--- intro .706
v2.24 <--- intro .634
v2.23 <--- intro .802
v2.22 <--- intro .669
v3.1 <--- satis .784
v3.2 <--- satis .965
v3.3 <--- satis .863
v4.1 <--- loyal .668
v4.2 <--- loyal .661
v4.3 <--- loyal .731

241
Figure A2: Diagram of structural equation modeling

242
Figure A3: Diagram of structural equation modeling after deleting 4 factors