the impacts of exchange rate movements on prices and trade
TRANSCRIPT

The Impacts of Exchange Rate Movements on Prices and Trade across Sectors: Evidence from Ethiopian
Firms*
Andualem Telaye Mengistu†, Eduardo Montero‡, and Alexander Segura§
January 2017
Abstract
This paper presents original evidence on the impacts of exchange rate movements on prices and trade in a low-income country setting. Using a novel decomposition and detailed customs data for the universe of Ethiopian firms, we document two main findings. First, movements of the Ethiopian Birr against the major currency of invoicing, in this case the USD, matter more for price and quantity impacts than do movements of the Ethiopian Birr against trading partners’ currencies. Second, rates of exchange rate-pass through, and subsequent trade volume impacts, vary considerably across sectors. This variation across sectors occurs in ways that are plausibly consistent with different sourcing and selling strategies for manufacturing firms relative to firms in other sectors of the economy. These results suggest that, when evaluating the impacts of currency movements, focusing on only one sector may provide inaccurate estimates of overall impacts, and that, in countries like Ethiopia that conduct the majority of trade in a foreign currency, it is important to take into account movements against the major currency of invoicing as well as the currencies of trading partners.
* We thank Pol Antras, Vitaly Bord, Kirill Borusyak, Shawn Cole, Andrew Garin, Siddharth George, Gita Gopinath, Elhanan Helpman, Xavier Jaravel, Bill Kerr, Michael Kremer, George Lu, Marc Melitz, Nathan Nunn, Martin Rotemberg, Heather Sarsons, Nihar Shah, Graham Simpson, Peter Tu, Carl Veller, Chenzi Xu, and Lisa Xu for useful remarks and discussions. We acknowledge the financial support of the Center for Economic Policy Research under PEDL grant XXXXX. We thanks the Ethiopian Development Research Institute (EDRI) for hosting us, and the Ethiopian Revenue and Customs Authority (ERCA) for confidential data access. † Ethiopian Development Research Institute, XXXXX. Email: XXXX. ‡ Department of Economics, Harvard University, XXXXX, Cambridge, MA, USA. Email: [email protected]. § Department of Economics, Harvard University and Harvard Business School, XXXX, Cambridge, MA, USA. Email: [email protected].

1. Introduction
Firms often face unexpected movements of their own or their trading partners’ currencies. In many developing countries, due to credit constraints and a lack of hedging opportunities, companies have limited ability to handle the price changes that stem from these currency movements. Given the large fluctuations many emerging market currencies have faced in recent decades, understanding how exchange rate movements impact firms in these countries is of vital importance.
Existing studies have generated a wide array of estimates of exchange rate pass-through (henceforth ERPT) into import and export prices, and the subsequent impacts of this ERPT on firm behavior. Very few of these studies use microdata. Even fewer examine impacts in developing countries, and of those that do, the focus is on large emerging markets such as China or Brazil. To the best of our knowledge, no studies have examined impacts in African countries, where reliance on imported inputs tends to be higher than in larger emerging markets, few firms import directly, transactions mainly occur in foreign currencies, and credit and other constraints are extreme.
To fill this gap, in this paper we examine how exchange rate movements impact prices and firm behavior in Ethiopia. We focus on the period stemming from 2006 to 2014, and use a uniquely detailed dataset provided by the Ethiopian government that contains firm-linked tax, customs, and balance sheet information for the universe of registered firms in Ethiopia. This data allows us to document systematic differences in the impacts of exchange rate movements for manufacturing firms relative to firms in other sectors, which to the best of our knowledge has not been shown before.
First, we estimate ERPT into import and export prices by running a series of standard price pass-through regressions. For imports, we find that a 10% annual depreciation of the Ethiopian Birr relative to a supplier’s currency leads to a 7.9% annual increase in Birr prices paid for goods imported. For exports, we find that a 10% annual depreciation of the Ethiopian Birr relative to a buyer’s currency leads to a 6.2% annual increase in Birr prices received for goods exported. The bulk of the ERPT for both imports and exports occurs in the year contemporaneous to the exchange rate change.
On the import side, to the best of our knowledge, ours is the first paper to estimate ERPT
using firm-level data. Using sector level data, Gopinath et al (2012) document that ERPT into import prices in developing countries tends to be quite high after large devaluations, while Campa and Goldberg (2005) find average ERPT into local currency prices of around 60% across OECD countries. The import ERPT of .79 that we find for Ethiopian firms is higher than the ERPT that Campa and Golberg (2005) find for developed countries, and more in line with what Gopinath et al (2012) find for developing countries.
Most studies using firm-level data have focused on ERPT for exporters. Li et al. (2015) find
that Chinese exporters have significant ERPT into foreign-currency denominated prices, and Bermen et al. (2012) find similar results for French firms. These findings stand in contrast to

Cravino (2014), who finds that Chilean exporters have nearly zero ERPT into foreign-currency denominated prices. We find something in between these two extremes, as Ethiopian firms pass through roughly half of any exchange rate change to their buyers. All of these papers use data for manufacturing firms only, while we use data for all firms in the economy. As we discuss later, this matters for ERPT estimates. Our findings also stand in contrast to Gopinath (2015), who, using sector-level data from a series of developing countries in Asia and Latin America, finds that, for non-US countries, depreciations raise local currency mark-ups without affecting the USD prices charged by exporters.
A big difference in our setting, relative to OECD countries or large emerging markets, is that Ethiopian firms trade in a currency that is not their own, mostly the USD. The standard ERPT specification works if we believe that prices are likely to change when a trading partner’s currency moves relative to the Ethiopian Birr. In reality, most foreign and Ethiopian firms are likely to adjust prices when their currency moves against a major currency of invoicing, like the USD.
With this in mind, we develop a new technique that decomposes ERPT into its two
components: (i) ERPT that stems from movement of the local currency (Ethiopian Birr) against the major currency of invoicing (USD), and (ii) ERPT that stems from movement of the major currency of invoicing (USD) against a trading partner’s currency (e.g. Yuan). The first term captures the more “mechanical” aspect of ERPT, which we call the Birr/USD ERPT. The second term captures the producer price change component of ERPT, which we call the USD/Partner ERPT. On the import side, the USD/Partner term captures how much foreign suppliers change their USD prices when their currency moves against the USD. On the export side, the USD/Partner term captures how much Ethiopian exporters change their USD prices when their foreign buyer’s purchasing power changes.
For imports, we find that a 10% annual depreciation of the Ethiopian Birr relative to the
USD leads to a 10% annual increase in Birr prices paid, and a 10% annual depreciation of the USD relative to a supplier’s currency leads to a 4% annual increase in Birr prices. For exports, we find that a 10% annual depreciation of the Ethiopian Birr relative to the USD leads to a 6.1% annual increase in Birr prices received, and a 10% annual depreciation of the USD relative to a buyer’s currency leads to a 6% annual increase in Birr prices received. The coefficient of 1 on the Birr/USD import term implies complete pass-through into Birr import prices when the Birr moves against the USD, and suggests Birr/USD movements cause prices to move much more on the import side than USD/Partner movements. On the export side, however, both types of movements affect prices by roughly the same magnitude. The significant coefficients on the USD/Partner terms indicate that both Ethiopian and foreign firms do actually change their USD prices in the near-term as a result of changes in their trading partners’ purchasing power due to currency movements.
A unique feature of our data is that it allows us to test for differences in ERPT across major
sectors of the Ethiopian economy, which to the best of our knowledge we are the first to do. This comparison is important, as exchange rate policy is often used in developing countries as a tool to promote structural transformation by shifting economic activity across sectors. Whether these shifts occur depends largely on whether relative prices change across sectors, and relative price changes in

the wake of currency movements depend on the rate of ERPT. Furthermore, since many Ethiopian firms do not import directly and instead purchase imports through wholesalers, any differential ERPT for wholesalers relative to firms in other sectors of the economy matters.
We find that ERPT into Birr prices on both the import and export side is much lower for
manufacturing firms than for wholesale and other firms. For imports, manufacturers have relatively high USD/Partner ERPT, suggesting that they purchase more differentiated goods than firms in other sectors. Manufacturing firms have zero ERPT into Birr prices for Birr/USD movements, implying full ERPT into USD prices in the near term for manufacturing imports. This means that the trading partners of manufacturing firms are aware of Birr/USD movements and adjust their USD prices accordingly. Wholesale firms, on the other hand, have full Birr/USD ERPT into Birr prices, which implies that the USD prices they pay remain fixed regardless of Birr/USD movements. For exports, manufacturing firms also have zero Birr/USD ERPT into Birr prices, which implies that they are able to fully adjust the USD prices that they charge buyers in the near term when the Birr/USD rate changes. On the other hand, wholesale firms hardly adjust the USD prices they charge in response to Birr/USD movements.
Focusing on the two largest sectors, manufacturing and wholesale, we test whether these
ERPT differences are due to differences in the composition of trading partners or products traded, or whether, even within a given product-country pair, the difference in ERPT persists. We do this by running our core ERPT regressions on a restricted sample that only contains product-country pairs that are traded by both manufacturers and wholesalers. For imports, the difference in ERPT holds, which suggests that there is something fundamentally different about the purchasing process of firms in each sector, which we speculate has to do with the more customized relationships that manufacturing firms have with their suppliers of inputs than wholesalers do. For exports, however, the difference in ERPT goes away in the restricted sample, which we speculate is down to greater similarity in the selling relationships of manufacturing and wholesale firms, given that firms in both sectors export mainly low value-added final goods.
Next, we examine the impacts of currency movements on trade volume and value at the firm-level by running our core ERPT regressions, but with the outcome variable as trade volume/value rather than price. We find that firms do change the amount they import and export in response to the price changes that stem from exchange rate movements. Import volumes fall by roughly 20% of the size of Birr/USD and USD/Partner depreciations. All of the impact on USD expenditures stems from Birr/USD movements – a 10% Birr/USD depreciation leads to a 3.2% decrease in USD import expenditures, while there is no USD/Partner impact. Across sectors, volume impacts on the import side are not very correlated with rates of ERPT, perhaps reflecting the need for firms in certain sectors to keep a relatively steady supply of imported inputs due to the lack of domestic alternatives, regardless of price changes.
On the export side, volume impacts are driven entirely by responses to Birr/USD
movements. A 10% Birr/USD depreciation results in a contemporaneous increase in the volume of exports of 3.6%. For exports, the rate of ERPT into USD prices is strongly related to volume elasticity. Manufacturing firms, who have nearly full ERPT into USD prices, have a volume elasticity

of 1, which means they increase the volume they export one to one with the size of a Birr/USD depreciation. Firms in other sectors, who have low ERPT into USD prices, also have low export volume elasticity.
The relatively low volume and expenditure elasticities we document, compared to rates of
ERPT, are in line with other findings in the literature that use firm-level data. Li et al. (2015) and Bermen et al. (2012) find slightly higher volume elasticities for Chinese and French exporters, respectively. Fitzgerald and Haller (2014) find hardly any response of export revenue to exchange rate shocks. These papers only use data for manufacturing firms, and focus exclusively on export volume elasticity. As we show, there is significant heterogeneity across sectors, and at least on the export side, higher rates of ERPT may drive higher volume elasticities.
Finally, we briefly examine aggregate expenditure impacts of the two types of exchange rate
movements at the country-product, country, and product levels. On the import side, at all levels of aggregation, Birr/USD depreciations lead to relatively large decreases in import expenditure, while USD/Partner movements have little impact. Aggregate expenditure impacts on the export side are smaller and not statistically different from zero for either type of exchange rate movement.
In sum, our findings show that, moving forward, the literature should focus much more on
two factors when examining the impacts of exchange rate movements on prices and quantities traded. First, rates of ERPT can vary across sectors in ways that are plausibly consistent with different sourcing and selling strategies that firms in different sectors employ. Papers that focus on only one sector may miss the bigger picture and provide inaccurate estimates of the overall impacts of exchange rate movements. Second, for developing countries like Ethiopia that conduct trade in a currency that is not their own, it is crucial to focus on movements against the major currency of invoicing along with movements against trading partners’ currencies. As we show, in the case of Ethiopia, both at the firm and aggregative level, Birr movements against the USD are consistently more impactful than movements against trading partners’ currencies.
The remainder of the paper is structured as follows. Section 2 describes the data and provides background on the Ethiopian policy and macroeconomic setting during our sample period. Section 3 presents our ERPT estimation strategy and results. Section 4 examines the impacts of exchange rate movements on firm behavior and aggregate trade. Section 5 concludes. 2. Description of Data and Setting A. Ethiopia from 2006-2014
Ethiopia is a poor, landlocked country of roughly ninety million people located in the northeast horn of Africa. Real GDP per capita was $550 in 2014, lower than the regional average. However, real GDP growth has been high since 2006, averaging 10.5% per annum. Much of this growth was driven by high public investment in infrastructure, increased commercialization of

agriculture, and nonfarm private sector activity. Inflation was at times high, averaging 17.2% since 2006, and driven mainly by rising food prices.
Ethiopia has an extremely small and non-diversified manufacturing sector, representative of many sub-Saharan African countries. Most firms are locally owned and concentrated in a few low-skill labor-intensive sectors such as textiles, garments, leather products, basic agro-processing, and furniture making. Input industries, aside from unprocessed raw materials like cotton and timber, are mostly non-existent. Similarly, most agricultural activity is subsistence, and of the commercial agricultural activity, much of it is focused on the export of low value-added products such as cut flowers or fruits and vegetables. The majority of firms finance investment from retained earnings, with only XX% accessing a bank loan during our sample period. [PROVIDE DATA FROM BALANCE SHEETS]
The Ethiopian government pursues multiple policies to control and regulate the economy. First, the central bank maintains a fixed exchange rate that is loosely pegged to the USD. The Ethiopian Birr is allowed to depreciate against the USD at the annual estimated inflation rate of roughly 5%, with larger devaluations taking place in 2009 and 2010 to correct for macroeconomic imbalances. Second, in order to regulate domestic monetary policy, the government has strict capital controls that make foreign currency extremely difficult to acquire and store. Exporting firms are only allowed to hold on to 10% of foreign currency earnings for reinvestment, with the remaining 90% forcibly converted to local currency within 30 days of receipt if not used for productive purposes like importing new materials or paying off foreign currency loans. Finally, the government does not allow foreign financial institutions or retail establishments to operate in the country. These policies are commonly blamed for persistent foreign exchange shortages that often prevent importers from accessing the amount of USD they need to make transactions for months at a time. B. Firm level data
Our main source of data comes from the Ethiopian Revenue and Customs Authority (ERCA), who has provided us with information for every registered firm in the country. For each registered firm we annual have income statement, balance sheet, and tax payment records. The income statement data includes information on sales, the cost of goods sold, and profits. The balance sheet data includes information on fixed asset investment and loans outstanding. The tax payment data includes information on VAT paid. Unfortunately, none of this data includes information on employment or wages, nor does it include information whether firms are foreign or locally owned.
ERCA has also provided us with trade data for each registered firm. For each import and export transaction a firm makes, we have information on the country the firm traded with, the value of the transaction, the 8-digit HS code of the good traded, the weight of the good, and the currency of invoicing. C. Country level macro-data

We supplement the above data from Ethiopia with a host of macroeconomic indicators from the IMF’s International Financial Statistics (IFS). From the IFS, we obtain annual average bilateral nominal exchange rates for each of Ethiopia’s trading partners, as well as annual average producer price indices (PPI) and consumer price indices (CPI) for each of these countries. As described later, we use the exchange rate and inflation measures to calculate annual ERPT and trade cost shocks for Ethiopian firms. 3. Exchange Rate Pass-Through
Before considering the impacts of currency movements on firm behavior, we must verify that movements of the Ethiopian Birr relative to trading partners’ currencies actually do lead to changes in the prices of goods imported and exported. A. Empirical Strategy
In line with Campa and Goldberg (2005), Gopinath (2015) and Li et al. (2015), we model import pricing in the following manner:
∗ (1)
where is the import price of good p to firm i from country c in Ethiopian Fiscal Year t, is the nominal exchange rate of country c’s currency relative to the Ethiopian Birr in year t, and
is country c’s price index in year t. In words, the import price of a given good is a transformation of county c’s prices by the nominal exchange rate of that country’s currency relative to the Ethiopian Birr. We model export pricing in the same way, except that we use Ethiopia’s price index rather than country c’s.
Taking logarithms, we use the following model to estimate average ERPT into import prices in our sample:
∆ ∆ ∆ (2)
where is the import unit value of good p to firm i from country c in Ethiopian Fiscal Year t, which we calculate as the nominal Birr value of a shipment, divided by the net mass or the quantity of that shipment.1 Given that values and weights are at very disaggregated product categories (8-digit HS classification), the unit value serves as a suitable proxy for price. To capture any time-invariant
1 The customs dataset contains measures of net mass and quantity for each product shipment. We use quantity information for the roughly one third of the sample where it is available, and use net mass for the rest of the sample that does not have quantity information. Although we believe quantity to be the more accurate measure, many transactions do not include quantity information because it is difficult to define. For instance, if a firm exports coffee beans that are not packaged, it is clear how to define the weight of the shipment, but not clear how to define quantity, as customs officials would not count out the number of coffee beans in the shipment.

unobservables that are specific to firm, product, or destination we include a firm fixed effect, , a hs4-level product fixed effect, , and a trading partner fixed effect, . We control for demand changes in Ethiopia using its consumer price index, . To deal with possible non-stationarity of the data, we use first differences of log variables. On the export side, we use the same equation, but use Ethiopia’s PPI instead of the trading partner’s PPI, and use the trading partner’s CPI instead of Ethiopia’s CPI. tells us what percentage of the change in a trading partner’s currency from year t-1 to year t passes through into the import (export) prices paid (charged) by Ethiopian firms.2 This specification captures ERPT for imports if we believe that foreign firms are likely to change their prices in response to a change in the value of their currency relative to the Ethiopian Birr. However, since foreign firms most likely adjust their prices when the value of their currency changes relative to a major currency of invoicing like the USD or Euro, it is not clear that the variable of interest is the Ethiopian Birr relative to the trading partner’s currency. Since roughly 90% of Ethiopian trade is invoiced in USD, we decompose from Equation 1 into two terms:
∗ (3)
where / is the Ethiopian Birr to USD nominal exchange rate at time t, and / is the USD to country c nominal exchange rate at time t. Using the decomposition from Equation 3, and again taking logarithms, we can then estimate ERPT using the following model: ∆ ∆ ∆ ∆ (4)
where is the Ethiopian Birr to USD exchange rate at time t, and is country c’s exchange rate relative to the USD at time t.3 captures how the Birr price paid (charged) by Ethiopian firms changes when the Birr moves against the USD.4 For imports, captures how the USD price charged by foreign firms changes when their currency moves against the USD. On the export side, again, we use the same equation, but use Ethiopia’s PPI instead of the trading partner’s PPI, and use the trading partner’s CPI instead of Ethiopia’s CPI. For exports, captures how the USD price charged by Ethiopian firms changes when their buyer’s currency moves against the USD. These variables capture the two relevant components of any price pass-through that takes place, and allow us to decompose ERPT into its “mechanical” aspect and its “producer price change” aspect. B. Description of Sample
2 Although data are available at a daily frequency, we focus on annual growth because our firm-level income statement and balance sheet data is annual. Furthermore, most firms do not trade a given product-country combination in consecutive months or even quarters, so we lose many observations if we focus on higher frequency growth. 3 The correlation coefficient between ∆ and ∆ is .07 for imports and .03 for exports, which assuages any fears of multicollinearity between the two terms in the decomposition. 4 As shown in Figure 1, the Birr has consistently depreciated against the USD throughout our sample period.

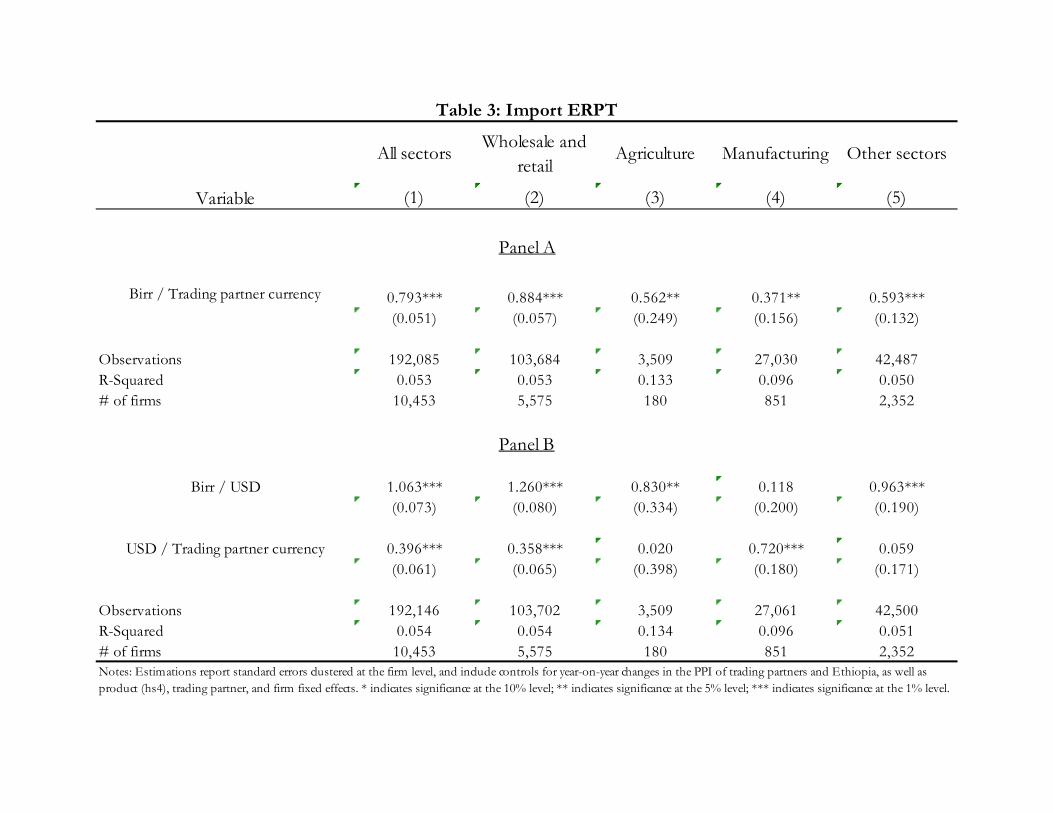
When estimating Equations 2 and 4, observations are at the firm-year-product-trading partner level, using HS-8 product codes. We make a few adjustments to the sample to correct for noise and error. One, we drop observations with missing value or weight data. Two, we drop observations with year-on-year unit value changes of more than 300% in either direction, which is standard in the literature, as such large changes most likely reflect a change in the type of good being traded rather than a change in the price of the same good from the previous period. Third, we exclude commodities traded on major international exchanges, as individual producers do not have the power to set prices for these goods.5 This leaves us with a total sample size, from 2006-2014, of 195,791 import transactions and 11,100 export transactions. The total value of these import transactions is $25.6 Billion, while the total value of the export transactions is $5.7 Billion. The total number of firms in the sample that imported over this time period is 10,471, while the total number of firms that exported is 1,174. So, while there are about twenty times more import transactions than export transactions, and about ten times the number of importers as there are exporters, the average export transaction is about four times the size of the average import transaction. Panel A of Table 1 shows the top import partners and top imported products for Ethiopian firms from 2006-2014. China plays an outsized role both in terms of volume and value. Other major import partners are Japan, Italy, India, Germany, the USA, and Turkey. There are a wide variety of imported product categories, representing both finished goods and intermediate inputs. There is a fairly large discrepancy between the goods that dominate volume, and the goods that dominate value. There is higher volume of smaller, cheaper goods, such as inputs like screws and bolts, or clothing. Value is dominated by larger items, such as telecoms infrastructure, motor vehicles, chemicals, and heavy metals. Panel B of Table 1 shows the top export partners and the top exported products. Perhaps surprisingly, the USA is dominant in terms of volume. In terms of value, again perhaps surprisingly, China is dominant. The other major export partners are Saudi Arabia, the Netherlands, Israel, and the United Arab Emirates. The products that Ethiopia exports are much less complex than the products it imports. Exports are dominated by low value-added agricultural products such as oil seeds, cut flowers, dried vegetables, spices, and fresh meat.
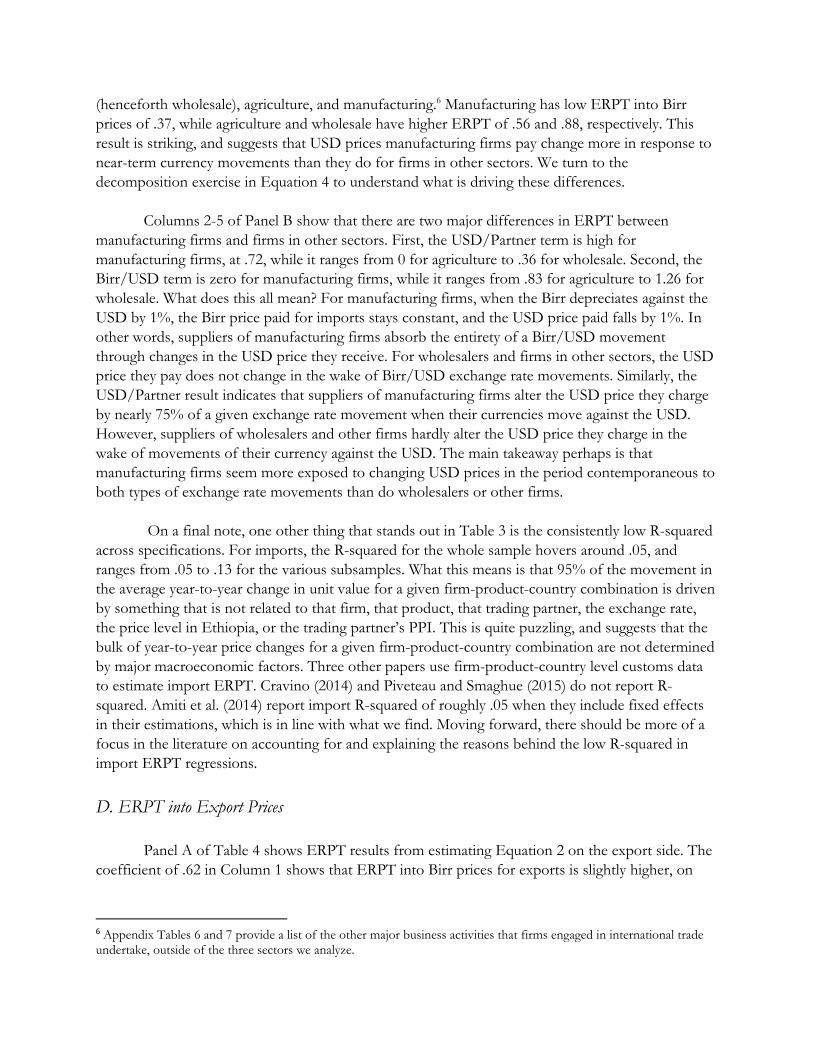
To give a sense of how the firms in our sample that participate in international trade compare to firms that do not trade directly, Table 2 presents summary statistics for three groups: firms that do not trade, importers, and exporters. The average Ethiopian firm that does not participate in trade is quite small, with annual sales of $55,335, gross profit of $14,297, and net profit of only $4,187. Annually, firms invest more in fixed assets than they spend on variable inputs, which is perhaps a reflection of an economy that is growing fast from a low base and requires high investment.
5 See a list of commodities removed from the sample in Appendix 1.

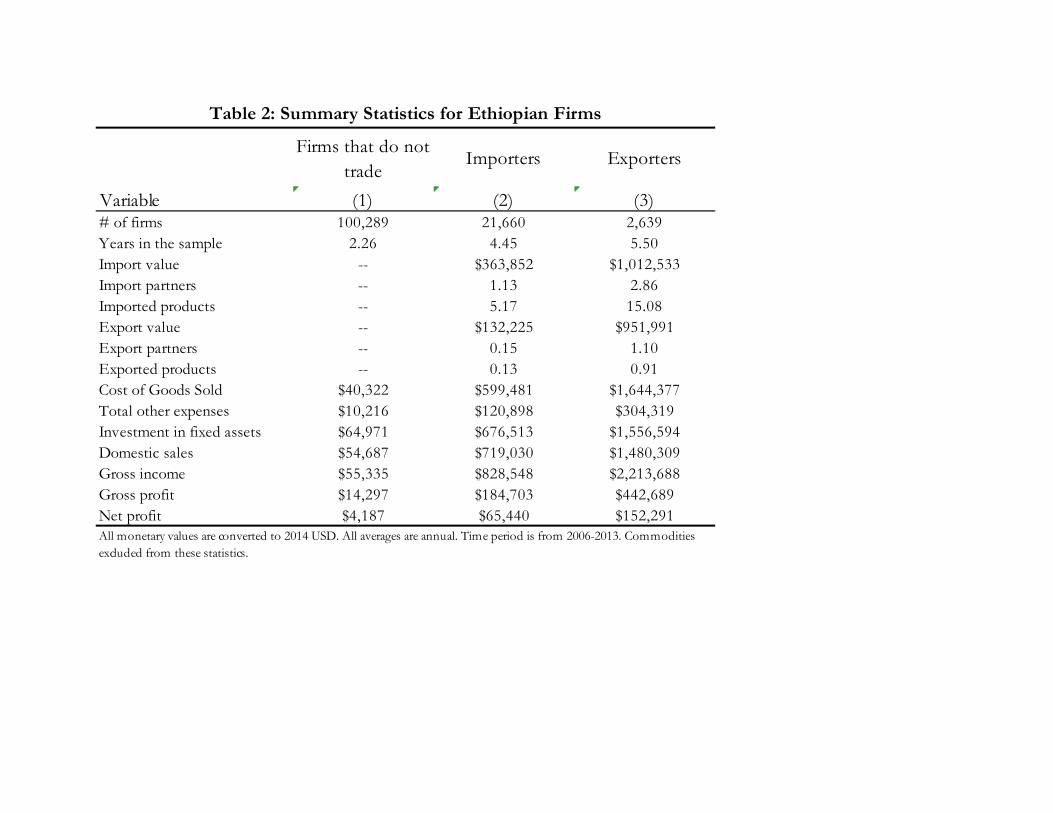
In line with findings elsewhere in the literature, across a number of core input and output metrics, firms that engage in international trade are much larger than firms that do not. Among firms that trade, exporters are much larger than importers. For core measures of economic activity such as input expenses, investment, sales, and profit, the average importer is roughly ten times larger than the average non-trading firm, and the average exporter is roughly three times larger than the average importer. The number of countries firms import to and export from is roughly equal, although firms import a lot more products than they export. The average importing firm has annual imports of $363,852, and the average exporter has imports of roughly three times that size. For exports, the average exporter has an annual value of $951,991, while importers on average export about one tenth of that amount. C. ERPT into Import Prices Panel A of Table 3 shows ERPT results from estimating Equation 2 on the import side. Column 1 shows that, on average across all firms and goods in a given 12-month time period, a 1% appreciation (depreciation) of a trading partners’ currency relative to the Ethiopian Birr leads to a .79% increase (decrease) in the Birr unit value of the good being imported. We refer to this as an ERPT of .79. Column 1 of Appendix Table 12, which displays results from estimating Equation 2 with lags, shows that the bulk of ERPT happens in the 12 months contemporaneous to the exchange rate change – there is ERPT of .2 in the year after the exchange rate change, and no further ERPT after that. To understand the mechanics at play behind the ERPT described above, it is important to know the drivers of these price shifts. Is ERPT driven by changes in the Birr price firms pay as a result of shifts in the Birr/USD rate? Or is ERPT driven by changes in the USD price that firms face, due to changes in supplier prices that result from supplier currency movements against the USD?
Panel B of Table 3 displays ERPT results from estimating Equation 2 on the import side. Column 1 shows that Birr/USD rate changes drive prices much more than USD/Partner changes do. The coefficient of 1 on the Birr/USD term indicates that, when the Birr depreciates against the USD by 1% year-on-year, the average price in Birr paid by an Ethiopian firm increases by 1%. This implies that all of a given Birr/USD movement is passed on to Ethiopian buyers in the form of Birr price changes, and that USD prices stay constant. The coefficient of .4 on the USD/Partner term indicates that, when a trading partner’s currency appreciates (depreciates) against the USD by 1%, a given firm in that country raises (lowers) the USD price of the good they are exporting by .4%. Exchange rate policy is often used in developing countries as a tool to promote structural transformation by shifting economic activity across sectors, and to a large extent what determines whether these shifts occur or not is the magnitude of changes in relative prices that result from exchange rate movements. In Columns 2-5 of Panel A, we display results from estimating Equation 2 on firms from the three largest sectors in Ethiopia in terms of import activity: wholesale/retail
(henceforth wholesale), agriculture, and manufacturing.6 Manufacturing has low ERPT into Birr prices of .37, while agriculture and wholesale have higher ERPT of .56 and .88, respectively. This result is striking, and suggests that USD prices manufacturing firms pay change more in response to near-term currency movements than they do for firms in other sectors. We turn to the decomposition exercise in Equation 4 to understand what is driving these differences. Columns 2-5 of Panel B show that there are two major differences in ERPT between manufacturing firms and firms in other sectors. First, the USD/Partner term is high for manufacturing firms, at .72, while it ranges from 0 for agriculture to .36 for wholesale. Second, the Birr/USD term is zero for manufacturing firms, while it ranges from .83 for agriculture to 1.26 for wholesale. What does this all mean? For manufacturing firms, when the Birr depreciates against the USD by 1%, the Birr price paid for imports stays constant, and the USD price paid falls by 1%. In other words, suppliers of manufacturing firms absorb the entirety of a Birr/USD movement through changes in the USD price they receive. For wholesalers and firms in other sectors, the USD price they pay does not change in the wake of Birr/USD exchange rate movements. Similarly, the USD/Partner result indicates that suppliers of manufacturing firms alter the USD price they charge by nearly 75% of a given exchange rate movement when their currencies move against the USD. However, suppliers of wholesalers and other firms hardly alter the USD price they charge in the wake of movements of their currency against the USD. The main takeaway perhaps is that manufacturing firms seem more exposed to changing USD prices in the period contemporaneous to both types of exchange rate movements than do wholesalers or other firms.
On a final note, one other thing that stands out in Table 3 is the consistently low R-squared across specifications. For imports, the R-squared for the whole sample hovers around .05, and ranges from .05 to .13 for the various subsamples. What this means is that 95% of the movement in the average year-to-year change in unit value for a given firm-product-country combination is driven by something that is not related to that firm, that product, that trading partner, the exchange rate, the price level in Ethiopia, or the trading partner’s PPI. This is quite puzzling, and suggests that the bulk of year-to-year price changes for a given firm-product-country combination are not determined by major macroeconomic factors. Three other papers use firm-product-country level customs data to estimate import ERPT. Cravino (2014) and Piveteau and Smaghue (2015) do not report R-squared. Amiti et al. (2014) report import R-squared of roughly .05 when they include fixed effects in their estimations, which is in line with what we find. Moving forward, there should be more of a focus in the literature on accounting for and explaining the reasons behind the low R-squared in import ERPT regressions. D. ERPT into Export Prices Panel A of Table 4 shows ERPT results from estimating Equation 2 on the export side. The coefficient of .62 in Column 1 shows that ERPT into Birr prices for exports is slightly higher, on
6 Appendix Tables 6 and 7 provide a list of the other major business activities that firms engaged in international trade undertake, outside of the three sectors we analyze.

average, than for imports. As with imports, Column 1 of Appendix Table 13 shows that the majority of export ERPT happens in the year contemporaneous to the exchange rate change. We break down the drivers of export ERPT in the same fashion that we do for imports. The Birr/USD term captures the more “mechanical” aspect of ERPT – do firms let the Birr price they receive move fully with a Birr/USD rate change, or do they keep the Birr price fixed and alter their posted USD price as a result of a Birr/USD movement? The USD/Partner term measures whether Ethiopian firms change their Birr (and USD) prices in response to movements of their trading partners’ currencies against the USD.
Column 1 of Panel B of Table 4 displays results of estimating Equation 4 on exports for all firms. The coefficient of .62 on the Birr/USD term indicates that, when the Birr depreciates against the USD by 1%, the average price in Birr received by Ethiopian exporters increases by .62%. In other words, the USD price charged by Ethiopian exporters falls by about one-third of a Birr/USD movement. The coefficient of .6 on the USD/Partner term indicates that, on average, when a trading partner’s currency appreciates (depreciates) against the USD by 1%, Ethiopian exporters raise (lower) the USD price they charge by .6%. This is about 50% higher than the equivalent ERPT on the import side, and indicates that Ethiopian exporters are able to react fairly quickly and effectively to changes in the purchasing power of their buyers. We now examine export ERPT across sectors in the same fashion that we do for imports. Columns 2-5 of Panel A show that ERPT into Birr prices for wholesale firms is quite high, at .76, while ERPT for agriculture firms is slightly lower at .67, and ERPT for manufacturing firms is a meager .27, and not statistically different from zero. Once again, manufacturing firms seem quite insulated from near-term exchange rate movements in terms of changes in the amount of Birr they receive for exporting.
Columns 2-5 of Panel B examine the drivers of these differences. Firms from all sector have non-zero USD/Partner ERPT – ranging from a lower .41 for manufacturing, to a higher .65 for agriculture, and a high of .81 for wholesale. This indicates that firms across sectors alter their prices in response to changes in the purchasing power of their buyers, although agriculture and wholesale firms have much greater ability to respond than do manufacturing firms. Similar to imports, manufacturing firms have zero Birr/USD ERPT. This means that Ethiopian manufacturers pass on all of a Birr/USD depreciation to their buyers in terms of lower USD prices. Agriculture firms have Birr/USD ERPT of .65, which means they pass on about one third of a Birr/USD movement to their buyers. Wholesale firms have Birr/USD ERPT of .72, which means they also pass on roughly one quarter of a Birr/USD movement to their buyers in terms of changed USD prices. E. Explaining Inter-sectoral Differences in ERPT
What could explain the sharply different coefficients on both the USD/Partner and Birr/USD terms for manufacturing firms relative to other sectors? We focus on the comparison between manufacturers and wholesalers, as these are the two most prominent sectors in international trade. One hypothesis is that manufacturing firms trade different products, trade with

different countries, or trade with different product-country pairs than do wholesalers. Another hypothesis is that, even within product country-pairs, there is something different about the purchasing or selling process for manufacturing firms than for wholesalers.
Appendix Table 8 shows that the composition of major import partners across sectors is
broadly the same – China, India, Italy, and Germany are major players for both manufacturers and wholesalers. Appendix Table 9 shows that the composition of major HS4-level imported products is broadly similar across sectors too – electrical apparatus, production inputs, and motor vehicle parts feature heavily for both. This suggests that, for imports, the difference in ERPT may be driven by inherent differences in the purchasing process of manufacturing firms relative to wholesalers, rather than broad differences in the types of goods firms in each sector purchase or the countries they import from.
Appendix Table 10 shows that there are larger differences in the composition of export
partners across sectors. While the USA is the number one export partner for both manufacturers and wholesalers and China is also a major partner, manufacturers export a lot to Italy, Germany, Hong Kong, India, and Turkey, while wholesalers export a lot to Israel, Sudan, Saudi Arabia, Yemen, and the United Arab Emirates. Furthermore, Appendix Table 11 shows there are differences in the major products exported across sectors too. Wholesalers predominantly export agricultural products, such as oil seeds, dried vegetables, and fresh fruits and vegetables, while manufacturing firms predominantly export processed leather, footwear, beer, and basic apparel.
In order to test whether different product-countries or different trading processes are
driving ERPT differences across sectors, we restrict our sample to only include product-country pairs that both manufacturers and wholesalers trade, and estimate Equations 2 and 4 on this restricted sample for both groups. Results are displayed in Table 5.
Columns 1 and 2 show that, even within the same product-country pairs, differences in
ERPT between manufacturers and wholesalers hold. This is in line with the similarities we observed in Appendix Tables 8 and 9 in terms of import partners and products imported. This result suggests that there is something fundamentally different about the purchasing processes of firms in each sector. The story we find most plausible, based on conversations with firms across sectors in Ethiopia, goes as follows.
Manufacturing firms purchase inputs that are more tailored to their production process. By
their nature, these inputs are more differentiated than goods that firms in other sectors purchase. Wholesale firms, for instance, must purchase goods that are attractive to a broad array of customers, while agricultural firms purchase inputs that are largely standardized within the sector (i.e. fertilizer or seeds). Since the types of goods that manufacturing firms source are highly differentiated, foreign producers of these goods have more leeway to change the USD price they charge, relative to producers of more standardized goods, which is reflected in the high coefficient on the USD/Partner term for the manufacturing sector relative to others.

Since manufacturing firms purchase inputs that are custom to their production process, they develop long-term relationships with suppliers, who they source from repeatedly. These relationships allow Ethiopian manufacturers to set contracts (implicitly or explicitly) that fix the prices they pay for inputs in Birr, at least in the near term, and pay lower USD prices when the Birr depreciates against the USD. This means that Birr prices do not change when the Birr/USD rate moves, and explains the zero coefficient on the Birr/USD term for manufacturing firms. On the other hand, firms in other sectors do not engage in such long-term customized relationships with suppliers, and therefore do not have the ability (or desire) to fix purchasing contracts in Birr, which results in high Birr/USD ERPT.
Columns 3 and 4 show that, for exports, the story is different. Once we restrict our sample
to the same product-country pairs, the difference in ERPT between manufacturers and wholesalers goes away. This is in line with the differences we observed in Appendix Tables 10 and 11 in terms of export partners and products exported. For the restricted sample, firms in both sectors have full ERPT into USD prices for Birr/USD movements, as well as full ERPT into USD prices for USD/Partner movements. The story we find most plausible to explain the similarity for export ERPT, in contrast to the import ERPT results, goes as follows.
While Ethiopian manufacturers import intermediate inputs, they export either agricultural
products, final goods, or inputs that are not differentiated, such as lightly processed leather. Therefore, the long-term, specialized relationships that we believe manufacturers engage in on the import side are not present on the export side, as manufacturing firms are not producing inputs that are specific to the production processes of their customers. Hence, once we restrict the sample to the same product-country pairs, ERPT across sectors is the same. This of course begs the question of what it is about this restricted sample that results in markedly different Birr/USD ERPT for wholesalers, and markedly different USD/Partner ERPT for manufacturing firms.
Appendix Table 14 shows the major export product-country pairs for the restricted sample.
The most exported products consist of agricultural products and tanned or crusted hides. Over 20% of exports are sesamum seeds to China and Israel. While exports are sent to countries across the income distribution, the binding feature of the major product-country pairs in the restricted sample is that all the products are very homogenous with low value-added. We can only speculate that the lack of differentiation means that exporters of these products do not have the power to markup in Birr, which would explain the zero coefficients on the Birr/USD terms. It could also means that buyers, who have bargaining power due to the homogeneity of the goods, are able to fix prices in their local currency, which would explain the coefficients of 1 on the USD/Partner terms. 4. Impacts of Exchange Rate Movements on the Value of Trade We have documented extensive price changes in the wake of exchange rate movements. Now we examine whether these price changes are associated with changes in the total value of trade at the firm level and in the aggregate. These results must be treated with caution, as firms can endogenously adjust the volume of goods they import or export much more easily than they can adjust the prices of those goods. It is therefore feasible that firms adjust their purchases in

anticipation of exchange rate movements, especially with respect to the Birr/USD rate. It is also feasible that the Birr/USD rate itself can change as a result of changes in the value of goods imported or exported. With these caveats in mind, we can at least examine correlations between exchange rate movements and trade behavior.
One major advantage of our setting is that, due to the structure of bank financing and capital controls in Ethiopia, very few firms or banks have foreign-denominated loans. Theoretically, exchange rate movements could directly impact trade volume through two main channels: price changes of imports and exports, and changes in the value of foreign-denominated debt. However, since the vast majority of firms in Ethiopia do not have foreign-denominated debt, we are able to more cleanly estimate how changes in import and export prices directly affect trade volumes. Most prior studies that have estimated trade responses to exchange rate movements have faced difficulties cleanly controlling for the foreign-currency debt level of firms. A. Firm-level Impacts To examine firm-level responses to exchange rate movements, we estimate Equations 2 and 4 with either the total volume or the total USD value of each shipment replacing unit value on the left hand side. We show both USD value and volume results for completeness, but we place more stock in the USD value results as an accurate picture of the impacts of exchange rate movements. This is because quantities are more easily mismeasured, and quantities are also more likely to change for arbitrary reasons (i.e. consolidation of shipments leads to fewer units).
Table 6 displays results for imports. Imports do fall (rise) when the Birr weakens (strengthens) relative to the USD and trading partners’ currencies. However, volume and expenditure responses to exchange rate movements are weaker than price responses, which accords with findings elsewhere in the literature. Column 1 of Panel B shows that, for all firms in the economy, for a given product-country combination, import volume is affected roughly equally by Birr/USD and USD/Partner movements. Column 1 of Panel A shows that, for the full sample, all of the expenditure elasticity is driven by responses to Birr/USD rate changes – there is a coefficient of -.32 on the Birr/USD term, while the USD/Partner term has a coefficient of zero. This result is striking, and suggests that import behavior is much more sensitive to Birr movements against the USD than movements against trading partners’ currencies, which accords with the higher Birr/USD ERPT we observed earlier. Appendix Tables 15 and 17 show that all behavioral responses occur in the year contemporaneous to exchange rate movements, as lagged terms are zero.
In general, firms across all sectors are more sensitive to Birr/USD depreciations in terms of
their import behavior. Panel A shows that agricultural firms drop their expenditure one to one with a Birr/USD depreciation, which means they actually decrease the volume they import significantly, as shown in Panel B, which indicates that they are perhaps able to either switch suppliers or to incorporate more local content in production following a depreciation In terms of volume, wholesalers are more sensitive to USD/Partner movements, perhaps indicating that they are more easily able to switch suppliers than firms in other sectors. Manufacturing firms have expenditure responses that are more in line with ERPT results, and that are perhaps indicative of the need to

keep their volume of imports similar from year to year in order to keep production steady. In particular, we saw that USD/Partner depreciations result in significantly higher USD prices for manufacturing firms, and we see in Panel B that manufacturing firms keep volume fixed in the face of USD/Partner movements, which results in higher USD expenditure, as evidenced by the coefficient of .52 on the USD/Partner term in Panel A.
Table 7 displays results for exports. Panel A shows that the export sales response to exchange rate movements is not statistically different from zero for the full sample. Panel B shows a Birr/USD volume elasticity of .36 for the entire sample, while the USD/Partner elasticity is not different from zero. Similar to imports, Appendix Tables 16 and 18 show that all of the export response occurs in the year contemporaneous to exchange rate movements.
Looking across sectors, Panel A shows that manufacturing firms and wholesalers have significant and large export sales elasticities, and that the entirety of this export response is driven by reactions to Birr/USD movements. For firms in both sectors, a 1% depreciation of the Birr against the USD results in a roughly .9% increase in the USD value exports. These are large impacts, and show that Birr/USD depreciations can stimulate USD earnings from exports for firms in certain sectors. Based on the ERPT results, we can speculate on the drivers of these large behavioral responses. Wholesalers do not lower USD export prices after Birr/USD depreciations, and thus capture most of the currency movement in Birr markups. Hence, they could be incentivized through a higher Birr markup to increase the volume of exports, but do not necessarily see a huge uptick in demand from buyers abroad, which is reflected in a smaller Birr/USD volume coefficient of .32 in Panel B (that is not statistically significant, most likely due to sample size). On the other hand, manufacturers lower USD export prices after a Birr/USD depreciation, and therefore likely face higher demand from buyers abroad, which is evidenced by the large Birr/USD volume coefficient of 1.18 in Panel B. B. Aggregate Impacts We have documented that firms change the value and volume of trade for given product-country combinations in the wake of exchange rate movements, and that the bulk of firm-level trade responses are driven by Birr/USD movements. We now turn to examine how these firm-level responses map out to the aggregate. When a firm experiences an adverse exchange rate shock relative to a given country, do they just trade more with a more favorable country? Or do adverse exchange rate shocks actually impact aggregate trade? To test for aggregate impacts at the country-product level first, we run the following modified version of Equation 4: ∆ ∆ ∆ ∆ (5)

where the logic of Equation 4 holds, but observations are at the country-product-year level, and standard errors are clustered at the country level. Likewise, we run the following modified version of Equation 5 to test for aggregate impacts at the country level:
∆ ∆ ∆ ∆ (6)
where observations are at the country-year level, and standard errors are again clustered at the country level. We are not able to use the USD/Partner term when testing for aggregate impacts at the product level, since observations are aggregated to the product-year level. Therefore, we construct trade-weighted product-specific exchange rate movements in the following manner on both the import and export side:
∑ ∗ ∆ ln (7)
where is the value of the imports (exports) of Product P that came from (were sent to) Country C in year t-1, and is the total value of imports (exports) of Product P in year t-1. We use weights from t-1 rather than t to try to minimize the endogeneity of the weights to contemporaneous exchange rate movements. In sum, the product cost shock for a given product p in year t is the combination of (i) the changes in the bilateral exchange rates between the Ethiopian Birr and countries that product p is imported from (exported to), and (ii) the fraction of each of those countries in the total imports (exports) of product p in year t-1. Then, to test for aggregate impacts at the product level, we run the following modified version of Equation 6:
∆ ∆ (8)
where observations are at the product-year level, standard errors are clustered at the hs4 product level, and is the annual product-specific exchange rate shock.
Table 8 shows aggregate impacts for all firms in the economy. For imports, Column 1 of Panel A confirms the firm-level findings at the aggregate country-product level – a 1% Birr/USD depreciation leads to a .59% decrease in the total value of imports for all product-country pairs, while USD/Partner movements have no impact. Column 2 of Panel A shows that the value of imports from all countries goes down by a large amount after a Birr/USD depreciation, as the Birr/USD term has a coefficient of -.92 (which is not statistically significant, likely due to small sample size). Interestingly, the total USD value of imports from a given country appears to rise in the wake of a USD depreciation relative to that country’s currency, which perhaps indicates that the total volume of imports stays the same while the USD amount paid for these imports goes up. This is roughly in line with the firm-level volume and value results for the full sample. Perhaps most importantly, Column 3 of Panel A shows that the import value of all products falls by .64% in the wake of a 1% Birr/USD depreciation. The coefficient on the weighted USD/Partner term is slightly positive, which perhaps indicates that firms are able to alter their sourcing to take advantage of favorable USD/Partner exchange rates.

Panel B displays results for exports. For all three levels of aggregation, none of the coefficients are statistically different from zero, although the sample sizes are quite small for the aggregate country and product results in Columns 2 and 3. The coefficient of 1 on the USD/Partner term in Column 2 indicates that the total value of exports to a given country is influenced by that country’s exchange rate relative to the USD. As shown in Column 3, there is not strong evidence that the overall value of exports for a given product goes up in the wake of either type of exchange rate depreciation, which is perhaps indicates that it is more difficult to drastically alter the value of total exports for a given firm than it is to alter the value of total imports. 5. Conclusion In this paper we present original evidence on the impacts of exchange rate movements on prices and behavior for Ethiopian firms. Using a uniquely detailed firm-level trade dataset for an African country, we contribute to the literature on both exchange rate pass-through and the volume/expenditure elasticity of exchange rate movements. We show that, for Ethiopian firms, movements of the Birr against the USD, which most trade is invoiced in, matter more in terms of ERPT and behavioral responses than do movements of the Birr against trading partners’ currencies. Furthermore, we show that ERPT and volume/expenditure elasticities vary significantly across sectors in ways that are consistent with different sourcing and selling strategies that firms in different sectors employ. These finding have major implications for how we should think about the relative importance of different types of exchange rate movements in developing countries that use a currency that is not their own to conduct trade. Our findings point to a number of important directions for future work. First, in developing countries the majority of firms do not directly participate in international trade. Industrialization is at the top of the policy agenda across Africa, and many countries, like Ethiopia, have in recent years enacted exchange rate policy with the explicit goal of improving the competitiveness and performance of manufacturing firms. Given the differences in ERPT we document between wholesalers and manufacturers, it is not clear that exchange rate movements will have the intended impact on manufacturing growth, as the bulk of manufacturing firms purchase imported inputs from wholesalers. Hence, it is vital to understand how wholesalers in developing countries pass prices on to the firms that source from them and sell to them. Likewise, in order to estimate the true impacts of exchange rate movements on key firm outcomes like sales and profits, more information is needed on the full range of inputs that firms employ, and on what portion of these are imported directly, imported indirectly by wholesalers, or sourced domestically. Second, and on the same topic, it is important to explore in much greater detail the different patterns we document for wholesalers and manufacturers. In particular, future research should focus on pinning down exactly how the different importing patterns of firms in different sectors affect ERPT. Likewise, future research should focus on pinning down why certain types of products or trading partners are associated with different rates of ERPT, as we find for exports. The effectiveness of exchange rate policy in stimulating changes in trading patterns likely hinges on the

major types of products being traded, or the types of firms that participate in trade, and thus a more complete understanding of the drivers of ERPT differences across sectors and products is vital. Third, our data does not allow us to differentiate between locally owned firms and multinational firms. Since multinationals often source from or sell to their own subsidiaries, ERPT and volume estimates for this subset of firms is muddled by transfer-pricing issues. Studying differences in ERPT and volume elasticities between multinationals and locally owned firms would be an important next step in understanding which types of firms are actually able to take advantage of exchange rate movements. Ultimately, our work only scratches the surface of what is hopefully the early stages of a more nuanced research agenda that focuses on the heterogeneous impacts of exchange rate movements, which should be possible given the increased availability of detailed firm data for both developed and developing countries. What we do is document for the first time that, due to the nature of trade in a country like Ethiopia, there are important differences in impacts depending on the type of exchange rate movements examined or the types of sectors taken into consideration. A more thorough understanding of where, when, and why these differences manifest themselves is crucial for estimating the effectiveness of exchange rate policy in developing countries in the years to come.

References Amiti, Mary, Itskhoki, Oleg, Konings, Jozef, 2014. “Importers, exporters, and exchange rate disconnect.” American Economic Review 104 (7), 1942-1978. Atkeson, A., Burstein, A., 2008. “Pricing-to-market, trade costs, and international relative prices.” American Economic Review 98 (5), 1998-2031. Berman, N., Martin, P., Mayer, T., 2012. “How do different exporters react to exchange rate changes?” Quarterly Journal of Economics 127, 437-492. Burstein, A., Gopinath, G., 2014. “International prices and exchange rates.” Handbook of International Economics, Volume 4, 391-451. Bussiere, M., Peltonen, T., 2008. “Exchange rate pass-through in the global economy – the role of emerging market economies.” European Central Bank Working Paper Series, No. 951. Campa, J., Goldberg, L., 2005. “Exchange rate pass through into import prices.” Review of Economics and Statistics, 87 (4), 679-690. Cravino, J., 2014. “Exchange rates, aggregate productivity and the currency of invoicing of international trade.” University of Michigan Working Paper. Fitzgerald, D., Haller, S., 2014. “Exporters and shocks: dissecting the international elasticity puzzle.” NBER Working Paper No. 19968. Gopinath, G., 2015. “The international price system.” NBER Working Paper No. 21646. Gopinath, G., Rigobon, R., 2008. “Sticky borders.” Quarterly Journal of Economics, May 2008, 531-575. The International Monetary Fund, 2014. “The Federal Democratic Republic of Ethiopia.” IMF Country Report No. 14/303. Li, H., Ma, H., Xu, Y., 2015. “How do exchange rate movements affect Chinese exports? – A firm-level investigation.” Journal of International Economics, 97, 148-161.

Country % of total HS4 Product % of total
China 43.41% Parts & access for motor vehicles 3.62%Japan 8.96% Electrical apparatus for switching etc 2.34%Italy 7.70% Articles nesoi of unharded vulcanized rubber 2.21%India 6.64% Screws, bolts, nuts, washers etc, iron or steel 2.11%Germany 5.06% Motor vehicles for transporting persons 2.05%USA 2.96% Transmission shafts/bearings/gears etc, parts 1.70%Turkey 2.61% Centrifuges, filter etc for liquid or gases, pts 1.59%United Kingdom 2.36% Pumps for liquids, liquid elevators, parts 1.33%Rep. of Korea 2.22% Women's/girl's suits etc, not knit 1.31%Thailand 1.92% Taps/cocks/valves etc for pipes/tanks etc 1.30%United Arab Emirates 1.76% T-shirts etc, knit or crochet 1.25%France 1.67% Insulated wire/cable etc, opt sheath fib cable 1.22%Netherlands 1.12% Articles of plastics (inc polymers & resins) 1.17%
USA 11.77% Cut flowers & buds for bouquet etc, prepared 11.79%China 5.79% Oil seeds & oleaginous fruits, broken or not 11.68%Saudi Arabia 5.65% Leguminous vegetables, dried shelled 10.63%Israel 5.55% Leather prepared after tanning/crusting 3.94%Netherlands 5.40% Ginger/saffron/tumeric/thyme etc 3.31%United Kingdom 5.32% Vegetables nesoi, fresh or chilled 2.67%United Arab Emirates 5.25% Pepper, genus piper, capsicum or pimenta 2.50%Germany 4.87% Live plants/cuttings etc., mushroom spawn 2.41%Italy 4.41% Lac/natural gums/resins/gum-resins/balsam 2.14%Sudan 4.32% Precious & semiprec stones, not strung etc 1.95%Yemen 3.44% Flour & meal of dry, legum vegs, fruit etc. 1.86%India 2.82% Sheep or lamb skin leather, no wool nesoi 1.68%Canada 2.41% Bread/pastry etc: comm wafers/empty caps 1.63%
Table 1: International Trade Patterns of Ethiopian Firms
Ranking is by # of transactions. Time period is from 2006-2013. Commodities excluded from the list of traded products.
Panel A: Imports
Panel B: Exports
Firms that do not trade
Importers Exporters
Variable (1) (2) (3)# of firms 100,289 21,660 2,639Years in the sample 2.26 4.45 5.50Import value -- $363,852 $1,012,533Import partners -- 1.13 2.86Imported products -- 5.17 15.08Export value -- $132,225 $951,991Export partners -- 0.15 1.10Exported products -- 0.13 0.91Cost of Goods Sold $40,322 $599,481 $1,644,377Total other expenses $10,216 $120,898 $304,319Investment in fixed assets $64,971 $676,513 $1,556,594Domestic sales $54,687 $719,030 $1,480,309Gross income $55,335 $828,548 $2,213,688Gross profit $14,297 $184,703 $442,689Net profit $4,187 $65,440 $152,291
Table 2: Summary Statistics for Ethiopian Firms
All monetary values are converted to 2014 USD. All averages are annual. Time period is from 2006-2013. Commodities excluded from these statistics.
All sectorsWholesale and
retailAgriculture Manufacturing Other sectors
Variable (1) (2) (3) (4) (5)
0.793*** 0.884*** 0.562** 0.371** 0.593***(0.051) (0.057) (0.249) (0.156) (0.132)
Observations 192,085 103,684 3,509 27,030 42,487R-Squared 0.053 0.053 0.133 0.096 0.050# of firms 10,453 5,575 180 851 2,352
Birr / USD 1.063*** 1.260*** 0.830** 0.118 0.963***(0.073) (0.080) (0.334) (0.200) (0.190)
USD / Trading partner currency 0.396*** 0.358*** 0.020 0.720*** 0.059(0.061) (0.065) (0.398) (0.180) (0.171)
Observations 192,146 103,702 3,509 27,061 42,500R-Squared 0.054 0.054 0.134 0.096 0.051# of firms 10,453 5,575 180 851 2,352
Table 3: Import ERPT
Birr / Trading partner currency
Notes: Estimations report standard errors clustered at the firm level, and include controls for year-on-year changes in the PPI of trading partners and Ethiopia, as well as product (hs4), trading partner, and firm fixed effects. * indicates significance at the 10% level; ** indicates significance at the 5% level; *** indicates significance at the 1% level.
Panel A
Panel B

All sectorsWholesale and
retailAgriculture Manufacturing Other sectors
Variable (1) (2) (3) (4) (5)
0.615*** 0.761*** 0.667*** 0.271 0.864**(0.078) (0.094) (0.178) (0.217) (0.340)
Observations 10,770 4,915 1,788 1,895 1,388R-Squared 0.109 0.150 0.180 0.112 0.197# of firms 1,171 584 119 115 135
Birr / USD 0.614*** 0.716*** 0.650*** 0.173 0.706**(0.106) (0.131) (0.224) (0.351) (0.331)
USD / Trading partner currency 0.595*** 0.808*** 0.646*** 0.407** 1.022**(0.090) (0.142) (0.204) (0.173) (0.411)
Observations 10,778 4,915 1,788 1,898 1,392R-Squared 0.109 0.151 0.179 0.113 0.200# of firms 1,171 584 119 115 135Notes: Estimations report standard errors clustered at the firm level, and include controls for year-on-year changes in the PPI of trading partners and Ethiopia, as well as product (hs4), trading partner, and firm fixed effects. * indicates significance at the 10% level; ** indicates significance at the 5% level; *** indicates significance at the 1% level.
Table 4: Export ERPT
Panel A
Birr / Trading partner currency
Panel B

Wholesale and retail
ManufacturingWholesale and
retailManufacturing
Variable (1) (2) (3) (4)
1.234*** 0.049 -0.004 0.577(0.089) (0.220) (0.113) (0.382)
USD / Trading partner currency 0.363*** 0.742*** 1.158*** 1.043***(0.086) (0.184) (0.189) (0.311)
Observations 62,398 18,894 1,563 684R-Squared 0.057 0.096 0.225 0.145# of firms 5,017 765 289 60
Table 5: ERPT for Wholesalers vs. Manufacturers (same product-countries)
Birr / USD
Notes: Estimations report standard errors clustered at the firm level, and include controls for year-on-year changes in the PPI of trading partners, as well as product (hs4), trading partner, and firm fixed effects. * indicates significance at the 10% level; ** indicates significance at the 5% level; *** indicates significance at the 1% level. Sample is restricted to product-country pairs that are traded by both wholesale and manufacturing firms.
Imports Exports

All sectorsWholesale and
retailAgriculture Manufacturing Other sectors
Variable (1) (2) (3) (4) (5)
Birr / USD -0.316*** -0.149** -1.008** -0.730*** -0.628**(0.085) (0.073) (0.392) (0.228) (0.277)
USD / Trading partner currency 0.025 -0.180* -0.002 0.524** -0.132(0.093) (0.105) (0.586) (0.218) (0.237)
Observations 162,528 89,186 2,926 22,605 34,468R-Squared 0.043 0.032 0.134 0.106 0.050# of firms 10222 5468 173 832 2284
Birr / USD -0.158** -0.012 -0.660* -0.389** -0.503**(0.068) (0.068) (0.339) (0.169) (0.203)
USD / Trading partner currency -0.197** -0.316*** -0.860* -0.016 -0.263(0.087) (0.101) (0.513) (0.196) (0.227)
Observations 152,075 84,607 2,640 20,813 31,320R-Squared 0.028 0.020 0.115 0.078 0.055# of firms 10,108 5,424 169 813 2,254
Table 6: Firm-level Impacts of Exchange Rate Movements on Imports
Panel A: USD Value
Panel B: Volume
Notes: Estimations report standard errors clustered at the firm level, and include controls for year-on-year changes in the PPI of trading partners and Ethiopia, as well as product (hs4), trading partner, and firm fixed effects. * indicates significance at the 10% level; ** indicates significance at the 5% level; *** indicates significance at the 1% level.


All sectorsWholesale and
retailAgriculture Manufacturing Other sectors
Variable (1) (2) (3) (4) (5)
Birr / USD 0.055 0.915*** -0.006 0.901** -0.411(0.214) (0.312) (0.766) (0.355) (0.687)
USD / Trading partner currency 0.288 0.040 -0.445 0.406 -0.157(0.187) (0.304) (0.565) (0.383) (0.604)
Observations 9,328 4,295 1,568 1,608 1,151R-Squared 0.076 0.090 0.094 0.157 0.216# of firms 1133 568 117 110 131
Birr / USD 0.356* 0.317 0.403 1.184*** 0.271(0.197) (0.280) (0.630) (0.429) (0.611)
USD / Trading partner currency -0.072 0.348 -0.840 0.382 -0.562(0.185) (0.293) (0.583) (0.419) (0.528)
Observations 9,332 4,316 1,578 1,595 1,148R-Squared 0.068 0.081 0.086 0.155 0.194# of firms 1125 565 116 109 131
Table 7: Firm-level Impacts of Exchange Rate Movements on Exports
Panel A: USD Value
Panel B: Volume
Notes: Estimations report standard errors clustered at the firm level, and include controls for year-on-year changes in the PPI of trading partners and Ethiopia, as well as product (hs4), trading partner, and firm fixed effects. * indicates significance at the 10% level; ** indicates significance at the 5% level; *** indicates significance at the 1% level.

Country-Product
Country Product
Variable (1) (2) (3)
Birr / USD -0.589** -0.915 -0.642***(0.236) (0.770) (0.198)
USD / Trading partner currency 0.061 0.756 0.032*(0.244) (0.900) (0.019)
Observations 27,046 392 9,971R-Squared 0.059 0.278 0.121
Birr / USD 0.167 0.027 0.494(0.451) (0.714) (0.735)
USD / Trading partner currency 0.598 1.018 -0.194(0.447) (0.945) (0.141)
Observations 2,273 320 776R-Squared 0.148 0.288 0.261
Table 8: Aggregate Impacts of Exchange Rate Movements on the USD Value of Trade
Panel A: Imports
Panel B: Exports
Notes: Estimations include controls for year-on-year changes in the PPI of trading partners and Ethiopia. The estimation in Column 1 includes product (hs4) and trading partner fixed effects, and reports standard errors clustered at the trading partner level. The estimation in Column 2 includes trading partner fixed effects, and reports standard errors clustered at the trading partner level. The estimation in Column 3 includes product (hs4) fixed effects, and reports standard errors clustered at the product (hs4) level. * indicates significance at the 10% level; ** indicates significance at the 5% level; *** indicates significance at the 1% level.

9.2
10.4
12.9
16.1
17.3
18.219.1
07/08 08/09 09/10 10/11 11/12 12/13 13/14
Figure 1: Birr/USD Exchange Rate

Product HS CodesCorn 1005Oats 1004Rice 1006Soybeans 1201Rapeseed 1205Soybean Meal 1507Soybean Oil 1507Wheat 1001Milk 0401, 0402Cocoa 1801, 1802Coffee 0901Cotton 5201, 5202Sugar 1701Frozen Concentrated Orange Juice 200911, 200919Lean Hogs 0102, 0103Live Cattle 0102, 0103Feeder Cattle 0102, 0103Crude Oil 2709Ethanol 2207Petroelum gases 2711, 2710Purified Terephthalic Acid 2917Copper 7401, 7402Lead 7801, 7802Zinc 7901, 7902Tin 8001, 8002Aluminium 7601, 7602Nickel 7501, 7502, 7503, 7504Cobalt 8105Molybdenum 8102Recycled Steel 7204Gold 7108Platinum 7110Silver 7106Palm Oil 1511Rubber 4001, 4002, 4003, 4004Wool 5101, 5102, 5103
Appendix 1: Commodities removed from sample
Country % of total Country % of total
China 43.41% China 35.52%Japan 8.96% India 12.42%Italy 7.70% Japan 5.97%India 6.64% Italy 4.53%Germany 5.06% Turkey 3.93%USA 2.96% USA 2.90%Turkey 2.61% Ukraine 2.45%United Kingdom 2.36% Rep. of Korea 2.21%Rep. of Korea 2.22% Germany 1.90%Thailand 1.92% Indonesia 1.89%United Arab Emirates 1.76% United Arab Emirates 1.72%France 1.67% France 1.71%Netherlands 1.12% Thailand 1.70%South Africa 0.93% Saudi Arabia 1.47%Saudi Arabia 0.92% Egypt 1.33%Indonesia 0.81% Jordan 1.20%Sweden 0.72% Belgium 1.20%Belgium 0.66% South Africa 1.12%Spain 0.64% Netherlands 1.10%Kenya 0.61% United Kingdom 1.00%Egypt 0.58% Pakistan 0.98%Malaysia 0.55% Russian Federation 0.97%Brazil 0.45% Spain 0.93%Switzerland 0.42% Brazil 0.91%Pakistan 0.40% Malaysia 0.80%Denmark 0.34% Kenya 0.64%
Total # of transactions: 195,791 Total value in 2014 USD: $25.6 B
Appendix 2: Import Partners 2006-2014
# of transactions Total value

HS4 Product % of total HS4 Product % of total
Parts & access for motor vehicles 3.62% Elec apparatus for line telephony, phone sets 6.34%Electrical apparatus for switching etc 2.34% Motor vehicles for transport of goods 4.87%Articles nesoi of unharded vulcanized rubber 2.21% Medicaments nesoi, mixed or not, in dosage 4.81%Screws, bolts, nuts, washers etc, iron or steel 2.11% M or ch fertilizer, n/un2of3el, fert nesoi 3.00%Motor vehicles for transporting persons 2.05% Structures nesoi & parts thereof, iron or steel 2.96%Transmission shafts/bearings/gears etc, parts 1.70% New pneumatic tires, of rubber 2.96%Centrifuges, filter etc for liquid or gases, pts 1.59% Bars & rods, iron & na steel nesoi, h-r etc 2.50%Pumps for liquids, liquid elevators, parts 1.33% Mineral or chemical fertilizers, nitrogenous 2.21%Women's/girl's suits etc, not knit 1.31% Self-propelled bulldozers/graders/scrapers etc 2.14%Taps/cocks/valves etc for pipes/tanks etc 1.30% Electric transform, static converters & induct 2.04%T-shirts etc, knit or crochet 1.25% Motor vehicles for transporting persons 2.00%Insulated wire/cable etc, opt sheath fib cable 1.22% Woven fab of syn fil yarn 1.83%Articles of plastics (inc polymers & resins) 1.17% Insulated wire/cable etc, opt sheath fib cable 1.71%Furniture nesoi and parts thereof 1.14% Flat-roll iron & na steel n/un600mm wd, clad 1.48%Motor vehicles for transport of goods 1.14% Human blood/animal blood/vaccines etc 1.44%Ball or roller bearings and parts 1.10% Polymers of ethylene, in primary forms 1.17%Men's/boy's suits etc, not knit 1.08% Data process machines, magn reader, etc. 1.13%Air/vacuum pumps, compr & fans 0.95% Flat-roll iron & na steel wd hot-rl, not clad 1.05%Conveyor/transmission belts of vulc. rubber 0.92% Portland cement/aluminous cement etc 1.01%Footwear, rubber or plastic nesoi 0.91% Parts & access for motor vehicles 1.00%Electric ignition etc equip, generators, parts 0.89% Parts of electric motors, generators & sets 0.95%Public-transport type passenger vehicles 0.79% Public-transport type passenger vehicles 0.94%Travel goods/handbags/wallets etc 0.79% Odoriferous mixtures, raw mat for industry 0.91%Woven fab of syn fil yarn 0.77% Flat-roll iron & na steel wd cold-rl, no clad 0.84%Parts for engines of heading 8407 or 8408 0.77% Bitumen & asphalt, natural, shale/tar sands 0.82%Padlocks/locks & keys & parts, base metal 0.75% Tractors (other than works trucks) of 8709 0.82%
Total # of transactions: 195,791 Total value in 2014 USD: $25.6 B
Appendix 3: Imported Products 2006-2014
# of transactions Total value

Country % of total Country % of total
USA 11.77% China 24.82%China 5.79% Netherlands 18.27%Saudi Arabia 5.65% United Arab Emirates 6.52%Israel 5.55% Israel 5.57%Netherlands 5.40% Saudi Arabia 4.43%United Kingdom 5.32% Italy 3.70%United Arab Emirates 5.25% Germany 3.44%Germany 4.87% USA 3.34%Italy 4.41% Turkey 3.18%Sudan 4.32% United Kingdom 3.03%Yemen 3.44% Somalia 3.03%India 2.82% Sudan 2.38%Canada 2.41% India 1.83%Djibouti 2.24% Egypt 1.82%Turkey 2.12% Yemen 1.44%South Africa 1.77% Djibouti 1.43%France 1.72% Pakistan 1.40%Australia 1.49% China, Hong Kong SAR 1.39%Pakistan 1.45% Jordan 1.36%Japan 1.42% Indonesia 0.89%China, Hong Kong SAR 1.41% Japan 0.70%Jordan 1.25% Greece 0.61%Norway 1.09% Belgium 0.54%Belgium 0.97% Thailand 0.41%Egypt 0.95% Viet Nam 0.40%Kenya 0.91% Norway 0.38%
Total # of transactions: 11,100 Total value in 2014 USD: $5.7 B
Appendix 4: Export Partners 2006-2014
# of transactions Total value

HS4 Product % of total HS4 Product % of total
Cut flowers & buds for bouquet etc, prepared 11.79% Oil seeds & oleaginous fruits, broken or not 35.17%Oil seeds & oleaginous fruits, broken or not 11.68% Cut flowers & buds for bouquet etc, prepared 17.83%Leguminous vegetables, dried shelled 10.63% Leguminous vegetables, dried shelled 8.07%Leather prepared after tanning/crusting 3.94% Meat of sheep or goats, fresh, chilled/frozen 6.32%Ginger/saffron/tumeric/thyme etc 3.31% Vegetables nesoi, fresh or chilled 4.10%Vegetables nesoi, fresh or chilled 2.67% Leather prepared after tanning/crusting 3.91%Pepper, genus piper, capsicum or pimenta 2.50% Live plants/cuttings etc., mushroom spawn 2.97%Live plants/cuttings etc., mushroom spawn 2.41% Sheep or lamb skin leather, no wool nesoi 2.66%Lac/natural gums/resins/gum-resins/balsam 2.14% Animals, live, nesoi 1.74%Precious & semiprec stones, not strung etc 1.95% Goat or kidskin leather, no hair nesoi 1.39%Flour & meal of dry, legum vegs, fruit etc. 1.86% Lac/natural gums/resins/gum-resins/balsam 1.10%Sheep or lamb skin leather, no wool nesoi 1.68% Vegetable products nesoi 0.85%Bread/pastry etc: comm wafers/empty caps 1.63% Cotton yarn (not sewing thread) no retail 0.75%Goat or kidskin leather, no hair nesoi 1.30% Niobium/tantalum/vanadium/zirconium ore 0.74%Meat of sheep or goats, fresh, chilled/frozen 1.20% Ginger/saffron/tumeric/thyme etc 0.69%Shawls, scarves, mufflers, mantillas, veils etc. 1.05% Sheep and goats, live 0.60%Footwear nesoi 1.05% Raw skins of sheep or lambs nesoi 0.60%Foods prep by swell cereal, cereal nesoi, grain 0.93% Leguminous veg, shelled or not, fr or chill 0.60%Seeds/anise/fennel/coriander/cumin etc 0.90% Parts for machinery of headings 8425 to 8430 0.49%Paintings/drawings etc by hand as art 0.90% Bread/pastry etc: comm wafers/empty caps 0.41%Beer made from malt 0.90% Precious & semiprec stones, not strung etc 0.40%Cereal flours, except of wheat or of meslin 0.86% T-shirts/singlets/tank etc, knit or crochet 0.36%Nutmeg, mace and cardamoms 0.83% Footwear, plastic or leather 0.36%Fruit nesoi, fresh 0.79% Titanium ores and concentrates 0.34%Plants etc for pharmacy/perfume/insecticide 0.78% Furnishing articles of textile materials nesoi 0.30%Veg, dried, whole, cut etc., no added prep 0.74% Preparations for use on the hair 0.29%
Total # of transactions: 11,100 Total value in 2014 USD: $5.7 B
Appendix 5: Exported Products 2006-2014
# of transactions Total value

Business Activity % of total Business Activity % of total
Building development & general contracting 25.76% Electric power generation and transmission 24.88%Construction (roads, bridges, etc.) 14.01% Broadcasting and telecommunications 22.14%Electric power generation and transmission 5.72% Building development & general contracting 10.39%Other support services 3.79% Service stations 10.09%Motor vehicle and parts dealers 2.88% Other support services 6.99%NGO 2.47% Construction (roads, bridges, etc.) 3.74%Water sewerage & other systems 2.28% Social advocatory organizations 3.19%Construction 2.08% Educational support services 1.72%Commercial & industrial machinery/equip 1.87% Air transportation 1.37%Building material & garden equipment 1.79% Electrical equipment, appliance/components 1.18%Special trade contractors (plumbing, etc.) 1.76% Special trade contractors (plumbing, etc.) 1.15%Support activities for ag and forestry 1.50% NGO 1.09%Clothing and clothing accessories stores 1.41% Water sewerage & other systems 0.85%Stationary, paper products & similar items 1.24% Construction 0.82%Printing and related support activities 1.16% Hospitals 0.61%Road transportation (taxis, buses, etc.) 1.15% Finance and insurance 0.54%Other services (except public admin) 1.15% Commercial & industrial machinery/equip 0.46%Service stations 1.13% Stationary, paper products & similar items 0.46%Hotels (except casinos and motels) 1.07% Oil and gas extraction 0.43%Broadcasting and telecommunications 1.03% Road transportation -- goods 0.40%Educational services (including government) 0.93% Transport and storage 0.38%Road transportation -- goods 0.92% Printing and related support activities 0.38%Social advocatory organizations 0.90% Motor vehicle and parts dealers 0.37%Air transportation 0.86% Clothing and clothing accessories stores 0.36%Hospitals 0.85% Grantmaking and giving services 0.34%Electrical equipment, appliance/components 0.83% Road transportation (taxis, buses, etc.) 0.33%
Total # of transactions: 43,409 Total value in 2014 USD: $8.8 B
Appendix 6: Other Importing Sectors 2006-2014
# of transactions Total value

Business Activity % of total Business Activity % of total
Construction (roads, bridges, etc.) 32.44% Food processing & distilleries 25.62%Accommodation and food services 10.84% Support activities for agriculture & forestry 22.67%Support activities for agriculture & forestry 10.43% Support activities of mining 11.83%Miscellaneous store retailers 6.22% Construction (roads, bridges, etc.) 8.59%Other support services 4.21% Road transportation -- goods 6.94%Clothing and clothing accessories stores 2.81% Oil and gas extraction 6.49%Road transportation -- goods 2.74% Other services (except public administration) 4.82%Commercial & industrial machinery/equip 2.61% Management and technical consulting 2.15%Funeral homes, cemeteries & crematoriums 2.47% Other support services 2.05%Food processing & distilleries 2.27% Textiles (spinning & weaving of cloth) 1.51%Other products 2.01% Rooming and boarding houses 1.11%Food stores 2.01% Accommodation and food services 0.87%Mining (except oil, gas, and diamonds) 1.74% Food stores 0.86%Other services (except public administration) 1.61% Other products 0.63%Road transportation (taxis, buses, etc.) 1.34% Electric power generation transmission 0.43%Service stations 1.34% Electronics and appliance stores 0.42%Grantmaking and giving services 1.00% Road transportation (taxis, buses, etc.) 0.36%Textiles (spinning & weaving of cloth) 0.87% Manufacturing of spirits, wines & others 0.36%Professional, scientific & technical services 0.80% Mining (except oil, gas, and diamonds) 0.34%Rooming and boarding houses 0.80% Hotels (except casino hotels and motels) 0.26%Support activities of mining 0.74% Commercial & industrial machinery/equip 0.26%General merchandise stores 0.67% Lessors of real estate 0.23%Embassy 0.54% Warehousing & storage facilities 0.12%Construction 0.54% Construction 0.12%Lessors of real estate 0.54% Diamond mining 0.12%Manufacturing of spirits, wines & others 0.47% General merchanise stores 0.11%
Total # of transactions: 1,495 Total value in 2014 USD: $0.4 B
Appendix 7: Other Exporting Sectors 2006-2014
# of transactions Total value

Country % of sector Country % of sector
China 47.11% China 23.25%Japan 11.13% India 15.14%India 5.96% Germany 12.19%Italy 5.43% Italy 10.54%Germany 3.58% Turkey 5.30%Thailand 2.68% United Kingdom 3.80%Turkey 2.60% France 3.30%Rep. of Korea 2.27% USA 2.90%USA 2.15% Saudi Arabia 2.11%United Kingdom 1.75% United Arab Emirates 1.92%
Total transactions in sector: 105,972 Total transactions in sector: 27,335% of all transactions in economy: 54.13% % of all transactions in economy: 13.96%
Netherlands 24.47% China 40.66%Germany 11.38% Italy 13.69%China 10.99% Japan 8.84%Israel 8.83% USA 5.74%Kenya 6.21% Germany 5.06%India 5.17% India 3.88%Italy 4.35% United Kingdom 3.70%Japan 4.21% Rep. of Korea 3.24%Belgium 3.39% United Arab Emirates 1.88%USA 3.25% France 1.84%
Total transactions in sector: 3,657 Total transactions in sector: 43,409% of all transactions in economy: 1.87% % of all transactions in economy: 22.17%
Appendix 8: Import Partners 2006-2014 (by # transactions)
Wholesale/Retail Manufacturing
Agriculture All other sectors

HS4 Product % of sector HS4 Product % of sector
Parts & access for motor vehicles 4.12% Screws/bolts/nuts/washers etc, iron or steel 3.62%Motor vehicles for transporting persons 2.37% Electrical apparatus for switching etc 3.48%Electrical apparatus for switching etc 1.96% Articles nesoi of unharded vulcanized rubber 3.07%Women's/girl's suits etc, not knit 1.84% Transmission shafts/bearings/gears etc, parts 2.54%Articles nesoi of unharded vulcanized rubber 1.83% Taps/cocks/valves etc for pipes/tanks etc 2.09%T-shirts etc, knit or crochet 1.79% Polymers of ethylene, in primary forms 1.72%Screws/bolts/nuts/washers etc, iron or steel 1.62% Ball or roller bearings and parts 1.54%Centrifuges, filter etc for liquid or gases, pts 1.55% Conveyor/transmission belts of vulc. rubber 1.42%Men's/boy's suits etc, not knit 1.50% Centrifuges, filter etc for liquid or gases, pts 1.39%Transmission shafts/bearings/gears etc, parts 1.48% Parts & access for motor vehicles 1.29%
Total transactions in sector: 105,972 Total transactions in sector: 27,335% of all transactions in economy: 54.13% % of all transactions in economy: 13.96%
Live plants/cuttings etc., mushroom spawn 7.30% Parts & access for motor vehicles 4.68%Insecticides/fungicides etc, retail 5.74% Articles nesoi of unharded vulcanized rubber 3.06%M or ch fertilizer, n/un2of3el, fert nesoi 5.25% Electrical apparatus for switching etc 3.00%Mech appl to disperse liq etc, sand etc blast 3.14% Screws/bolts/nuts/washers etc, iron or steel 2.84%Articles of plastics (inc polymers & resins) 3.14% Centrifuges, filter etc for liquid or gases, pts 2.23%Prefabricated buildings 2.90% Transmission shafts/bearings/gears etc, parts 2.18%Articles nesoi of unharded vulcanized rubber 2.73% Motor vehicles for transporting persons 2.13%Parts & access for motor vehicles 2.32% Pumps for liquids, liquid elevators, parts 1.95%Tubes/pipes/hoses & their fittings, of plastics 2.13% Parts for machinery of headings 8425 to 8430 1.81%Screws/bolts/nuts/washers etc, iron or steel 2.08% Taps, cocks, valves etc for pipes, tanks etc 1.67%
Total transactions in sector: 3,657 Total transactions in sector: 43,409% of all transactions in economy: 1.87% % of all transactions in economy: 22.17%
Appendix 9: Imported Products 2006-2014 (by # transactions)
Wholesale/Retail Manufacturing
Agriculture All other sectors

Country % of sector Country % of sector
USA 13.49% USA 14.56%Israel 8.07% Italy 13.95%China 7.85% Germany 7.71%Sudan 6.77% China 7.00%Saudi Arabia 6.42% China, Hong Kong SAR 5.59%Yemen 5.08% India 4.63%United Arab Emirates 4.76% Turkey 4.33%United Kingdom 4.16% United Kingdom 3.22%Canada 3.39% Sudan 2.47%Djibouti 3.29% France 2.02%
Total transactions in sector: 5,019 Total transactions in sector: 1,985% of all transactions in economy: 45.22% % of all transactions in economy: 17.88%
Netherlands 20.93% USA 18.06%Saudi Arabia 8.70% United Kingdom 11.24%United Arab Emirates 8.49% United Arab Emirates 9.16%Germany 5.27% Germany 7.16%United Kingdom 4.96% Saudi Arabia 6.22%Japan 4.11% Australia 4.48%Qatar 2.27% China 3.14%Norway 2.21% Norway 2.81%Russian Federation 2.06% Canada 2.81%France 2.06% Spain 2.81%
Total transactions in sector: 1,897 Total transactions in sector: 1,495% of all transactions in economy: 17.09% % of all transactions in economy: 13.47%
Appendix 10: Export Partners (by # transactions)
Wholesale/Retail Manufacturing
Agriculture All other sectors

HS4 Product % of sector HS4 Product % of sector
Oil seeds & oleaginous fruits, broken or not 21.36% Leather prepared after tanning/crusting 18.34%Leguminous vegetables, dried shelled 18.29% Sheep or lamb skin leather, no wool nesoi 7.71%Ginger/saffron/tumeric/thyme etc 5.86% Footwear nesoi 5.24%Pepper, genus piper, capsicum or pimenta 3.41% Beer made from malt 4.99%Precious & semiprec stones, not strung etc 3.13% Goat or kidskin leather, no hair nesoi 4.63%Vegetables nesoi, fresh or chilled 2.85% Cut flowers & buds for bouquet etc, prepared 3.63%Flour & meal of dry, legum vegs, fruit etc. 2.79% Lac/natural gums/resins/gum-resins/balsam 3.58%Lac/natural gums/resins/gum-resins/balsam 2.61% Shawls, scarves, mufflers, mantillas, veils etc. 3.32%Cut flowers & buds for bouquet etc, prepared 2.51% T-shirts/singlets/tank etc, knit or crochet 2.72%Seeds/anise/fennel/coriander/cumin etc 1.77% Footwear/outer sole rub, plastic or leather 2.32%
Total transactions in sector: 5,019 Total transactions in sector: 1,985% of all transactions in economy: 45.22% % of all transactions in economy: 17.88%
Cut flowers & buds for bouquet etc, prepared 55.56% Oil seeds & oleaginous fruits, broken or not 10.03%Live plants/cuttings etc., mushroom spawn 12.81% Leguminous vegetables, dried shelled 6.82%Leguminous vegetables, dried shelled 5.54% Bread/pastry etc: comm wafers/empty caps 4.01%Plants etc for pharmacy/perfume/insecticide 4.27% Flour & meal of dry, legum vegs, fruit etc. 3.48%Fruit nesoi, fresh 4.06% Pepper, genus piper, capsicum or pimenta 3.01%Vegetables nesoi, fresh or chilled 3.00% Cut flowers & buds for bouquet etc, prepared 2.94%Leguminous vegetables, shelled/not, fr/chill 2.27% Precious & semiprec stones, not strung etc 2.81%Tomatoes, fresh or chilled 1.48% Screws, bolts, nuts, washers etc, iron or steel 2.54%Lettuce and chicory, fresh or chilled 1.27% Paintings/drawings etc by hand as art 2.34%Meat of sheep or goats, fresh, chilled/frozen 1.21% Ball or roller bearings and parts 2.14%
Total transactions in sector: 1,897 Total transactions in sector: 1,495% of all transactions in economy: 17.09% % of all transactions in economy: 13.47%
Appendix 11: Exported Products (by # transactions)
Wholesale/Retail Manufacturing
Agriculture All other sectors

VariableAll sectors
0.636*** 0.716*** 0.519***(0.046) (0.050) (0.132)
0.195*** 0.160** 0.144(0.057) (0.070) (0.126)
1.057*** 0.485**(0.082) (0.193)
0.304*** -0.008(0.080) (0.160)
USD / Trading partner currency 0.111 0.709***(0.093) (0.178)
-0.096 0.431*(0.107) (0.240)
Observations 71,821 42,978 42,978 9,289 9,291R-Squared 0.044 0.052 0.054 0.099 0.099# of firms 5,635 3,518 3,518 520 520Notes: Estimations report standard errors clustered at the firm level, and include controls for year-on-year changes in the PPI of trading partners and Ethiopia, as well as product (hs4), trading partner, and firm fixed effects. * indicates significance at the 10% level; ** indicates significance at the 5% level; *** indicates significance at the 1% level.
Appendix 12: Import ERPT with lags
Birr / Trading partner currency
Birr / Trading partner currency lagged (t-1)
Birr / USD
Birr / USD lagged (t-1)
USD / Trading partner currency lagged (t-1)
Wholesale and retail Manufacturing

VariableAll sectors
0.699*** 0.872*** 0.611***(0.085) (0.131) (0.200)
0.114 0.108 -0.073(0.088) (0.116) (0.233)
0.856*** 0.890***(0.203) (0.265)
0.149 -0.194(0.128) (0.264)
USD / Trading partner currency 0.837*** 0.312(0.217) (0.289)
0.065 0.075(0.180) (0.340)
Observations 4,636 2,136 2,136 853 853R-Squared 0.126 0.164 0.165 0.222 0.224# of firms 629 336 336 76 76
Birr / USD lagged (t-1)
USD / Trading partner currency lagged (t-1)
Notes: Estimations report standard errors clustered at the firm level, and include controls for year-on-year changes in the PPI of trading partners and Ethiopia, as well as product (hs4), trading partner, and firm fixed effects. * indicates significance at the 10% level; ** indicates significance at the 5% level; *** indicates significance at the 1% level.
Appendix 13: Export ERPT with lags
Wholesale and retail Manufacturing
Birr / Trading partner currency
Birr / Trading partner currency lagged (t-1)
Birr / USD

HS8 Product Country %Sesamum seeds China 12.11%Sesamum seeds Israel 7.15%Dried broad beans and horse beans, shelled Sudan 5.44%Other oil seeds and oleaginous fruits, nes USA 4.87%Sesamum seeds Jordan 4.21%Dried chickpeas, shelled Pakistan 3.69%Sesamum seeds Turkey 3.64%Dried chickpeas, shelled United Arab Emirates 3.42%Dry tanned/crusted sheep/lamb skin Italy 1.93%Dried kidney beans, incl. white pea beans,shelled India 1.93%Tanned/crusted leather Italy 1.89%Roses Netherlands 1.80%Tanned/crusted leather China, Hong Kong SAR 1.58%Natural gums/resins China 1.49%Tanned/crusted leather China 1.45%Tanned/crusted leather of goats/kids China, Hong Kong SAR 1.32%Pepper, crushed or ground Canada 1.23%Tanned/crusted leather India 1.23%Dry tanned/crusted sheep/lamb skin India 1.18%Wet tanned/crusted sheep/lamb skin Italy 1.18%Wet tanned/crusted hides of goats/kids Italy 1.18%Natural gums/resins Tunisia 1.14%Dry tanned/crusted sheep/lamb skin China 0.88%Dry tanned/crusted hides of goats/kids China 0.83%Fresh Injera United Arab Emirates 0.83%Tanned/crusted leather of goats/kids Italy 0.83%Fresh Injera USA 0.83%Roses Saudi Arabia 0.79%Dry tanned/crusted sheep/lamb skin China, Hong Kong SAR 0.79%Flour/meal/powder of dried vegetables Canada 0.79%Other food preparation of flour, malt, etc Canada 0.79%Natural gum arabic India 0.75%Natural gums/resins United Arab Emirates 0.70%Pickled skins of sheep or lambs, withoutwool, not tanned Italy 0.70%Other oil seeds and oleaginous fruits, nes Israel 0.70%Shawls/scarves/mufflers/veils nec USA 0.70%Tanned/crusted leather Hungary 0.66%Wet tanned/crusted hides of goats/kids China 0.61%
Total # of transactions: 2279
Appendix 14: Details of Export Product-Country restricted sample (by # of transactions)

VariableAll sectors
-0.182** -0.136 -0.143(0.079) (0.091) (0.165)
-0.078 0.040 -0.406**(0.086) (0.094) (0.193)
-0.160 -0.164(0.125) (0.232)
0.009 -0.441(0.125) (0.289)
USD / Trading partner currency -0.083 -0.041(0.156) (0.360)
0.099 -0.419(0.156) (0.298)
Observations 61,344 37,601 37,601 7,754 7,756R-Squared 0.032 0.026 0.026 0.103 0.103# of firms 5506 3448 3448 513 513
Birr / USD lagged (t-1)
USD / Trading partner currency lagged (t-1)
Notes: Estimations report standard errors clustered at the firm level, and include controls for year-on-year changes in the PPI of trading partners and Ethiopia, as well as product (hs4), trading partner, and firm fixed effects. * indicates significance at the 10% level; ** indicates significance at the 5% level; *** indicates significance at the 1% level.
Appendix 15: Import Volume response with lags
Wholesale and retail Manufacturing
Birr / Trading partner currency
Birr / Trading partner currency lagged (t-1)
Birr / USD

VariableAll sectors
0.371* 0.751*** 0.886**(0.200) (0.285) (0.394)
-0.024 -0.004 0.312(0.265) (0.373) (0.750)
0.691 2.099***(0.427) (0.602)
0.264 -0.232(0.423) (1.169)
USD / Trading partner currency 0.555 -0.301(0.489) (0.932)
-0.387 0.692(0.603) (1.063)
Observations 4,283 1,969 1,969 773 773R-Squared 0.108 0.115 0.115 0.211 0.218# of firms 622 330 330 74 74
Birr / USD lagged (t-1)
USD / Trading partner currency lagged (t-1)
Notes: Estimations report standard errors clustered at the firm level, and include controls for year-on-year changes in the PPI of trading partners and Ethiopia, as well as product (hs4), trading partner, and firm fixed effects. * indicates significance at the 10% level; ** indicates significance at the 5% level; *** indicates significance at the 1% level.
Appendix 16: Export Volume response with lags
Wholesale and retail Manufacturing
Birr / Trading partner currency
Birr / Trading partner currency lagged (t-1)
Birr / USD

VariableAll sectors
-0.231*** -0.148 -0.129(0.088) (0.092) (0.177)
0.028 0.127 -0.195(0.094) (0.103) (0.221)
-0.355*** -0.163(0.132) (0.252)
0.184 -0.337(0.129) (0.321)
USD / Trading partner currency 0.089 0.106(0.175) (0.425)
0.118 -0.034(0.155) (0.333)
Observations 162,485 38,237 38,237 7,984 7,984R-Squared 0.043 0.032 0.032 0.121 0.121# of firms 10222 3462 3462 516 516
Birr / USD lagged (t-1)
USD / Trading partner currency lagged (t-1)
Notes: Estimations report standard errors clustered at the firm level, and include controls for year-on-year changes in the PPI of trading partners and Ethiopia, as well as product (hs4), trading partner, and firm fixed effects. * indicates significance at the 10% level; ** indicates significance at the 5% level; *** indicates significance at the 1% level.
Appendix 17: Import USD Value response with lags
Wholesale and retail Manufacturing
Birr / Trading partner currency
Birr / Trading partner currency lagged (t-1)
Birr / USD

VariableAll sectors
0.370* 0.666** 1.037**(0.213) (0.298) (0.402)
0.045 0.152 -0.024(0.276) (0.374) (0.760)
0.196 2.084***(0.423) (0.605)
0.544 -0.706(0.406) (1.190)
USD / Trading partner currency 1.016** 0.305(0.488) (0.986)
-0.164 0.576(0.622) (1.091)
Observations 4,265 1,954 1,954 770 770R-Squared 0.118 0.132 0.134 0.224 0.229# of firms 624 332 332 74 74
Birr / USD lagged (t-1)
USD / Trading partner currency lagged (t-1)
Notes: Estimations report standard errors clustered at the firm level, and include controls for year-on-year changes in the PPI of trading partners and Ethiopia, as well as product (hs4), trading partner, and firm fixed effects. * indicates significance at the 10% level; ** indicates significance at the 5% level; *** indicates significance at the 1% level.
Appendix 18: Export USD Value response with lags
Wholesale and retail Manufacturing
Birr / Trading partner currency
Birr / Trading partner currency lagged (t-1)
Birr / USD