the impact of wellness on workforce productivity in … · the impact of wellness on workforce...
TRANSCRIPT
HEALTH AND THE ECONOMY The Impact of Wellness on Workforce Productivity
in Global Markets
A Report to the U.S. Chamber of Commerce’s Global Initiative on Health and Economy
Bruce Rasmussen Kim Sweeny
Peter Sheehan
HEALTH AND THE ECONOMYThe Impact of Wellness on Workforce Productivity in Global Markets
2
This report builds on an earlier study released in the APEC Business Advisory Council which led to a call by APEC leaders for a dialogue between health, finance officials and the private sector.
2016Victoria Institute of Strategic Economic Studies
Victoria UniversityPO Box 14428
Melbourne VIC 8001For further information contact:
Prof. Bruce [email protected]
The U.S. Chamber of Commerce is the world’s largest business federation representing the interests of more than 3 million businesses of all sizes, sectors, and regions, as well as state and local chambers and industry associations.
Copyright © 2016 by the United States Chamber of Commerce. All rights reserved. No part of this publication may be reproduced or transmitted in any form—print, electronic, or otherwise—without the express written permission of the publisher.

1
Letter from Myron BrilliantExecutive Vice President and Head of International Affairs
Today’s government and business leaders are confronting a new challenge that is impacting economic growth and commercial success: employee health. In developed and developing countries alike, adult populations are facing alarming increases in rates of chronic diseases, which claim 63% of all deaths. Mostly adult occurring, chronic diseases like cardiovascular disease, cancers, diabetes and respiratory disease, hit workers in their prime years of productivity and can create long-term chronic conditions, withdrawal from the workforce, diminished family resources, and early death.
The short-term budget implications of this crisis are alarming. But as this report shows, the costs related to lost productivity are much more significant, and have the potential to derail needed development gains and generations of prosperity.
The single most important takeaway from this report is that there is an urgent need for greater action by all stakeholders. In order to succeed in combating the challenges of modern disease; governments, civil society, and business must integrate their expertise and resources in support of health and wellness.
The U.S. Chamber of Commerce is dedicated to doing just that. With the support of our members, large and small, we are committed to promoting greater cooperation between government and private health stakeholders, championing the role of the employer in establishing healthy habits, and advocating for access to innovative and efficient health care products and services. We do this domestically through the work of our Labor, Immigration and Employee Benefits Division and our U.S. Chamber of Commerce Foundation. Internationally, we promote good health policies through our Global Initiative on Health and Economy.
We hope this study will serve as a call to action, and we welcome all interested parties.
Warmest regards,
Myron A. Brilliant Executive Vice President and Head of International AffairsU.S. Chamber of Commerce
HEALTH AND THE ECONOMYThe Impact of Wellness on Workforce Productivity in Global Markets
2
Table of Contents
Executive Summary . . . . . . . . . . . . . . . . . . . . . . . . . . . . . . . . . . . . . . . . . . . . . . . . . . . . . . . . . . . . . . . 3
Context of the Study . . . . . . . . . . . . . . . . . . . . . . . . . . . . . . . . . . . . . . . . . . . . . . . . . . . . . . . . . . . . . . 5
Population and Labor Force Ageing . . . . . . . . . . . . . . . . . . . . . . . . . . . . . . . . . . . . . . . . . . . . . . . . . . 7
Estimating the Worker Attendance Costs of NCDs . . . . . . . . . . . . . . . . . . . . . . . . . . . . . . . . . . . . . . . 14
Impact of Ill Health on the Ability to Work . . . . . . . . . . . . . . . . . . . . . . . . . . . . . . . . . . . . . . . . . . . . . 17
The Economic Loss Due to Early Retirement . . . . . . . . . . . . . . . . . . . . . . . . . . . . . . . . . . . . . . . . . . . 17
Conclusions from the Analysis . . . . . . . . . . . . . . . . . . . . . . . . . . . . . . . . . . . . . . . . . . . . . . . . . . . . . 20
References . . . . . . . . . . . . . . . . . . . . . . . . . . . . . . . . . . . . . . . . . . . . . . . . . . . . . . . . . . . . . . . . . . . . 23
About the Author . . . . . . . . . . . . . . . . . . . . . . . . . . . . . . . . . . . . . . . . . . . . . . . . . . . . . . . . . . . . . . . . 24
3
Executive Summary
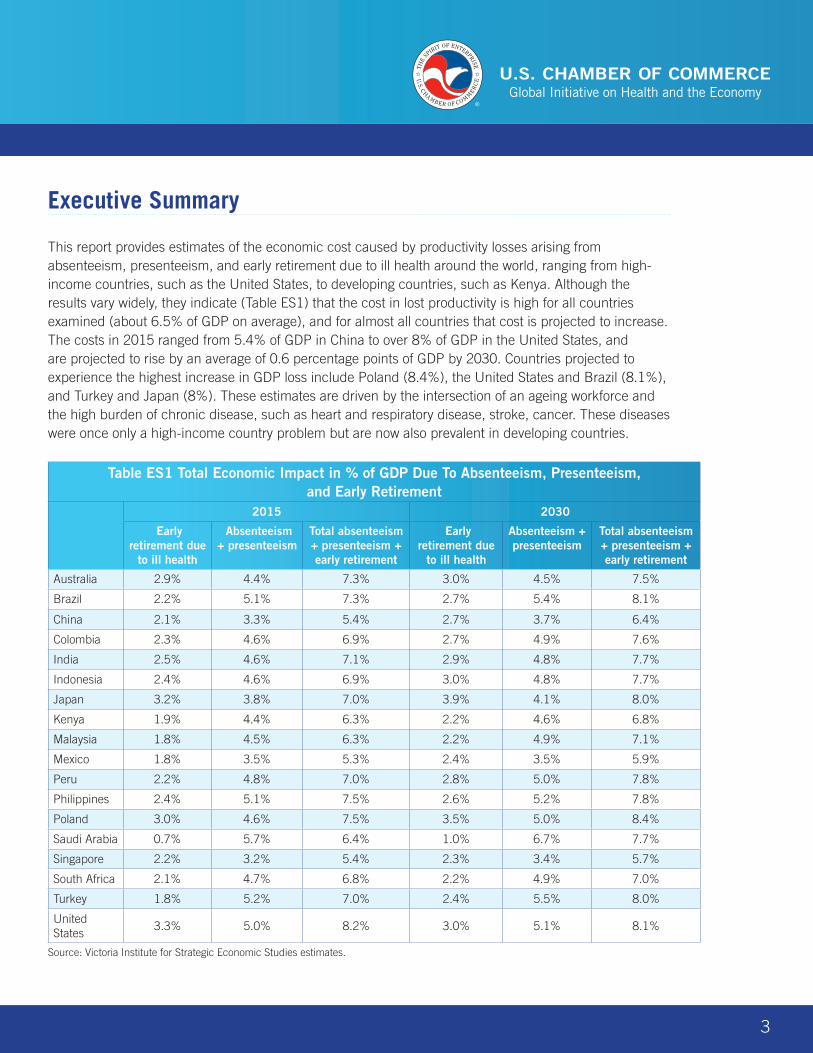
This report provides estimates of the economic cost caused by productivity losses arising from absenteeism, presenteeism, and early retirement due to ill health around the world, ranging from high-income countries, such as the United States, to developing countries, such as Kenya. Although the results vary widely, they indicate (Table ES1) that the cost in lost productivity is high for all countries examined (about 6.5% of GDP on average), and for almost all countries that cost is projected to increase. The costs in 2015 ranged from 5.4% of GDP in China to over 8% of GDP in the United States, and are projected to rise by an average of 0.6 percentage points of GDP by 2030. Countries projected to experience the highest increase in GDP loss include Poland (8.4%), the United States and Brazil (8.1%), and Turkey and Japan (8%). These estimates are driven by the intersection of an ageing workforce and the high burden of chronic disease, such as heart and respiratory disease, stroke, cancer. These diseases were once only a high-income country problem but are now also prevalent in developing countries.
Table ES1 Total Economic Impact in % of GDP Due To Absenteeism, Presenteeism, and Early Retirement
2015 2030
Early retirement due
to ill health
Absenteeism + presenteeism
Total absenteeism + presenteeism + early retirement
Early retirement due
to ill health
Absenteeism + presenteeism
Total absenteeism + presenteeism + early retirement
Australia 2.9% 4.4% 7.3% 3.0% 4.5% 7.5%
Brazil 2.2% 5.1% 7.3% 2.7% 5.4% 8.1%
China 2.1% 3.3% 5.4% 2.7% 3.7% 6.4%
Colombia 2.3% 4.6% 6.9% 2.7% 4.9% 7.6%
India 2.5% 4.6% 7.1% 2.9% 4.8% 7.7%
Indonesia 2.4% 4.6% 6.9% 3.0% 4.8% 7.7%
Japan 3.2% 3.8% 7.0% 3.9% 4.1% 8.0%
Kenya 1.9% 4.4% 6.3% 2.2% 4.6% 6.8%
Malaysia 1.8% 4.5% 6.3% 2.2% 4.9% 7.1%
Mexico 1.8% 3.5% 5.3% 2.4% 3.5% 5.9%
Peru 2.2% 4.8% 7.0% 2.8% 5.0% 7.8%
Philippines 2.4% 5.1% 7.5% 2.6% 5.2% 7.8%
Poland 3.0% 4.6% 7.5% 3.5% 5.0% 8.4%
Saudi Arabia 0.7% 5.7% 6.4% 1.0% 6.7% 7.7%
Singapore 2.2% 3.2% 5.4% 2.3% 3.4% 5.7%
South Africa 2.1% 4.7% 6.8% 2.2% 4.9% 7.0%
Turkey 1.8% 5.2% 7.0% 2.4% 5.5% 8.0%
United States
3.3% 5.0% 8.2% 3.0% 5.1% 8.1%
Source: Victoria Institute for Strategic Economic Studies estimates.
HEALTH AND THE ECONOMYThe Impact of Wellness on Workforce Productivity in Global Markets
4
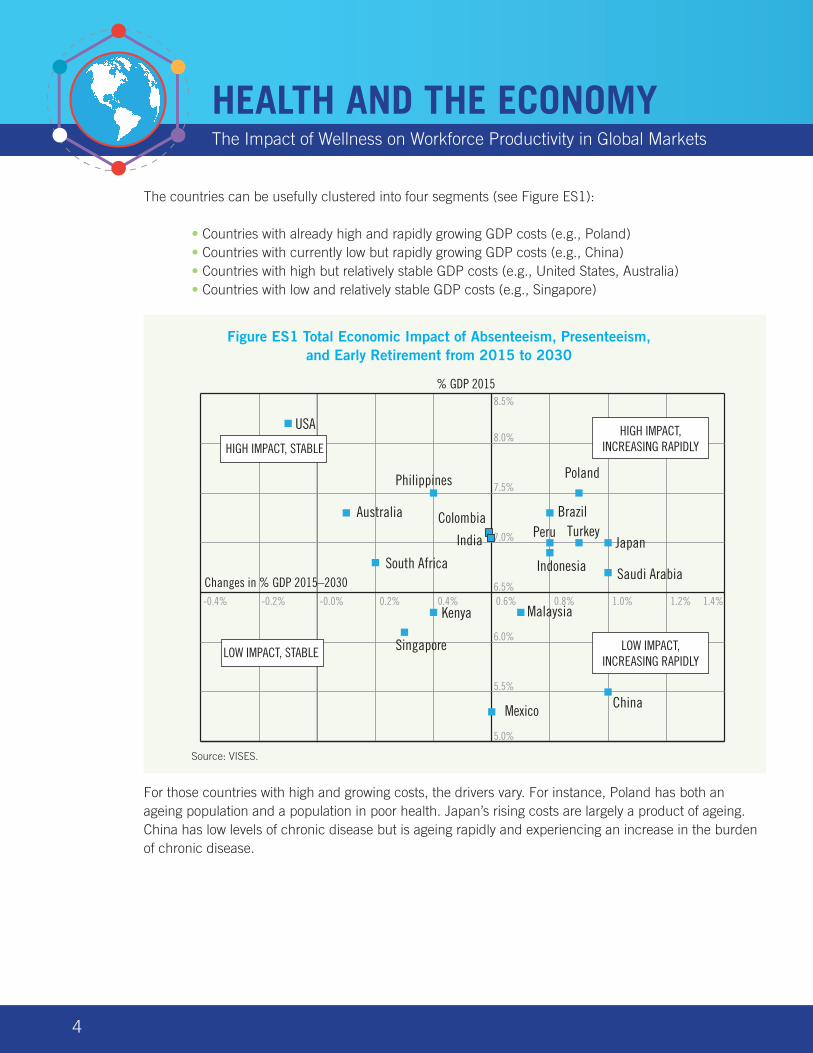
The countries can be usefully clustered into four segments (see Figure ES1):
• Countries with already high and rapidly growing GDP costs (e.g., Poland) • Countries with currently low but rapidly growing GDP costs (e.g., China) • Countries with high but relatively stable GDP costs (e.g., United States, Australia) • Countries with low and relatively stable GDP costs (e.g., Singapore)
Source: VISES.
For those countries with high and growing costs, the drivers vary. For instance, Poland has both an ageing population and a population in poor health. Japan’s rising costs are largely a product of ageing. China has low levels of chronic disease but is ageing rapidly and experiencing an increase in the burden of chronic disease.
Australia Brazil
China
Colombia
Kenya
Mexico
Peru
Poland
Saudi Arabia
Turkey
USA
-0.4% -0.2% -0.0% 0.2% 0.4% 0.6% 0.8% 1.0% 1.2% 1.4%
5.0%
5.5%
6.0%
6.5%
7.0%
7.5%
8.0%
8.5%
HIGH IMPACT, STABLE
LOW IMPACT, STABLE
HIGH IMPACT, INCREASING RAPIDLY
LOW IMPACT, INCREASING RAPIDLY
% GDP 2015
Changes in % GDP 2015–2030-0.4% -0.2% -0.0% 0.2% 0.4% 0.6% 0.8% 1.0% 1.2% 1.4%
Japan
Indonesia
Malaysia
South Africa
Philippines
India
Singapore
Figure ES1 Total Economic Impact of Absenteeism, Presenteeism, and Early Retirement from 2015 to 2030
5
Context of the Study
In spite of very different circumstances, most countries face three common challenges:
• Their populations are ageing, in different ways and to different degrees. • A high prevalence of non-communicable diseases (NCDs) exists, particularly for older
age groups. • Many risk factors for the future incidence of NCDs are high and, in some cases, are continuing
to rise.
Taken together, these factors already impose heavy costs on businesses, governments, and individuals, and threaten much greater costs in the future. The economic costs arise largely because people in ill health aren’t able to work as much as they would like. They may either be sick and absent from work (absenteeism), present at work but not working at full capacity due to illness (presenteeism), or retired between ages 50 and 64—due to ill health (early retirement due to ill health).
The economic costs on productivity imposed by each of these groups has been modeled and included in this report. A separate group, which is not explicitly covered in this report, consists of people who may not work at any time, due to incapacity or a health condition that has been present for most of their lives.
Following an initial report for the APEC Business Advisory Council (ABAC) and the Life Sciences Innovation Forum (LSIF) in 2014, the Victoria Institute for Strategic Economic Studies (VISES) prepared four reports, Sheehan et al. (2014), Sweeny et al. (2015), and Rasmussen et al. (2015a, 2015b), that now cover 18 countries on three aspects of these economic costs:
Absenteeism People in ill health who are sick and absent from work
Presenteeism People who are present at work but not working at full capacity due to illness
Early Retirement People who retire between ages 50 and 64 due to ill health
This report summarizes the results of these earlier reports and revises for later data.
HEALTH AND THE ECONOMYThe Impact of Wellness on Workforce Productivity in Global Markets
6
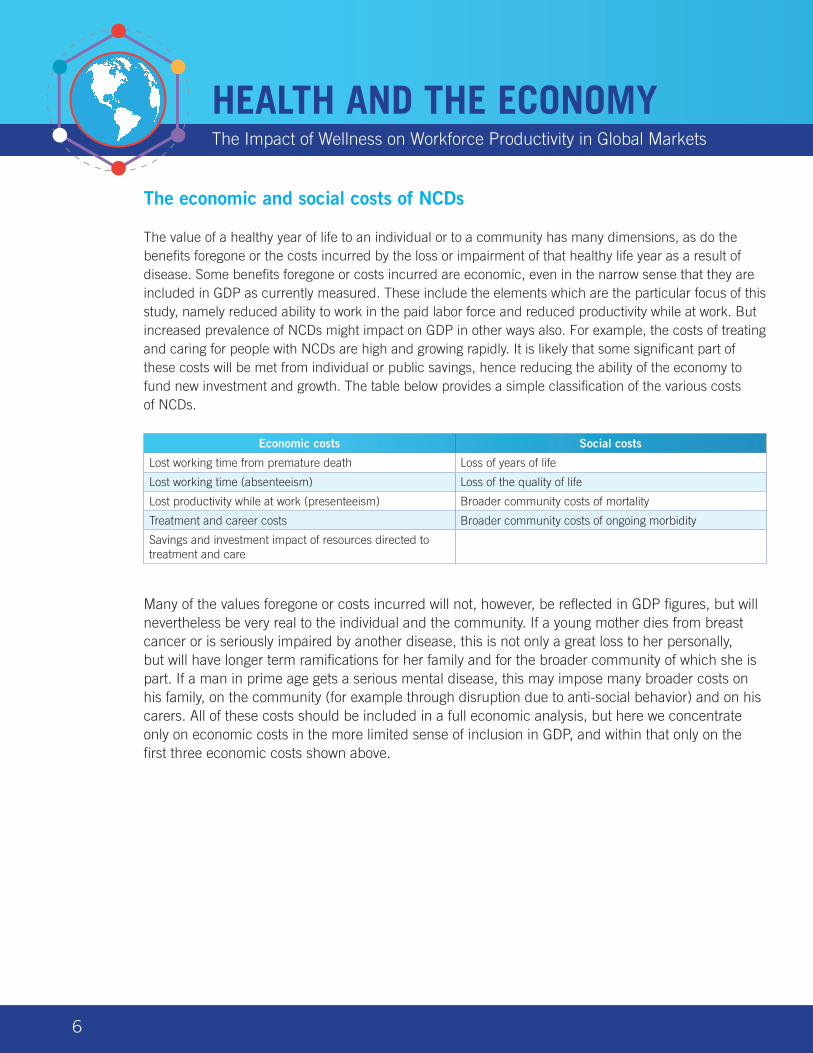
The economic and social costs of NCDs
The value of a healthy year of life to an individual or to a community has many dimensions, as do the benefits foregone or the costs incurred by the loss or impairment of that healthy life year as a result of disease. Some benefits foregone or costs incurred are economic, even in the narrow sense that they are included in GDP as currently measured. These include the elements which are the particular focus of this study, namely reduced ability to work in the paid labor force and reduced productivity while at work. But increased prevalence of NCDs might impact on GDP in other ways also. For example, the costs of treating and caring for people with NCDs are high and growing rapidly. It is likely that some significant part of these costs will be met from individual or public savings, hence reducing the ability of the economy to fund new investment and growth. The table below provides a simple classification of the various costs of NCDs.
Economic costs Social costs
Lost working time from premature death Loss of years of life
Lost working time (absenteeism) Loss of the quality of life
Lost productivity while at work (presenteeism) Broader community costs of mortality
Treatment and career costs Broader community costs of ongoing morbidity
Savings and investment impact of resources directed to treatment and care
Many of the values foregone or costs incurred will not, however, be reflected in GDP figures, but will nevertheless be very real to the individual and the community. If a young mother dies from breast cancer or is seriously impaired by another disease, this is not only a great loss to her personally, but will have longer term ramifications for her family and for the broader community of which she is part. If a man in prime age gets a serious mental disease, this may impose many broader costs on his family, on the community (for example through disruption due to anti‐social behavior) and on his carers. All of these costs should be included in a full economic analysis, but here we concentrate only on economic costs in the more limited sense of inclusion in GDP, and within that only on the first three economic costs shown above.
7
Population and Labor Force Ageing
Population ageing
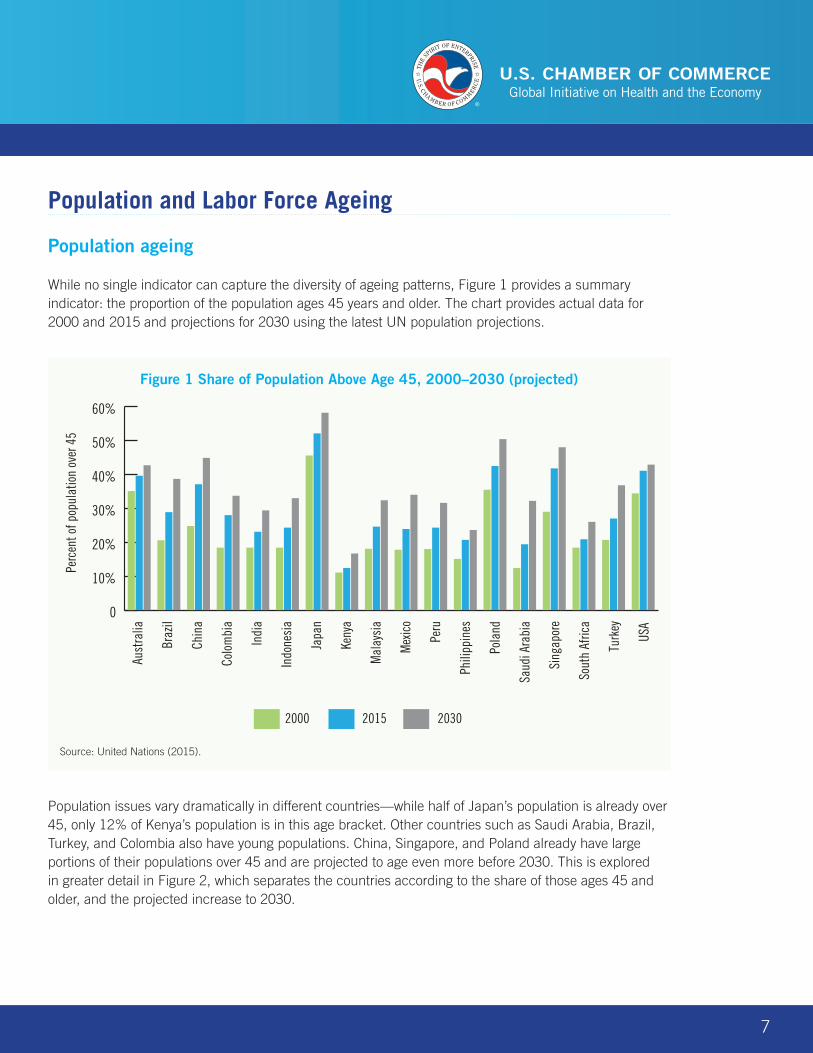
While no single indicator can capture the diversity of ageing patterns, Figure 1 provides a summary indicator: the proportion of the population ages 45 years and older. The chart provides actual data for 2000 and 2015 and projections for 2030 using the latest UN population projections.
Population issues vary dramatically in different countries—while half of Japan’s population is already over 45, only 12% of Kenya’s population is in this age bracket. Other countries such as Saudi Arabia, Brazil, Turkey, and Colombia also have young populations. China, Singapore, and Poland already have large portions of their populations over 45 and are projected to age even more before 2030. This is explored in greater detail in Figure 2, which separates the countries according to the share of those ages 45 and older, and the projected increase to 2030.
Aust
ralia
Braz
il
Chin
a
Colo
mbi
a
Indi
a
Indo
nesi
a
Japa
n
Keny
a
Mal
aysi
a
Mex
ico
Peru
Phili
ppin
es
Pola
nd
Saud
i Ara
bia
Sing
apor
e
Sout
h Af
rica
Turk
ey
USA
2000 2015 2030
0
10%
20%
30%
40%
50%
60%
Perc
ent o
f pop
ulat
ion
over
45
Figure 1 Share of Population Above Age 45, 2000–2030 (projected)
Source: United Nations (2015).
HEALTH AND THE ECONOMYThe Impact of Wellness on Workforce Productivity in Global Markets
8
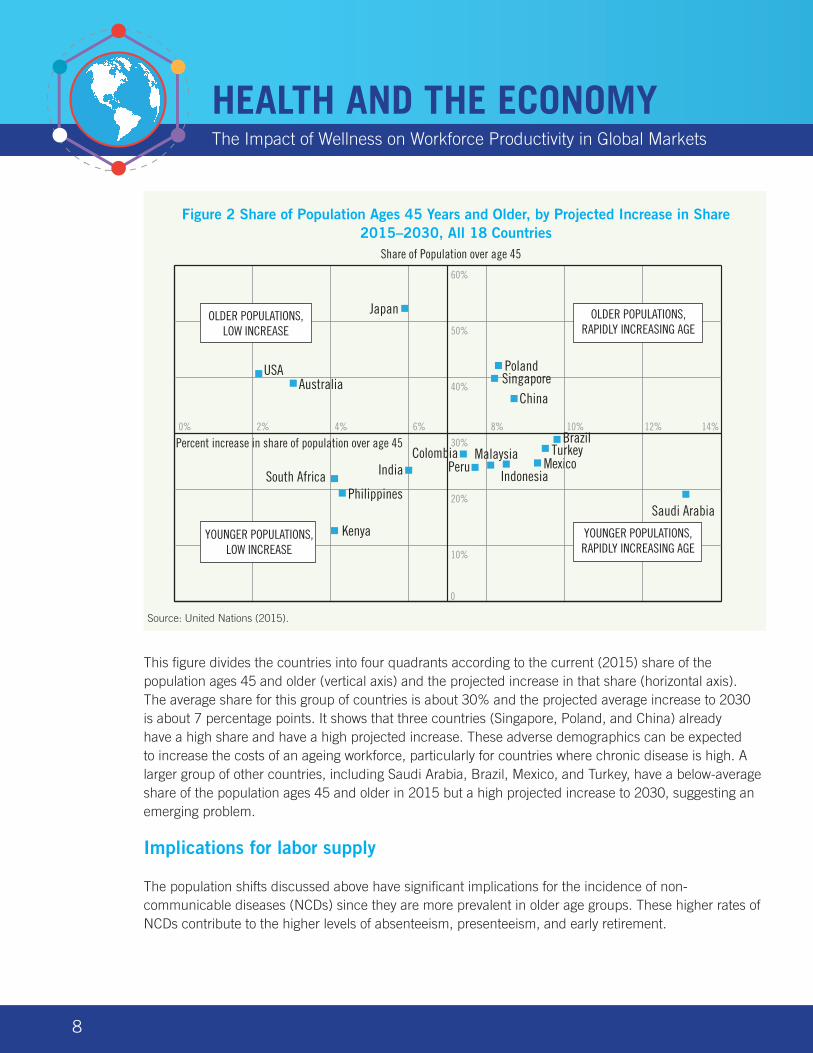
Source: United Nations (2015).
This figure divides the countries into four quadrants according to the current (2015) share of the population ages 45 and older (vertical axis) and the projected increase in that share (horizontal axis). The average share for this group of countries is about 30% and the projected average increase to 2030 is about 7 percentage points. It shows that three countries (Singapore, Poland, and China) already have a high share and have a high projected increase. These adverse demographics can be expected to increase the costs of an ageing workforce, particularly for countries where chronic disease is high. A larger group of other countries, including Saudi Arabia, Brazil, Mexico, and Turkey, have a below-average share of the population ages 45 and older in 2015 but a high projected increase to 2030, suggesting an emerging problem.
Implications for labor supply
The population shifts discussed above have significant implications for the incidence of non-communicable diseases (NCDs) since they are more prevalent in older age groups. These higher rates of NCDs contribute to the higher levels of absenteeism, presenteeism, and early retirement.
AustraliaChina
India Indonesia
Japan
Kenya
MexicoPeru
Poland
Saudi Arabia
South Africa
USA
0% 2% 4% 6% 8% 10% 12% 14%
0
10%
20%
30%
40%
50%
60%
OLDER POPULATIONS, LOW INCREASE
YOUNGER POPULATIONS, LOW INCREASE
OLDER POPULATIONS, RAPIDLY INCREASING AGE
YOUNGER POPULATIONS, RAPIDLY INCREASING AGE
Share of Population over age 45
Percent increase in share of population over age 45
Philippines
Singapore
MalaysiaColombia TurkeyBrazil
Figure 2 Share of Population Ages 45 Years and Older, by Projected Increase in Share 2015–2030, All 18 Countries
Source: United Nations (2015).
9
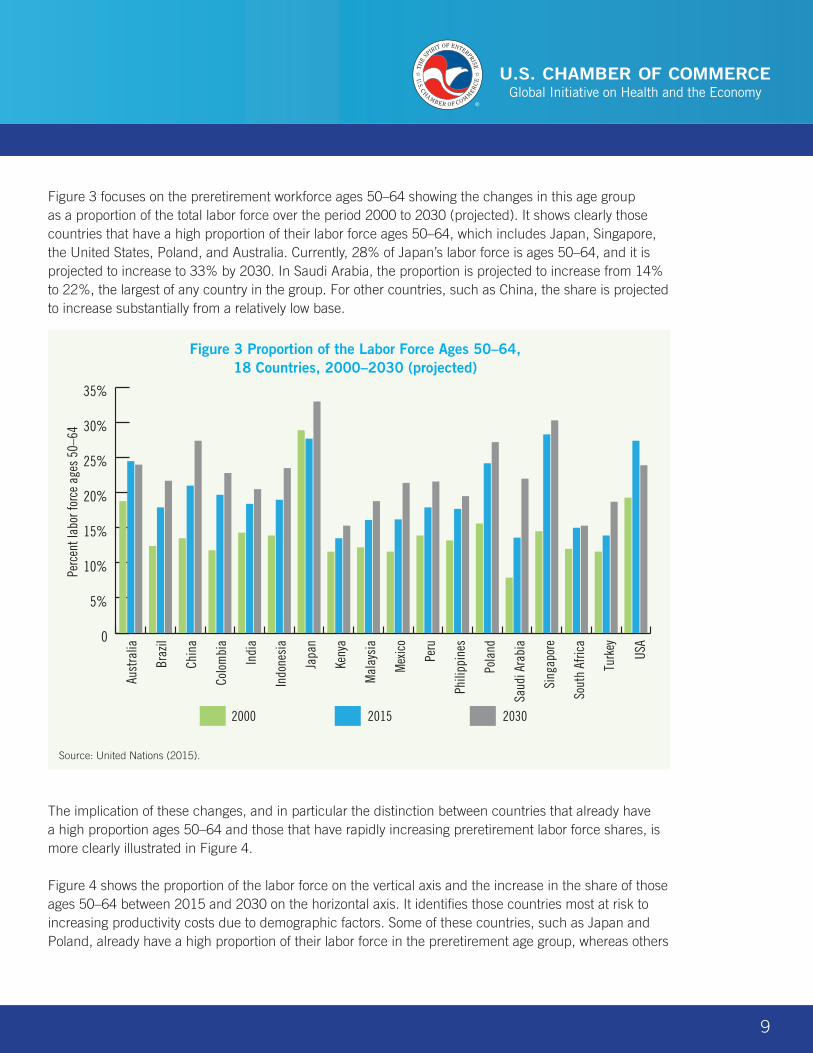
Figure 3 focuses on the preretirement workforce ages 50–64 showing the changes in this age group as a proportion of the total labor force over the period 2000 to 2030 (projected). It shows clearly those countries that have a high proportion of their labor force ages 50–64, which includes Japan, Singapore, the United States, Poland, and Australia. Currently, 28% of Japan’s labor force is ages 50–64, and it is projected to increase to 33% by 2030. In Saudi Arabia, the proportion is projected to increase from 14% to 22%, the largest of any country in the group. For other countries, such as China, the share is projected to increase substantially from a relatively low base.
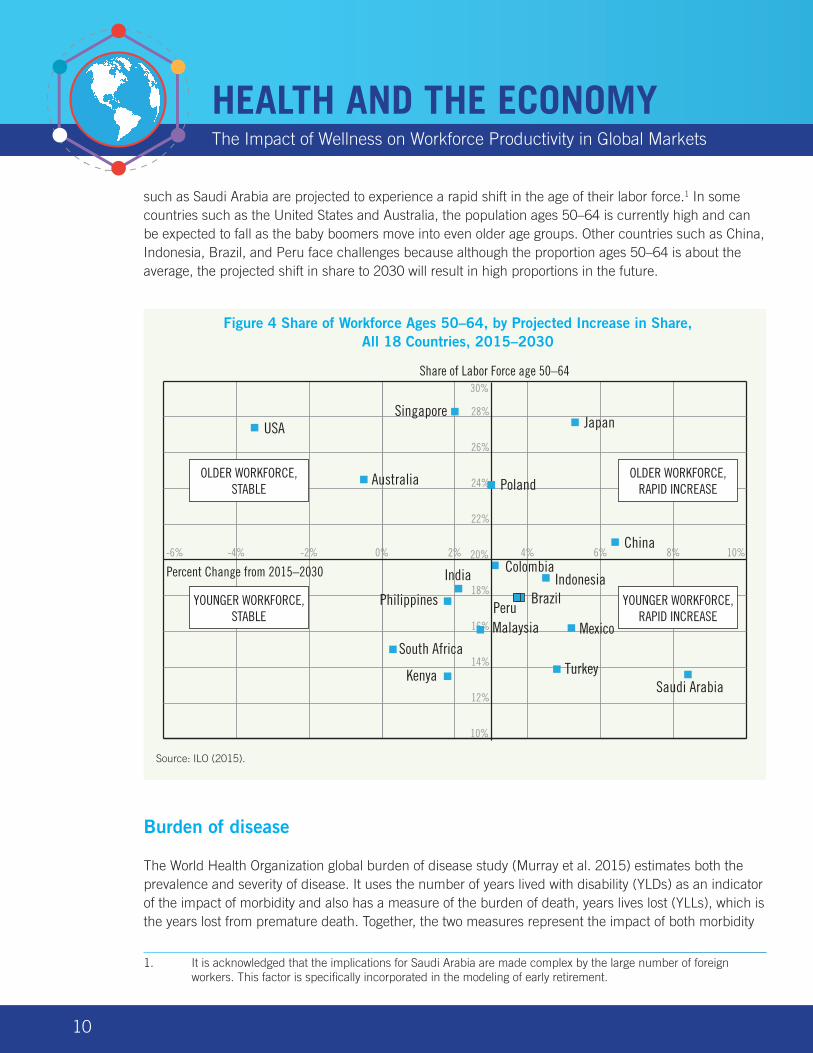
The implication of these changes, and in particular the distinction between countries that already have a high proportion ages 50–64 and those that have rapidly increasing preretirement labor force shares, is more clearly illustrated in Figure 4.
Figure 4 shows the proportion of the labor force on the vertical axis and the increase in the share of those ages 50–64 between 2015 and 2030 on the horizontal axis. It identifies those countries most at risk to increasing productivity costs due to demographic factors. Some of these countries, such as Japan and Poland, already have a high proportion of their labor force in the preretirement age group, whereas others
0
5%
10%
15%
20%
25%
30%
35%
Aust
ralia
Braz
il
Chin
a
Colo
mbi
a
Indi
a
Indo
nesi
a
Japa
n
Keny
a
Mal
aysi
a
Mex
ico
Peru
Phili
ppin
es
Pola
nd
Saud
i Ara
bia
Sing
apor
e
Sout
h Af
rica
Turk
ey
USA
2000 2015 2030
Perc
ent l
abor
forc
e ag
es 5
0–64
Figure 3 Proportion of the Labor Force Ages 50–64, 18 Countries, 2000–2030 (projected)
Source: United Nations (2015).
HEALTH AND THE ECONOMYThe Impact of Wellness on Workforce Productivity in Global Markets
10
such as Saudi Arabia are projected to experience a rapid shift in the age of their labor force.1 In some countries such as the United States and Australia, the population ages 50–64 is currently high and can be expected to fall as the baby boomers move into even older age groups. Other countries such as China, Indonesia, Brazil, and Peru face challenges because although the proportion ages 50–64 is about the average, the projected shift in share to 2030 will result in high proportions in the future.
Source: ILO (2015).
Burden of disease
The World Health Organization global burden of disease study (Murray et al. 2015) estimates both the prevalence and severity of disease. It uses the number of years lived with disability (YLDs) as an indicator of the impact of morbidity and also has a measure of the burden of death, years lives lost (YLLs), which is the years lost from premature death. Together, the two measures represent the impact of both morbidity
1. It is acknowledged that the implications for Saudi Arabia are made complex by the large number of foreign workers. This factor is specifically incorporated in the modeling of early retirement.
China
ColombiaIndia
Kenya
USA
-6% -4% -2% 0% 2% 4% 6% 8% 10%
10%
12%
14%
16%
18%
20%
22%
24%
26%
28%
30%
OLDER WORKFORCE, STABLE
YOUNGER WORKFORCE, STABLE
OLDER WORKFORCE, RAPID INCREASE
YOUNGER WORKFORCE, RAPID INCREASE
Share of Labor Force age 50–64
Percent Change from 2015–2030
Australia
Brazil
Malaysia MexicoPeruPhilippines
Poland
Saudi Arabia
Singapore
TurkeySouth Africa
Japan
Indonesia
Figure 4 Share of Workforce Ages 50–64, by Projected Increase in Share, All 18 Countries, 2015–2030
Source: ILO (2015).
11
and premature death, which is known as disability adjusted life years (DALYs). The results are grouped in three broad sequelae:
• Communicable, maternal, perinatal, and nutritional conditions • Non-communicable diseases • Injuries
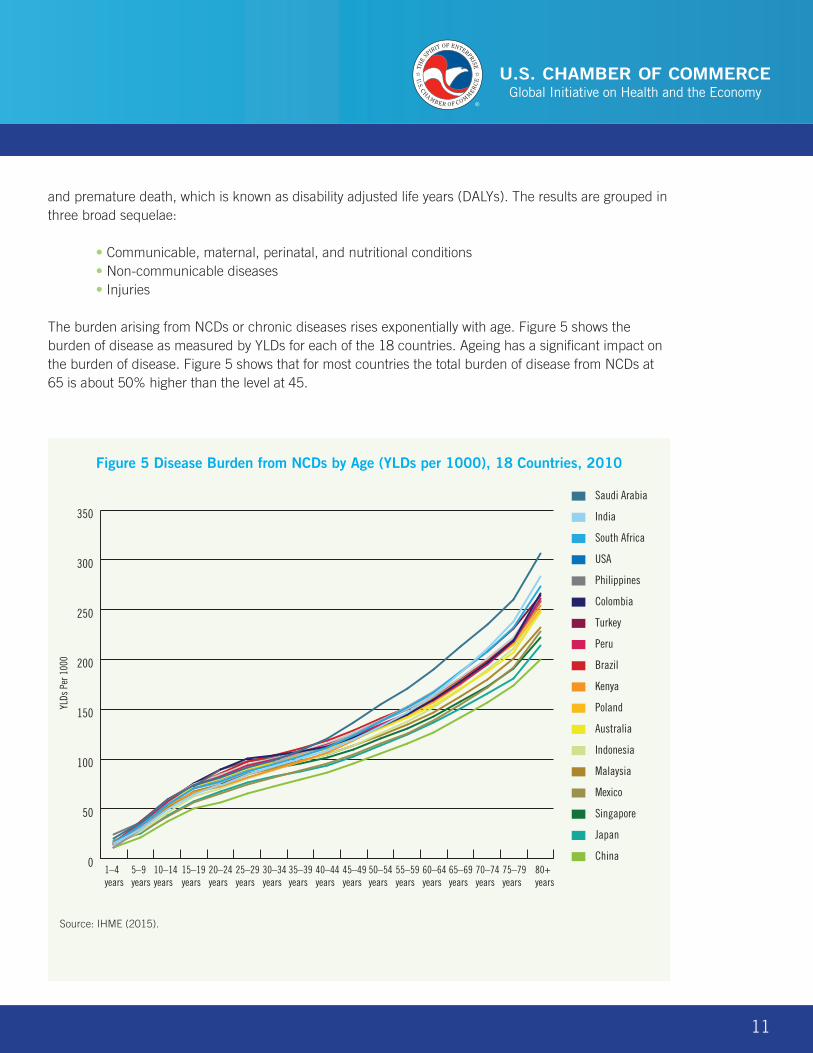
The burden arising from NCDs or chronic diseases rises exponentially with age. Figure 5 shows the burden of disease as measured by YLDs for each of the 18 countries. Ageing has a significant impact on the burden of disease. Figure 5 shows that for most countries the total burden of disease from NCDs at 65 is about 50% higher than the level at 45.
Source: IHME (2015).
0
50
100
150
200
250
300
350
Australia
Brazil
China
Colombia
India
Indonesia
Japan
Kenya
Malaysia
Mexico
Peru
Philippines
Poland
Saudi Arabia
Singapore
South Africa
Turkey
USA
1–4years
5–9years
10–14years
15–19years
20–24years
25–29years
30–34years
35–39years
40–44years
45–49years
50–54years
55–59years
60–64years
65–69years
70–74years
75–79years
80+years
YLDs
Per
100
0
Figure 5 Disease Burden from NCDs by Age (YLDs per 1000), 18 Countries, 2010
HEALTH AND THE ECONOMYThe Impact of Wellness on Workforce Productivity in Global Markets
12
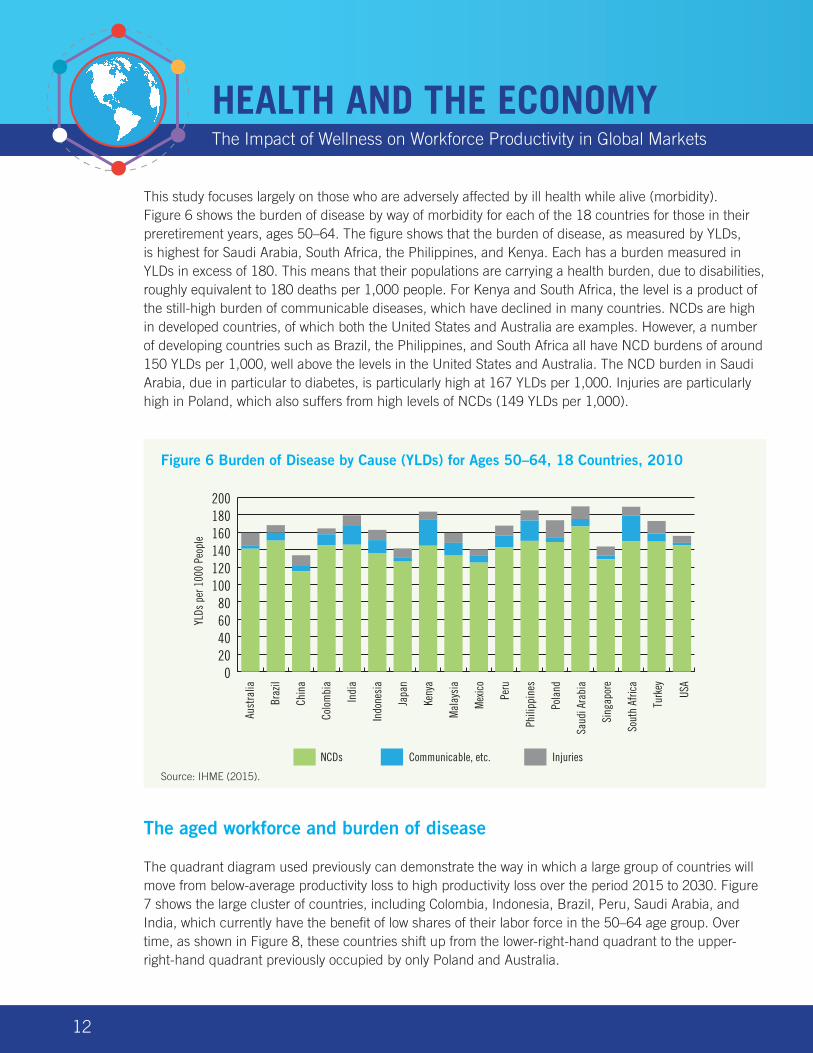
This study focuses largely on those who are adversely affected by ill health while alive (morbidity). Figure 6 shows the burden of disease by way of morbidity for each of the 18 countries for those in their preretirement years, ages 50–64. The figure shows that the burden of disease, as measured by YLDs, is highest for Saudi Arabia, South Africa, the Philippines, and Kenya. Each has a burden measured in YLDs in excess of 180. This means that their populations are carrying a health burden, due to disabilities, roughly equivalent to 180 deaths per 1,000 people. For Kenya and South Africa, the level is a product of the still-high burden of communicable diseases, which have declined in many countries. NCDs are high in developed countries, of which both the United States and Australia are examples. However, a number of developing countries such as Brazil, the Philippines, and South Africa all have NCD burdens of around 150 YLDs per 1,000, well above the levels in the United States and Australia. The NCD burden in Saudi Arabia, due in particular to diabetes, is particularly high at 167 YLDs per 1,000. Injuries are particularly high in Poland, which also suffers from high levels of NCDs (149 YLDs per 1,000).
The aged workforce and burden of disease
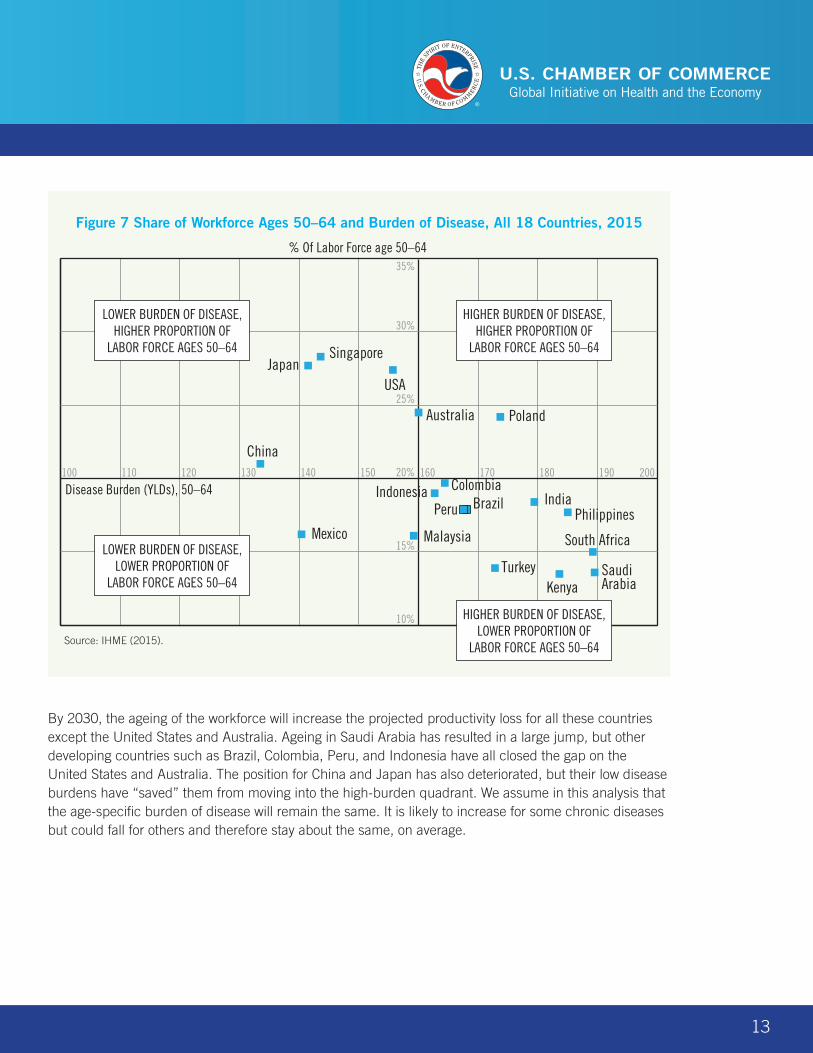
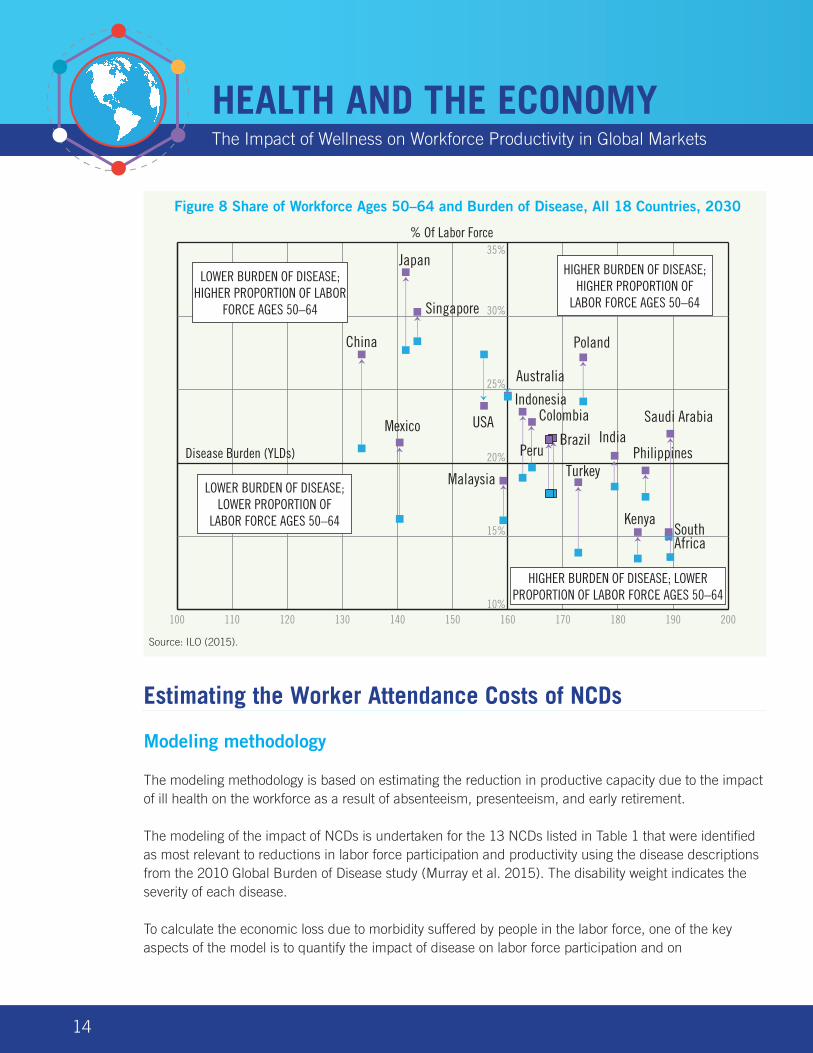
The quadrant diagram used previously can demonstrate the way in which a large group of countries will move from below-average productivity loss to high productivity loss over the period 2015 to 2030. Figure 7 shows the large cluster of countries, including Colombia, Indonesia, Brazil, Peru, Saudi Arabia, and India, which currently have the benefit of low shares of their labor force in the 50–64 age group. Over time, as shown in Figure 8, these countries shift up from the lower-right-hand quadrant to the upper-right-hand quadrant previously occupied by only Poland and Australia.
NCDs Communicable, etc. Injuries
Aust
ralia
Braz
il
Chin
a
Colo
mbi
a
Indi
a
Indo
nesi
a
Japa
n
Keny
a
Mal
aysi
a
Mex
ico
Peru
Phili
ppin
es
Pola
nd
Saud
i Ara
bia
Sing
apor
e
Sout
h Af
rica
Turk
ey
USA
YLDs
per
100
0 Pe
ople
020406080
100120140160180200
Figure 6 Burden of Disease by Cause (YLDs) for Ages 50–64, 18 Countries, 2010
Source: IHME (2015).
13
By 2030, the ageing of the workforce will increase the projected productivity loss for all these countries except the United States and Australia. Ageing in Saudi Arabia has resulted in a large jump, but other developing countries such as Brazil, Colombia, Peru, and Indonesia have all closed the gap on the United States and Australia. The position for China and Japan has also deteriorated, but their low disease burdens have “saved” them from moving into the high-burden quadrant. We assume in this analysis that the age-specific burden of disease will remain the same. It is likely to increase for some chronic diseases but could fall for others and therefore stay about the same, on average.
100 110 120 130 140 150 160 170 180 190 200
10%
15%
20%
25%
30%
35%
Australia
Brazil
China
ColombiaIndiaIndonesia
Japan
Kenya
MalaysiaMexico
Peru Philippines
Poland
Saudi Arabia
Singapore
South Africa
Turkey
USA
LOWER BURDEN OF DISEASE, HIGHER PROPORTION OF
LABOR FORCE AGES 50–64
LOWER BURDEN OF DISEASE, LOWER PROPORTION OF
LABOR FORCE AGES 50–64
HIGHER BURDEN OF DISEASE, HIGHER PROPORTION OF
LABOR FORCE AGES 50–64
HIGHER BURDEN OF DISEASE, LOWER PROPORTION OF
LABOR FORCE AGES 50–64
% Of Labor Force age 50–64
Disease Burden (YLDs), 50–64
Figure 7 Share of Workforce Ages 50–64 and Burden of Disease, All 18 Countries, 2015
Source: IHME (2015).
HEALTH AND THE ECONOMYThe Impact of Wellness on Workforce Productivity in Global Markets
14
Estimating the Worker Attendance Costs of NCDs
Modeling methodology
The modeling methodology is based on estimating the reduction in productive capacity due to the impact of ill health on the workforce as a result of absenteeism, presenteeism, and early retirement.
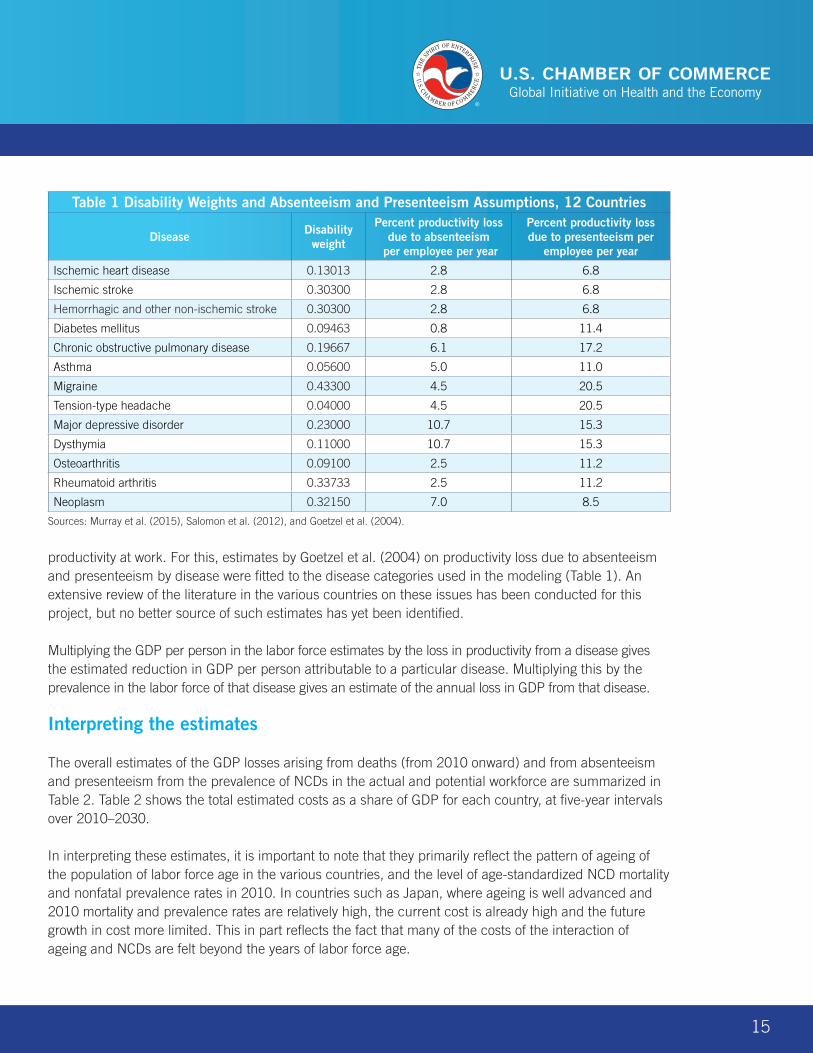
The modeling of the impact of NCDs is undertaken for the 13 NCDs listed in Table 1 that were identified as most relevant to reductions in labor force participation and productivity using the disease descriptions from the 2010 Global Burden of Disease study (Murray et al. 2015). The disability weight indicates the severity of each disease.
To calculate the economic loss due to morbidity suffered by people in the labor force, one of the key aspects of the model is to quantify the impact of disease on labor force participation and on
100 110 120 130 140 150 160 170 180 190 20010%
15%
20%
25%
30%
35%
China
Japan
Singapore
USAMexico
Australia
Brazil
ColombiaIndia
Indonesia
Kenya
Malaysia
Philippines
Poland
Saudi Arabia
South Africa
Turkey
LOWER BURDEN OF DISEASE; HIGHER PROPORTION OF LABOR
FORCE AGES 50–64
LOWER BURDEN OF DISEASE; LOWER PROPORTION OF
LABOR FORCE AGES 50–64
HIGHER BURDEN OF DISEASE; HIGHER PROPORTION OF
LABOR FORCE AGES 50–64
HIGHER BURDEN OF DISEASE; LOWER PROPORTION OF LABOR FORCE AGES 50–64
PeruDisease Burden (YLDs)
% Of Labor Force
Figure 8 Share of Workforce Ages 50–64 and Burden of Disease, All 18 Countries, 2030
Source: ILO (2015).
15
Table 1 Disability Weights and Absenteeism and Presenteeism Assumptions, 12 Countries
Disease Disability weight
Percent productivity loss due to absenteeism
per employee per year
Percent productivity loss due to presenteeism per
employee per year
Ischemic heart disease 0.13013 2.8 6.8
Ischemic stroke 0.30300 2.8 6.8
Hemorrhagic and other non-ischemic stroke 0.30300 2.8 6.8
Diabetes mellitus 0.09463 0.8 11.4
Chronic obstructive pulmonary disease 0.19667 6.1 17.2
Asthma 0.05600 5.0 11.0
Migraine 0.43300 4.5 20.5
Tension-type headache 0.04000 4.5 20.5
Major depressive disorder 0.23000 10.7 15.3
Dysthymia 0.11000 10.7 15.3
Osteoarthritis 0.09100 2.5 11.2
Rheumatoid arthritis 0.33733 2.5 11.2
Neoplasm 0.32150 7.0 8.5
Sources: Murray et al. (2015), Salomon et al. (2012), and Goetzel et al. (2004).
productivity at work. For this, estimates by Goetzel et al. (2004) on productivity loss due to absenteeism and presenteeism by disease were fitted to the disease categories used in the modeling (Table 1). An extensive review of the literature in the various countries on these issues has been conducted for this project, but no better source of such estimates has yet been identified.
Multiplying the GDP per person in the labor force estimates by the loss in productivity from a disease gives the estimated reduction in GDP per person attributable to a particular disease. Multiplying this by the prevalence in the labor force of that disease gives an estimate of the annual loss in GDP from that disease.
Interpreting the estimates
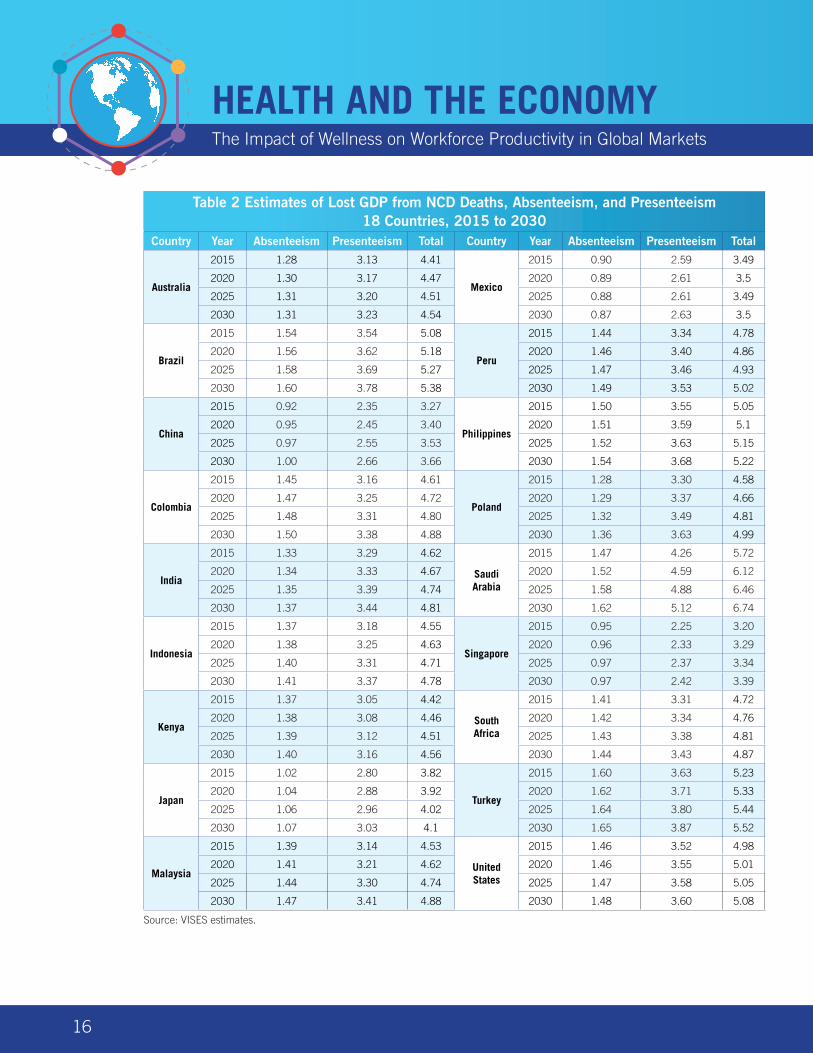
The overall estimates of the GDP losses arising from deaths (from 2010 onward) and from absenteeism and presenteeism from the prevalence of NCDs in the actual and potential workforce are summarized in Table 2. Table 2 shows the total estimated costs as a share of GDP for each country, at five-year intervals over 2010–2030.
In interpreting these estimates, it is important to note that they primarily reflect the pattern of ageing of the population of labor force age in the various countries, and the level of age-standardized NCD mortality and nonfatal prevalence rates in 2010. In countries such as Japan, where ageing is well advanced and 2010 mortality and prevalence rates are relatively high, the current cost is already high and the future growth in cost more limited. This in part reflects the fact that many of the costs of the interaction of ageing and NCDs are felt beyond the years of labor force age.
HEALTH AND THE ECONOMYThe Impact of Wellness on Workforce Productivity in Global Markets
16
Table 2 Estimates of Lost GDP from NCD Deaths, Absenteeism, and Presenteeism 18 Countries, 2015 to 2030
Country Year Absenteeism Presenteeism Total Country Year Absenteeism Presenteeism Total
Australia
2015 1.28 3.13 4.41
Mexico
2015 0.90 2.59 3.49
2020 1.30 3.17 4.47 2020 0.89 2.61 3.5
2025 1.31 3.20 4.51 2025 0.88 2.61 3.49
2030 1.31 3.23 4.54 2030 0.87 2.63 3.5
Brazil
2015 1.54 3.54 5.08
Peru
2015 1.44 3.34 4.78
2020 1.56 3.62 5.18 2020 1.46 3.40 4.86
2025 1.58 3.69 5.27 2025 1.47 3.46 4.93
2030 1.60 3.78 5.38 2030 1.49 3.53 5.02
China
2015 0.92 2.35 3.27
Philippines
2015 1.50 3.55 5.05
2020 0.95 2.45 3.40 2020 1.51 3.59 5.1
2025 0.97 2.55 3.53 2025 1.52 3.63 5.15
2030 1.00 2.66 3.66 2030 1.54 3.68 5.22
Colombia
2015 1.45 3.16 4.61
Poland
2015 1.28 3.30 4.58
2020 1.47 3.25 4.72 2020 1.29 3.37 4.66
2025 1.48 3.31 4.80 2025 1.32 3.49 4.81
2030 1.50 3.38 4.88 2030 1.36 3.63 4.99
India
2015 1.33 3.29 4.62
Saudi Arabia
2015 1.47 4.26 5.72
2020 1.34 3.33 4.67 2020 1.52 4.59 6.12
2025 1.35 3.39 4.74 2025 1.58 4.88 6.46
2030 1.37 3.44 4.81 2030 1.62 5.12 6.74
Indonesia
2015 1.37 3.18 4.55
Singapore
2015 0.95 2.25 3.20
2020 1.38 3.25 4.63 2020 0.96 2.33 3.29
2025 1.40 3.31 4.71 2025 0.97 2.37 3.34
2030 1.41 3.37 4.78 2030 0.97 2.42 3.39
Kenya
2015 1.37 3.05 4.42
South Africa
2015 1.41 3.31 4.72
2020 1.38 3.08 4.46 2020 1.42 3.34 4.76
2025 1.39 3.12 4.51 2025 1.43 3.38 4.81
2030 1.40 3.16 4.56 2030 1.44 3.43 4.87
Japan
2015 1.02 2.80 3.82
Turkey
2015 1.60 3.63 5.23
2020 1.04 2.88 3.92 2020 1.62 3.71 5.33
2025 1.06 2.96 4.02 2025 1.64 3.80 5.44
2030 1.07 3.03 4.1 2030 1.65 3.87 5.52
Malaysia
2015 1.39 3.14 4.53
United States
2015 1.46 3.52 4.98
2020 1.41 3.21 4.62 2020 1.46 3.55 5.01
2025 1.44 3.30 4.74 2025 1.47 3.58 5.05
2030 1.47 3.41 4.88 2030 1.48 3.60 5.08
Source: VISES estimates.
17
The results in Table 2 show that presenteeism, reflecting workers who still get to work but perform poorly due to ill health, imposes on average more than twice the cost of absenteeism. Countries with high costs from absenteeism and presenteeism include Turkey, Brazil, the Philippines, Saudi Arabia, and the United States. China, Mexico, and Singapore have relatively low rates of GDP loss.
Impact of Ill Health on the Ability to Work
Ill health prevents some people from working, and others are restricted in the amount of work they can undertake. In developed countries, such as the United States and Australia, well-developed systems are in place for both recognizing the impact of ill health on the ability to work and providing income support commensurate with the level of disability. Most developing countries also have systems and processes for identifying and supporting those in need owing to ill health, but they are more restrictive than systems available in the developed countries.
Rasmussen et al. (2015a, 2015b) provide a discussion of the different definitions of disability adopted by different countries and their impact on the estimated size of the disabled populations. Overall, the implications of these different definitions have been to underreport the size of disabled populations in many developing countries. The methodology adjusts for these differences using the results of the Global Burden of Disease study referred to earlier in this report.
The Economic Loss Due to Early Retirement
The best data about the behavior of early retirees are from two surveys conducted in Australia: the Survey of Disability, Ageing and Carers (SDAC) and the Retirement and Retirement Intentions survey. The SDAC provides details about those with disability by age, their sources of income, and the extent of their disability. From this we gain a lot of information about the prevalence of disability by degree of impairment by age. The Retirement and Retirement Intentions survey provides data by age about the reasons for retirement, including ill health. To the extent that we have been able to cross-reference this against U.S. data, the key parameters seem to be similar. In addition, we have obtained unpublished data about Australian disability pension recipients.
Our modeling assumes that the decision to retire due to ill health is based on the impact of the relative morbidity of the 50–64 age group, measured in DALYs, in each of the selected countries.
Very little data are available from the relevant countries with the necessary detail to model economic loss, so we used parameters drawn from the Australian data, which we adjusted where we could to the circumstances of the particular selected country. For instance, in arriving at the proportion of the population ages 50–64 who were disabled according to the international WHO/World Bank definition, we used the Australian proportion (the U.S. proportion was very similar) adjusted for country-specific disease burden sourced from the Global Burden of Disease study.
HEALTH AND THE ECONOMYThe Impact of Wellness on Workforce Productivity in Global Markets
18
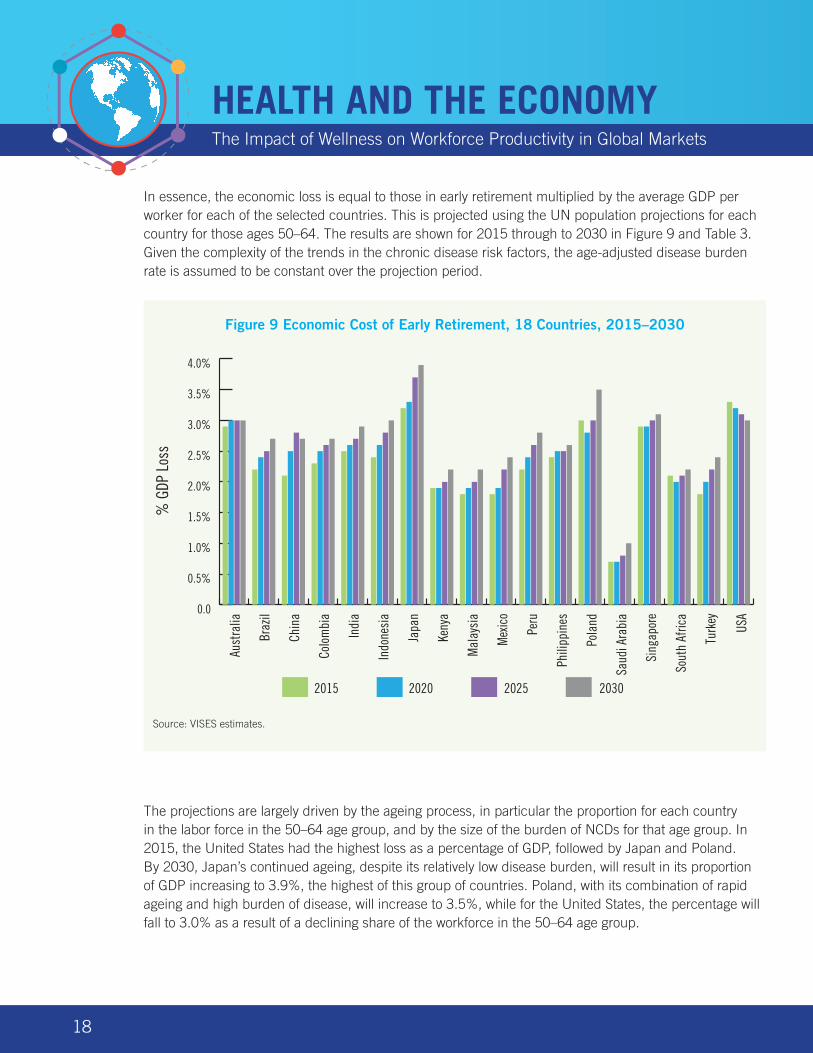
In essence, the economic loss is equal to those in early retirement multiplied by the average GDP per worker for each of the selected countries. This is projected using the UN population projections for each country for those ages 50–64. The results are shown for 2015 through to 2030 in Figure 9 and Table 3. Given the complexity of the trends in the chronic disease risk factors, the age-adjusted disease burden rate is assumed to be constant over the projection period.
The projections are largely driven by the ageing process, in particular the proportion for each country in the labor force in the 50–64 age group, and by the size of the burden of NCDs for that age group. In 2015, the United States had the highest loss as a percentage of GDP, followed by Japan and Poland. By 2030, Japan’s continued ageing, despite its relatively low disease burden, will result in its proportion of GDP increasing to 3.9%, the highest of this group of countries. Poland, with its combination of rapid ageing and high burden of disease, will increase to 3.5%, while for the United States, the percentage will fall to 3.0% as a result of a declining share of the workforce in the 50–64 age group.
0.0
0.5%
1.0%
1.5%
2.0%
2.5%
3.0%
3.5%
4.0%
Aust
ralia
Braz
il
Chin
a
Colo
mbi
a
Indi
a
Indo
nesi
a
Japa
n
Keny
a
Mal
aysi
a
Mex
ico
Peru
Phili
ppin
es
Pola
nd
Saud
i Ara
bia
Sing
apor
e
Sout
h Af
rica
Turk
ey
USA
2015 2020 20302025
% G
DP L
oss
Source: VISES estimates.
Figure 9 Economic Cost of Early Retirement, 18 Countries, 2015–2030
19
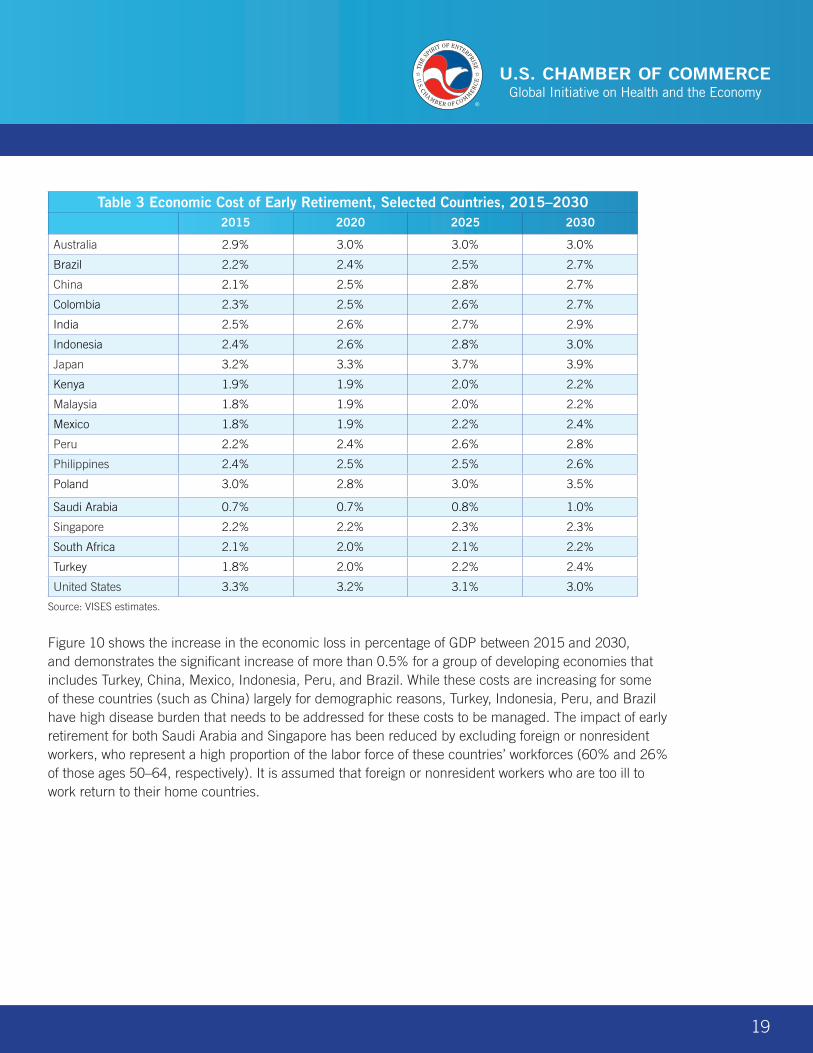
Table 3 Economic Cost of Early Retirement, Selected Countries, 2015–20302015 2020 2025 2030
Australia 2.9% 3.0% 3.0% 3.0%
Brazil 2.2% 2.4% 2.5% 2.7%
China 2.1% 2.5% 2.8% 2.7%
Colombia 2.3% 2.5% 2.6% 2.7%
India 2.5% 2.6% 2.7% 2.9%
Indonesia 2.4% 2.6% 2.8% 3.0%
Japan 3.2% 3.3% 3.7% 3.9%
Kenya 1.9% 1.9% 2.0% 2.2%
Malaysia 1.8% 1.9% 2.0% 2.2%
Mexico 1.8% 1.9% 2.2% 2.4%
Peru 2.2% 2.4% 2.6% 2.8%
Philippines 2.4% 2.5% 2.5% 2.6%
Poland 3.0% 2.8% 3.0% 3.5%
Saudi Arabia 0.7% 0.7% 0.8% 1.0%
Singapore 2.2% 2.2% 2.3% 2.3%
South Africa 2.1% 2.0% 2.1% 2.2%
Turkey 1.8% 2.0% 2.2% 2.4%
United States 3.3% 3.2% 3.1% 3.0%
Source: VISES estimates.
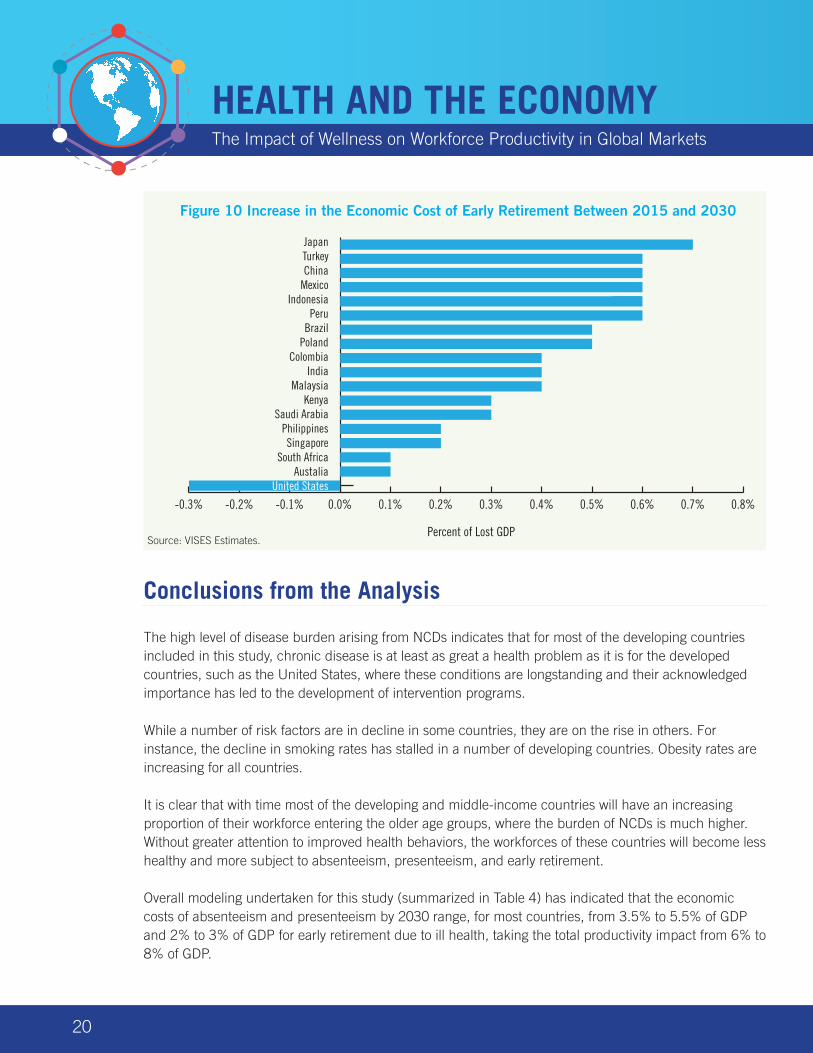
Figure 10 shows the increase in the economic loss in percentage of GDP between 2015 and 2030, and demonstrates the significant increase of more than 0.5% for a group of developing economies that includes Turkey, China, Mexico, Indonesia, Peru, and Brazil. While these costs are increasing for some of these countries (such as China) largely for demographic reasons, Turkey, Indonesia, Peru, and Brazil have high disease burden that needs to be addressed for these costs to be managed. The impact of early retirement for both Saudi Arabia and Singapore has been reduced by excluding foreign or nonresident workers, who represent a high proportion of the labor force of these countries’ workforces (60% and 26% of those ages 50–64, respectively). It is assumed that foreign or nonresident workers who are too ill to work return to their home countries.
HEALTH AND THE ECONOMYThe Impact of Wellness on Workforce Productivity in Global Markets
20
Conclusions from the Analysis
The high level of disease burden arising from NCDs indicates that for most of the developing countries included in this study, chronic disease is at least as great a health problem as it is for the developed countries, such as the United States, where these conditions are longstanding and their acknowledged importance has led to the development of intervention programs.
While a number of risk factors are in decline in some countries, they are on the rise in others. For instance, the decline in smoking rates has stalled in a number of developing countries. Obesity rates are increasing for all countries.
It is clear that with time most of the developing and middle-income countries will have an increasing proportion of their workforce entering the older age groups, where the burden of NCDs is much higher. Without greater attention to improved health behaviors, the workforces of these countries will become less healthy and more subject to absenteeism, presenteeism, and early retirement.
Overall modeling undertaken for this study (summarized in Table 4) has indicated that the economic costs of absenteeism and presenteeism by 2030 range, for most countries, from 3.5% to 5.5% of GDP and 2% to 3% of GDP for early retirement due to ill health, taking the total productivity impact from 6% to 8% of GDP.
-0.3% -0.2% -0.1% 0.0% 0.1% 0.2% 0.3% 0.4% 0.5% 0.6% 0.7% 0.8%
JapanTurkeyChina
MexicoIndonesia
PeruBrazil
PolandColombia
IndiaMalaysia
KenyaSaudi Arabia
PhilippinesSingapore
South AfricaAustalia
United States
Percent of Lost GDP
Figure 10 Increase in the Economic Cost of Early Retirement Between 2015 and 2030
Source: VISES Estimates.
21
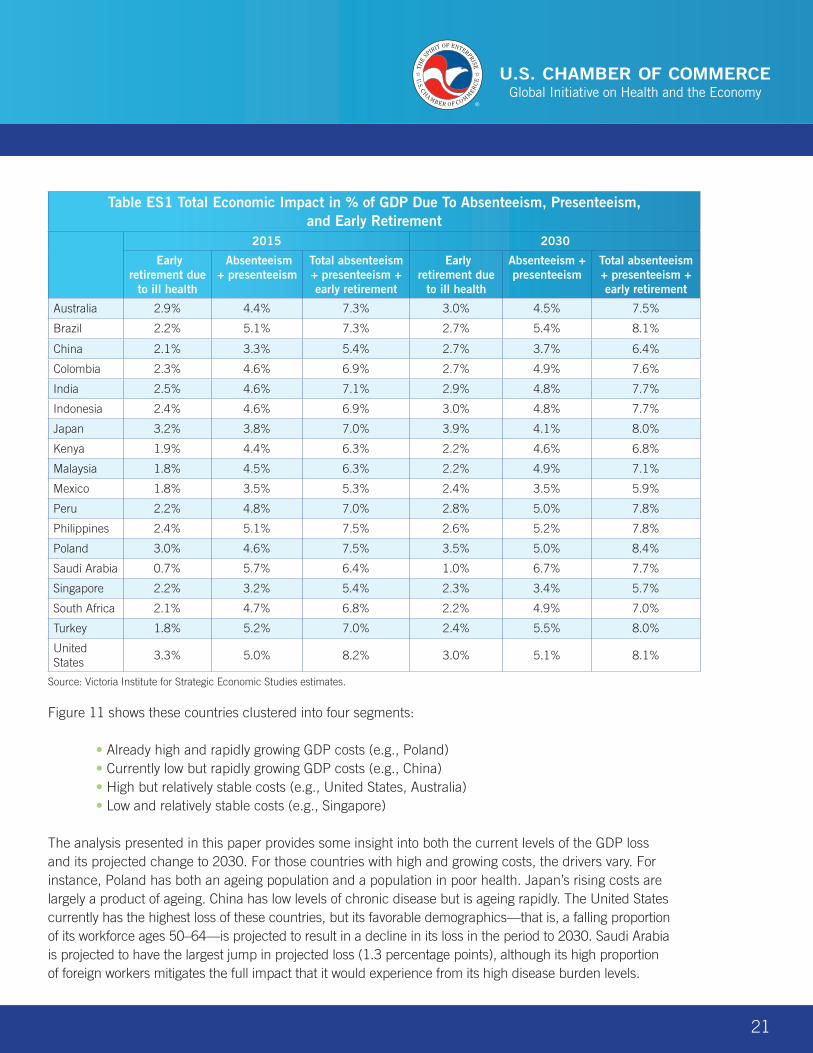
Table ES1 Total Economic Impact in % of GDP Due To Absenteeism, Presenteeism, and Early Retirement
2015 2030
Early retirement due
to ill health
Absenteeism + presenteeism
Total absenteeism + presenteeism + early retirement
Early retirement due
to ill health
Absenteeism + presenteeism
Total absenteeism + presenteeism + early retirement
Australia 2.9% 4.4% 7.3% 3.0% 4.5% 7.5%
Brazil 2.2% 5.1% 7.3% 2.7% 5.4% 8.1%
China 2.1% 3.3% 5.4% 2.7% 3.7% 6.4%
Colombia 2.3% 4.6% 6.9% 2.7% 4.9% 7.6%
India 2.5% 4.6% 7.1% 2.9% 4.8% 7.7%
Indonesia 2.4% 4.6% 6.9% 3.0% 4.8% 7.7%
Japan 3.2% 3.8% 7.0% 3.9% 4.1% 8.0%
Kenya 1.9% 4.4% 6.3% 2.2% 4.6% 6.8%
Malaysia 1.8% 4.5% 6.3% 2.2% 4.9% 7.1%
Mexico 1.8% 3.5% 5.3% 2.4% 3.5% 5.9%
Peru 2.2% 4.8% 7.0% 2.8% 5.0% 7.8%
Philippines 2.4% 5.1% 7.5% 2.6% 5.2% 7.8%
Poland 3.0% 4.6% 7.5% 3.5% 5.0% 8.4%
Saudi Arabia 0.7% 5.7% 6.4% 1.0% 6.7% 7.7%
Singapore 2.2% 3.2% 5.4% 2.3% 3.4% 5.7%
South Africa 2.1% 4.7% 6.8% 2.2% 4.9% 7.0%
Turkey 1.8% 5.2% 7.0% 2.4% 5.5% 8.0%
United States
3.3% 5.0% 8.2% 3.0% 5.1% 8.1%
Source: Victoria Institute for Strategic Economic Studies estimates.
Figure 11 shows these countries clustered into four segments:
• Already high and rapidly growing GDP costs (e.g., Poland) • Currently low but rapidly growing GDP costs (e.g., China) • High but relatively stable costs (e.g., United States, Australia) • Low and relatively stable costs (e.g., Singapore)
The analysis presented in this paper provides some insight into both the current levels of the GDP loss and its projected change to 2030. For those countries with high and growing costs, the drivers vary. For instance, Poland has both an ageing population and a population in poor health. Japan’s rising costs are largely a product of ageing. China has low levels of chronic disease but is ageing rapidly. The United States currently has the highest loss of these countries, but its favorable demographics—that is, a falling proportion of its workforce ages 50–64—is projected to result in a decline in its loss in the period to 2030. Saudi Arabia is projected to have the largest jump in projected loss (1.3 percentage points), although its high proportion of foreign workers mitigates the full impact that it would experience from its high disease burden levels.
HEALTH AND THE ECONOMYThe Impact of Wellness on Workforce Productivity in Global Markets
22
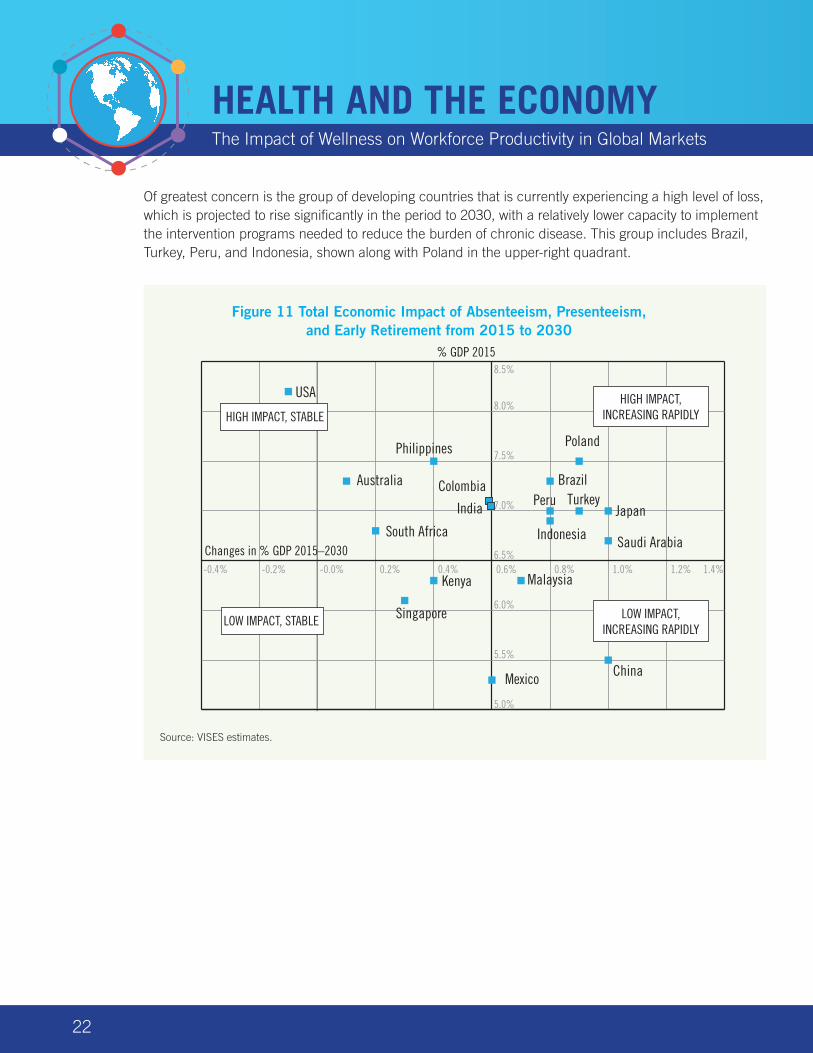
Of greatest concern is the group of developing countries that is currently experiencing a high level of loss, which is projected to rise significantly in the period to 2030, with a relatively lower capacity to implement the intervention programs needed to reduce the burden of chronic disease. This group includes Brazil, Turkey, Peru, and Indonesia, shown along with Poland in the upper-right quadrant.
Australia Brazil
China
Colombia
Kenya
Mexico
Peru
Poland
Saudi Arabia
Turkey
USA
-0.4% -0.2% -0.0% 0.2% 0.4% 0.6% 0.8% 1.0% 1.2% 1.4%
5.0%
5.5%
6.0%
6.5%
7.0%
7.5%
8.0%
8.5%
HIGH IMPACT, STABLE
LOW IMPACT, STABLE
HIGH IMPACT, INCREASING RAPIDLY
LOW IMPACT, INCREASING RAPIDLY
% GDP 2015
Changes in % GDP 2015–2030-0.4% -0.2% -0.0% 0.2% 0.4% 0.6% 0.8% 1.0% 1.2% 1.4%
Japan
Indonesia
Malaysia
South Africa
Philippines
India
Singapore
Figure 11 Total Economic Impact of Absenteeism, Presenteeism, and Early Retirement from 2015 to 2030
Source: VISES estimates.
23
References
Goetzel, R.Z. et al., 2004, “Health, absence, disability, and presenteeism cost estimates of certain physical and mental health conditions affecting U.S. employers,” Journal of Occupational and Environmental Medicine, vol. 46, no. 4, pp. 398–412.
Institute of Health Metrics and Evaluation (IHME), 2015, “GBD data,” Seattle, WA, at http://www.healthdata.org/gbd/data
International Labour Organization (ILO), 2015, ILOSTAT Database, Geneva, at http://www.ilo.org/ilostat/faces/home/statisticaldata/bulk-download?_adf.ctrl-state=16g1j32hwt_4&clean=true&_afrLoop=477715768788438
Murray, C.J.L. et al., 2015, “Global, regional, and national disability-adjusted life years (DALYs) for 306 diseases and injuries and healthy life expectancy (HALE) for 188 countries, 1990–2013: Quantifying the epidemiological transition,” The Lancet, August 26, DOI: http://dx.doi.org/10.1016/S0140-6736(15)61340-X
Rasmussen, B., Sweeny, K., and Sheehan, P., 2015a, Cost of Early Retirement Due to Ill Health: Phase II Countries, Report to the APEC Business Advisory Council and U.S. Chamber of Commerce, VISES, Melbourne, October.
Rasmussen, B., Sweeny, K., and Sheehan, P., 2015b, Cost of Early Retirement Due to Ill Health, Report to the APEC Business Advisory Council and U.S. Chamber of Commerce, VISES, Melbourne, July.
Salomon, J.A. et al., 2012, “Common values in assessing health outcomes from disease and injury: Disability weights measurement study for the Global Burden of Disease Study 2010,” The Lancet, vol. 380, pp. 2129–2143.
Sheehan, P., Rasmussen, B., and Sweeny, K., 2014, The Impact of Health on Worker Attendance and Productivity in the APEC Region, Report to the APEC Business Advisory Council, VISES, Melbourne, July, at http://www.vises.org.au/documents/2014_VISES_Impact_of_Health_on_Productivity.pdf
Sweeny, K., Rasmussen, B., and Sheehan, P., 2015, The Impact of Health on Worker Attendance and Productivity in Twelve Countries, Report to the APEC Business Advisory Council and U.S. Chamber of Commerce, VISES, Melbourne, October.
United Nations, 2015, “World population prospects: The 2015 revision,” Department of Economic and Social Affairs, Population Division, Populations Estimates and Projections Section, New York, at http://esa.un.org/unpd/wpp/Download/Standard/Population/

HEALTH AND THE ECONOMYThe Impact of Wellness on Workforce Productivity in Global Markets
24
About the Author
Professor Bruce RasmussenBEc (Hons) La Trobe, MEc La Trobe, MPA Harvard, PhD VUDirector, Victoria Institute of Strategic Economic Studies
Professor Rasmussen is Director of Victoria Institute of Strategic Economic Studies (VISES), having joined the Institute in 1998.
His work has focused on innovation, business models, business strategy, and industry development issues. His most recent work has been on health and productivity and the economic returns to investment in health for the U.S. Chamber of Commerce, WHO, and UNFPA.
Professor Rasmussen has had a career spanning the senior levels of both the public and private sectors. In government he has held a number of senior positions, most significantly as Assistant Director General, Finance in the Department of Management and Budget of the State of Victoria.
He spent seven years at the ANZ Bank, where he held various senior business strategy roles, most notably as Chief Manager, Retail Strategy in the Retail Bank and Chief Manager, Development of the Private Bank.
In 2008 Professor Rasmussen completed a health study on The Creation and Capture of Value in Biopharmaceuticals which is being published as a book by Edward Elgar (2010).
He holds a Master of Public Administration (MPA) from the Kennedy School of Government at Harvard University, where he graduated as a Littauer Fellow - awarded on the basis of academic excellence, career, and leadership.

25

U.S. Chamber of Commerce1615 H Street, NW | Washington, DC 20062-2000
www.uschamber.com