the impact of video compression on remote cardiac pulse...
TRANSCRIPT

The Impact of Video Compression on Remote Cardiac PulseMeasurement Using Imaging Photoplethysmography
Daniel J. McDuff1, Ethan B. Blackford2, and Justin R. Estepp3
1 Microsoft Research, Redmond, WA, USA. ([email protected])2 Ball Aerospace, Fairborn, OH, USA. ([email protected])
3 711th Human Performance Wing, US Air Force Research Laboratory, Wright-Patterson AFB, OH, USA.([email protected])
Abstract— Remote physiological measurement has great po-tential in healthcare and affective computing applications. Imag-ing photoplethysmography (iPPG) leverages digital cameras torecover the blood volume pulse from the human body. Whilethe impact of video parameters such as resolution and framerate on iPPG accuracy have been studied, there has not beena systematic analysis of video compression algorithms. Wecompared a set of commonly used video compression algorithms(x264 and x265) and varied the Constant Rate Factor (CRF)to measure pulse rate recovery for a range of bit rates (filesizes) and video qualities. We found that compression, even ata low CRF, degrades the blood volume pulse (BVP) signal-to-noise ratio considerably. However, the bit rate of a video canbe substantially decreased (by a factor of over 1000) withoutdestroying the BVP signal entirely. We found an approximatelylinear relationship between bit rate and BVP signal-to-noiseratio up to a CRF of 36. A faster decrease in SNR was observedfor videos of the task involving larger head motions and thex265 algorithm appeared to work more effectively in these cases.
I. INTRODUCTION
Remote measurement of physiological signals has a numberof advantages over traditional contact methods. It allows themeasurement of vital signals unobtrusively and concomitantly.In recent years, a number of approaches for imaging-basedmeasurement of physiology using digital cameras have beenproposed. Imaging photoplethysmography (iPPG) capturesvariations in light reflected from the body due to bloodvolume changes in microvascular tissue [1]. Verkruysse etal. [2] demonstrated that sub-pixel variations in color channelmeasurements from a digital single lens reflex (DSLR)camera, when aggregated, could be used to recover the bloodvolume pulse. Subsequently, researchers have shown thatiPPG methods can allow accurate measurement of heartrate [3], heart rate variability [4], breathing rate [4], bloodoxygenation [5] and pulse transit time [6]. McDuff et al. [7]provide a comprehensive survey of approaches to iPPG.
A number of parameters influence the accuracy of iPPGmeasurements. These include the imager quality [8], and theframe rate and resolution of the images [9]. Sun et al. [8]compared remote physiological measurement using a low costwebcam and a high-speed color CMOS and showed similarsignals were captured from both cameras, further supportingthat iPPG is a practical method for scalable applications
This work was supported by the Air Force Office of Scientific Researchtask# 14RH07COR, ’Non-Contact Cardiovascular Sensing and Assessment’.
Fig. 1. We present a systematic analysis of the impact of video compressionon physiological measurements via image photoplethysmography. Wecompare compression types and levels on over four hours of video fromtwenty-five participants performing stationary and random head motion tasks.
such as telemedicine. Blackford and Estepp [9] found thatreducing frame rate from 120Hz to 30Hz and/or reducingimage resolution from 658x492 pixels to 329x246 pixels hadlittle impact on the accuracy of pulse rate measurements.Video compression is an important parameter that has notbeen systematically studied with regard to iPPG.
There are a number of methods for video compressionthat aim to reduce the bit rate whilst retaining the importantinformation within a video. However, video compressionalgorithms are not designed with the intention of preservingphotoplethysmographic data. On the contrary often compres-sion algorithms make assumptions that small changes in pixelvalues between frames are not of high visual importance anddiscard them, influencing the underlying variations on whichiPPG methods rely. We present a comparison of iPPG bloodvolume pulse (BVP) signal-to-noise ratios and pulse rate (PR)measurements from videos compressed using popular current

and next-generation codecs (x264 and x265).In real-life applications motion tolerance of iPPG mea-
surement is likely to be important. Previous work hasproposed methods for reducing motion artifacts in iPPGmeasurements [10], [11], [12], [13], [14], [15], [16]. Due tothe nature of inter-frame compression, compression is likelyto have different impacts on physiological signal recoverydepending on the level of head motion. Therefore, we evaluateresults on videos for stationary and motion tasks.
Finding compression configurations that preserve valuablephysiological data would allow new applications for iPPGmeasurement. For example, methods used for video record-ing/streaming through a web browser in video conferencingcould be adapted to preserve iPPG data for analysis as partof a telehealth system. Additionally, alleviating the burdenof storing raw video could enable sharing research datasets.
We analyzed a large dataset of uncompressed, raw videoswith both stationary subjects and random head motions [13]in order to test the impact of video compression on theaccuracy of remote physiological measurements. Participants(n=25) engaged in two, 5-minute tasks and were recordedusing an array of cameras. Gold-standard electrocardiogram(ECG) measurements were captured alongside contact PPGmeasurements from the finger-tip. Figure 1 shows a summaryof our study and examples of frames from the two tasks.
II. BACKGROUND
A. Video Compression
Raw video requires enormous amounts of storage; forexample, each raw, uncompressed 5.5-minute video filecollected in this study was 11.9 GiB in size. Collecting datafrom multiple cameras (9), numerous trials (12), and subjects(n=25) resulted in a total size of 31.50 TiB for the 247.5hours of standard definition video. The inherently large sizeof raw video make its use infeasible outside of research andarchival video storage. Herein we seek to better understandthe trade offs related to iPPG derived measurements madefrom videos with varying levels of compression. The results ofthis evaluation will inform the final dataset which is plannedto be made available to researchers working in this area.
Owing to the large file sizes imposed by raw video,compression is an essential element of almost every videosystem. Video encoding schemes typically employ similarmethods in order to reduce the amount of data requiredto store or transmit video. Increasing the complexity ofsuch methods improves coding efficiency and relies onadvances in computational resources to allow the video to bedecoded. These methods may be lossless and utilize principlesof information theory to reduce data rates while allowingidentical reproduction of the source video or lossy and discardless visually important information. Some of these methodsinclude color space conversions, reducing inter-frame andintra-frame (motion) redundancy, and entropy coding of thedata to produce an efficient binary representation.
Video is typically recorded from image sensors outfittedwith a red, green, blue Bayer color filter array, where eachpixel records light transmitted through a single filter. The
resulting image may then be interpolated to derive a fullcolor image with RGB values for each location, increasingthe amount of data by a factor of three. Alternatively,images may be stored using alternate colorspaces, suchas YUV. The YUV colorspace represents data as a singleluma (Y), or achromatic brightness, component and twochrominance components, U/Cb and V/Cr representing blue-luma and red-luma differences, respectively. A popular useof the YUV colorspace, YUV420p, capitalizes on the visualsystem’s greater perception of luminance differences overcolor or chrominance differences. Each image pixel locationis represented by a luminance value while the chrominancevalues are subsampled every other row and column. As aresult, a given block of 4 pixels requires 6 bytes of data(12bits/pixel) in the YUV420p colorspace rather than 12bytes (24bits/pixel) in the RGB colorspace.
Intra-frame or image compression methods reduce spatialredundancy/correlation within the image. To do so, the imageis subdivided into groups of pixels, sometimes referred to asmacroblocks or coding units. Larger and more complicatedblock compositions can provide better visual appearance andgreater coding efficiency at the expense of additional compu-tational complexity. The blocks are then transformed fromthe spatial domain, often using the discrete cosine transform(DCT). The DCT is then divided by a quantization matrixand rounded. This process eliminates smaller coefficients andgreatly reduces the number of values required to express theimage. This process is also used in JPEG image coding.
Similarly, inter-frame compression reduces temporal redun-dancy/correlation between successive images in a group ofpictures (GOP). A reference, I-frame (intra-) is encoded inde-pendently using intra-frame compression, as described above,and requires the most data to express. Between I-frames are P-frames (predicted), and B-frames (bi-directionally predicted).P-Frames require less data to express and consist of motionvectors describing changes from previous I- or P-frames. B-frames require the least amount of data and describe motionvectors using both past and future frames. The difference,or residual, between predicted frames and original framesare then transformed and quantized. This process reduces thecoding for regions of little to no change between frames.
More advanced encoding schemes rely on more sophisti-cated techniques for determining I-, P-, and B-frames, theirorder and frequency for more efficient encoding via greatercomplexity. Similarly, adaptive quantizers, such as a constantrate factor (CRF) may be used to maintain video qualityacross frames with different amounts of motion content andimage complexity. Finally, inter- and intra- frame compressionare utilized in tandem for even greater efficiency.
B. Consequences of Compression for iPPG Signal Recovery
Various stages of video compression are likely to havedetrimental effects on iPPG measurements. For example, thechroma subsampling to the YUV colorspace reduces thenumber of samples used to represent chromaticity, wherethe BVP predominately resides [17]. Furthermore, the BVPis an imperceptible color change that often occurs at sub-
noise levels for individual pixels and may be only measuredafter averaging over a region. An otherwise imperceptiblechange in the video, such as this, could easily be deterioratedor eliminated by spatial or motion compression. That is,relatively spatially-homogeneous regions may be quantizedjointly. This will limit the subsequent benefits derived fromaveraging across regions, as frequently performed in iPPGsignal processing. Additionally, the time-evolution of theBVP may be quantized and discarded as it is an otherwiseimperceptible change between video frames. Given thesepotential effects, it is important to understand the potentialconsequence of video compression on iPPG measurements.
C. Video Compression Standards
Numerous and varied codecs exist implementing variationsof the methods described above. Some of the most popularhave been developed as standards of the Moving PictureExperts Group (MPEG) and International TelecommunicationUnion Telecommunication Standardization Sector (ITU-T).These include MPEG-2 Part 2/H.262, utilized for DVD videoand over-the-air, digital-TV broadcasts [18]. MPEG-4 Part 10,AVC/H.264 a current-generation standard, utilized by Blu-rayvideo and various high definition (HD) video providers, whichachieved an approximate doubling in encoding efficiencyover H.262 and enabled network video streaming [19], [20].Finally, next-generation standards such as MPEG-H Part 2,HEVC/H.265 utilize increasingly complex encoding strategiesfor an approximate doubling in encoding efficiency overH.264 [21], [22]. H.265 is designed to handle ultra-highdefinition video and provide improved mobile and Internetvideo streaming. Other next-generation standards, have similarefficiency goals and employ analogous techniques to achievethem. Other standards vying for the role of leading nextgeneration codec include VP9 and its successor AV1, bothopen source and royalty free.
Modern video coding standards typically represent acompressed video format and the necessary operations todecode a compliant video. This ensures a uniform output froma given video while providing flexibility in the operations andcompression methods used. Various frameworks may then beused to generate compressed videos.
D. Codec Evaluations
Various groups have published systematic evaluations ofvideo codecs within the three-dimensional trade-off spaceof encoding efficiency, video quality, and computationalcomplexity. Encoding efficiency is typically assessed usingaverage bit rate. Computational complexity is typically as-sessed using a benchmark processing time. The gold standardfor video quality is human subjective perception assessed bya Mean Opinion Score (MOS). Alternatively, video qualitymay be assessed using one of numerous automated metricsincluding Peak Signal-to-Noise Ratio (PSNR), Multi-ScaleStructural Similarity (MS-SIM), and PSNR with contrastMasking of DCT basis functions based on the HumanVisual System (PSNR-HVS-M). PSNR-HVS-M adapts PSNRmeasurements with a contrast sensitivity function which takes
θ =20°
Participant
Background
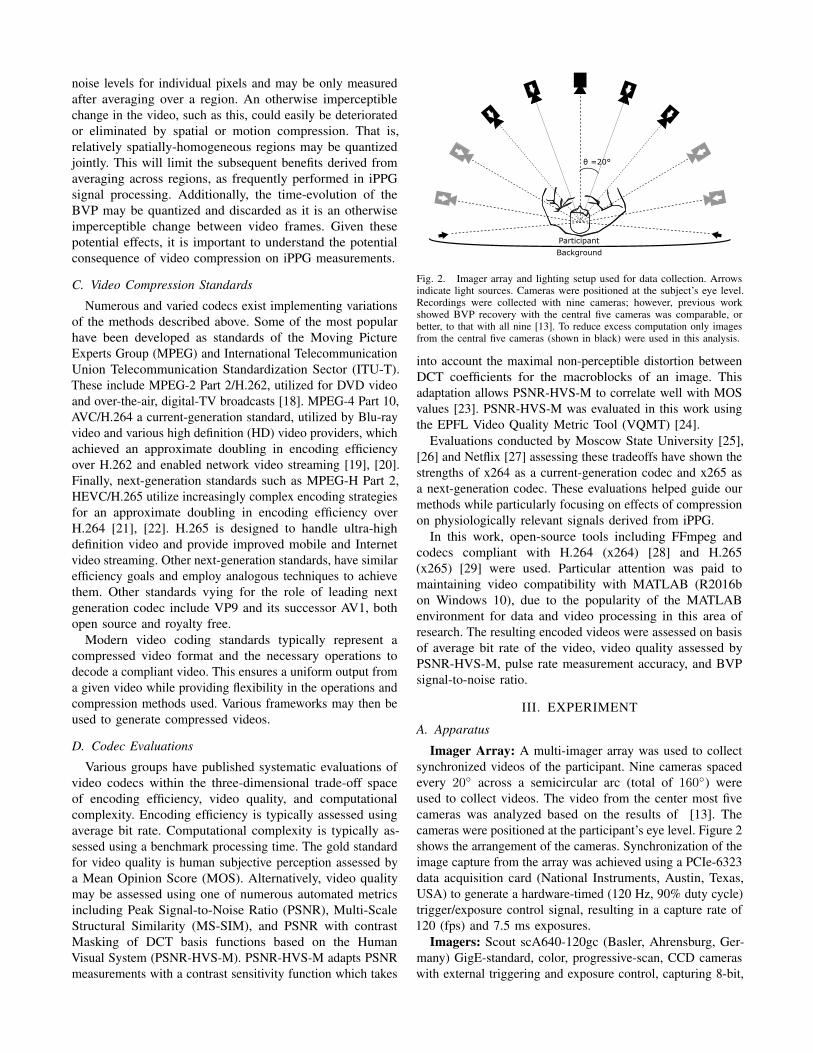
Fig. 2. Imager array and lighting setup used for data collection. Arrowsindicate light sources. Cameras were positioned at the subject’s eye level.Recordings were collected with nine cameras; however, previous workshowed BVP recovery with the central five cameras was comparable, orbetter, to that with all nine [13]. To reduce excess computation only imagesfrom the central five cameras (shown in black) were used in this analysis.
into account the maximal non-perceptible distortion betweenDCT coefficients for the macroblocks of an image. Thisadaptation allows PSNR-HVS-M to correlate well with MOSvalues [23]. PSNR-HVS-M was evaluated in this work usingthe EPFL Video Quality Metric Tool (VQMT) [24].
Evaluations conducted by Moscow State University [25],[26] and Netflix [27] assessing these tradeoffs have shown thestrengths of x264 as a current-generation codec and x265 asa next-generation codec. These evaluations helped guide ourmethods while particularly focusing on effects of compressionon physiologically relevant signals derived from iPPG.
In this work, open-source tools including FFmpeg andcodecs compliant with H.264 (x264) [28] and H.265(x265) [29] were used. Particular attention was paid tomaintaining video compatibility with MATLAB (R2016bon Windows 10), due to the popularity of the MATLABenvironment for data and video processing in this area ofresearch. The resulting encoded videos were assessed on basisof average bit rate of the video, video quality assessed byPSNR-HVS-M, pulse rate measurement accuracy, and BVPsignal-to-noise ratio.
III. EXPERIMENT
A. Apparatus
Imager Array: A multi-imager array was used to collectsynchronized videos of the participant. Nine cameras spacedevery 20◦ across a semicircular arc (total of 160◦) wereused to collect videos. The video from the center most fivecameras was analyzed based on the results of [13]. Thecameras were positioned at the participant’s eye level. Figure 2shows the arrangement of the cameras. Synchronization of theimage capture from the array was achieved using a PCIe-6323data acquisition card (National Instruments, Austin, Texas,USA) to generate a hardware-timed (120 Hz, 90% duty cycle)trigger/exposure control signal, resulting in a capture rate of120 (fps) and 7.5 ms exposures.
Imagers: Scout scA640-120gc (Basler, Ahrensburg, Ger-many) GigE-standard, color, progressive-scan, CCD cameraswith external triggering and exposure control, capturing 8-bit,
658x492 pixel, raw BG Bayer-format images were used forvideo capture. The imagers were equipped with 16 mm fixedfocal length lenses (HF16HA-1B, Fujinion, Tokyo, Japan) tomaximize the area of the participant’s face in each frame.
Lighting: Experimental lighting was provided by 10SoLux, full color spectrum (5000K) bulbs (Solux MR-16,Tailored Lighting, Inc., Rochester, New York, USA) equippedwith a frosted diffuser. The bulbs were mounted 0.5 m abovethe imagers and positioned as shown in Figure 2.
B. Contact Physiological Measurements
Gold-standard physiological measurements were col-lected and natively synchronized with the camera expo-sure/acquisition trigger signal. PPG and ECG signals weremeasured using a research-grade, biopotential acquisitionunit with peripheral-physiological and trigger signal inputs(ActiveTwo, BioSemi B.V., Amsterdam, The Netherlands).ECG was measured from the chest using three leads. BVPwas calculated via the PPG signal from the index fingertip onthe left hand (MLT1020FC IR Plethysmograph Finger Clip,ADInstruments, Inc., Colorado Springs, Colorado, USA).
C. Participants
Twenty-five participants (17 male, 18 to 28 years, mean age23.7 years) were recruited to take part in our experiment. Theexperimental protocol was reviewed and approved by the AirForce Research Laboratory Institutional Review Board andperformed in accordance with all relevant institutional andnational guidelines and regulations. All prospective partici-pants received a study briefing and completed comprehensivewritten informed consent prior to their voluntary participation.Participants were compensated for their time. Nine individualswere wearing glasses and eight had facial hair.
D. Tasks
Participants completed six, 5-minute tasks in front of twodifferent background screens resulting in one hour of videoper participant (6 x 5 x 2 = 60 minutes). Two of these tasks areanalyzed in this evaluation. We did not analyze all six tasksdue to the extremely time consuming process of producingcompressed versions of all the videos with many CRF levels.The two tasks are representative of the data overall.Stationary Task: Participants were asked to look forwardand remain still throughout the task.Random Motion Task: Participants were asked to reorienttheir head position once per second to a randomly chosenimager in the array. Thus simulating random head motionand imposing additional noise near typical, resting pulse-ratefrequencies (∼60 bpm). The random sequence was providedto the participant via a pre-generated audio recording.
IV. VIDEO COMPRESSION ANALYSIS
The face videos were originally recorded in lossless, rawimage format. We tested a set of commonly used lossycompression codecs on these videos in order to quantifythe impact of compression on physiological parameter esti-mates. Compression was performed using the latest FFmpeg
Red
Channel
Gre
en C
hannel
Blu
e C
hannel
Com
pre
ssed
Vid
eo
Independent Component Analysis
Source 1 Source 2 Source 3
Fast Fourier Transform
Blood Volume Pulse
Signal-to-Noise RatioHeart RateArea under the power spectrum in red region
Area under the power spectrum in orange regionFreq. of dominant peak in the range 40-180 BPM
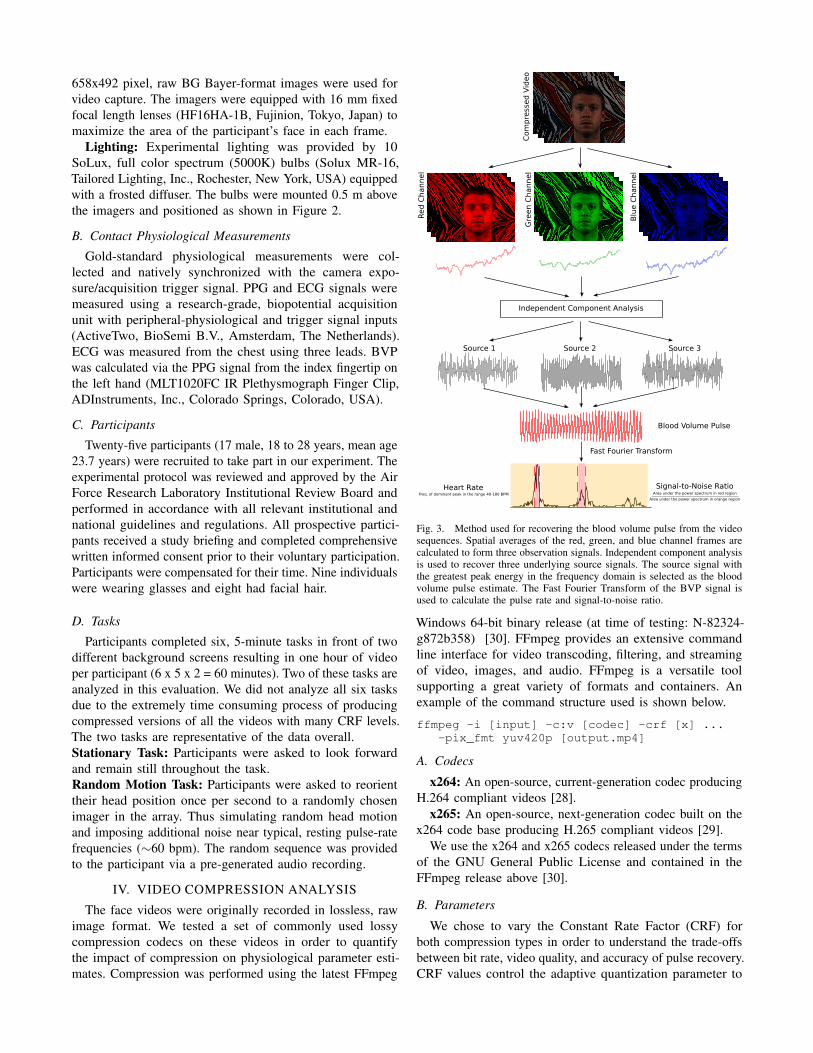
Fig. 3. Method used for recovering the blood volume pulse from the videosequences. Spatial averages of the red, green, and blue channel frames arecalculated to form three observation signals. Independent component analysisis used to recover three underlying source signals. The source signal withthe greatest peak energy in the frequency domain is selected as the bloodvolume pulse estimate. The Fast Fourier Transform of the BVP signal isused to calculate the pulse rate and signal-to-noise ratio.
Windows 64-bit binary release (at time of testing: N-82324-g872b358) [30]. FFmpeg provides an extensive commandline interface for video transcoding, filtering, and streamingof video, images, and audio. FFmpeg is a versatile toolsupporting a great variety of formats and containers. Anexample of the command structure used is shown below.
ffmpeg -i [input] -c:v [codec] -crf [x] ...-pix_fmt yuv420p [output.mp4]
A. Codecs
x264: An open-source, current-generation codec producingH.264 compliant videos [28].
x265: An open-source, next-generation codec built on thex264 code base producing H.265 compliant videos [29].
We use the x264 and x265 codecs released under the termsof the GNU General Public License and contained in theFFmpeg release above [30].
B. Parameters
We chose to vary the Constant Rate Factor (CRF) forboth compression types in order to understand the trade-offsbetween bit rate, video quality, and accuracy of pulse recovery.CRF values control the adaptive quantization parameter to

TABLE ISUMMARY OF THE BVP SNR AND PULSE RATE ESTIMATE ERROR FOR THE COMPRESSION ALGORITHMS COMPARED TO THE ECG MEASUREMENTS.
Stationary Task Random Motion Task Taskx264 x265 x264 x265
SNR PR Err. Bit Rate SNR PR Err. Bit Rate SNR PR Err. Bit Rate SNR PR Err. Bit RateCRF (dB) (BPM) (kb/s) (dB) (BPM) (kb/s) (dB) (BPM) (kb/s) (dB) (BPM) (kb/s)Cont. -4.31 0.57 N/A -4.31 0.57 N/A -2.99 0.40 N/A -2.99 0.40 N/ARaw -7.80 1.78 3.1*105 -7.80 1.78 3.1*105 -8.70 1.18 3.1*105 -8.70 1.18 3.1*105
1 -8.50 1.71 2.0*104 -9.66 2.65 3.8*104 -11.3 4.02 2.4*104 -9.66 4.26 4.3*104
3 -9.03 2.11 1.2*104 -9.88 3.89 2.4*104 -11.8 5.88 1.5*104 -11.2 4.27 2.8*104
6 -9.68 2.17 5.5*103 -10.1 3.32 1.1*104 -12.6 7.57 7.0*103 -11.2 4.62 1.3*104
9 -10.4 2.68 2.3*103 -11.8 5.94 4.2*103 -12.6 6.51 3.2*103 -12.0 6.34 5.5*103
12 -10.9 2.31 8.9*102 -12.6 7.25 1.6*103 -12.6 6.85 1.5*103 -12.6 6.85 2.5*103
15 -10.8 3.24 3.6*102 -13.1 7.84 7.5*102 -13.0 8.00 7.8*102 -12.7 6.85 1.3*103
18 -11.3 3.35 2.0*102 -13.9 7.49 4.1*102 -13.0 8.66 4.8*102 -13.2 8.26 7.8*102
24 -12.3 4.38 1.1*102 -13.9 9.51 1.7*102 -13.5 8.31 2.3*102 -13.9 9.90 3.6*102
30 -13.1 7.01 7.8*101 -13.9 10.95 8.9*101 -14.0 10.6 1.3*102 -14.1 9.48 1.9*102
36 -13.3 9.93 6.7*101 -13.7 8.87 5.8*101 -14.1 10.5 8.8*101 -14.4 9.29 1.0*102
42 -13.6 10.7 5.0*101 -13.8 9.29 4.1*101 -14.0 11.2 5.7*101 -14.2 11.5 6.3*101
48 -13.4 10.2 4.8*101 -13.8 11.8 3.3*101 -14.1 9.97 5.2*101 -13.7 10.5 4.5*101
51 -13.5 9.31 8.9*101 -13.8 9.85 3.4*101 -14.0 10.3 9.4*101 -14.1 12.1 4.6*101
0
Raw
Vid
eoCRF=
6CRF=
12
CRF=
18
10 20 30 40 50 60 70Time (s)
-1
0
1-1
0
1-1
0
1-1
0
1Recovered BVP Signal
Fig. 4. Examples of the recovered blood volume pulse waves from the raw and compressed videos using the x264 method and CRF = 6, 12, and 18.
provide constant video quality across frames of varyingcomplexity and motion. CRF values range from 0 to 51, with0 being lossless quality but requiring the greatest averagebit rate and 51 being the most lossy but producing the leastaverage bit rate. Decreasing the CRF value by six results inan approximate doubling in average bit rate. For most videosproduced for strictly visual purposes, typically CRF valuesare set in a range between 18 and 28. The implementationsof CRF in x264 and x265 are similar but not identical. Forcompleteness and anticipating effects on iPPG related signalsprior to degredations in visual quality, we varied CRF in therange: {1, 3, 6, 9, 12, 15, 18, 24, 30, 36, 42, 48, 51} forboth codecs and compare with uncompressed (raw) videos.
V. RECOVERY OF THE BLOOD VOLUME PULSEThe BVP signal was recovered from the video sequences
using a blind source separation approach. A whole-frame,spatial average of the color channel pixel values in eachframe was calculated to form time-varying observation signals.The resulting signals, r1(t), g1(t), b1(t).., r5(t), g5(t), b5(t),represent the amplitudes of the recorded RGB signals fromthe five cameras at time point, t.
For the analysis, the 5-minute videos were broken into five,one-minute sections. The observations were detrended usinga smoothness priors approach (λ=1000) [31]. Independentcomponent analysis (ICA), a blind source separation tech-nique, was used to recover a set of three source signals fromthe observations by maximizing the non-gaussianity of thesignals. The JADE ICA implementation was used [32].
The resulting source signals were filtered using a bandpassfilter with low and high frequency cut-offs at 0.75 Hz (45BPM) and 3 Hz (180 BPM) respectively. The dominantiPPG signal was selected from the set of source signalsbased on the concentration of power in the frequency domainusing the method proposed in [33]. The resulting signal wasused as the BVP estimate. Figure 3 shows a summary ofour approach. Figure 4 shows some qualitative examples ofthe recovered BVP waves using different CRFs. It is clearhow the BVP wave becomes considerably degraded withgreater compression. Pulse rate variability estimates on thecompressed videos would be much less accurate due to theabsence of clear peaks.
VI. RESULTS AND DISCUSSION

-20
-25
-20
-25
-15
-10
-5
0
BV
P S
ignal-
to-N
ois
e R
ati
o (
dB
)
CRFConta
ctR
aw 3
12
18
24
30
36
42
48
51
Conta
ctR
aw
CRF
Compression = x264 Compression = x265
15961 3
12
18
24
30
36
42
48
51
15961
CRFConta
ctR
aw 3
12
18
24
30
36
42
48
51
Conta
ctR
aw
CRF
15961 3
12
18
24
30
36
42
48
51
15961
5
-15
-10
-5
0
5 Stationary Task Random Motion TaskStationary Task Random Motion Task
Fig. 5. Box plots of the blood volume pulse (BVP) signal-to-noise ratio for the x264 (left) and x265 (right) compression methods. The results for eachtask and constant rate factor (CRF) are shown in comparison to the results from a contact BVP sensor and the raw video. The gold-standard pulse ratefrequency, used to calculate the SNR, was measured from the ECG signal.
Stationary Task Random Motion TaskBit Rate vs. SNR
Average Bit Rate (Kb/s)101 102 103 104 105 106
-15
-14
-13
-12
-11
-10
-9
BV
P S
ignal-
to-N
ois
e R
ati
o (
dB
)
Average Bit Rate (Kb/s)101 102 103 104 105 106
Raw VideoCRF = 1
CRF = 3
CRF = 6
CRF = 9
CRF = 12
CRF = 15
CRF = 18
CRF = 24
CRF = 30CRF = 36
CRF = 42
CRF = 48
CRF = 51
Raw Video
CRF = 1
CRF = 3CRF = 6
CRF = 9
CRF = 12
CRF = 15
CRF = 18
CRF = 24CRF = 30CRF = 36CRF = 42CRF = 48CRF = 51
Raw Video
CRF = 1
CRF = 3
CRF = 6
CRF = 9
CRF = 12CRF = 15
CRF = 18
CRF = 24
CRF = 30CRF = 36
CRF = 48
CRF = 51
Raw Video
CRF = 1CRF = 3
CRF = 6
CRF = 9
CRF = 12CRF = 15
CRF = 18
CRF = 24
CRF = 30
CRF = 36CRF = 42
CRF = 48
CRF = 51
-8
-7x264x265
Fig. 6. Plots of the average bit rate (log-scale axis) versus the BVP SNR (in dB) for different compression CRF values. The results for the x264 (blue)and x265 (red) codecs and the two tasks, stationary (left) and random motion (right), are shown. As both scales are logarithmic, there is a linear relationshipbetween bit rate and SNR. For the stationary task, the x264 codec performed better overall. For the motion task, the x265 codec performed better.
0.15 0.2 0.25 0.3 0.35 0.4Median (SNR)
20
22
24
26
28
30
Vid
eo Q
ualit
y PSN
R-H
VS
-M CRF = 1CRF = 3CRF = 6CRF = 24CRF = 30
CRF = 36
CRF = 42
CRF = 48
CRF = 51
Raw VideoRaw Video
CRF = 3
CRF = 6CRF = 9CRF = 18CRF = 24
CRF = 30
CRF = 36
CRF = 42
CRF = 48
CRF = 51
Stationary Task Random Motion Task
x264x265
0.15 0.2 0.25 0.3Median (SNR)
Video Quality vs. SNR
CRF = 51
CRF = 51
CRF = 48
CRF = 48
CRF = 42
CRF = 42
CRF = 36CRF = 36
CRF = 30
CRF = 30
CRF = 24
Raw Video
Raw VideoCRF = 6CRF = 9CRF = 18
CRF = 1CRF = 6CRF = 15
Fig. 7. Plots of the average video quality PSNR-HVS-M (in dB) versus the BVP SNR (in dB) for different compression CRF values. The results for thex264 (blue) and x265 (red) codecs and the two tasks, stationary (left) and random motion (right), are shown.

To assess the impact of video compression on the perfor-mance of the iPPG measurements, we calculate the absoluteerror in pulse rate compared with measurement from the ECGsignal and the signal-to-noise ratio (SNR) in the recoveredblood volume pulse signal. The pulse rate error and SNRwere calculated for each one-minute non-overlapping windowfrom each session (excluding the first and last 15 seconds ofthe session) for total of 125 minutes per task.
The pulse rate was calculated as 60/IBI , where IBI is themean of the inter-beat intervals. The SNR is calculated usingthe method described by de Haan and Jeanne [17], wherethe ratio of power within a template that includes the contactsensor heart rate frequency and the first harmonic frequencyis divided by the power outside of the template region (from0 to 240 BPM). This is represented in Figure 3.
Table I shows the numerical results for median SNRand pulse rate error alongside the median bit rate for eachcompression case. Figure 5 shows box plots of the BVP SNRfor the x264 (left) and x265 (right) compression algorithms.In each plot we show the results for the stationary and randommotion tasks. For the uniform motion tasks, the SNR for theraw video measurements was lower than for the contact BVPmeasurements but the recovered waveform was still verygood. The median pulse rate error was 0.57 (contact sensor)and 1.78 (raw images). As expected, increasing the CRFsteadily reduces the SNR of the resulting PPG measurement.Above a CRF of 30, the SNR does not continue to decrease,suggesting that the signal has been degraded sufficiently thatthere is little physiological information remaining. This resultis also reflected in the pulse rate error that is consistentlyaround 10 BPM for CRF values below 30.
Figure 6 shows the trade-off between video bit rate and thePPG SNR. Again, we show the results for the x264 (blue line)and x265 (red line) compression algorithms and the stationary(left) and random motion (right) tasks. Compression allows thevideo bit rate to be reduced significantly. Videos compressedat a CRF of 6 have a bit rate 100 times smaller than the rawvideo. However, results clearly illustrate that at CRF values of30 or above, the signal is severely reduced. This is worsenedin the presence of additional noise sources such as large headmovements. Video encoding is computationally intensive, butmay be performed more quickly and efficiently directly onhardware. In many cases, constraints on bandwidth and/orstorage space will dictate whether compression is required,in which case the reduction in signal will be accepted.
We also plot the relationship between the video quality (asmeasured by the PSNR-HVS-M metric) and the BVP signal-to-noise ratio. Figure 7 displays these results. The two valuesare not highly correlated and the results provide evidence thatthe degradation of the BVP signal begins before there aredeteriorations in image quality. Once image quality begins todecrease rapidly (CRF > 36) the BVP signal has moreorlessbeen lost. In this case, BVP SNR is a preferred metric tothose assessing video quality.
It may also be worth considering that, when compressingvideos, it is often preferred to reduce the bit rate by down-sampling the video resolution prior to encoding rather than
relying solely on significant amounts of lossy compression.Visual artifacts related to upscaling the video after decodingare perceived less harshly than strong compression artifacts.Regarding videos collected for iPPG, a similar strategy maybe beneficial. Previously it was shown that large reductions ofeither video resolution or frame rate did not strongly impactiPPG pulse rate measurements [9]. A balanced approachmay yield better results than relying on one method alone toreduce the video bit rate to acceptable levels.
VII. CONCLUSIONS
Remote physiological measurement, in particular imagingphotoplethysmography (iPPG), has received a lot of attentionin recent years due to the great potential of low-costmeasurement of vital signs. Compression methods enablereduced video bit-rates whilst preserving visual content.This enables web streaming and other bandwidth limitedapplications; however, compression algorithms were notdesigned with iPPG in mind. We performed a systematicanalysis of compression methods and parameters to evaluatethe impact on remote physiological measurement.
We tested popular compression methods (x264 and x265)and varied the constant rate factor to obtain a range of averagebit rates and video qualities. Our results suggest a considerabledrop in SNR between raw and compressed videos (evenbefore visual quality becomes noticeably degraded). As thecompression constant rate factor is increased, the bit rateand SNR drop linearly. Videos with a bit rate of 10Mb/sstill retained a BVP with reasonable SNR and the pulse rateestimation error was 2.17 BPM. The results suggest the x265compression method may be more effective than x264 onvideos featuring greater motion.
REFERENCES
[1] J. Allen, “Photoplethysmography and its application in clinical phys-iological measurement,” Physiological measurement, vol. 28, no. 3,p. R1, 2007.
[2] W. Verkruysse, L. O. Svaasand, and J. S. Nelson, “Remote plethysmo-graphic imaging using ambient light,” Optics express, vol. 16, no. 26,pp. 21 434–21 445, 2008.
[3] M.-Z. Poh, D. J. McDuff, and R. W. Picard, “Non-contact, automatedcardiac pulse measurements using video imaging and blind sourceseparation,” Optics Express, vol. 18, no. 10, pp. 10 762–10 774, 2010.
[4] ——, “Advancements in noncontact, multiparameter physiologicalmeasurements using a webcam,” IEEE Transactions on BiomedicalEngineering, vol. 58, no. 1, pp. 7–11, 2011.
[5] A. R. Guazzi, M. Villarroel, J. Jorge, J. Daly, M. C. Frise, P. A.Robbins, and L. Tarassenko, “Non-contact measurement of oxygensaturation with an rgb camera,” Biomedical optics express, vol. 6, no. 9,pp. 3320–3338, 2015.
[6] D. Shao, Y. Yang, C. Liu, F. Tsow, H. Yu, and N. Tao, “Noncontactmonitoring breathing pattern, exhalation flow rate and pulse transittime.” IEEE Transactions on Biomedical Engineering, vol. 61, no. 11,p. 2760, 2014.
[7] D. J. McDuff, J. R. Estepp, A. M. Piasecki, and E. B. Blackford, “Asurvey of remote optical photoplethysmographic imaging methods,” in2015 37th Annual International Conference of the IEEE Engineering inMedicine and Biology Society (EMBC). IEEE, 2015, pp. 6398–6404.
[8] Y. Sun, C. Papin, V. Azorin-Peris, R. Kalawsky, S. Greenwald, andS. Hu, “Use of ambient light in remote photoplethysmographic systems:comparison between a high-performance camera and a low-costwebcam,” Journal of biomedical optics, vol. 17, no. 3, pp. 0 370 051–03 700 510, 2012.

[9] E. Blackford and J. Estepp, “Effects of frame rate and imageresolution on pulse rate measured using multiple camera imagingphotoplethysmography,” in SPIE Medical Imaging. InternationalSociety for Optics and Photonics, 2015, pp. 94 172D–94 172D.
[10] G. Cennini, J. Arguel, K. Aksit, and A. van Leest, “Heart ratemonitoring via remote photoplethysmography with motion artifactsreduction,” Optics express, vol. 18, no. 5, pp. 4867–4875, 2010.
[11] A. Chung, X. Y. Wang, R. Amelard, C. Scharfenberger, J. Leong,J. Kulinski, A. Wong, and D. A. Clausi, “High-resolution motion-compensated imaging photoplethysmography for remote heart ratemonitoring,” in SPIE BiOS. International Society for Optics andPhotonics, 2015, pp. 93 160A–93 160A.
[12] G. de Haan and A. van Leest, “Improved motion robustness ofremote-ppg by using the blood volume pulse signature,” Physiologicalmeasurement, vol. 35, no. 9, p. 1913, 2014.
[13] J. R. Estepp, E. B. Blackford, and C. M. Meier, “Recovering pulserate during motion artifact with a multi-imager array for non-contactimaging photoplethysmography,” in Systems, Man and Cybernetics(SMC), 2014 IEEE International Conference on. IEEE, 2014, pp.1462–1469.
[14] Y. Sun, S. Hu, V. Azorin-Peris, S. Greenwald, J. Chambers, and Y. Zhu,“Motion-compensated noncontact imaging photoplethysmography tomonitor cardiorespiratory status during exercise,” Journal of biomedicaloptics, vol. 16, no. 7, pp. 077 010–077 010, 2011.
[15] M. van Gastel, S. Stuijk, and G. de Haan, “Motion robust remote-ppgin infrared,” 2015.
[16] W. Wang, S. Stuijk, and G. de Haan, “Exploiting spatial redundancy ofimage sensor for motion robust rppg.” IEEE Transactions on BiomedicalEngineering, vol. 62, no. 2, pp. 415–425, 2015.
[17] G. de Haan and V. Jeanne, “Robust pulse rate from chrominance-basedrppg,” IEEE Transactions on Biomedical Engineering, vol. 60, no. 10,pp. 2878–2886, 2013.
[18] ITU-T, “Rec. H.262 - Information technology - Generic coding ofmoving pictures and associated audio information: Video,” InternationalTelecommunication Union Telecommunication Standardization Sector(ITU-T), Tech. Rep., 1995.
[19] ——, “Rec. H.264 - Advanced video coding for generic audiovisualservices,” International Telecommunication Union TelecommunicationStandardization Sector (ITU-T), Tech. Rep., 2003.
[20] T. Wiegand, G. J. Sullivan, G. Bjontegaard, and A. Luthra, “Overviewof the H. 264/AVC video coding standard,” IEEE Transactions oncircuits and systems for video technology, vol. 13, no. 7, pp. 560–576,2003.
[21] ITU-T, “Rec. H.265 - High efficiency video coding,” InternationalTelecommunication Union Telecommunication Standardization Sector(ITU-T), Tech. Rep., 2013.
[22] G. J. Sullivan, J.-R. Ohm, W.-J. Han, and T. Wiegand, “Overview ofthe high efficiency video coding (HEVC) standard,” IEEE Transactionson circuits and systems for video technology, vol. 22, no. 12, pp.1649–1668, 2012.
[23] N. Ponomarenko, F. Silvestri, K. Egiazarian, M. Carli, J. Astola, andV. Lukin, “On between-coefficient contrast masking of DCT basisfunctions,” in Proceedings of the third international workshop on videoprocessing and quality metrics, vol. 4, 2007.
[24] P. Hanhart. Video Quality Measurement Tool (VQMT) 1.1.Ecole Polytechnique Federale de Lausanne (EPFL), MultimediaSignal Processing Group (MMSPG). [Online]. Available:http://mmspg.epfl.ch/vqmt/
[25] D. Vatolin, D. Kulikov, and M. Arsaev. Moscow State University 2012MPEG-4 AVC/H.264 video codecs comparison. [Online]. Available:http://www.compression.ru/video/codec comparison/h264 2012/
[26] D. Vatolin, D. Kulikov, M. Erofeev, S. Dolganov,and S. Zvezdakov. Moscow State University 2016HEVC video codecs comparison. [Online]. Available:http://compression.ru/video/codec comparison/hevc 2016/
[27] J. De Cock, A. Mavlankar, A. Moorthy, and A. Aaron, “A large-scalevideo codec comparison of x264, x265 and libvpx for practical vod ap-plications,” in SPIE Optical Engineering+ Applications. InternationalSociety for Optics and Photonics, 2016, pp. 997 116–997 116.
[28] VideoLAN Organization. x264 home page. [Online]. Available:http://www.videolan.org/developers/x264.html
[29] MulticoreWare Inc. x265 home page. [Online]. Available:http://x265.org/
[30] F. Bellard, M. Niedermayer et al. Ffmpeg. [Online]. Available:http://ffmpeg.org
[31] M. P. Tarvainen, P. O. Ranta-Aho, P. A. Karjalainen et al., “An advanceddetrending method with application to hrv analysis,” IEEE Transactionson Biomedical Engineering, vol. 49, no. 2, pp. 172–175, 2002.
[32] J.-F. Cardoso, “Multidimensional independent component analysis,” inAcoustics, Speech and Signal Processing, 1998. Proceedings of the1998 IEEE International Conference on, vol. 4. IEEE, 1998, pp.1941–1944.
[33] D. McDuff, S. Gontarek, and R. Picard, “Improvements in remotecardio-pulmonary measurement using a five band digital camera.” IEEETransactions on Biomedical Engineering, vol. 61, no. 10, pp. 2593 –2601, 2014.