the impact of unconditional cash transfers on … · the impact of unconditional cash working paper...
TRANSCRIPT

Wo
rkin
g P
aperTHE IMPACT OF UNCONDITIONAL CASH
TRANSFERS ON NUTRITION: THE SOUTH
AFRICAN CHILD SUPPORT GRANT
overty CentreINTERNATIONALP
The International Poverty Centre is jointly supported by the Brazilian Institute for Applied Economic Research (IPEA)and the Bureau for Development Policy, United Nations Development Programme, New York.
September, 2007Working Paper number 39
Jorge M. AgüeroUniversity of California, Riverside
Michael R. CarterUniversity of Wisconsin, Madison
and
Ingrid WoolardUniversity of Cape Town

Copyright© 2007
International Poverty CentreUnited Nations Development Programme
International Poverty CentreSBS – Ed. BNDES,10o andar70076 900 Brasilia DFBrazil
povertycentre@undp-povertycentre.orgwww.undp-povertycentre.orgTelephone +55 61 2105 5000Fax +55 61 2105 5001
Rights and Permissions
All rights reserved.
The text and data in this publication may be reproduced as long as the source is cited.Reproductions for commercial purposes are forbidden.
The International Poverty Centre’s Working Papers disseminate the findings of its work in progressto encourage the exchange of ideas about major development issues. The papers are signed by theauthors and should be cited and referred to accordingly. The findings, interpretations, and conclusionsexpressed in this paper are entirely those of the authors. They do not necessarily represent the viewsof the International Poverty Centre, IPEA or the United Nations Development Programme (or itsAdministrator, Directors, or the countries they represent).
Working Papers are available online at http://www.undp-povertycentre.org and subscriptions can berequested by email to [email protected]
Print ISSN: 1812-108X

THE IMPACT OF UNCONDITIONAL CASH TRANSFERS ON
NUTRITION: THE SOUTH AFRICAN CHILD SUPPORT G RANT*
Jorge M . Agüero;** M ichael R. Carter*** and Ingrid W oolard****
ABSTRACT
In light of research that has argued that the incom e elasticity of nutrition is low , the goal of a
new generation of cash transfer program m es to boost the nutrition of poor fam ilies' children
m ay seem surprising. This observation applies especially to South Africa's unconditional Child
Support G rant (CSG), in w hich cash grants are m ade to fam ilies w ith no strings attached.
H ow ever, in contrast to the m arket-generated incom e increases that identified low nutritional
elasticities in the earlier studies, the incom e increases generated by the South African cash
transfers are alm ost exclusively assigned to w om en. Taking advantage of a slow program m e
rollout that created exogenous variation in the extent of CSG treatm ent received by
beneficiaries in the province of Kw aZulu-N atal, this W orking Paper utilizes the continuous
treatm ent m ethod of H irano and Im bens (2004) to estim ate the im pact of these transfers on
child nutrition as m easured by child height-for-age. Large dosages of CSG treatm ent early in
life are show n to significantly boost child height. D raw ing on the best estim ates in the
literature, these estim ated height gains in turn suggest large adult earnings increases for
treated children and a discounted rate of return on CSG paym ents of betw een 160 per cent
and 230 per cent.
Keyw ords: N utrition, cash transfers, continuous treatm ent estim ator, South Africa.
JEL Classification: I12, H 53, C21, D 13.
* W e thank for their helpful com m ents and suggestions Eduardo Zepeda and Rafael Ribas of the International Poverty Centre, w ho served as the internal peer review ers of this W orking Paper, and Tom Kelly, of the M illennium Challenge Account Corporation, W ashington D .C., w ho served as the external peer review er. W e also thank D fID and U SAID for financial support. Please address correspondence to Jorge Agüero at jorge.aguero@ ucr.edu. W e w ould also like to thank Laura Schechter, Steven H elfand and sem inar participants at the U niversity of W isconsin-M adison, the Am erican Agricultural Econom ics Association, the U niversity of Colorado-D enver, the U niversity of Florida-G ainesville, the U niversity of California-Riverside, the Centre for the Study of African Econom ies, PEG N et and the N orth Am erican Sum m er M eetings of the Econom etric Society.
** U niversity of California, Riverside.
*** U niversity of W isconsin, M adison.
**** U niversity of Cape Tow n.

2 International Poverty Centre W orking Paper nº 39
1 INTRODUCTION
D espite im provem ents over the last tw o decades, child m alnutrition rem ains a serious health
problem in developing countries, and is the m ain contributor to child m ortality (W orld Bank
2006). For those children w ho survive, early childhood m alnutrition contributes to the inter-
generational transm ission of poverty. In a striking study of Ecuadorian children, Paxson and
Schady (2005) show that by age five, children w ho w ere likely inadequately nourished have
already fallen w ell behind the cognitive developm ent of their better nourished peers.
Assum ing that these disparities persist, the m alnourished children w ould likely do less
w ell in school, accum ulate less hum an capital and enjoy low er adult earnings than their
peers. W e w ould expect that their ow n children w ould in turn repeat this inequitable cycle.
In an effort to break this intergenerational transm ission of poverty (poverty that ‘lays its
ow n eggs’, in the w ords of an inform ant quoted in the Chronic Poverty Research Centre Report
(2004)), som e m iddle-incom e countries have adopted cash transfer program s designed to
bolster the nutrition, health and education of the children of poor fam ilies. At first glance,
reliance on cash transfers to achieve these goals m ay seem som ew hat surprising in light of the
debate about w hether nutrition responds at all to incom e increases am ongst poor fam ilies. For
exam ple, Behrm an and D eolalikar (1987) find an incom e elasticity close to zero for a sam ple of
fam ilies in south India. W hile other studies find a positive elasticity, the issue is far from solved.1
There are, how ever, several critical differences betw een the new generation of cash transfer
program m es and the m arket-generated incom e difference used to identify nutritional elasticities
in the earlier literature. M exico's Progresa program m e, the best know n of these cash transfer
program m es, has tw o key design features that m ay m ediate its nutritional im pacts.2 First, cash
transfers are conditional on the household m eeting certain required behaviours: older children
m ust attend school; and younger children m ust visit clinics for regular m edical check-ups and
nutritional m onitoring (w here am ong other aspects they are given nutritional supplem ents).
In addition to these conditionalities, Progresa cash transfers are also assigned to w om en.
U nlike m arket-driven incom e increases, w hich m ay have been generated by increases in
returns to assets ow ned by m en, these targeted cash transfers have been designed to bolster
the bargaining pow er of w om en, w ith the idea of giving m ore w eight to their preferences
because they are presum ed to be m ore child-centric.3
W hile m uch of the im pact evaluation literature on Progresa has focussed on schooling
outcom es, there is evidence that Progresa has boosted child nutritional status (Behrm an and
H oddinott 2005). H ow ever, because Progresa transfers w ere conditional (and included in-kind
nutritional supplem ents), it is not clear w hether these findings indicate non-zero incom e
elasticities of nutrition, or sim ply the im pact of transfer conditionality.
U npacking the reasons behind this response is of m ore than academ ic interest. Aid
agencies have noted that the heavy adm inistrative burdens im plied by transfer conditionality
lim it the ability of low er incom e African econom ies to im plem ent program m es m odelled on
Progresa. G iven that it is precisely these econom ies w here m alnutrition is m ost severe,
understanding the im portance of costly conditionality is im portant.4
This W orking Paper aim s to contribute to know ledge in this area by studying the im pact
of the South African Child Support G rant (CSG), w hich w as first rolled out in 1998. Like Progresa
and its sister program m es in Latin Am erica, CSG cash transfers are targeted at w om en. U nlike

Jorge M . Agüero; M ichael R. Carter and Ingrid W oolard 3
those program m es, CSG transfers are unconditional, and com e w ith no strings attached, nor
w ith any in-kind transfers.5 Analysis of this program m e thus prom ises a m ore sharply focused
exam ination of the incom e elasticity of nutrition, at least in the context of incom e increases
targeted at w om en.
H ow ever, in com parison to the Progresa program , evaluation of the CSG presents a
particular m ethodological challenge. By random ly selecting rural areas to receive the cash
transfer treatm ent, Progresa quickly becam e a popular program am ong academ ic analysts.
In contrast, the CSG w as a rolled out as a single, national program m e, depriving analysts of
purposefully random ized treatm ent and control groups. A lternative m ethods are thus
needed to estim ate the im pact of the South African CSG .
O ne m ethod w ould be to follow the current literature and use m atching m ethods to
evaluate CSG support as a binary treatm ent. Statistical problem s aside, this approach w ould
overlook the fact that the extent of CSG treatm ent (the 'dosage') varies significantly across the
treated population. D uring the nutritionally critical first 36 m onths of life (w hich w ill be the
focus of the analysis here), som e children received CSG support nearly 100 per cent of the
tim e, w hile others received only a m onth or tw o of support. The nutritional im pact of the latter
is likely negligible, w hile the im pact of the form er could be substantial. The analysis here w ill
thus use variation in the extent of treatm ent to identify the im pact of the CSG .
W hile the continuous treatm ent estim ator of H irano and Im bens (2004) opens the door
to analysis of the extent of treatm ent am ong the treated, it still requires strong orthogonality
assum ptions. The critical statistical identification assum ption is that the extent of treatm ent is
unrelated to unobserved factors that them selves can affect child health and nutrition.
W hile this assum ption m ay seem hard to sustain for a voluntary program m e that had a
single national eligibility date, w e show how inform ation on effective program rollout can be
used to derive a caregiver ‘eagerness’ m easure that allow s analysts to control for otherw ise
unobservable, and confounding, characteristics. Conditional on ‘eagerness’ and other
covariates, w e argue that exposure to the CSG depends (random ly) on the interaction
betw een the child's birth date and the effective program m e rollout for the child's locational
and tem poral cohort.
Exploiting this eagerness variable, our analysis of the im pacts of early-life CSG as a
continuous treatm ent case uncovers econom ically and statistically significant effects for large
dosages of CSG support. These estim ates show that effects are insignificant for children w ho
received CSG support for less than 50 per cent of their 36 m onth w indow . These results are
robust to the inclusion of cohort and cluster variables m eant to control for differences in the
supply of health-related public goods and other tim e and locational differences.
Finally, in an effort to get an understanding of the possible econom ic value of these
nutritional gains, w e project forw ard in tim e using best estim ates from the literature concerning
the im pact of adult height on w ages. Adaptation of these estim ates to the South African reality
suggests that the present value of early CSG support is 1.5 to 2 tim es as large as the direct cost
of that support. These findings in no w ay im ply that there are not further gains from CSG support
later in childhood. Indeed, they suggest that such further gains are quite likely. H ow ever, w ithin
the confines of this study, w e have not been able to estim ate their m agnitude.
The rem ainder of this W orking Paper is organized as follow s. Section 2 provides
background description of the South Africa Child Support G rant. Section 3 presents descriptive

4 International Poverty Centre W orking Paper nº 39
statistics on the program m e, discussing key m easures and identification strategies that are
available. Section 4 presents the m ethods and results from using continuous treatm ent effects.
Section 5 attem pts to infer the lifetim e econom ic value of the nutritional im pact identified in
Section 4, and Section 6 concludes the paper.
2 THE SOUTH AFRICAN CHILD SUPPORT G RANT
The South African system of state w elfare transfers changed little in term s of its basic structure
up to the 1990s. The system rem ained dom inated by m eans-tested, non-contributory old age
pensions and disability pensions, w ith discrim ination betw een different racially defined
population groups in term s of access to the grants and the levels of benefits. Substantial
progress w as, how ever, m ade during the early 1990s in rem oving racial discrim ination from
these tw o program m es. This greater equalization resulted in increased access and real benefit
levels for Africans and reduced real levels of benefits for w hite pensioners. Fiscal costs
expanded significantly.
D espite its apartheid past, South Africa now possesses a substantial system of state
provided, cash social assistance w ith w ide coverage of the population, m ost notably of the
form erly disenfranchised African m ajority. This im portant role of cash social assistance is fairly
exceptional com pared to m ost other m iddle-incom e countries (see Lund 1993, Lund 2001, Van
der Berg 1997, Case and D eaton 1997).
The reform s of the early 1990s did not extend to the third m ost im portant com ponent of
state transfer paym ents, nam ely, State M aintenance G rants (SM G s). These grants, payable in
the form of parent and child grants, w ere m eans-tested benefits payable to a natural parent
w ho could not, for a num ber of reasons, rely on the support of the second parent. If the second
parent w as alive, it w as necessary to apply for a private m aintenance order through the courts;
and only if this failed (or the am ount aw arded w as very low ) w as the child eligible for the grant.
This bureaucratic hurdle, in conjunction w ith very low aw areness of the grant, w as effective in
excluding m any eligible children from accessing the grant.
In 1990, only 0.2 per cent of African children w ere in receipt of the SM G , w hile 1.5 per cent
of w hite children, 4.0 per cent of Indian children and 4.8 per cent of Coloured children received
benefits (Kruger 1998). It becam e apparent in the m id-1990's that providing equal access to
the SM G w ould have severe fiscal im plications given poverty levels and household structures.
Sim ulations based on household survey data predicted a m ore than tw enty-fold increase in
expenditures (H aarm an and H aarm an 1998).
In D ecem ber of 1995, the new dem ocratic governm ent of South Africa established the
Lund Com m ittee to evaluate the existing system of state support and to explore new
alternative policy options targeting children and fam ilies. In 1998, the Child Support G rant
(CSG) replaced the existing SM G . The benefit w as initially lim ited to children under seven years
of age (unlike the SM G , w hich covered children up to age 18). In proposing the CSG , the Lund
Com m ittee em phasized that the grant m ust ‘follow the child’, m eaning that the benefit should
be independent of the child's fam ily structure.
This approach represented a m ove from a fam ily-based benefit to a child-focused one.
Legally, how ever, the grant m ust be paid over to an adult and it is the intention that the
person to w hom the grant is paid is the ‘prim ary care giver’ of the child for w hom the benefit is

Jorge M . Agüero; M ichael R. Carter and Ingrid W oolard 5
intended. In cases w here the applicant is not the biological parent of the child, a sw orn
affidavit from the parents or guardians is required to confirm that the applicant is indeed the
prim ary care giver. In practice, the designation of the prim ary care giver as the grant recipient
has effectively targeted w om en. In the data used here, 98 per cent of designated prim ary care
givers are fem ale.
W hen the Child Support G rant (CSG) w as introduced, it w as intended to cover the poorest
30 per cent of children and w as m eans-tested, i.e., the child had to be residing in a household
w ith a household incom e below a certain threshold. The threshold w as set at R800
(approxim ately U S$ 110) for children living in urban areas and at R1100 (U S$ 150) for
those living in rural areas or in inform al settlem ents. In 1999, due to a low take-up rate, the
D epartm ent of W elfare altered the incom e test from a household based m easure to one that
considered only the incom e of the prim ary caregiver plus that of his/her spouse (net of other
state transfers).
The m eans test has rem ained unchanged in nom inal term s since 1998, despite the fact
that the Consum er Price Index rose 40 per cent betw een April 1998 and Septem ber 2004.
D espite this increasingly stringent m eans test, about half of age-eligible children w ere in
receipt of the grant by this latter date.6
The governm ent has increased the age lim it for eligibility in recent years. In April 2003,
the age lim it w as raised to nine years old and a year later this w as increased to 11 years. In
April 2005, the age lim it w as raised to 14. The am ount granted has also changed since 1998
and the increases have outstripped inflation. W hile the initial m onthly benefit w as R100 in
1998, it is currently R180. D uring the tim e of the survey that w e discuss, the m onthly benefit
w as R170, w hich equates to approxim ately U S$ 25 using the m arket exchange rate (or, using
PPP, U S$ 50).
3 THE KW AZULU-NATAL DATA AND THE MEASUREMENT OF NUTRITION
The data for this study com e from the Kw aZulu-N atal Incom e D ynam ics Study (KID S).7
The Kw aZulu-N atal province is hom e to approxim ately 20 per cent of South Africa's
population of 40 m illion and w as form ed in 1994 by com bining the form er Zulu hom eland
w ith the old N atal province.
A lthough Kw aZulu-N atal is not the poorest province in South Africa, it arguably has the
highest incidence of deprivation in term s of access to services and perceived w ell-being
(Klasen 1997, Leibbrandt and W oolard 1999). Kw aZulu-N atal is also hom e to m ost of South
Africa's ethnically Indian people, w ho constitute 12 per cent of the province's population.
Africans com prise about 85 per cent of the province's population, w ith people of European
descent (largely British) com prising m ost of the rem ainder.
As explained in greater detail by M ay, Agüero, Carter, and Tim aeus (2005), respondents to
the KID S study w ere first interview ed in 1993 as part of a nationw ide living standards survey.
In 1998, the KID S study re-interview ed households from the 1993 survey that w ere located in
the Kw aZulu-N atal province. A third round of surveys w as undertaken in 2004. W hile the 1993
survey constructed households based on the residents of random ly selected dw ellings, the
1998 and 2004 studies focused on re-interview ing designated 'core people' from the 1993

6 International Poverty Centre W orking Paper nº 39
surveys. A household m em ber w as designated as a ‘core person’ if s/he satisfied any of the
follow ing criteria:
• A self-declared head of household (from 1993).
• Spouse/partner of self-declared head of household (from 1993).
• Lived in a three generation household and all of the follow ing w ere true: the child, child-in-law , or niece/nephew of the self-declared head, w ho w as at least 30 years old,
have at least one child living in the household.
• Spouse/partner of person satisfying criterion.
Thus all heads of households and spouses of heads are autom atically included and in
som e three-generation households, adult children of household heads are included. The 2004
survey w as able to interview at least one core person from 71 per cent of the original 1993
households. In addition, children of core people w ho had had their ow n children and
established new , separate residences w ere also interview ed in 2004.
The analysis to follow w ill consider children resident w ith core people as w ell as
grandchildren of core people now living separately. N ote that children w ho are resident w ith
core people include grandchildren of the cores w hose parents have not established
independent residences.
3.1 U SIN G H EIGH T-FO R-AGE Z-SCO RES TO M EASURE TH E
N U TRITIO N AL IM PACT O F TH E CSG
The CSG program m e issues m onthly paym ents to the caregivers of eligible children. Evaluating
the im pact of such paym ent flow s requires an indicator w hose ex post m easurable value
reflects the cum ulative effects of those flow s. School attainm ent or am ount learned are the
kind of after-the-fact observable stock m easures w hose values reflect earlier inflow s of
educational inputs. Sim ilarly, a child's height-for-age z-score can serve as an ex post indicatorof
nutritional inputs, especially for inputs received during the first three years of life.8
Stunting, or height that is short relative to standards established for healthy populations,
is an indicator of long-term m alnutrition. Stunting is an indicator of past grow th failure. It is
associated w ith a num ber of long-term factors, including chronic insufficient protein and
energy intake, frequent infection, sustained inappropriate feeding practices and poverty. In
children under three years of age, the effects of these long-term factors m ay not be reversible
(U N ICEF 1998, p. 21-23).
Put differently, children under three years of age are particularly vulnerable to nutritional
shortfalls, and the im pacts of poor nutrition during the first three years of life are likely to leave
a perm anent m ark on the child's z-score. W e should thus be able to ex post evaluate the
nutritional im pact of the CSG by looking at the im pact of CSG paym ents received during the
child's ‘w indow of nutritional vulnerability’ during the first three years of age.
W hile z-scores offer a prom ising w ay to exam ine the im pact of incom e transfers on
nutrition, there are tw o im portant differences betw een z-scores and the household food use or
individual food ingestion m easures used in m uch of the nutritional elasticity literature. First,
behavioural changes potentially induced by incom e increases (e.g., the purchase of m ore food)

Jorge M . Agüero; M ichael R. Carter and Ingrid W oolard 7
m ay not increase height if the child's body is unable to process or effectively use additional
nutrients. Thus, a failure to find a response of H AZ (an acronym for the H eight-for-Age z-score)
to an incom e increase could either reflect the lack of a behavioural response (i.e., the
household purchased no m ore food), or the inability of individuals to physically transform
increased nutritional inputs into im proved nutritional status.9
A second difference betw een a H AZ and food use or intake m easures of nutrition
concerns the likely extent of m easurem ent error. H AZ sim ply requires m easurem ent of child
height and age. In contrast, m easurem ent error is an im portant factor w hen m easuring food
consum ption because in m ost cases the data are collected retrospectively and the m ost
inform ed person about food purchases is not alw ays present to answ er the survey questions
(Strauss and Thom as 1998).10 Failure to find significant nutritional elasticities in studies that
em ploy food use or intake m easures could thus be a problem of noisy data.
W hile H AZ m easures are not free of such errors (Behrm an and D eolalikar 1988), the data
used here com e from a survey w here m easures of height w ere taken at least tw ice and should,
therefore, be reliable. As described in the appendix, a child's height w as taken tw ice and the
enum erators needed to com pare both m easures in order to m ake sure that the difference
never exceeded 0.5cm . In Table 1 w e show that the m ean absolute difference of the tw o
m easures is 0.015. The m edian difference is zero for all cases and only tw o children have
m easures that differ m ore than 0.5cm . These results support the idea that m easuring nutrition
using H AZ is subject to a m inim al level of m easurem ent errors.
Before turning to the analysis, one final com m ent is w arranted. W hile the analysis here
w ill attem pt to m easure the im pact of CSG support received during the critical first three years
of the child's life, this analytical choice does not m ean that CSG support outside this three-year
w indow is unim portant. Indeed, it m ight be quite critical. H ow ever, it is the likely irreversibility
of early nutritional effects that im plies greater likelihood that w e can w ith greater confidence
and accuracy m easure the im pact of the CSG using only inform ation on early treatm ent.
TABLE 1
Differences in Height Measures, by Age and G ender
Year of birth Boys Girls Total 1997 .023 .008 .016 1998 .011 .031 .021 1999 .015 .019 .017 2000 .018 .013 .015 2001 .011 .013 .012 2002 .014 .011 .013 2003 .016 .011 .013 Total .015 .016 .015
Absolute difference in centim eters.
3.2 D ESCRIPTIVE STATISTICS
Table 2 presents descriptive statistics regarding children, their caregivers and the child
support grant using the KID S data. Reported in Table 2 are data on all age-eligible children.
Children are grouped according to w hether or not they received CSG support during the
critical three-year year w indow from birth to 36 m onths of age. H ad the CSG program m e
been experim entally rolled out, as w as M exico's Progresa program m e (see Behrm an and
8 International Poverty Centre W orking Paper nº 39
H oddinott 2005), then evaluation of treatm ent effects by com paring the treated and the not-
treated w ould be relatively sim ple. H ow ever, the South African CSG w as not im plem ented w ith
an experim ental design. As show n in the table, non-treated children can be grouped into three
categories: those w ho received the child support grant only after they w ere three years old
(321 children); those w ho had applied for CSG support but had their applications rejected or
had not yet received benefits by the tim e of the survey (154 children); and those for w hom
CSG applications w ere never m ade (886 children).
The latter group of non-applicants is clearly suspect as an adequate control group given
that the CSG is a m eans-tested program m e. As can be seen, household expenditures per capita
are 40 per cent higher on average for this group com pared to the other groupings in the table.
TABLE 2
Descriptive Statistics by CSG Treatm ent Status
Treated in 3-year window Not treated Coverage
All Low High Beneficiaries Applicants Non-
applicants
Treatment Exposure (% life) 51 34 69 24 0 0 Window (% life under 3) 40 18 61 0 0 0
Child Characteristics HAZ 2004 -0.84 -0.93 -0.75 -0.91 -1.08 -0.83 Age in 2004 2.5 2.4 2.7 6.2 6.1 6.9
Caregiver Characteristics Per-capita household expenditure*
330 321 340 335 323 461
Application delay (days) 329 456 194 1369 1448 - Eagerness (% deviation average delay)
29 0.2 60 -3 -39.9 -
Female (%) 94.5 95.5 93.6 96.2 96.0 91.8 Age 38 39 37 41 48 46 Unemployed (%) 50.1 48.8 52.5 42.7 25.3 29.8 Education (yrs.) 7.7 7.4 7.9 6.7 5.3 6.3
Number of observations 245 123 122 321 154 886
* Rand per m onth.
H ow ever, the other tw o groups of non-treated children appear m ore prom ising as a
com parator group, around w hich one could build an analysis. H ousehold expenditures are
quite sim ilar betw een these non-treated groups and treated children. Indeed, other studies
(see for exam ple Angrist 1998) have used rejected applicants as a relevant control group.11
The descriptive statistics in Table 2 hint at w hat such a com parison m ight reveal. Child
z-scores are higher for treated children (-0.84) versus the beneficiary and applicant groups of
non-treated children (-0.91 and -1.08, respectively). H ow ever, a closer look at the data reveals
that few er than 10 of the 154 non-beneficiary applicants are actually rejected applicants. The
others are still in process and are perhaps better described as tardy applicants.
As reported in Table 2, caregivers for this group of children delayed application, on
average, by nearly 1,500 days after the child becam e eligible. N ote that this figure is nearly four
Jorge M . Agüero; M ichael R. Carter and Ingrid W oolard 9
tim es higher than the average delay for beneficiary children. A sim ilar observation applies to
beneficiary children w ho did not receive CSG support during the first three years of their lives.
W hile the height-for-age z-scores (H AZ) for applicant and non-treated beneficiary children
are low er than those for treated children, it is unclear w hether this difference is the result of
the CSG treatm ent received by the latter, or w hether the long delay in application by the non-
beneficiary applicant signals som ething about the caregivers of the form er group (e.g., their
preferences, fam ily organization or childrearing skills). This observation questions, of course,
the adequacy of these individuals as a control group for the purposes of im pact analysis.
H ow ever, it also hints at a possible resolution of the problem using the inform ation on
application delay.
3.2.1 CSG Rollout and Caregiver Eagerness
There are at least tw o forces at w ork shaping the application delay for any child. The first factor
is the characteristics of the child's caregiver and the fam ily environm ent. The second is the
effective rollout of the program m e in the child's com m unity relative to the child's birth or
eligibility date.
W hile the CSG program m e w as announced nationally in m id-1998, it took tim e for
inform ation on the program m e to filter dow n to all com m unities. The average delay in
application w as initially high, dropping off to a low er level as the program m e becam e better
know n (Case, H osegood, and Lund 2003). W hile the program m e w as not purposefully rolled
out differently across com m unities (unlike the Brazilian Bolsa Escola program m e discussed by
A rends-Kuenning, Fava, Kassouf, and de A lm eida (2005)), w e m ight anticipate that the
program m e uptake m ight have been quicker in urban and less-isolated rural areas.
These observations suggest that a better indicator of latent caregiver characteristics
m ight be not the gross delay in CSG application, but the deviation from the average delay for
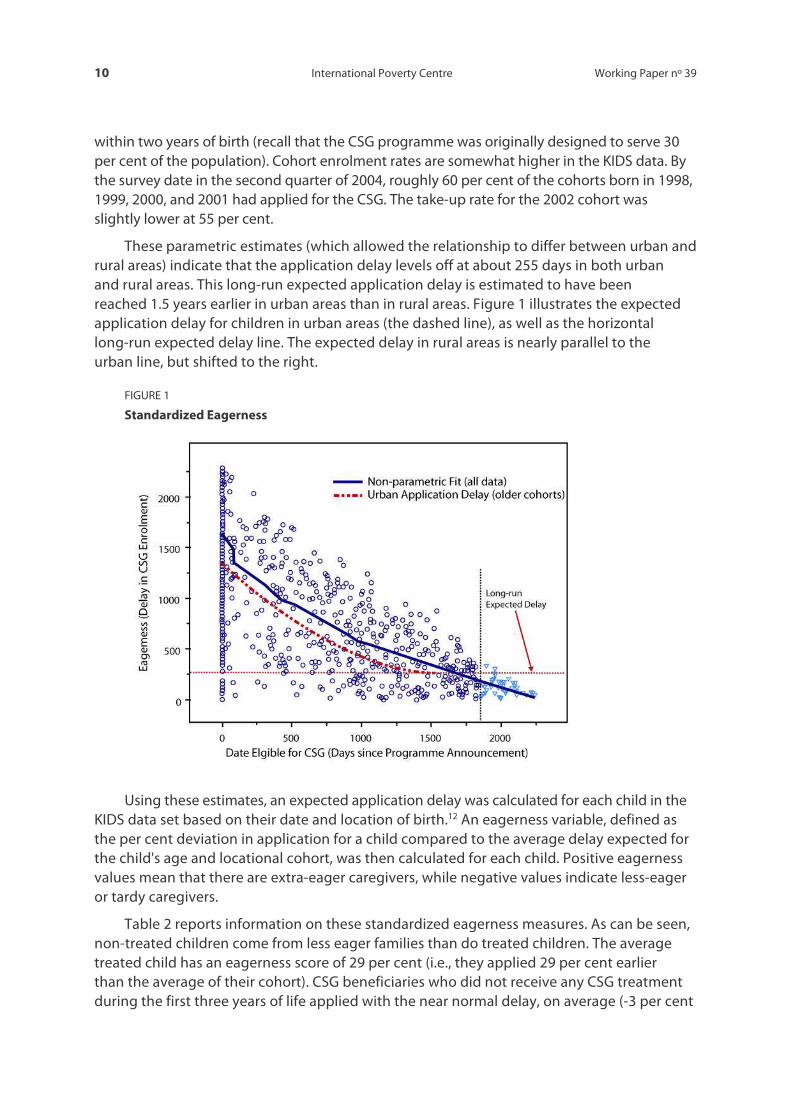
children in the sam e age and locational cohort. Figure 1 displays the results of such an analysis.
The horizontal axis displays the date that the child becam e eligible for the CSG grant
(m easured as the num ber of days since the 1998 creation of the program m e). An eligibility
date of zero m eans that the child w as already born (and under age seven) w hen the
program m e w as announced. An eligibility date of 1,500 m eans that the child w as born 1,500
days after the program m e w as created. Projected onto the figure are the actual data points.
The vertical axis in Figure 1 show s the delay in application. The non-param etric fit
(displayed as a solid line) show s that, as expected, average application delay dropped off
sharply as the eligibility date increased. For children im m ediately eligible for the program m e
w hen it w as announced, it took an average 1,500 days (roughly four years) before caregivers
applied for the grant. By the tim e of the survey in 2004, new ly born children w ere on average
being enrolled in the program m e in less than a year.
H ow ever, this very short application delay of the youngest children likely understates the
eventual application delay as there w ere younger children yet to be enrolled at the date of the
survey. To control for this problem , a quadratic O LS fit of the application delay w as perform ed
using only data on children born tw o years or m ore before the survey date (those data points
to the left of the vertical line in Figure 1).
This tw o-year cut-off is consistent w ith the study by Case, H osegood, and Lund (2003),
w hich show s that by 2002 the CSG take-up rate for an age cohort levelled off at 40 per cent
10 International Poverty Centre W orking Paper nº 39
w ithin tw o years of birth (recall that the CSG program m e w as originally designed to serve 30
per cent of the population). Cohort enrolm ent rates are som ew hat higher in the KID S data. By
the survey date in the second quarter of 2004, roughly 60 per cent of the cohorts born in 1998,
1999, 2000, and 2001 had applied for the CSG . The take-up rate for the 2002 cohort w as
slightly low er at 55 per cent.
These param etric estim ates (w hich allow ed the relationship to differ betw een urban and
rural areas) indicate that the application delay levels off at about 255 days in both urban
and rural areas. This long-run expected application delay is estim ated to have been
reached 1.5 years earlier in urban areas than in rural areas. Figure 1 illustrates the expected
application delay for children in urban areas (the dashed line), as w ell as the horizontal
long-run expected delay line. The expected delay in rural areas is nearly parallel to the
urban line, but shifted to the right.
FIGURE 1
Standardized Eagerness
U sing these estim ates, an expected application delay w as calculated for each child in the
KID S data set based on their date and location of birth.12 An eagerness variable, defined as
the per cent deviation in application for a child com pared to the average delay expected for
the child's age and locational cohort, w as then calculated for each child. Positive eagerness
values m ean that there are extra-eager caregivers, w hile negative values indicate less-eager
or tardy caregivers.
Table 2 reports inform ation on these standardized eagerness m easures. A s can be seen,
non-treated children com e from less eager fam ilies than do treated children. The average
treated child has an eagerness score of 29 per cent (i.e., they applied 29 per cent earlier
than the average of their cohort). CSG beneficiaries w ho did not receive any CSG treatm ent
during the first three years of life applied w ith the near norm al delay, on average (-3 per cent

Jorge M . Agüero; M ichael R. Carter and Ingrid W oolard 11
eagerness), w hereas the applicant group that had not yet received any CSG paym ents
by the survey date are show n to be tardy, w ith an average eagerness score of -40 per cent.
These eagerness figures thus suggest that the non-treated, potential control groups are
different from the beneficiary group. They also suggest that the eagerness m easure can be
used as a control for latent caregiver and fam ily characteristics.13 U sing this idea, w e w ill devise
an identification strategy built on the notion that conditional on eagerness, the extent of CSG
treatm ent should be random (related only to the accidents of birth tim e and location) and
hence orthogonal to the expected effect of the treatm ent.
3.2.2 Changes in Health Services Infrastructure
U sing program m e rollout to generate variation in treatm ent does, how ever, m ean that
children born in later cohorts w ill be m ore likely to have m ore extensive treatm ent. W hile the
period under investigation is relatively brief, this strategy does raise concerns that later cohorts
m ay also enjoy better access to clinics and other health facilities, creating a spurious
correlation betw een treatm ent and other nutrition-prom oting interventions. W hile later
econom etric analysis w ill em ploy several m ethods to control for these other effects, an initial
descriptive look at the possible m agnitude of this problem is w arranted.
The 2004 KID S survey included a com m unity questionnaire in w hich local leaders w ere
asked their perceptions about the quality of local services in both 1999 and 2004. Table 3 is
organized as a transition m atrix, w ith 1999 perceptions defining the row s and 2004
perceptions the colum ns. It show s a preponderance of stasis (the bolded m ain diagonal of the
m atrix) or even deterioration in the perceived quality of local health services.
TABLE 3
Perception about Hospitals and Clinics Services: 1999, 2004
2004 1999 Very unhappy Unhappy Neutral Happy Very happy
Very happy (10 communities)
40.0 10.0 20.0 10.0 20.0
Unhappy (11 communities)
0.0 54.6 18.2 27.3 0.0
Neutral (6 communities)
33.3 33.3 16.7 16.7 0.0
Happy (23 communities)
34.8 43.5 4.4 17.4 0.0
Very happy (2 communities)
50.0 50.0 0.0 0.0 0.0
Source: 2004 Kw aZulu-N atal Incom e D ynam ics Study, Com m unity Q uestionnaire.
W hile there are a few com m unities w here services m ay have im proved (the upper triangle
of the transition m atrix), these data suggest, if anything, that later cohorts of children m ay
have had access to poorer quality health services. G iven that these com m unities have been hit
hard by increasing num bers of H IV/AID S-related illnesses and deaths, this apparent
deterioration in health services m ay be the result of a health care system that has been
overw helm ed by these new dem ands.

12 International Poverty Centre W orking Paper nº 39
The com m unity questionnaire also asked about the m ain im provem ents in the
com m unity since 1999. Corroborating the evidence that health services have not been
generally im proving over the period of the CSG grant, only six per cent of com m unities
identified hospitals and clinics as the m ost im proved service since 1999, and another 4.7 per
cent and 6.4 per cent listed them as the second and third m ost im proved service. These
num bers are m uch low er than for prim ary school (27.3 per cent, 21.5 per cent and 4.8 per cent,
respectively) and for the supply of electricity (12.1 per cent, 20.0 per cent and 12.7 per cent,
respectively). W hile these issues deserve further attention, at a descriptive level at least the
evidence suggests, if anything, that com plem entary health care services have deteriorated for
children in the later birth cohorts w ho have received higher levels of CSG support.
3.2.3 Binary Versus Continuous Treatm ent Measures
W e are now in a position to consider alternative w ays to study the im pact of CSG paym ents on
child health during the first three years of life. O ne approach w ould be to consider CSG support
during the critical 36-m onth w indow as a binary treatm ent. M atching or scoring m ethods, w hich
used eagerness as a key m atching or control variable, could then be im plem ented.14
H ow ever, a w eakness of this binary treatm ent approach is that it w ould classify all treated
beneficiaries in the sam e w ay, despite the fact that som e children have received CSG support
for nearly 100 per cent of their life during their first 36 m onths, w hile others have received
benefits for a sm all fraction of their lives. As the descriptive statistics in Table 2 show , the
extent of treatm ent received by children varies substantially am ong the treated group.
Splitting the treated at about the m edian treatm ent level, w e see that the low treatm ent
group has coverage by CSG support for an average of 18 per cent of their early life w hereas the
average level of treatm ent coverage is 61 per cent for the high treatm ent group. O ne m ight
expect that the cum ulative im pact of CSG support for the latter group should be larger, and
indeed, the z-scores for this group are -0.75, as com pared to -0.93 for the low treatm ent cohort.
Treating these tw o groups as the sam e, as a binary approach w ould do, thus seem s likely to
understate the potential effect of full CSG treatm ent.15
Thus, as w e develop in the next section, w e propose to analyze the CSG as a continuous
treatm ent program m e, achieving identification of program m e effects by exploiting variation
of treatm ent am ongst the subset of treated children. As w ith the binary analysis, the key
identifying assum ption w ill be that conditional on observables (including eagerness), variation
in treatm ent status is the result of random factors related to child age and program m e rollout.
4 CONTINUOUS TREATMENT ESTIMATES OF THE IMPACT OF THE CSG ON NUTRITION
It is com m on in the literature of program m e evaluation to m easure the treatm ent as a binary
variable (see for exam ple Blundell and Costa-D ias 2002, Im bens 2004, H eckm an, Ichim ura, and
Todd 1998). Individuals or villages either received the treatm ent or not, regardless of the
length of the doses. H ow ever, the lack of a random ized design of the CSG m eans that selection
for treatm ent is not random and that the extent of treatm ent am ong the treated is not
uniform . In this section w e evaluate the im pact of the CSG w hen the treatm ent is defined as a
continuous variable using the recent developm ents by H irano and Im bens (2004).16
Jorge M . Agüero; M ichael R. Carter and Ingrid W oolard 13
4.1 ECO N O M ETRIC APPRO ACH
The intuition behind the H irano and Im bens estim ator is m ost easily explained w ith the
em pirical exam ple used by these authors. In their study, H irano and Im bens (2004) use their
continuous treatm ent estim ator to evaluate the im pact of lottery w innings on labour supply
of the ‘treated’ population of lottery w inners. The treatm ent dosage (size of lottery w innings) is
clearly random ly distributed am ongst lottery w inners, satisfying a general ‘unconfoundedness’
condition that treatm ent dosage is orthogonal to the outcom es of interest (e.g., leisure-
seeking individuals w ere no m ore likely to receive large w innings than w ere those w ho w anted
lottery w innings to start a new business and w ork m ore hours).
W hen this ‘unconfoundness’ assum ption is fulfilled, identification of treatm ent effects
should be relatively straightforw ard and credible. H ow ever, in the em pirical analysis of H irano
and Im bens (2004), the random distribution of treatm ent is disrupted by non-random survey
response problem s (their com pleted sam ple is biased tow ards w inners of sm aller lottery
prizes). But their key contribution is to show how to integrate other covariates into the analysis
w hen the observed treatm ent is not purely random ly distributed.
Form ally, consider a random sam ple of individuals indexed by i w here i = 1,… .,N . Let
Dd ∈ denote the dosage (in our case, the extent of CSG treatm ent during the child's first 36
m onths of life). For each i there is a set of potential outcom es, Yi(d), w hich capture i's response
to a dose. In our case, Yi(d) is the treated child's H AZ score. W hen the dose is binary then D =
{0,1}, but for the purpose of our paper w e consider the continuous treatm ent case w here D lies
in the interval [d0 , d1]. For each unit i w e observe a set of covariates Xi, the level of the
treatm ent received, Di ∈[d0; d1], and the corresponding outcom e Yi = Yi (Di).17
Let the average dose-response function at d be described by ( ) ( )[ ]dYd iΕ=µ . W e are
interested in estim ating the average gain in height-for-age from receiving the CSG for a
proportion d of the w indow com pared to a sm aller reference dose, d~. Thus, our im pact
m easure of interest is:
( ) ( ) ( ) ( )[ ] ( )[ ] DdddYEdYEddd ii ∈−=−= ,~~~µµθ (1)
To keep the notation sim ple, w e w ill drop the i subscript until the estim ation section. The
key assum ption of the m ethod suggested by H irano and Im bens (2004) is a generalization of
the ‘unconfoundedness’ assum ption found in the binary treatm ent literature. The central idea
is that after adjusting for differences in a set of covariates X, all biases in the com parison and
treatm ent groups is rem oved. The authors capture this assum ption as follow s (p. 74):
Assum ption 1 (G eneralized W eak Unconfoundedness) ( ) DdXDdY ∈∀⊥ |
In other w ords, conditioning the extent of treatm ent on the covariates is random ,
unconfounded w ith any unobserved factors that m ight affect the extent of treatm ent
(and outcom es). W hile this unconfoundedness assum ption is obviously m et in the case of the
lottery w innings studied by H irano and Im bens (2004), our key identification assum ption here
is that conditional on eagerness (and other observable characteristics), the extent of early life
CSG treatm ent or dosage is random , depending only on the child’s birth date and local
program m e rollout.
U nless childbirth decisions are postponed by m ore ardent caregivers (in anticipation of
the CSG), this assum ption should be satisfied. Such postponem ent is exceedingly unlikely,

14 International Poverty Centre W orking Paper nº 39
how ever, as the program m e w as announced in m id-1998 and in principle w as m ade available
to all eligible children at that date. Put differently, anyone w ith im m ediate know ledge of the
program m e w ould have been positioned to benefit from it im m ediately and w ould have had
no incentive to postpone childbearing.
Follow ing H irano and Im bens, the next step is to define the ‘generalized propensity
score’ or G PS.
Definition 1 (G eneralized Propensity Score) Let r(d; x) be the conditional density ofthe
treatm ent given the covariates:
( ) ( )xdfxdr XD ,, |= (2)
Then the generalized propensity score is R = r(D ;X).
As in the standard (binary) propensity score, the G PS has the property that w ithin strata w ith
the sam e value of the conditional density r(d,X), the probability that D = d does not depend
on the value of the covariates X. The authors use the G PS to show that, w hen using the w eak
‘unconfoundedness’ assum ption, the assignm ent to treatm ent is ‘unconfounded’ given the
G PS. That is, for every d, w e have ( ) ( )( ) ( )( )XdrdfdYxdrdf DD ,|,,| = .18
The estim ation of θ(d) requires com puting tw o functions. First, let
( ) [ ]rRdDYErd === ,|,β
be the conditional expectation of the outcom e as a function of the treatm ent level
D and the G PS R (note that both variables are scalars.) The dose response function at a
particular level of the treatm ent is the average of the conditional expectation over the
G PS at the particular level of treatm ent. This is given by ( ) ( )( )[ ] ( )[ ]dYEXdrdEd == ,,βµ .
O nce ( )dµ is com puted, w e can obtain our estim ate for θ(d) as defined above.19
O ther authors, such as Robins, H ernán, and Brum back (2000), have proposed a very
sim ilar approach assum ing a param etric form for the Y (d) process and therefore, for the form
of μ(d). That m ethod is called the ‘m arginal structural m odel’ (M SM .) The param eters in the
M SM are estim ated using a w eighting schem e based on the G PS. By assum ing a param etric
assum ption for β(d, r) instead of μ(d), H irano and Im bens (2004) do not need to define a
w eighting schem e (see p. 76).
4.2 IM PACT ESTIM ATIO N
To estim ate θ(d) for all Dd ∈ , w e use a tw o-stage approach as follow s. In the first stage w e
assum e a norm al distribution for the treatm ent given the covariates:
( )2'~| σψ iii XNXD
w here the param eters ψ and 2σ are estim ated by m axim um likelihood. This allow s us to
estim ate the G PS as:
Jorge M . Agüero; M ichael R. Carter and Ingrid W oolard 15
( )��
���
� −−= iii XDR '22
ˆˆ21
expˆ2
1ˆ ψσσπ
In the second stage, w e use a flexible function for ( )rd ,β . A s suggested by H irano and
Im bens (2004) w e use a quadratic approxim ation:
( ) [ ] iiiiiiiiiii RDRRDDRDYERD 52
432
210,|, ααααααβ +++++==
The set of param eters ( )50 ,, ααα �= can be estim ated using ordinary least squares.
G iven the estim ated param eters, w e can com pute the average potential outcom e at the
treatm ent level d
( ) ( )[ ] ( ) ( ) ( )( )iiiiii
N
i
XdrdXdrXdrddN
dYEd ,ˆˆ,ˆˆ,ˆˆˆˆˆ1ˆˆ 5243
2210
1
⋅⋅+⋅+⋅+⋅+⋅+== �=
ααααααµ
W e can com pute ( )dµ̂ for all levels of d. To estim ate ( )dθ̂ , the gains in Y from receiving a dose
of d com pared to a dose of d~, w e proceed as follow s
( ) ( ) ( ) Ddddd ∈∀−= ~ˆˆˆ µµθ
The authors suggest com puting the confidence intervals for the estim ates using
bootstrap m ethods.
4.3 ECO N O M ETRIC RESULTS
As described in the prior section, our estim ation strategy to satisfy the w eak ‘unconfoundedness’
orthogonality assum ption is to include a ‘usually unobservable variable’ into the set of covariates
Xi. Conditional on these variables, our including the variable for ‘eagerness’ to apply for the CSG
allow s us, w e argue, to rem ove m ost of the biases in com parisons by different levels of treatm ent.
Table 4 show s the estim ates of the first and second stages of the evaluation of the
im pact of the CSG on H AZ (M odel I). The first-stage estim ates indicate the im portance that
the eagerness variable has on explaining the treatm ent dose. A s H irano and Im bens (2004)
argue, the param eters of the second stage do not have a direct m eaning, so w hether the
treatm ent has a statistically significant im pact on the outcom e cannot be inferred form the
param eters listed in Table 4.
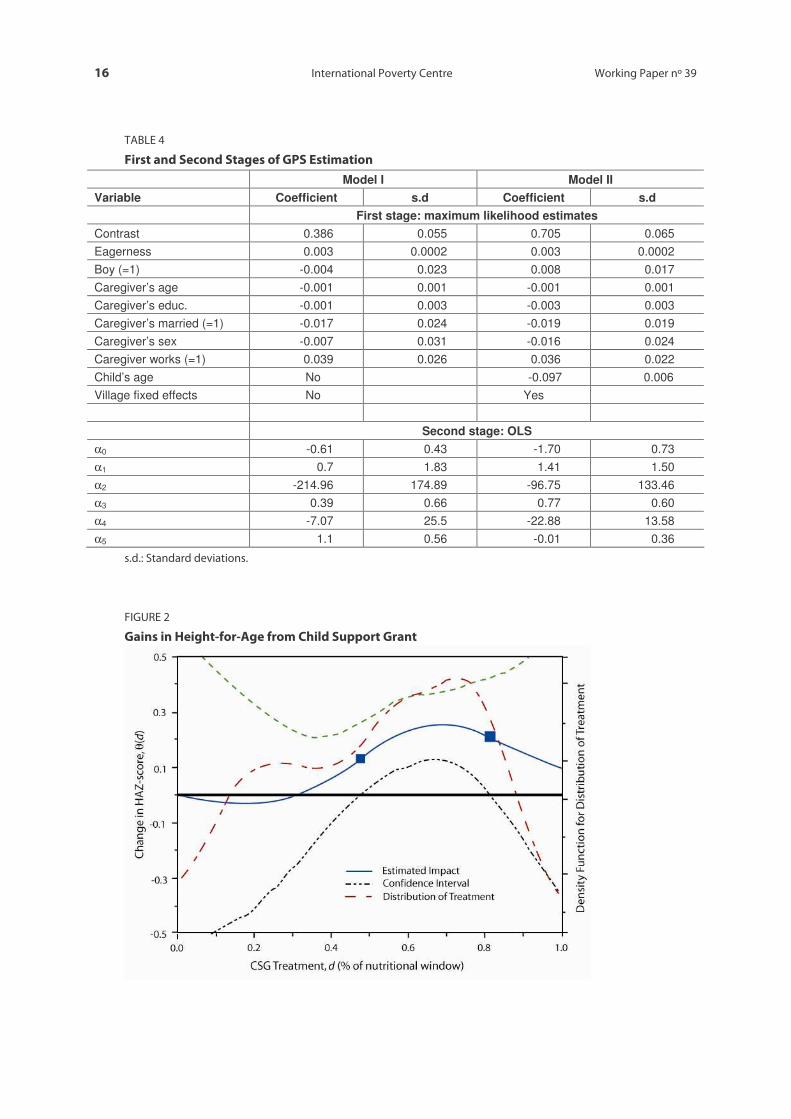
To evaluate CSG treatm ent effects, w e estim ate ( )dθ over the d = [0:01; 1:00] interval
depicted in Figure 2. H ere the baseline against w hich w e com pare all treatm ent levels is set at
reference level 01.0~ =d . W e thus com pare the gains in H AZ from receiving the CSG for different
proportions of ‘the w indow of nutritional opportunity’ against receiving a ‘sm all’ dose.
Figure 2 show s on the right axis a non-param etric estim ate of the distribution of CSG
treatm ent in the KID S data (show n as the red or dotted line). The peak of the distribution is
close to receiving treatm ent for three-quarters of the w indow s of nutritional opportunity and
decreases quickly after that. The solid line (m easured on the left axis) is our estim ates for ( )dθ
for different values of d m easured in the horizontal axis.
16 International Poverty Centre W orking Paper nº 39
TABLE 4
First and Second Stages of G PS Estim ation
Model I Model II Variable Coefficient s.d Coefficient s.d First stage: maximum likelihood estimates Contrast 0.386 0.055 0.705 0.065 Eagerness 0.003 0.0002 0.003 0.0002 Boy (=1) -0.004 0.023 0.008 0.017 Caregiver’s age -0.001 0.001 -0.001 0.001 Caregiver’s educ. -0.001 0.003 -0.003 0.003 Caregiver’s married (=1) -0.017 0.024 -0.019 0.019 Caregiver’s sex -0.007 0.031 -0.016 0.024 Caregiver works (=1) 0.039 0.026 0.036 0.022 Child’s age No -0.097 0.006 Village fixed effects No Yes Second stage: OLS α0 -0.61 0.43 -1.70 0.73 α1 0.7 1.83 1.41 1.50 α2 -214.96 174.89 -96.75 133.46 α3 0.39 0.66 0.77 0.60 α4 -7.07 25.5 -22.88 13.58 α5 1.1 0.56 -0.01 0.36
s.d.: Standard deviations.
FIGURE 2
G ains in Height-for-Age from Child Support G rant

Jorge M . Agüero; M ichael R. Carter and Ingrid W oolard 17
These point estim ates show that for treatm ents covering less than 20 per cent of the
nutritional w indow , w e find no gains. The gains are at a m axim um w hen the treatm ent covers
around tw o- thirds of the nutritional w indow . A child receiving treatm ent for tw o-thirds of the
w indow , on average, has 0.25 m ore H AZ than a child w ith a treatm ent covered for only one per
cent of the w indow . This gain is statistically significant w hen w e include the confidence
intervals (show n as dashed lines).
The portion of the im pact curve for w hich w e can reject the hypothesis of zero im pact
is dem arcated w ith rectangles. The decline of the gains in H AZ after a dosage of 80 per cent
cannot be interpreted as an indicator that treatm ent is less effective after that level, since this
decline coincides w ith a grow th of the w idth of the interval estim ator provoked by a sm all
num ber of dosage levels beyond that point (as show n by the distribution function).
4.3.1 Robustness Analysis: Cohort and Village Effects
As discussed in section 3.2.2 above, it is possible for these results to be biased if changes in
the supply of health-related public goods are spuriously correlated w ith the extent of CSG
treatm ent (violating the non-confoundedness assum ption since health care facilities w ould
then be correlated w ith dosage and the distribution of dosage w ould in turn not be
orthogonal to expected height outcom es). As show n in that earlier section, com m unity leaders
have generally perceived a lack of im provem ent in health care services over the tim e of the
CSG rollout. If this perception is correct, at least in the areas covered by KID S, our estim ated
im pact effects should not be biased upw ards by this spurious correlation.
H ow ever, in order to check for the robustness of our results to possible changes in
health care availability, or to other changes not related to the public provision of health
facilities, w e adjust the specification of our m odel to control for both birth cohort and
locational effects. The m odified m odel includes the age of the child receiving the CSG ,
as w ell as cluster fixed effects.20
The param eters from the tw o-stage estim ation w ith this new specification are show n
in Table 4 above (M odel II). The estim ated im pact, ( )dθ , is very sim ilar to the im pact curve in
Figure 2. The m ain difference is that the interval estim ate expands m odestly and the treatm ent
range over w hich w e can reject the hypothesis of zero treatm ent effect shrinks to dosage
levels betw een 40 per cent and 60 per cent. The estim ated im pact rem ains a z-score
im provem ent of about 0.3 over this central range.
4.3.2 Heterogeneous Im pacts by Age of First Treatm ent
The im pact m easures calculated so far presum e that the im pact of a given dosage (say 25 per
cent) is the sam e irrespective of w hether that dosage w as given to a 6-m onth or a 36-m onth
old child. There is som e indication in the literature that very young children m ay be even
m ore sensitive to nutritional changes than, say, 2-year olds. H oddinott and Kinsey (2001),
for exam ple, find that the nutritional im pact of a negative incom e treatm ent (created by a
drought) varies by the child's age during the ‘treatm ent’. In particular, they find that the im pact
on child height and grow th is larger for children aged 12-24 m onths during the drought than
for those aged 24-60 m onths.

18 International Poverty Centre W orking Paper nº 39
Pursuing this idea, w e check to see w hether the im pact of the CSG differs depending on
w hen the child w as first treated. To do this, w e m odify the definition of ( )dµ̂ above so that
expectations of treatm ent effects are estim ated over the subset of children first treated during
the first year of life (subset A 1), the second year of life (A 2), and the third year of life (A 3):
( ) ( ) ( ) ( )( )iiiiiiAjij
j XdrdXdrXdrddN
d ,ˆˆ,ˆˆ,ˆˆˆˆˆ1ˆ 52
432
210 ⋅⋅+⋅+⋅+⋅+⋅+= �∈
ααααααµ
for j = {1; 2; 3} and w here Nj is the num ber of observations for each group j.
G iven the nature of our CSG treatm ent m easure, a child first receiving paym ents in the
third year of life can receive a dosage no greater than one-third, w hile a child first treated in
the second year can have dosages no greater than tw o-thirds. Children treated w ithin their
first 12 m onths can be recorded as having dosages along the entire dosage dom ain.
FIGURE 3
Heterogenous Treatm ent Effects by Age of Treatm ent
U sing the M odel II results, Figure 3 show s the estim ated im pact of the CSG on H AZ scores
for children aged less than 12 m onths, 12-24 m onths and 24-36 m onths w hen they started
receiving the CSG . As w ith Figure 2, squares have been projected onto the estim ated im pact
curves to m ark off the range over w ith w e can reject the hypothesis of zero treatm ent effects.
O nly the relevant dom ain is displayed for each curve (for exam ple, estim ated im pacts for
children first treated after age tw o extends only to a dosage of one third since that is the
m axim al treatm ent that such a child could receive).
As inspection of Figure 3 reveals, the im pact of the CSG on height-for-age is positive w hen
treatm ent started at the youngest age, but the m agnitude of the im pact decreases w ith the
age of initial treatm ent. W hen treatm ent begins after age tw o, the estim ated im pact is still

Jorge M . Agüero; M ichael R. Carter and Ingrid W oolard 19
positive, but no longer statistically significant for any dosage levels (w hich by construction
cannot exceed one third). In com parison w ith the effects estim ated based on the assum ption
that im pacts are hom ogenous irrespective of the age of treatm ent (Figure 2), the m axim um
estim ated H AZ gain is larger, around 0.45 for children w ho begin treatm ent earlier in life
(versus 0.25 under the assum ption of hom ogenous effects).
This finding of larger effects for children w ho benefit from cash transfer paym ents at a
younger age is consistent w ith other literature on nutrition cited by H oddinott and Kinsey
(2001, p. 410). In contrast to de Janvry and Sadoulet (2006), w ho suggest that cash transfers be
focused on older children as a w ay to m axim ize school enrolm ent effects, these findings w ould
suggest that cash transfers should em phasize reaching children at a very young age, at least in
term s of nutritional effects.
In the next section w e explore w hat these gains in H AZ m ean in term s of life-tim e
earnings by linking our estim ates to inform ation on the potential long-run econom ic returns
to increased nutrition and height.
5 FROM CASH TRANSFER FLOW S TO HUMAN CAPITAL STOCKS
The nutrition of young children is of im portance not only because of concern over their
im m ediate w elfare, but also because nutrition in this form ative stage of life is w idely perceived
to have a substantial persistent im pact on their physical and m ental developm ent. This in turn
affects their school success and later labour m arket productivity.
Im proving the nutritional status of m alnourished infants and sm all children m ay,
therefore, have im portant payoffs over the long term (Behrm an and H oddinott 2005). In this
section w e try to quantify the gains in height-for-age (z-scores) found in the previous section
in term s of adult w ages. W e then use these m onetary figures to calculate private returns to
CSG paym ents.
Consider the case of a m ale child w ho is treated before age one and receives CSG
benefits for tw o-thirds of the first three years of life. The gains in the child's z-score w ould be
estim ated to be around 0.40.21 To com pute the gains in height for an adult, w e assum e that
as an adult, this child w ill have a z-score 0.4 higher than the current average m ale betw een
25-35 years of age. This assum ption is consistent w ith the evidence that early childhood
height losses and gains are irreversible, leading to a perm anent change in the child's
position in the height distribution.22
U sing data from the 1998 w ave of KID S, w e obtained the z-score of adult m ales aged
25-35 as w ell as their average m onthly w age earnings. The average z-score for this adult group
is 0.68, and a z-score gain of 0.4 translates into a 3.5 cm , or 2.1 per cent, gain in adult height.23
A num ber of authors have exam ined the im pact of adult height on w ages. In the context
of low er-incom e countries, adult height is regarded as an indicator of a broad array of hum an
capabilities, including health, cognitive developm ent and w ork capacity.24 The study by
Thom as and Strauss (1997) takes a particularly careful look at the relation betw een w ages
and health in Brazil. Controlling for achieved levels of education, they report for urban m ales
an elasticity of w ages w ith respect to height of 2.43 to 3.36. U sing these elasticities, the gains
in m onthly South African w ages from an increm ent in height of 2.1 per cent w ould be betw een
R190 and R262.
20 International Poverty Centre W orking Paper nº 39
N ote that these calculations ignore any general equilibrium effects that w ould occur from
having a better nourished adult population.25 W hile it w ould be good to have sim ilar elasticity
estim ates specifically for South Africa, w e use the Thom as and Strauss estim ate as a w ay to
arrive at a rough evaluation of the benefits of the increased height generated by the CSG .
To com pute the returns to the CSG paym ents, w e calculate the present discounted value
of a flow of R190 (and R262) from age 25 to 65 years, w hen retirem ent is expected. N ote that
this approach assum es that the individual is fully em ployed throughout this tim e period. At an
annual real discount rate of five per cent, it yields a discounted present value of R11,123
(R15,357) at birth.
G iven the cost of 20 m onths of the CSG (20*R170), our calculations show a Benefit-Cost
ratio betw een 3.3 and 4.5. If w e instead m ore realistically assum e that the individual is
unem ployed 50 per cent of the tim e (w ith unem ploym ent spells random ly distributed across
the life cycle), then these figures are cut in half, w ith the estim ated cost ratios falling to
betw een 1.6 and 2.3.
W hile these num bers need to be treated w ith extrem e caution, and are at best only
indicative of the order of m agnitude of the long-term gains that m ight be anticipated from the
CSG , there are several reasons w hy these im pressive returns to the CSG m ay be conservative.
First, this sim ple analysis ignores the im pact that z-scores can have on educational attainm ent
and progress. Second, w e did not include the potential gains from receiving the grant after the
w indow of opportunity (from age three to 14).
In addition to understanding the height-w age elasticity in South Africa itself, future efforts
to evaluate the im pact of cash transfer flow s on the future value of hum an capital m ight look
m ore closely at how w ages and earnings evolve over the life-cycle. The analysis here has
sim ply assum ed that w age gains are once and for all and persist over the life cycle. In addition,
the sim ple calculations here have not considered the horrific drop in life expectancy that
H IV/AID S has brought to South Africa. The effects of this pandem ic on the labour m arket have
yet to be fully understood.
6 CONCLUSION
Cash transfer program m es have taken on an increasingly im portant role in the anti-poverty
program m es of m iddle-incom e countries. W hile a num ber of these program m es have been
m odelled on M exico's Progresa program m e (e.g., those in Brazil, H onduras and N icaragua),
South Africa's Child Support G rant (CSG) has follow ed its ow n logic. Im plem ented at the sam e
tim e as Progresa in 1998, the CSG has targeted child support paym ents to children's caregivers
(w ho are alm ost exclusively w om en). U nlike Progresa, receipt of the CSG is not conditional on
particular child behaviour (school attendance and regular m edical check-ups). Indeed, as
originally im plem ented, the CSG w as lim ited to children under seven years of age.
In this context, this W orking Paper has show n that these targeted unconditional CSG
paym ents have bolstered early childhood nutrition, as signalled by child height-for-age. W hile
it is of course possible that conditioning CSG paym ents on, say, m edical check-ups w ould have
further increased program m e effects, w e do find robust effects even in the absence of such
conditioning. In contrast to the literature on the elasticity of nutrition w ith respect to incom e,
incom e and nutrition appear to be m ore tightly w edded in the case of CSG paym ents, perhaps
because the incom e increases are assigned to w om en.

Jorge M . Agüero; M ichael R. Carter and Ingrid W oolard 21
W hile incom e transfers such as those of the CSG or the Progresa program m e in M exico
should help im m ediately to redress contem poraneous poverty, the deeper question is
w hether they help facilitate a longer-term (inter-generational) pathw ay from poverty. O ne w ay
that they m ight contribute to this goal is by enhancing the durable hum an capital stock of the
next generation.
Augm enting our estim ates of the nutritional effects of the CSG w ith best estim ates from
the literature on the elasticity of w ages w ith respect to adult height, w e calculate that the
present value of increased future earnings is m uch higher (by 60 per cent to 130 per cent)
than the cost of early-life CSG support. W hile these estim ates are crude first attem pts, they
do point us tow ard the sort of longer-term analysis needed to determ ine w hen short-term
cash transfers translate into the long-run asset increases needed to sustainably reduce
poverty in the future.

22 International Poverty Centre W orking Paper nº 39
APPENDIX: MEASUREMENT OF HEIG HT IN K IDS
The 2004 Fieldw orkers' m anual for the Kw aZulu-N atal Incom e D ynam ics (KID S) has the
follow ing instructions regarding the m easurem ent of height for children.
Children younger than 2 years (24 m onths)
• The m easuring board is placed on an even, uncarpeted area.
• The child is placed on the m easuring board, lying on his/her back w ith the crow n of
his/her head touching the fixed headboard and the shoulders touching the base
of the board. O ne fieldw orker is needed to hold the child in this position.
• A second fieldw orker ensures that the child's heels touch the board and
straightens the legs (knees not bent) before sliding the footboard against the
soles of the child's heels.
• The m easurem ent is taken on the inside of the footboard to the nearest 0.1cm .
• The m easurem ent is recorded in the space provided on the questionnaire. Repeat the
procedure once.
• If the tw o readings vary by m ore than 0.5cm the m easurem ent M U ST be repeated.
Children 2 years of age and older
• The stadiom eter is placed on an even, uncarpeted area.
• The child's shoes are rem oved (as are hats, bonnets, ribbons, clips etc).
• The child is positioned as follow s: facing the fieldw orker, shoulders relaxed w ith
shoulder blades, buttocks and heels touching the m easuring board, arm s relaxed
at sides, legs straight and knees together and feet flat, heels touching together.
• W ith the child looking straight ahead the headpiece (Frankfurt plane) is slid dow n
until it touches the crow n of the head.
• The reading is taken to the nearest 0.1cm .
• The m easurem ent is recorded in the space provided in the questionnaire and
repeated once.
• If the tw o readings vary by m ore than 0.5cm the m easurem ent M U ST be repeated
(until both readings are w ithin 0.5 cm ).
Jorge M . Agüero; M ichael R. Carter and Ingrid W oolard 23
REFERENCES
Angrist, J. D . (1998). ‘Estim ating the Labor M arket Im pact of Voluntary M ilitary Service U sing
Social Security D ata on M ilitary Applicants,’Econom etrica, 66(2), 249-288.
A raujo, M . C., and N . Schady (2006). ‘Cash transfers, conditions, school enrolm ent, and child
w ork: evidence from a random ized experim ent in Ecuador,’ Policy Research W orking Paper
3930, W ashington D C: The W orld Bank.
A rends-Kuenning, M ., A . Fava, A . L. Kassouf, and A . de A lm eida (2005). ‘The im pact of school
quality and school incentive program s on children’s schooling and w ork in Brazil,’ W orking
Paper, U niversity of Illinois.
Behrm an, J., M . Rosenzw eig, and A . D . Foster (1994). ‘The D ynam ics of Agricultural Production
and the Calorie-Incom e Relationship,’ M im eo, U niversity of Pennsylvania.
Behrm an, J. R., Y. Cheng, and P. E. Todd (2004). ‘Evaluating Preschool Program s w hen Length
of Exposure to the Program Varies: A N onparam etric Approach,’ The Review of Econom ics and
Statistics, 86(1), 108-132.
Behrm an, J. R., and A . B. D eolalikar (1987). ‘W ill D eveloping Country N utrition Im prove w ith
Incom e? A Case Study for Rural South India,’ Journal of Political Econom y, 95(3), 492-507.
_______. (1988). ‘H ealth and N utrition,’ in Handbook of Developm ent Econom ics, edited by H .
Chenery, and T. Srinivasan, vol. I, pp. 631-711, Am sterdam : N orth-H olland.
Behrm an, J. R., and J. H oddinott (2005). ‘Program m e Evaluation w ith U nobserved
H eterogeneity and Selective Im plem entation: The M exican PRO GRESA Im pact on Child
N utrition,’ O xford Bulletin of Econom ics and Statistics, 67(4), 547- 569.
Blundell, R., and M . Costa-D ias (2002). ‘A lternative Approaches to Evaluation in Em pirical
M icroeconom ics,’ Cem m ap W orking Papers 10/02, Institute of Fiscal Studies, London.
Bouis, H . E., and L. J. H addad (1992). ‘Are estim ates of calorie-incom e elasticities too high?
A recalibration of the plausible range,’ Journal of Developm ent Econom ics, 39(2), 333-364.
Case, A ., and A . D eaton (1997). ‘Large Cash Transfers to the Elderly in South Africa,’ D iscussion
Paper 176, Princeton U niversity.
Case, A ., V. H osegood, and F. Lund (2003). ‘The Reach of the South African Child Support G rant:
Evidence from Kw aZulu-N atal,’ W orking Paper 38, CSD S.
Chronic Poverty Research Centre (2004). ‘Chronic Poverty Report 2004-2005,’ Chronic Poverty
Research Centre, M anchester.
de Janvry, A ., and E. Sadoulet (2006). ‘M aking Conditional Cash Transfer Program s M ore
Efficient: D esigning for M axim um Effect of the Conditionality,’ W orld Bank Econom ic Review ,
20(1), 1-29.
G lew w e, P., and P. O linto (2005). ‘Evaluating the Im pact of Conditional Cash Transfers
on Schooling: An Experim ental Analysis of the H onduras PRAF Program ,’ M im eo, U niversity
of M innesota.
H aarm an, C., and D . H aarm an (1998). ‘A Contribution Tow ards a N ew Fam ily Support System in
South Africa,’ Report for the Lund Com m ittee on Child and Fam ily Support.

24 International Poverty Centre W orking Paper nº 39
H addad, L., H . A lderm an, S. Appleton, L. Song, and Y. Yohannes (2003). ‘Reducing Child
M alnutrition: H ow Far D oes Incom e G row th Take U s?,’ W orld Bank Econom ic Review ,
17(1), 107-131.
H eckm an, J. J., H . Ichim ura, and P. E. Todd (1998). ‘M atching as an Econom etric Evaluation
Estim ator: Evidence from Evaluating a Job Training Program m e,’ Review of Econom ic Studies,
64(4), 605-54.
H irano, K., and G . W . Im bens (2004). ‘The Propensity Score w ith Continuous Treatm ents,’ in
Applied Bayesian M odelling and Causal Inference from Incom plete-Data Perspectives, edited by
A . G elm an, and X.-L. M eng, pp. 73-84, N ew York: W iley.
H oddinott, J., and B. Kinsey (2001). ‘Child G row th in the Tim e of D rought,’ O xford Bulletin of
Econom ics and Statistics, 63(4), 409-36.
Im bens, G . (2000). ‘The Role of the Propensity Score in Estim ating D ose-Response Functions,’
Biom etrika, 87(3), 706-710.
Im bens, G . W . (2004). ‘N onparam etric Estim ation of Average Treatm ent Effects under
Exogeneity: A Review ,’ The Review of Econom ics and Statistics, 86(1), 4-29.
Kakw ani, N ., F. Soares, and H . Son (2005). ‘Conditional Cash Transfers in Africa,’
W orking Paper 9, International Poverty Centre. Brasilia.
Klasen, S. (1997). ‘Poverty, Inequality and D eprivation in South Africa: An Analysis of the 1993
SALD RU Survey,’ Social Indicator Research, 41, 51-94.
Kruger, J. (1998). ‘From single parents to poor children: refocusing South Africa's
Transfers to poor households w ith children,’ in ISSA's 2nd International Research Conference on
Social Security.
Leibbrandt, M ., and I. W oolard (1999). ‘A com parison of poverty in South Africa's nine
provinces,’ Developm ent Southern Africa, 16(1), 37-54.
Lund, F. (1993). ‘State Social Benefits in South Africa,’ International Social Security Review ,
46(1), 5-23.
Lund, F. (2001). ‘Child Support G rant,’ M im eo, U niversity of N atal.
M aluccio, J. A ., and R. Flores (2005). ‘Im pact Evaluation of a Conditional Cash Transfer Program .
The N icaraguan Red de Proteccion Social,’ Research Report 141, IFPRI, W ashington D .C.
M ay, J., J. Agüero, M . Carter, and I. Tim aeus (2005). ‘The Kw aZulu-N atal Incom e D ynam ics Study
(KID S) 3rd W ave: M ethodology, First Findings and an Agenda for Future Research,’ W orking
Paper, U niversity of Kw aZulu-N atal.
Paxson, C., and N . Schady (2005). ‘Cognitive D evelopm ent am ong young children in Ecuador:
The roles of w ealth, health and parenting,’ Policy Research W orking Paper 3065, W orld Bank.
Penniston, K. L., and S. A . Tanum ihardjo (2006). ‘The acute and chronic toxic effects of vitam in
A ,’ The Am erican Journal of Clinical Nutrition, 83, 191-201.
Postelw aite, A ., N . Persico, and D . Silverm an (2004). ‘The Effect of Adolescent Experience on
Labor M arket O utcom es: The Case of H eight,’ Journal of Political Econom y, 112, 1019-1053.
Robins, J., M . H ernan, and B. Brum back (2000). ‘M arginal structural m odels and causal inference
in epidem iology,’ Epidem iology, 11, 550-560.
Jorge M . Agüero; M ichael R. Carter and Ingrid W oolard 25
Strauss, J., and D . Thom as (1998). ‘H ealth, N utrition, and Econom ic D evelopm ent,’ Journal of
Econom ic Literature, 36(2), 766-817.
Subram anian, S., and A . D eaton (1996). ‘The D em and for Food and Calories,’ Journal of Political
Econom y, 104(1), 133-62.
Thom as, D ., and J. Strauss (1997). ‘H ealth and W ages: Evidence on M en and W om en in U rban
Brazil,’ Journal of Econom etrics, 77(1), 159-185.
U N ICEF (1998). The state of the w orld's children. O xford U niversity Press, N ew York.
Van der Berg, S. (1997). ‘South Africa after Apartheid: A W elfare State in the M aking?’ in
International Conference on Socio-Econom ics, M ontreal.
von Braun, J., and E. T. Kennedy (1994). Agricultural com m ercialization, econom ic developm ent,
and nutrition. The Johns H opkins U niversity Press, Baltim ore.
W orld Bank (2006). Repositioning Nutrition as Central to Developm ent: A Strategy for Large-Scale
Action, D irections in D evelopm ent, W ashington D C: The W orld Bank.
.
NOTES
1. For exam ple, see the studies by Subram anian and D eaton (1996), Bouis and H addad (1992) and Behrm an, Rosenzw eig, and Foster (1994). H addad, A lderm an, Appleton, Song, and Yohannes (2003) provides a review of the literature over the last 20 years.
2. O ther Latin Am erican cash transfer program m es include the Bolsa Escola program m e in Brazil (A rends-Kuenning, Fava, Kassouf, and de A lm eida 2005), the Social Protection N etw ork program m e in N icaragua (M aluccio and Flores 2005) and PRAF in H onduras (G lew w e and O linto 2005).
3. A num ber of the key studies on the incom e elasticity of nutrition drew on data generated as part of the International Food Policy Research Institute’s (IFPRI’s) com m ercialization of agriculture studies. In m ost cases, the IFPRI studies concerned com m unities w here technological and other changes enhanced returns to m ale assets, raising the issue as to w hether low estim ated nutritional elasticities represented im m utable fam ily preferences or sim ply a re-w eighting of child nutrition by unfriendly m ale preferences (see the discussion in the sum m ary volum e by von Braun and Kennedy (1994)).
4. O n the basis of their ex ante analysis, Kakw ani, Soares, and Son (2005) suggest that w ithout school attendance conditionalities, cash transfers in Africa w ill not increase school attendance. They do not, how ever, speak to the question of the necessity of conditionalities to boost nutrition.
5. In a recent paper, A raujo and Schady (2006) evaluate the im pact of an unconditional cash transfer program m e in Ecuador. H ow ever, unlike the CSG , program m e adm inistrators in Ecuador did em phasize the im portance of school enrolm ent w hen beneficiaries signed up for the program m e, leading som e households to believe that enrolm ent requirem ents existed.
6. In Septem ber 2004, there w ere slightly over seven m illion children aged 0-6 years in South Africa. Adm inistrative data from the D epartm ent of Social D evelopm ent indicate that 3.54 m illion of them w ere receiving the CSG .
7. The KID S data set can be dow nloaded from http://sds.ukzn.ac.za.
8. Z-scores (z) are defined as
h
hhz
σ−= w here h is height, h and hσ are, respectively, the m ean and standard
deviation of height given the age. The references for the z-scores w ere obtained from the U .S. Center for D isease Control.
9. N utritionists discuss how m any nutrients the hum an body can absorb from food com pared to preform ed nutrients (i.e., fortified foods or pharm aceutical supplem ents). For exam ple, Penniston and Tanum ihardjo (2006) discuss the case of vitam in A (or β-carotene) w here the absorption rate is 70-90 per cent from preform ed vitam in A but only 20-50 per cent from regular food. For the latter, the rate of absorption depends on dietary and non-dietary factors.
10. In addition, in m any studies, the constructed variable is not ‘nutrient intake’ but rather ‘nutrients available’ as acknow ledged by Subram anian and D eaton (1996), am ong others. The m ain problem here is that a non-negligible part of the purchased (or cooked) food is lost or w asted, leading to an overstatem ent of intake. A lso, obtaining nutrient availability from food consum ption is m ore com plicated for item s such as food consum ed aw ay from hom e, affecting especially households w ith higher incom e or those in urban areas. Finally, this transform ation also is affected by issues such as the quality of the food purchased (Behrm an and D eolalikar 1988). Food quality is rarely included in household surveys.
11. The key idea here is that the selection is based on observables. The inform ation used to select candidates allow s the researcher to identify the set of covariates that explain participation in a ‘program m e’.
12. Children born after the date w hen eagerness fell to its m inim um value w ere assigned the asym ptotic eagerness value as their expected application delay.
13. In a sim ple regression analysis of z-scores, the coefficient of the eagerness variable is positive and highly significant even in the presence of other covariates, including CSG treatm ent.
14. G iven the available panel data, another option w ould be to use anthropom etric m easures from earlier rounds of the KID S data to underw rite a difference-in-difference analysis. U nfortunately, there are only 87 beneficiary children for w hom w e have anthropom etric data in both 1998 and 2004, and 323 non-beneficiary children. M aking m atters w orse, children in this panel sub-sam ple are by definition older and very few of them (four) received any CSG support during the critical first three years of their lives.
15. In fact, w hen binary m ethods w ere used, w e w ere not able to identify a significant treatm ent effect of the CSG (full results are available upon request from the authors).
16. A lternative approaches for non-binary treatm ent include Im bens (2000) for categorical treatm ents. See also Behrm an, Cheng, and Todd (2004).
17. W ith continuous treatm ent, several restrictions apply to the probability space. See H irano and Im bens (2004) for details.
18. See theorem 1 in H irano and Im bens (2004).
19. As the authors note, the averaging is over the score evaluated at the treatm ent level of interest, r (d,X) and not over the G PS R = r (D ;X). Theorem 2 in H irano and Im bens (2004) form ally dem onstrates the relation betw een
( )rd ,β and ( )dµ . It also show s that ( ) ( ) ( )[ ]rXdrdYErd == ,|,β

20. The KID S data are draw n from 68 enum erator districts, or clusters, scattered random ly across the Kw aZulu-N atal province.
21 O ur estim ate transform ing z-scores to children’s height do not vary by gender.
22. This assum ption is consistent w ith the conventional pediatric w isdom that a child's height (z-score) at age tw o is an excellent predictor of adult height (z –score)
23. Recall that z -scores (z) are defined as
h
hhz
σ−= w here h is height, and h and hσ are, respectively, the m ean and
standard deviation of height given the age. Changes in height are com puted by .zh h∆=∆ σ
24. In contrast, w ork on developed countries (such as Postelw aite, Persico, and Silverm an (2004)) interpret greater adult height as an indicator of higher status or other social processes that boost adult earnings.
25. In principal, these general equilibrium effects could be negative (if returns dim inish to increasingly plentiful hum an capital), or positive (if returns to hum an capital increase once the labour m arket becom es sufficiently dense in better nourished, and better educated w orkers).

International Poverty CentreSBS – Ed. BNDES,10o andar70076 900 Brasilia DFBrazil
povertycentre@undp-povertycentre.orgwww.undp-povertycentre.orgTelephone +55 61 2105 5000Fax +55 61 2105 5001