can unconditional cash transfers lead to … · 7 can unconditional cash transfers lead to...
TRANSCRIPT
Can Unconditional Cash Transfers Leadto Sustainable Poverty Reduction?
Evidence from two government-led
programmes in Zambia
Sudhanshu Handa, Luisa Natali, David Seidenfeld,Gelson Tembo and Benjamin Davis
Office of Research - Innocenti Working Paper
WP-2016-21 | August 2016
IWP21 - UCTs in Zambia.qxp_Layout 1 30/08/16 15:10 Pagina 1

INNOCENTI WORKING PAPERS
UNICEF Office of Research Working Papers are intended to disseminate initial researchcontributions within the programme of work, addressing social, economic and institutional aspectsof the realization of the human rights of children.
The findings, interpretations and conclusions expressed in this paper are those of the authors anddo not necessarily reflect the policies or views of UNICEF.
This paper has been peer reviewed both externally and within UNICEF.
The text has not been edited to official publications standards and UNICEF accepts no responsibilityfor errors.
Extracts from this publication may be freely reproduced with due acknowledgement. Requeststo utilize larger portions or the full publication should be addressed to the Communication Unitat [email protected].
For readers wishing to cite this document we suggest the following form:
Handa, S., L. Natali, D. Seidenfeld, G. Tembo and B. Davis (2016). Can Unconditional Cash TransfersLead to Sustainable Poverty Reduction? Evidence from two government-led programmes inZambia, Innocenti Working Paper 2016-21, UNICEF Office of Research, Florence.
© 2016 United Nations Children’s Fund (UNICEF)
ISSN: 1014-7837
2
IWP21 - UCTs in Zambia.qxp_Layout 1 30/08/16 15:10 Pagina 2

THE UNICEF OFFICE OF RESEARCH – INNOCENTI
The Office of Research – Innocenti is UNICEF’s dedicated research centre. It undertakesresearch on emerging or current issues in order to inform the strategic directions, policiesand programmes of UNICEF and its partners, shape global debates on child rights anddevelopment, and inform the global research and policy agenda for all children, andparticularly for the most vulnerable.
Publications produced by the Office are contributions to a global debate on children andmay not necessarily reflect UNICEF policies or approaches. The views expressed are thoseof the authors.
The Office of Research – Innocenti receives financial support from the Government of Italy,while funding for specific projects is also provided by other governments, internationalinstitutions and private sources, including UNICEF National Committees.
For further information and to download or order this and other publications, please visitthe website at www.unicef-irc.org.
Correspondence should be addressed to:
UNICEF Office of Research - InnocentiPiazza SS. Annunziata, 1250122 Florence, ItalyTel: (+39) 055 20 330Fax: (+39) 055 2033 [email protected]@UNICEFInnocentifacebook.com/UnicefOfficeofResearchInnocenti
3
IWP21 - UCTs in Zambia.qxp_Layout 1 30/08/16 15:10 Pagina 3
CAN UNCONDITIONAL CASH TRANSFERS LEAD TO SUSTAINABLE POVERTY REDUCTION?EVIDENCE FROM TWO GOVERNMENT-LED PROGRAMMES IN ZAMBIA
Sudhanshu Handa ([email protected]), Luisa Natali ([email protected]), David Seidenfeld ([email protected]),Gelson Tembo ([email protected]), Benjamin Davis ([email protected]), on behalf of the Zambia CGPand MCP Evaluation Study Teams
Corresponding authors are: Sudhanshu Handa ([email protected]) and Luisa Natali ([email protected];[email protected])
Abstract:Worldwide close to 800 million people are reached by state-operated cash transfer programmes.In sub-Saharan Africa, the poorest region in the world, the number of cash transfer programmes hasdoubled in the last five years and reaches close to 50 million people. What is the impact of theseprogrammes, and do they offer a sustained pathway out of ultra-poverty? In this paper we examinethese questions using experimental data from two unconditional cash transfer programmes implementedby the Government of Zambia. We find far-reaching effects of these two programmes, not just on theirprimary objective, food security and consumption, but also on a range of productive and economicoutcomes. After three years, we observe that household spending is 59 per cent larger than the value ofthe transfer received, implying a sizeable multiplier effect. These multipliers work through increasednon-farm business activity and agricultural production.
Key words: poverty reduction, unconditional cash transfers, Zambia, RCTs, protective and productive impacts.
Acknowledgements: The Child Grant Programme (CGP) and Multiple Category Targeted Programme (MCP)impact evaluations were commissioned by the Government of Zambia (GRZ) through the Ministry ofCommunity Development, Mother and Child Health to the American Institutes of Research (AIR) and theUniversity of North Carolina at Chapel Hill (UNC) and funded by a consortium of donors including theDepartment for International Development (DfID), UNICEF, Irish Aid, and the Government of Finland.
The results that appear in this article represent many years of intellectual, technical, financial and operationalefforts of two large and dedicated teams, all of whom made important contributions that led to the successof the evaluations. Principal Investigators are David Seidenfeld (AIR) and Sudhanshu Handa (UNC).
The members of the CGP evaluation team, listed by affiliation and then alphabetically within affiliation are:AIR: Juan Bonilla, Rosa Castro Zarzur, Cassandra Jessee, Claire Nowlin, Dan Sherman, David Seidenfeld;UNICEF-Zambia: Charlotte Harland Scott, Paul Quarles van Ufford; Government of Zambia: Vandras Luywa,Stanfield Michelo, Manzunzo Zulu; DFID-Zambia: Kelley Toole; Palm Associates: Alefa Banda,Chiluba Goma, Liseteli Ndiyoi, Gelson Tembo, NathanTembo; UNC: Sudhanshu Handa; UNICEF Office ofResearch – Innocenti: Sudhanshu Handa, Luisa Natali, Tia Palermo, Amber Peterman, Leah Prencipe.
The members of the MCP evaluation team, listed by affiliation and then alphabetically within affiliation are:AIR: Juan Bonilla, Alvaro Ballarin Cabrera, Thomas De Hoop, Gilbert Kiggundu, Nisha Rai, Hannah Reeves,Joshua Sennett, Dan Sherman, Jonathan Sokoll, Amy Todd, Rosa Castro Zarzur; Palm Associates:Alefa Banda, Liseteli Ndiyoi, Nathan Tembo; UNC: Sudhanshu Handa; UNICEF Office of Research –Innocenti: Tia Palermo, Amber Peterman, Leah Prencipe.
Thanks go to Fabio Veras for helpful comments. The views expressed in this article are those of the authorsand not the policies or views of their affiliated institutions.
4
IWP21 - UCTs in Zambia.qxp_Layout 1 30/08/16 15:10 Pagina 4
Acronyms
BRAC Bangladesh Rehabilitation Assistance Committee
CCT conditional cash transfer
CGP Child Grant Programme
CT-OVC Cash Transfer for Orphans and Vulnerable Children (Kenya)
CWAC community welfare assistance committee
DD difference in differences
DfID Department for International Development (UK)
FAO Food and Agricultural Organization
HFIAS Household Food Insecurity Access Scale
ITT intent to treat
MCP Multiple Category Targeted Programme
MCDMCH Ministry of Community Development, Mother and Child Health (Zambia)
NFE Non-farm enterprise
OLS ordinary least squares
RCT randomized control trial
SSA sub-Saharan Africa
SD standard deviations
ZMW Zambian kwacha currency
5
IWP21 - UCTs in Zambia.qxp_Layout 1 30/08/16 15:10 Pagina 5

TABLE OF CONTENTS
1. Introduction ......................................................................................................................... 7
2. Overview of the two programmes and study design .................................................... 10
3. Data, balance and attrition ............................................................................................... 12
3.1 Data ............................................................................................................................ 12
3.2 Balance ...................................................................................................................... 13
3.3 Attrition .......................................................................................................................13
4. Methodology and key measures .................................................................................... 15
4.1 Multiple testing ......................................................................................................... 16
5. Results overview ............................................................................................................... 18
6. Results by indicator .......................................................................................................... 22
6.1 Effect sizes and comparison with other cash transfer programmes .................... 25
7. Discussion and conclusion ............................................................................................... 28
References ............................................................................................................................... 31
Appendix .................................................................................................................................. 33
6
IWP21 - UCTs in Zambia.qxp_Layout 1 30/08/16 15:10 Pagina 6

7
Can Unconditional Cash Transfers Lead to Sustainable Poverty Reduction? Evidence from two government-led programmes in ZambiaInnocenti Working Paper 2016-21
1. INTRODUCTION
With one-fifth of the world’s population still living in extreme poverty there remains a vital need toidentify interventions which can lead to a sustained pathway out of poverty. Recently severalassessments of ‘graduation programmes’ have generated enthusiasm about their potential to offera permanent escape from poverty for the world’s poorest. These programmes, exemplified by theNGO BRAC in Bangladesh, provide a ‘big-push’ to extremely poor households consisting of cashtransfers, livestock assets, training and supervision in the use of the asset, life-skills training andeventually access to formal sector credit at market interest rates. An evaluation conducted by BRACitself in Bangladesh reported a 40 per cent increase in consumption four years after the supervisionand other training support ended as well as a significantly larger productive asset base relative toa non-experimental comparison group (Raza et al 2012). Subsequently, this model was subject toa multi-site randomized control trial (RCT) in six different countries across three continents bythe Graduation Program Consortium. Results of programme impacts across both consumption andeconomic domains one year after the supervisory visits ended, and approximately 2-3 years afterthe initial transfer of assets, show continued positive impacts on both consumption/food-securityand productive assets, though with some variation cross sites (Banerjee et al 2015). Importantly,given the large upfront cost of the big-push graduation model and the intensive hand-holdingit entails, a cost-benefit assessment shows net positive returns in five of the six sites, suggestingthat this type of approach makes financial sense. A more recent paper, which is based on datafrom BRAC beneficiaries in Bangladesh, also calculates positive benefit-cost ratios as well as largeincreases in more productive labour activities among women four years after the initial transferof assets (Bandiera et al 2016).
The BRAC approach serves as a template for similar interventions which are currently estimatedto reach almost half a million people in Bangladesh and another half a million across 20 countriesworld-wide. Meanwhile, a recent review by the World Bank (2015) estimates that around150 countries in the developing world have implemented cash assistance programmes and thatapproximately 800 million people are reached by some type of cash transfer programme.Significant expansion of cash transfer programmes have recently occurred in sub-Saharan Africa(SSA), with a doubling of development-oriented programmes from 20 to 41 between 2010 and 2015,reaching an estimated 8-10 million households or 50 million individuals (World Bank 2015, Garciaand Moore 2012). Such programmes are of course fundamentally different from graduationprogrammes both in objective and implementation. First, their primary objective is povertymitigation rather than economic empowerment, although many large programmes on the continentdo have economic security as a secondary objective.1 And second, cash transfer programmes tendto be nationally owned and implemented, while the graduation model to this date is onlyimplemented in the NGO sector, probably due to its complexity and the large initial upfrontinvestment required to launch the programmes. Given the relative simplicity of the unconditionalcash transfer model, its popularity world-wide, and the sheer number of beneficiaries currently
1 For example the Malawi Social Cash Transfer Program and Ghana’s Livelihood Empowerment Against Poverty bothmention economic empowerment goals as additional programme objectives.
IWP21 - UCTs in Zambia.qxp_Layout 1 30/08/16 15:10 Pagina 7

8
Can Unconditional Cash Transfers Lead to Sustainable Poverty Reduction? Evidence from two government-led programmes in ZambiaInnocenti Working Paper 2016-21
being reached, an obvious question is whether it has the potential to go beyond just protectingconsumption and generate impacts on productive activity as well, which could ultimately lead topermanent increases in living standards.
How could a small, predictable sum of money, paid monthly or bimonthly lead to long-term povertyreduction? Most theories on poverty cite credit or informational constraints, lack of skills, lack ofaccess to instruments to manage risk, and present bias (myopia) as some of the key determinantsof poverty, and the graduation model addresses several of these constraints directly.An unconditional cash transfer in its simplest form, in other words without any explicit messageor complementarity intervention, would in principle only directly address two constraints: liquidityand insurance. Although targeting is to the ultra-poor, even these households might spend someof the transfer on agricultural production as a way to ensure their food security, and lumpy orunpredictable transfers might be used for investment.
The literature to date on the economic impacts of cash transfers is thin, both because this is not theirprimary aim, and because most evaluations do not follow households long enough for productiveeffects to establish themselves. Gertler et al (2012) report positive impacts of Mexico’s Progresa (nowcalled Prospera) conditional cash transfer (CCT) on livestock holdings and small business activity18 months after programme initiation, and show that increases in consumption in the originaltreatment group were larger than the control group that entered the programme four years later,suggesting a multiplier effect of the cash transfer operating through productive activity. On the otherhand, Maluccio (2010) did not find any productive effects of a similar conditional cash transferprogramme in Nicaragua after 18 months. Recently the Food and Agricultural Organization (FAO) incollaboration with UNICEF began a major initiative to document the productive impacts of nationalcash transfer programmes in SSA. A summary of initial results across seven unconditional cashtransfer programmes, all implemented by government, suggest that they have impacts on livestockassets, engagement in non-farm business activity, and on-farm investment in fertilizer and seeds(PtoP 2014; Daidone et al 2016; Covarrubias et al. 2012; Handa et al. 2016), with variations dependingon the size and predictability of the transfer and the demographic composition of target households.
In 2010, the Zambian government began testing two different cash transfer models to inform futurescale-up decisions. Each programme was accompanied by a randomized control trial (RCT) withone baseline and several longitudinal post-intervention follow-ups starting at 24-months.Both models entailed a flat unconditional cash transfer of approximately USD12 (USD24 PPP) permonth paid every two months. The Child Grant Programme (CGP) targeted all households with achild under age three in three poor rural districts, while the Multiple Category Targeted Programme(MCP) targeted vulnerable households, those with a female or elderly head keeping orphans, or ahousehold with a disabled member, in two rural districts. Neither programme was explicitly povertytargeted at the household level, but the strong geographical targeting resulted in 90 per cent ofbeneficiaries below the national poverty line in each programme and median beneficiaryconsumption was less than 40 US cents per person per day. The distinct demographic criteriaacross the two programmes meant that the same basic programme was delivered to extremelypoor households but with very different demographic make-ups. Figure 1 (page 9) shows the age
IWP21 - UCTs in Zambia.qxp_Layout 1 30/08/16 15:10 Pagina 8

9
Can Unconditional Cash Transfers Lead to Sustainable Poverty Reduction? Evidence from two government-led programmes in ZambiaInnocenti Working Paper 2016-21
distribution of households in the CGP (left panel) and MCP (right panel) at baseline. The CGP iscomposed of younger households with more prime-age members while MCP households actuallyhave an absence of prime-age members, and instead many more adolescents and elderlycare-takers. While both sets of beneficiaries are equally poor, the difference in their demographiccomposition allows us to observe whether the pattern of impacts across programmes is different,and in particular, whether the potential for sustainable livelihood improvement is higher amonghouseholds with more prime-age members.
Figure 1 – Age distribution of the CGP and MCP samples at baseline
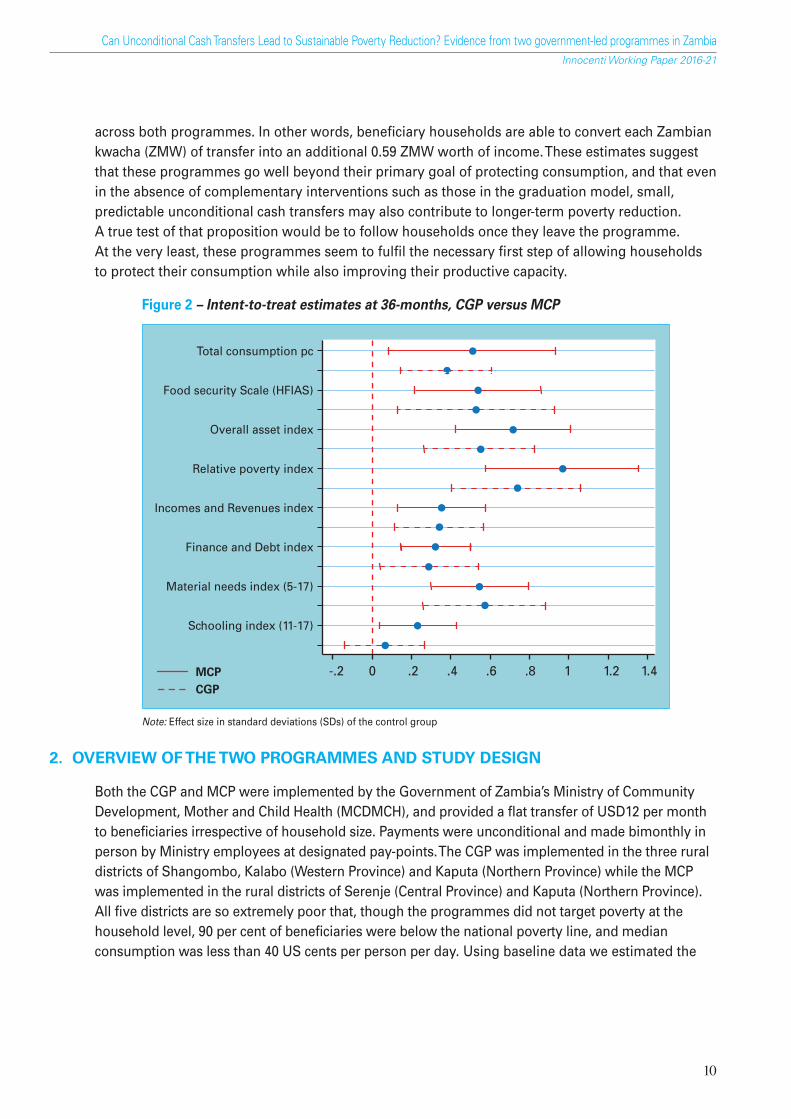
We present comparative results for both programmes across eight major domains covering bothprotective and productive outcomes, even though the primary objective of the programmesthemselves is protective. The domains are consumption, food security, assets, income and revenue,finance and debt, relative poverty, children’s material needs and schooling. An overview of the mainresults at 36-months post-intervention for each domain is presented in Figure 2 (page 10), reportedin standard deviations of the control group for ease of comparability across programmes anddomains. What is startling are the strong effects across not just protective domains (consumption,food security, and children’s material needs) but also productive ones. Also of interest is that thesummary impacts do not differ significantly across household eligibility type despite the verydifferent age composition of members. There are, however, nuances in terms of specific impacts,especially in productive domains, which we discuss in more detail later. Using these estimates wemonetize the consumption, savings and asset accumulation impacts in a one year period andcompare this value to the yearly transfer to derive an income multiplier of around 1.59 averaged
IWP21 - UCTs in Zambia.qxp_Layout 1 30/08/16 15:10 Pagina 9
10
Can Unconditional Cash Transfers Lead to Sustainable Poverty Reduction? Evidence from two government-led programmes in ZambiaInnocenti Working Paper 2016-21
across both programmes. In other words, beneficiary households are able to convert each Zambiankwacha (ZMW) of transfer into an additional 0.59 ZMW worth of income. These estimates suggestthat these programmes go well beyond their primary goal of protecting consumption, and that evenin the absence of complementary interventions such as those in the graduation model, small,predictable unconditional cash transfers may also contribute to longer-term poverty reduction.A true test of that proposition would be to follow households once they leave the programme.At the very least, these programmes seem to fulfil the necessary first step of allowing householdsto protect their consumption while also improving their productive capacity.
Figure 2 – Intent-to-treat estimates at 36-months, CGP versus MCP
Note: Effect size in standard deviations (SDs) of the control group
2. OVERVIEW OF THE TWO PROGRAMMES AND STUDY DESIGN
Both the CGP and MCP were implemented by the Government of Zambia’s Ministry of CommunityDevelopment, Mother and Child Health (MCDMCH), and provided a flat transfer of USD12 per monthto beneficiaries irrespective of household size. Payments were unconditional and made bimonthly inperson by Ministry employees at designated pay-points. The CGP was implemented in the three ruraldistricts of Shangombo, Kalabo (Western Province) and Kaputa (Northern Province) while the MCPwas implemented in the rural districts of Serenje (Central Province) and Kaputa (Northern Province).All five districts are so extremely poor that, though the programmes did not target poverty at thehousehold level, 90 per cent of beneficiaries were below the national poverty line, and medianconsumption was less than 40 US cents per person per day. Using baseline data we estimated the
Total consumption pc
Food security Scale (HFIAS)
Overall asset index
Relative poverty index
Incomes and Revenues index
Finance and Debt index
Material needs index (5-17)
Schooling index (11-17)
-.2 0 .2 .4 .6 .8 1 1.2 1.4MCPCGP
IWP21 - UCTs in Zambia.qxp_Layout 1 30/08/16 15:10 Pagina 10

11
Can Unconditional Cash Transfers Lead to Sustainable Poverty Reduction? Evidence from two government-led programmes in ZambiaInnocenti Working Paper 2016-21
transfer to represent 25 per cent of pre-programme consumption. Analysis of administrative databy the study team indicated that not only were payments made on schedule during the study periodbut over 95 per cent of beneficiaries collected their payments on time. An operations modulefielded as part of the evaluation did not reveal any indication of leakage due to bribes or requestsfor payments from village elders or programme officials (AIR 2014a).
While programme parameters are identical, a key difference in design is the demographic eligibilitycriterion. The CGP was targeted to households with a child under age 3 while the MCP was targetedto households with various types of vulnerabilities, leading to very different family structures in thetwo programmes. The CGP beneficiaries were typically young families with prime-age membersand young children, while the MCP beneficiaries were ‘missing generation’ families with very fewprime-age members and many adolescents. For example, the mean recipient age in the CGP was30 with on average 1.36 members age 19-35 and 0.03 members age 70+, compared to a mean ageof 50 in the MCP with only 0.76 members age 19-35 and 0.40 members age 70+ (Table 2).These stark differences in demographic composition allow for an interesting assessment ofwhether they lead to different patterns in programme impacts.
Both the CGP and the MCP are multi-site RCTs. In each district, community welfare assistancecommittees (CWACs) were first randomly selected to enter the study and households weresubsequently sampled from each selected CWAC. After baseline data collection, CWACs were thenrandomly assigned to intervention or delayed entry control status via a public coin toss conducted bythe Permanent Secretary of the MCDMCH. In the MCP, 92 CWACs were randomly selected for the study(46 from each district) whereas in the CGP 90 CWACs were randomly selected (30 within each district).
The main household survey instrument was quite comprehensive and included modules onconsumption, health, education, housing, agricultural and other productive activities. Most surveyitems were taken from the Zambia Living Conditions Monitoring Survey (LCMS) or theDemographic and Health Survey, both of which are conducted periodically by the National StatisticsOffice. The core survey was administered to one main respondent in the household, typically themember designated by the programme to receive the transfer. This was the biological mother orprimary care-giver of the index child in the CGP, or the care-giver or disabled member in the MCP.A key feature of the instrument is that we implemented the entire consumption module from theLCMS, featuring over 200 food and non-food items, so that we could make strict ‘apples-to-apples’welfare comparisons between the beneficiary population in the two programmes and the rest ofthe country, important for assessing the targeting strategy employed by the Ministry.
The evaluation was commissioned by the MCDMCH and UNICEF-Zambia to the American Institutesfor Research and the University of North Carolina at Chapel Hill. The study underwent ethical reviewat the American Institutes for Research (AIR) in Washington, D.C. and at the University of Zambia.Questionnaires and summary reports for both programmes are available on the Transfer Projectwebsite (http://www.cpc.unc.edu/projects/transfer). Table 1 (page 12) provides an overview ofprogramme targeting criteria and key timelines.
IWP21 - UCTs in Zambia.qxp_Layout 1 30/08/16 15:10 Pagina 11

12
Can Unconditional Cash Transfers Lead to Sustainable Poverty Reduction? Evidence from two government-led programmes in ZambiaInnocenti Working Paper 2016-21
Table 1. – Programme parameters and study timelines
3. DATA, BALANCE AND ATTRITION
3.1 Data
The baseline samples contain 2,519 and 3,078 households in the CGP and MCP respectively.In both cases, the study sample size was powered to detect significant effects for key programmeindicators that required the largest sample size. For the CGP this was child anthropometry whilein the MCP this was school enrolment among secondary school-age children. Sample sizerequirements for household level indicators such as consumption, food security and livestockownership were smaller than for these individual indicators.
Baseline descriptive statistics
As mentioned earlier, due to the strong geographic targeting of the two programmes, householdsare extremely poor, with mean per capita consumption of ZMW 41 in the CGP and ZMW 51 in the
Eligibilityrequirements
Cash transfer
Started
Midline (after 24m)
Endline (after 36m)
Location
Sample size
Unit of randomization
Method ofrandomization
The Child Grant Programme
The scheme targets households who havechildren under the age of five (59 months).However, the eligibility criteria at entry point isfor children below 3 years-old (36 months) withevidence of under-5 card.
In 2010, 55 kwacha (ZMW) a month (equivalentto USD 12) irrespective of household size,an amount deemed sufficient to purchaseone meal a day for everyone in the householdfor one month.
2010
2012
2013
3 rural districts of Zambia:Kaputa (Northern Province), Kalabo andShangombo (Western Province)
2,519 households
CWAC - Community Welfare AssistanceCommittees (90)
Public lottery
The Multiple Category Targeting Programme
Households that meet one of the followingcriteria:• A female headed household keeping orphans• A household with a disabled member• An elderly headed household (over 60 years old)
keeping orphans• A special case, being critically vulnerable
In 2011, eligible households receive 60 kwacha(ZMW) a month (equivalent to USD12)irrespective of household size, an amountdeemed sufficient to purchase one meal a day foreveryone in the household for one month.
2011
2013
2014
2 rural districts of Zambia: Serenje (CentralProvince) and Luwingu (Northern Province)
3,078 households
CWAC - Community Welfare AssistanceCommittees (92)
Public lottery
IWP21 - UCTs in Zambia.qxp_Layout 1 30/08/16 15:10 Pagina 12

13
Can Unconditional Cash Transfers Lead to Sustainable Poverty Reduction? Evidence from two government-led programmes in ZambiaInnocenti Working Paper 2016-21
MCP–the latter is in 2011 units (see Table 2, page 14). When converted to US dollars at prevailingexchange rates this represents 30 US cents per person per day. This low level of consumption isconsistent with low levels of food security, with only around 15 (MCP) to 20 (CGP) per cent of thesample not or rarely worrying about food, and 57 per cent of the combined sample not going awhole day without eating in the last four weeks. Households also have low levels of education –30 per cent or more of recipients had never attended school. The key difference across the twosamples is driven by the distinctive targeting criteria of the two programmes which leads to notablydifferent demographic compositions: households are slightly larger in the CGP (5.7 vs 5.0 in theMCP), have more children under 5 but fewer secondary school-aged children (age 13-18); they alsohave more prime-age adults (age 19-35) and fewer older people. This is also reflected in therecipient’s characteristics who are much older in the MCP (56 years vs 30 years of age in the CGP).Recipients in the CGP are more likely to be married (67 per cent) while in the MCP recipientsare mostly widowed (55 per cent) or divorced/separated (10 per cent). Finally, in the CGP virtuallyall recipients are women compared to only 75 per cent in the MCP.
The individual sub-group indicators shown in Table 3 (page 15) are fairly comparable across the twosamples, with slightly higher baseline savings rates among women in the CGP and slightly higherfulfilment of material needs among children 5-17 years in the MCP though in both samplesthe greatest deprivation comes from lack of shoes. As the CGP is focused on families with youngchildren, we also collected anthropometric measurements for children under 5 years of age whichare reported in the Appendix (Table A2, page 35) – these indicate that 35 per cent of children werestunted and 16 per cent underweight at baseline.
3.2 Balance
The CWAC level randomization for both studies resulted in balance across virtually all majorprogramme indicators. Balance tests for household characteristics and selected outcome indicatorsare shown in Table 2 (page 14). For the CGP only two indicators are significantly different at baselinebetween intervention and control groups (proportion of recipients divorced/separated, and whetherhousehold owned any goats). For the MCP one indicator – value of harvested crop – is statisticallysignificant. Table 3 (page 15) reports balance tests for indicators related to specific sub-groups ofhousehold members – women, children aged 5-17 and children aged 11-17. The only statisticallysignificant difference at baseline is for school enrolment among children aged 11-17 in the MCP,where enrolment is slightly lower in the intervention group (75 versus 79 per cent).
3.3 Attrition
Overall household attrition across the three waves is 10 per cent in the CGP sample. This is drivenby the drying up of the Cheshi Lake, in the Kaputa district at the 24-month wave that forced manyhouseholds to relocate. Many of these households were recovered in wave three so that attritionbetween wave three and baseline was only five per cent. Attrition rates are not statisticallysignificantly different between treatment and control arms. In the MCP, overall household attritionis 5 per cent though it is slightly higher in the treatment group (5.6 versus 3.5 per cent). An analysis
IWP21 - UCTs in Zambia.qxp_Layout 1 30/08/16 15:10 Pagina 13

of differential attrition is shown in the appendix (Tables A3, page 35 and A4, page 36). For the CGPonly one of the nearly 50 indicators are significantly different between the attritors in treatment andcontrol groups (number of household members age 0-5), while there is no significant differenceacross the two groups in the MCP sample.
Table 2 – Baseline balance tests for key household and beneficiary characteristics
CGP (N=2,272) MCP (N=2,938)Control Treatment P-value of diff Control Treatment P-value of diff
Recipient widowed 0.06 0.06 0.83 0.55 0.56 0.76Recipient never married 0.11 0.11 0.92 0.04 0.03 0.52Recipient divorced or separated 0.09 0.06 0.03 0.10 0.09 0.79Recipient ever attended school 0.70 0.74 0.29 0.64 0.64 0.86Female recipient 0.99 0.99 0.15 0.75 0.76 0.70Age of recipient 29.58 29.91 0.62 56.97 56.16 0.51Household size 5.63 5.76 0.45 5.02 5.00 0.89No. of household members aged 0–5 1.90 1.89 0.86 0.68 0.73 0.49Members aged 6-12 1.27 1.27 0.94 1.23 1.31 0.24Members aged 13-18 0.53 0.60 0.16 0.98 0.93 0.26Number of people aged 19-35 1.30 1.36 0.22 0.82 0.76 0.42Number of people aged 36-55 0.54 0.54 0.90 0.54 0.52 0.53Number of people aged 56-69 0.07 0.07 0.69 0.37 0.39 0.43Number of people aged 70 or older 0.03 0.03 0.59 0.40 0.36 0.21Total household expenditure per person 39.60 41.57 0.47 51.50 49.71 0.54Asset index 0.27 0.31 0.22 0.44 0.39 0.16Livestock index 0.20 0.22 0.39 0.30 0.26 0.28Productive asset index 0.32 0.35 0.25 0.75 0.72 0.49Value of harvest (ZMW) 328.84 360.12 0.50 1,058.37 874.64 0.05Does not worry about food 0.21 0.20 0.95 0.15 0.15 1.00Does not go to sleep hungry at night 0.43 0.50 0.14 0.54 0.52 0.44Does not go whole day w/o eating 0.50 0.56 0.23 0.60 0.58 0.71Food security scale (HFIAS) 8.73 9.04 0.60 9.34 9.25 0.84Owned any chickens in last 12 months 0.43 0.44 0.88 0.50 0.45 0.21Owned any goats in last 12 months 0.01 0.03 0.03 0.13 0.10 0.18Owns a pick 0.03 0.03 0.99 0.09 0.07 0.16
P-values are reported from Wald tests on the equality of means of Treatment and Control for each variable. Standard errors are clustered at thecommunity level.
14
Can Unconditional Cash Transfers Lead to Sustainable Poverty Reduction? Evidence from two government-led programmes in ZambiaInnocenti Working Paper 2016-21
IWP21 - UCTs in Zambia.qxp_Layout 1 30/08/16 15:10 Pagina 14

15
Can Unconditional Cash Transfers Lead to Sustainable Poverty Reduction? Evidence from two government-led programmes in ZambiaInnocenti Working Paper 2016-21
Table 3 – Baseline balance tests for sub-group indicators
CGP MCP
Control Treatment P-value of diff Control Treatment P-value of diffFemale respondent level indicators
Holding any savings 0.16 0.18 0.39 0.12 0.12 0.71Amount saved last month (ZMK) 20.41 17.34 0.68 15.71 6.35 0.23Log amount saved last month 0.59 0.66 0.54 0.40 0.39 0.87Believes life will be better in future 0.67 0.70 0.56 0.77 0.80 0.22
Material needs – children 5-17 yearsChild has shoes 0.14 0.14 0.92 0.22 0.19 0.27Child has two sets of clothing 0.63 0.64 0.88 0.79 0.74 0.14Child has blanket 0.58 0.56 0.78 0.63 0.58 0.24All needs met (shoes, blanket, clothes) 0.11 0.11 0.91 0.17 0.14 0.20
Schooling indicators – children 11-17 yearsCurrently attending school 0.79 0.81 0.56 0.79 0.75 0.04Full attendance prior week 0.60 0.65 0.19 0.64 0.60 0.13Number of days attended prior week 3.48 3.61 0.37 3.55 3.34 0.06
P-values are reported from Wald tests on the equality of means of Treatment and Control for each variable. Standard errors are clustered at thecommunity level. Sample sizes for CGP and MCP respectively are: Female respondents: 2221 and 2512, children 5-17: 4,409 and 6409, children11-17: 1,701 and 3,594.
4. METHODOLOGY AND KEY MEASURES
We estimate programme impacts using a difference-in-differences (DD) model augmented with avector of baseline covariates and allowing for differential impacts at 24 and 36 months. The coreestimating equation is
Y(i,t) = α+βTT(i) + βR2(R2) + βR3(R3) + βTR2(T(i) * R2) + βTR3 (T(i) * R3) + ∑J
j=1
θj Xj(i,t) + ε(i,t)
In this framework Y(i,t) is the outcome indicator for the household/woman/child i at time t. T(i) isa dummy equal to one if in the treatment group, R2 and R3 capture the two follow-ups at 24 monthsand 36 months respectively and βTR2 and βTR3 capture the intent-to-treat (ITT) effects at 24 and36 months respectively; X is a set of pre-treatment demographic controls and ε is the error term.Regressions are estimated using OLS with robust standard errors clustered at the CWAC level.We restrict our sample to the full panel, that is, to only households that appear in all three waves,although results are the same when we relax this assumption and use households that appear in atleast two waves. To ensure external validity of our estimates, that is, that they are representative of alleligible households, we weight the regression by the inverse of the probability of appearing in allthree waves. Further details of the inverse probability weights calculations are available in evaluationreports on the Transfer Project website.2
2There is no selective attrition so the estimates with and without the inverse probability weights are similar. Neverthelesswe choose to use the weights to ensure results are consistent with the official evaluation documents that are publicallyavailable in Zambia.
IWP21 - UCTs in Zambia.qxp_Layout 1 30/08/16 15:10 Pagina 15

16
Can Unconditional Cash Transfers Lead to Sustainable Poverty Reduction? Evidence from two government-led programmes in ZambiaInnocenti Working Paper 2016-21
For all outcomes we have estimated both unadjusted and covariate adjusted impacts but reportonly the adjusted results here due to space constraints. Adjusted regressions include pre-treatmentmeasures for household demographic composition and size, recipient’s age, education andmarital status, and district dummy variables. For child outcomes, we also included the age andsex of the child.3
Some of our outcome variables were not collected at baseline (see Table 4, page 17) so for these weestimate single difference models at 24 or 36 months, controlling for the same set of pre-treatmentcovariates. These estimates naturally rely on baseline equivalence for identification. The keyassumption behind the difference in differences (DD) is that of parallel trends. We do not havemultiple pre-treatment data points to explicitly test for differences in trends between treatmentarms but control CWACS are from the same districts as treatment ones which makes thisassumption more tenable. We analysed trends in village level prices during the study period andthese showed no statistically significant differences between treatment and control arms over time.
We report results for almost 40 outcome variables – at the household, woman and child level –grouped into 8/9 domains as reported in Table 4 (the definition of each indicator is reported inTable A1 in the Appendix, page 33). We define all indicators so that higher values are positiveoutcomes. Note that for loans and debt, unlike Banerjee et al (2015) we consider less debt and fewerloans as positive outcomes. In our study sample, virtually all loans are taken from informal sourcesand used for consumption, and beneficiaries report that reducing outstanding debt is a key concernof theirs. In order to compare effect sizes across indicators and domains, we follow the approachtaken by Banerjee et al (2015) and convert all variables into z-scores by subtracting the controlgroup mean (at each wave) and dividing by the control group standard deviation (at each wave);this implies that at each wave the control group has a mean of 0 and standard deviation of 1.
4.1 Multiple Testing
As we estimate impacts on over 40 indicators across multiple domains and two programmes, we mayfind false positives just because of the sheer number of tests computed. We take two approaches toaccount for this multiple testing. First, for each family of outcomes, we adjust p-values using theSidak-Bonferroni adjustment (Abdi 2007). Second, we build summary indexes as ‘lead indicators’ foreach domain following (Anderson 2008; Kling et al., 2007). Specifically, for each domain with theexception of consumption, food security and material needs, the summary index is computed as theequally weighted average of z-scores of each indicator within the domain, then standardized againstthe control group within each round.4 In the case of consumption, food security and child material
3 We used baseline age and gender for all child outcomes apart from anthropometric indicators for which we usedcontemporaneous age and gender.
4 Following Kling et al. (2007:89), we treat missing values as follows: “If an individual has a valid response to at least onecomponent measure of an index, then any missing values for other component measures are imputed at the randomassignment group mean. This results in differences between treatment and control means of an index being the same asthe average of treatment and control means of the components of that index (when the components are divided by theircontrol group standard deviation and have no missing value imputation), so that the index can be interpreted as theaverage of results for separate measures scaled to standard deviation units.”
page 18
IWP21 - UCTs in Zambia.qxp_Layout 1 30/08/16 15:10 Pagina 16

17
Can Unconditional Cash Transfers Lead to Sustainable Poverty Reduction? Evidence from two government-led programmes in ZambiaInnocenti Working Paper 2016-21
Table 4 – Indicator list by wave and domain
DOMAIN IndicatorsBaseline 24 months 36 months
LevelMCP CGP MCP CGP MCP CGP
Overall per capita consumption* Household
x x x x x xCONSUMPTION Food consumption
(pc)x x x x x x
Non-food consumption x x x x x x
Rarely or never worries about food x x x x x xAble to eat preferred food x x x x x xRarely or never eats food he/she does not wantto due to lack of resources
x x x x x x
Rarely or never eats smaller meal than needed x x x x x xFOOD Rarely or never eats fewer meals
HouseholdSECURITY because there is not enough food
x x x x x x
Rarely or never has no food to eatbecause of lack of resources
x x x x x x
Rarely or never goes to sleep hungry x x x x x xRarely or never goes a whole day/night w/o eating x x x x x xFood security scale (HFIAS, 0-24 where highermeans more food secure)*
x x x x x x
Domestic asset index Household x x x x x xASSETS Livestock index x x x x x x
Productive index x x x x x x
Whether woman currently saving cash Woman x x x x x xAmount saved by women x x x x x xWhether household has new loan Household x x x
FINANCE / DEBTReduction in the amount borrowed x x xNot having an outstanding longer-term loan(loans taken out more than 6 months beforethe follow-up considered)
x x x
Reduction in the amount owed x x x
INCOME Value of harvest ZMW x x x x x x**
ANDTotal crop expenditures
Householdx x x x x x
REVENUESNFEs [operating or not] x x x xNFEs [revenues] x x x x
Not considering household very poor Household x x x x x xRELATIVE Better off compared to 12 months ago x x x x x x
Think life will be better than now in either 1, 3 or 5 years Woman x x x x x x
Shoes x x x x x xMATERIAL Blanket Child x x x x x xNEEDS Two sets of clothes (5-17) x x x x x x
All needs met* x x x x x x
SCHOOLINGSchool enrolment Child x x x x x xDays attended in prior week (11-17) x x x x x x
NUTRITION OF Not underweightChild
x x xYOUNG CHILDREN Not wasted
(0-5)x x x
[CGP only] Not stunted x x x
*Denotes lead indicators in that domain. In domains without a lead or summary indicator, an index is created based on all the indicators listed inthat domain. X denotes indicator was included in the wave and study. ** We use crop figures collected at a special 30-month follow-up whichreferred to the same crop season that the 36-month follow-up would have referred to.
IWP21 - UCTs in Zambia.qxp_Layout 1 30/08/16 15:10 Pagina 17

18
Can Unconditional Cash Transfers Lead to Sustainable Poverty Reduction? Evidence from two government-led programmes in ZambiaInnocenti Working Paper 2016-21
needs, we simply standardize total consumption, the food security scale and “all child needs met”indicators as these are already summary statistics for that particular domain.
We then estimated the mean standardized treatment effect (ITT) on each outcome separatelyand report these estimates in the figures below. Estimates based on actual units are providedin the appendix (Tables A5– A21, pages 33-45) and those based on standardized units are availablein the online supplementary material available with this Paper. For each family of outcomes,we adjust p-values to take into account multiple inference testing and also report the ITT on thesummary index/lead indicator.
5. RESULTS OVERVIEW
We begin by presenting a summary of results using domain indices rather than the whole setof outcome indicators, and adjust p-values for multiple inference testing across domains. Figures 3and 4 show graphically the standardized impact estimates with adjusted confidence bounds for theCGP and MCP respectively. Beginning with the CGP, the programme has had a significant impact onseven of the nine domains considered, the two exceptions being secondary school-age children’sschooling and young child anthropometry. The largest effect sizes occur for subjective well-being(relative poverty) and for children’s material needs, both at 24 months. However, both indices aresubject to a ceiling effect (no further room for improvement among treatment households) whichexplains why their effect sizes decline at 36 months. Overall there is no clear indication that effectsizes increase over time.
Figure 3 – Intent-to-treat effects in nine domains by wave (CGP)
Note: Confidence intervals are adjusted using Sidak-Bonferroni.
Effect size in SDs of the control group
Endlines 1&2 (24 and 36 months) at a glance
IWP21 - UCTs in Zambia.qxp_Layout 1 30/08/16 15:10 Pagina 18

19
Can Unconditional Cash Transfers Lead to Sustainable Poverty Reduction? Evidence from two government-led programmes in ZambiaInnocenti Working Paper 2016-21
In Figure 4, the MCP has had significant impacts in seven of the eight domains considered, the loneexception being Incomes & Revenues at 24 months but this turns significant at 36 months.The largest point estimate is again associated with subjective well-being. While there is some hintthat effects grow larger over time, all of the 24- and 36-month confidence bounds within domainsoverlap. Noteworthy is the significant impact of the MCP on schooling which is in contrast to theCGP – recall that the MCP has many more secondary school age children, and in fact, very few CGPhouseholds actually have a child over the age of 14, so this is not a priority indicator for householdstargeted under the CGP. Another interesting difference is that by 36 months the effect of the MCPon assets is much larger than in the CGP – this is driven mainly by livestock. On the other hand,the effect of the CGP on Incomes & Revenues appears to be larger than in the MCP, at 24 months,an effect which is driven by non-farm enterprise. These hint at the different ways that the two setsof households use the cash transfer.
The main take-away from these summary results is that both cash transfer programmes generatesignificant impacts across both protective (consumption, food security) and productive domains.Both programmes also have an important effect on children’s material deprivation. And while theMCP significantly raises school enrolment among secondary school-age children, the CGP does nothave an impact on nutritional status of preschool children, despite improvements in food securityand consumption at the household level.
Figure 4 – Intent-to-treat effects in eight domains by wave (MCP)
Tables 5 (page 20) and 6 (page 21) report the point estimates and associated p-values for the numbersunderlying Figures 3 and 4, along with the unadjusted and adjusted p-values for multiple inference
page 22
Endlines 1&2 (24 and 36 months) at a glance
Effect size in SDs of the control groupConfidence intervals are adjusted using Sidak-Bonferroni
IWP21 - UCTs in Zambia.qxp_Layout 1 30/08/16 15:10 Pagina 19

20
Can Unconditional Cash Transfers Lead to Sustainable Poverty Reduction? Evidence from two government-led programmes in ZambiaInnocenti Working Paper 2016-21
Table 5 – Effects of CGP on domains indices (mean standardized ITT)
Total Food Overall Relative Incomes Incomes Finance Finance Material Schooling Anthropometricconsumption security asset poverty & Revenues & Revenues Debt Debt needs index index index
pc scale (HFIAS) index index index index index index (5-17) (11-17) (0-59m)
Impact at 24 months 0.48 0.53 0.56 1.11 0.62 0.58 0.82 -0.02 0.06(0.10)*** (0.11)*** (0.08)*** (0.11)*** (0.08)*** (0.12)*** (0.12)*** (0.07) (0.05)
Impact at 36 months 0.38 0.53 0.55 0.74 0.35 0.29 0.57 0.07 -0.06(0.07)*** (0.13)*** (0.09)*** (0.11)*** (0.07)*** (0.08)*** (0.10)*** (0.07) (0.05)
R2 0.23 0.10 0.20 0.22 0.15 0.14 0.07 0.04 0.16 0.07 0.02
N 6,813 6,776 6,815 6,813 2,272 2,272 6,667 2,272 14,798 6,027 10,074
Unadjusted0.00 0.00 0.00 0.00 0.00 0.00 0.00 0.82 0.20
p-value: 24m impact=0
Adjusted0.00 0.00 0.00 0.00 0.00 0.00 0.00 1.00 0.86
p-value: 24m impact=0
Unadjusted0.00 0.00 0.00 0.00 0.00 0.00 0.00 0.33 0.22
p-value: 36m impact=0
Adjusted0.00 0.00 0.00 0.00 0.00 0.01 0.00 0.97 0.89
p-value: 36m impact=0
Notes: Estimations use difference-in-difference modeling (single difference for the Income & Revenues indices and the Finance & Debt index at 36m). Robust standard errors clustered at the community level are inparentheses. * p<0.1 ** p<0.05; *** p<0.01. Adjusted p-values are Sidak-Bonferroni corrected p-values. Estimations are adjusted and include recipient’s age, education and marital status, household size and householddemographic composition, and districts. The Finance & Debt index at 24-months does not include debt and credit indicators; see text for further details.
IWP21 - UCTs in Zam
bia.qxp_Layout 1 30/08/16 15:10 Pagina 20

21
Can Unconditional Cash Transfers Lead to Sustainable Poverty Reduction? Evidence from two government-led programmes in ZambiaInnocenti Working Paper 2016-21
Table 6 – Effects of MCP on domains indices (mean standardized ITT)
Total Food Overall Relative Incomes Incomes Finance Finance Material Schoolingconsumption security asset poverty & Revenues & Revenues Debt Debt needs index index
pc scale (HFIAS) index index index index index index (5-17) (11-17)
Impact at 24 months 0.38 0.41 0.44 1.05 0.19 0.34 0.47 0.23(0.10)*** (0.10)*** (0.08)*** (0.11)*** (0.09)** (0.08)*** (0.10)*** (0.06)***
Impact at 36 months 0.51 0.54 0.72 0.97 0.36 0.33 0.55 0.23(0.14)*** (0.10)*** (0.09)*** (0.13)*** (0.07)*** (0.06)*** (0.08)*** (0.06)***
R2 0.27 0.08 0.25 0.17 0.07 0.06 0.08 0.03 0.07 0.04
N 8,810 8,733 8,811 8,811 2,937 2,937 2,937 2,936 18,097 10,429
Unadjusted p-value: 24m impact=0 0.00 0.00 0.00 0.00 0.04 0.00 0.00 0.00
Adjusted p-value: 24m impact=0 0.00 0.00 0.00 0.00 0.29 0.00 0.00 0.00
Unadjusted p-value: 36m impact=0 0.00 0.00 0.00 0.00 0.00 0.00 0.00 0.00
Adjusted p-value: 36m impact=0 0.00 0.00 0.00 0.00 0.00 0.00 0.00 0.00
Notes: Estimations use difference-in-difference modeling (single difference for Income & Revenues and Finance & Debt indices). Robust standard errors clustered at the community level are in parentheses.* p<0.1 ** p<0.05; *** p<0.01. Adjusted p-values are Sidak-Bonferroni corrected p-values. Estimations are adjusted and include recipient’s age, education and marital status, household size and householddemographic composition, and districts.
IWP21 - UCTs in Zam
bia.qxp_Layout 1 30/08/16 15:10 Pagina 21

22
Can Unconditional Cash Transfers Lead to Sustainable Poverty Reduction? Evidence from two government-led programmes in ZambiaInnocenti Working Paper 2016-21
across domains. Looking at the bottom of the two tables there is only one case where theadjustment for multiple inference changes the significance of the point estimate – Incomes &Revenues at 24-months in the MCP. However by 36 months the standardized estimate of theprogramme on this domain increases substantially to 0.33 and becomes statistically significanteven after adjusting the p-value.
6. RESULTS BY INDICATOR
We provide a visual summary of the results for each indicator by programme and follow-up waveto understand which specific components are driving the results shown in the previous section.As before, all effects are in standardized units with associated confidence bounds which inthis case are not adjusted for multiple inference – adjusting the p-values leads to very few changesin significance (in the CGP, out of 64 impacts estimated, only 5 are no longer significant aftercontrolling for multiple inference and in the MCP 6 out of 62). Means for each indicatorby programme and survey wave in original units are reported in Tables 7 (CGP) and 8 (MCP).Regression coefficients for each indicator, measured in actual units and with adjusted p-values,are presented in the Appendix (Tables A5–A21, pages 33-45) while impact estimates basedon SD units and a detailed write-up of the estimation results is available in the onlineSupplementary Material.
Figures 5 and 6 sum up the impacts of the CGP at 24 and 36 months on each individual indicator5
grouped by domain—for ease of reference the first indicator in each domain is the summary indexor lead indicator that was reported in the previous section. At 24-months, the programme has hadan impact on virtually all the individual items within each domain for the seven domains where theindex turns up significant. Exceptions are two of the eight components of the food security scale(the other individual indicators are not shown in the graph) and the value of harvest. By 36 monthsa few indicators are no longer significant due to ceiling effects. For example, ‘having two sets ofclothes’ and ‘thinks life will be better in the future’ reach 97 and 93 per cent for the treatment grouprespectively by the 24-month follow-up (Table 7, page 26) and have limited room for furtherimprovement while the control group values continue to trend upwards as this was a period ofstrong economic growth in Zambia. Of particular interest is the strong effect on women’s savingswhich turns out to be at least partially responsible for the impact on non-fam enterprise that isobserved in these figures (Natali et al. 2016). In the Finance & Debt domain at 36 months, the twoindicators on new borrowing and amount of outstanding debt are not significant – these were notcollected at 24 months in the CGP evaluation.
Figures 7 and 8 show results by indicator for the MCP – recall that all domain indices werestatistically significant for this programme. At 24 months five individual indicators are notstatistically different from 0. The large effects on total consumption are driven by food rather thannon-food consumption, the Income & Revenue index impacts are driven by the value of harvest andthe amount spent on agricultural inputs and the Relative Poverty index is driven by the indicator on
5The food security scale consists of eight individual questions –we only report three of the eight in these graphs andsubsequent tables.
page 25
IWP21 - UCTs in Zambia.qxp_Layout 1 30/08/16 15:10 Pagina 22

23
Can Unconditional Cash Transfers Lead to Sustainable Poverty Reduction? Evidence from two government-led programmes in ZambiaInnocenti Working Paper 2016-21
Figure 5 – Intent-to-treat effects at 24 months (CGP)
Figure 6 – Intent-to-treat effects at 36 months (CGP)
Endline 1 (24 months) at a glance
Endline 2 (36 months) at a glance
Effect size in SDs of the control group
Effect size in SDs of the control group
* A star indicates the summaryindex for each domain.Confidence intervals shown in this figureare not for multiple inference testing.
* A star indicates the summaryindex for each domain.Confidence intervals shown in this figureare not for multiple inference testing.
IWP21 - UCTs in Zambia.qxp_Layout 1 30/08/16 15:10 Pagina 23

24
Can Unconditional Cash Transfers Lead to Sustainable Poverty Reduction? Evidence from two government-led programmes in ZambiaInnocenti Working Paper 2016-21
Figure 7 – Intent-to-treat effects at 24 months (MCP)
Figure 8 – Intent-to-treat effects at 36 months (MCP)
Endline 1 (24 months) at a glance
Endline 2 (36 months) at a glance
Effect size in SDs of the control group
Effect size in SDs of the control group
* A star indicates the summaryindex for each domain.Confidence intervals shown in this figureare not for multiple inference testing.
* A star indicates the summaryindex for each domain.Confidence intervals shown in this figureare not for multiple inference testing.
IWP21 - UCTs in Zambia.qxp_Layout 1 30/08/16 15:10 Pagina 24

25
Can Unconditional Cash Transfers Lead to Sustainable Poverty Reduction? Evidence from two government-led programmes in ZambiaInnocenti Working Paper 2016-21
whether life is better than 12 months ago. At 36 months more individual indicators within theFinance & Debt domain become insignificant but this overall index continues to be significant,driven by women’s savings. As noted earlier, point estimates appear to get larger across the boardwith the exception of the Finance & Debt indicators, but none are statistically different from theirrespective 24 month impacts.
The key differences in the pattern of impacts across programmes are the strong effects on non-farmbusiness activity generated by the CGP which do not occur in the MCP, the extremely large effect onlivestock of the MCP (an effect of 0.80 SD by 36 months), and the strong effects of the MCP onschooling among older children which do not occur in the CGP. These differences can reasonably belinked to the different demographic structures across beneficiaries of the two programmes and theymay have implications for the longer term ‘graduation’ potential of the two types of households.
6.1 Effect sizes and comparison with other cash transfer programmes
It is worth highlighting some of the programme effects in actual units to compare with other cashtransfer programmes. We focus on the 36-month impacts though estimates for each round can befound in the Appendix (Tables A5–A21, pages 33-45). The increase in consumption is in the order of20 and 31 per cent for the CGP and MCP respectively, significantly higher than the 14 per centincrease in consumption reported for CCTs in Mexico (Hoddinott and Skoufias 2004), Colombia(Attanasio and Mesnard 2006) and Nicaragua (Maluccio and Flores 2005), and much larger than the5 per cent increase reported by Banerjee et al (2015) in their six-country study of graduationprogrammes but in line with the 29 per cent reported by Blattman et al (2016) for a graduation-typeprogramme in Uganda. Impacts on subjective poverty measured by ‘believes household is not verypoor’ are 20 and 30 percentage points for the CGP and MCP respectively, which mirror the patternof consumption effects.
School enrolment increases by 9 percentage points in the MCP for children aged 11-17 whichincludes the important transition years between primary and secondary school where drop outspeak. While there are no significant effects for this age group in the CGP, this is probably due to thefew children of age 14+ in those sample households. When we restrict the age range to 11-14 in theCGP we do find significant programme impacts also of 9 percentage points (Handa et al. 2016).These magnitudes compare favourably to secondary school-age schooling impacts from large CCTsin Latin America such as in Mexico (8-10 percentage points, Schultz, 2004) and Colombia(5-7 percentage points, Attanasio et al 2010) as well as from other unconditional cash transferscloser to home in Kenya (8 percentage points, Kenya CT-OVC Evaluation Team, 2012) and Ghana(8 percentage points, de Groot et al 2015).
The more provocative impacts, given the nature of the intervention, are undoubtedly related toasset accumulation and economic activity. The CGP increases participation in non-farm enterpriseby 15 points and revenues by 81 per cent or 0.45 SD. While this is much lower than the 48 pointincrease in business enterprise reported by Blattman et al (2016), the programme they evaluateprovides cash conditional on opening a business. The revenue impacts in the Zambian programmesare comparable to those reported by Banerjee et al (2015) of 0.38 SD.
IWP21 - UCTs in Zambia.qxp_Layout 1 30/08/16 15:10 Pagina 25
26
Can Unconditional Cash Transfers Lead to Sustainable Poverty Reduction? Evidence from two government-led programmes in ZambiaInnocenti Working Paper 2016-21
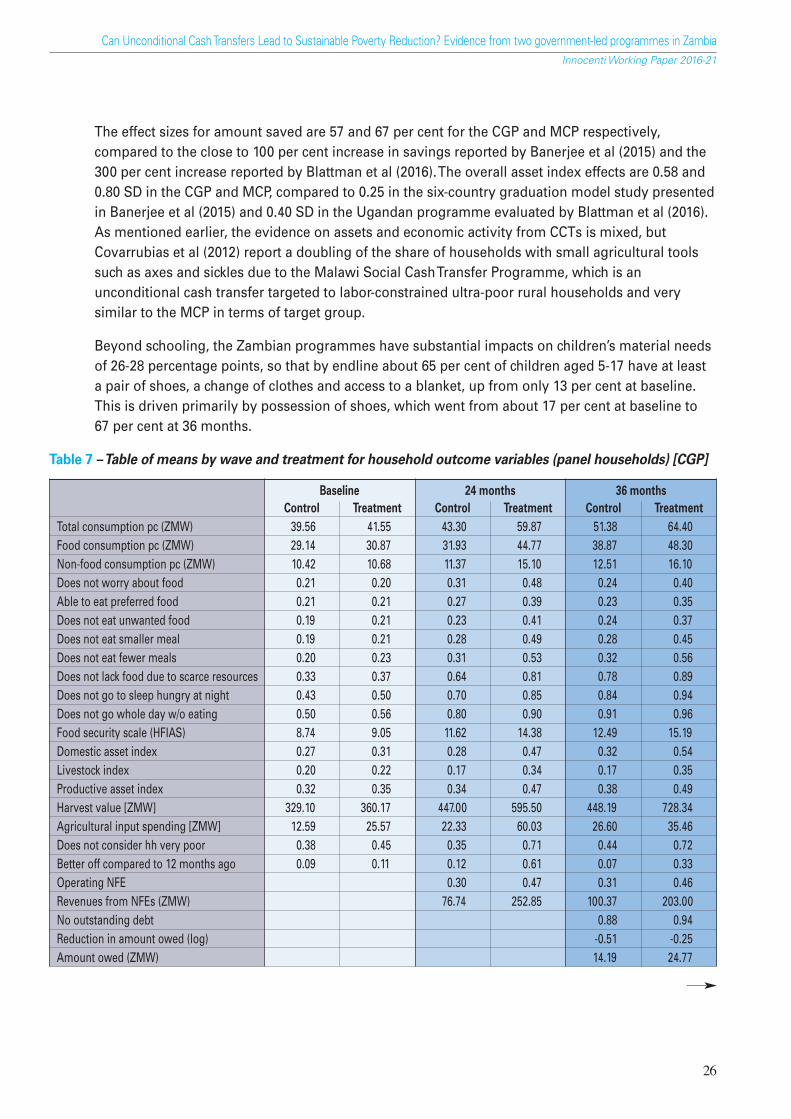
The effect sizes for amount saved are 57 and 67 per cent for the CGP and MCP respectively,compared to the close to 100 per cent increase in savings reported by Banerjee et al (2015) and the300 per cent increase reported by Blattman et al (2016). The overall asset index effects are 0.58 and0.80 SD in the CGP and MCP, compared to 0.25 in the six-country graduation model study presentedin Banerjee et al (2015) and 0.40 SD in the Ugandan programme evaluated by Blattman et al (2016).As mentioned earlier, the evidence on assets and economic activity from CCTs is mixed, butCovarrubias et al (2012) report a doubling of the share of households with small agricultural toolssuch as axes and sickles due to the Malawi Social Cash Transfer Programme, which is anunconditional cash transfer targeted to labor-constrained ultra-poor rural households and verysimilar to the MCP in terms of target group.
Beyond schooling, the Zambian programmes have substantial impacts on children’s material needsof 26-28 percentage points, so that by endline about 65 per cent of children aged 5-17 have at leasta pair of shoes, a change of clothes and access to a blanket, up from only 13 per cent at baseline.This is driven primarily by possession of shoes, which went from about 17 per cent at baseline to67 per cent at 36 months.
Table 7 –Table of means by wave and treatment for household outcome variables (panel households) [CGP]
Baseline 24 months 36 monthsControl Treatment Control Treatment Control Treatment
Total consumption pc (ZMW) 39.56 41.55 43.30 59.87 51.38 64.40Food consumption pc (ZMW) 29.14 30.87 31.93 44.77 38.87 48.30Non-food consumption pc (ZMW) 10.42 10.68 11.37 15.10 12.51 16.10Does not worry about food 0.21 0.20 0.31 0.48 0.24 0.40Able to eat preferred food 0.21 0.21 0.27 0.39 0.23 0.35Does not eat unwanted food 0.19 0.21 0.23 0.41 0.24 0.37Does not eat smaller meal 0.19 0.21 0.28 0.49 0.28 0.45Does not eat fewer meals 0.20 0.23 0.31 0.53 0.32 0.56Does not lack food due to scarce resources 0.33 0.37 0.64 0.81 0.78 0.89Does not go to sleep hungry at night 0.43 0.50 0.70 0.85 0.84 0.94Does not go whole day w/o eating 0.50 0.56 0.80 0.90 0.91 0.96Food security scale (HFIAS) 8.74 9.05 11.62 14.38 12.49 15.19Domestic asset index 0.27 0.31 0.28 0.47 0.32 0.54Livestock index 0.20 0.22 0.17 0.34 0.17 0.35Productive asset index 0.32 0.35 0.34 0.47 0.38 0.49Harvest value [ZMW] 329.10 360.17 447.00 595.50 448.19 728.34Agricultural input spending [ZMW] 12.59 25.57 22.33 60.03 26.60 35.46Does not consider hh very poor 0.38 0.45 0.35 0.71 0.44 0.72Better off compared to 12 months ago 0.09 0.11 0.12 0.61 0.07 0.33Operating NFE 0.30 0.47 0.31 0.46Revenues from NFEs (ZMW) 76.74 252.85 100.37 203.00No outstanding debt 0.88 0.94Reduction in amount owed (log) -0.51 -0.25Amount owed (ZMW) 14.19 24.77
IWP21 - UCTs in Zambia.qxp_Layout 1 30/08/16 15:10 Pagina 26

27
Can Unconditional Cash Transfers Lead to Sustainable Poverty Reduction? Evidence from two government-led programmes in ZambiaInnocenti Working Paper 2016-21
Baseline 24 months 36 monthsControl Treatment Control Treatment Control Treatment
No new borrowing 0.79 0.80Reduction in amount borrowed (log) -0.81 -0.79Amount borrowed (ZMW) 36.44 31.04
Women onlyHeld any savings 0.16 0.18 0.22 0.47 0.22 0.35Amount saved [log] 0.59 0.66 0.84 2.00 0.95 1.60Life will be better in the future 0.67 0.70 0.87 0.96 0.87 0.93
Children age 5-17Child has shoes 0.14 0.14 0.29 0.62 0.41 0.67Child has two sets of clothing 0.63 0.64 0.89 0.97 0.94 0.97Child has blanket 0.58 0.56 0.77 0.96 0.87 0.98All needs met 0.11 0.11 0.26 0.61 0.39 0.66
Children age 11-17Currently attending school 0.79 0.81 0.85 0.85 0.82 0.86Full attendance prior week 0.60 0.65 0.71 0.74 0.65 0.71
Children 0-59 monthsNot stunted 0.65 0.66 0.61 0.64 0.68 0.64Not wasted 0.94 0.94 0.95 0.96 0.93 0.93Not underweight 0.84 0.83 0.84 0.85 0.86 0.85
Table 8 –Table of means by wave and treatment for hh outcome variables (panel households) [MCP]
Baseline 24 months 36 monthsControl Treatment Control Treatment Control Treatment
Total consumption pc (ZMW) 52.04 50.23 65.45 76.98 62.80 81.59Food consumption pc (ZMW) 40.47 38.24 48.96 58.07 46.02 60.96Non-food consumption pc (ZMW) 11.57 12.00 16.49 18.92 16.78 20.63Does not worry about food 0.15 0.15 0.20 0.31 0.24 0.42Able to eat preferred food 0.16 0.14 0.19 0.31 0.26 0.42Does not eat unwanted food 0.16 0.13 0.21 0.31 0.29 0.45Does not eat smaller meal 0.17 0.16 0.26 0.38 0.33 0.50Does not eat fewer meals 0.21 0.20 0.31 0.43 0.37 0.55Does not lack food due to scarce resources 0.44 0.44 0.78 0.80 0.63 0.79Does not go to sleep hungry at night 0.54 0.52 0.82 0.90 0.72 0.86Does not go whole day w/o eating 0.60 0.58 0.92 0.96 0.78 0.89Food security scale (HFIAS) 9.35 9.26 12.25 14.04 11.49 14.16Domestic asset index 0.44 0.39 0.41 0.49 0.43 0.62Livestock index 0.30 0.26 0.22 0.37 0.25 0.49Productive asset index 0.74 0.72 0.77 0.83 0.75 0.84Harvest value [ZMW] 1,058.29 876.36 694.49 873.95 666.38 876.54Agricultural input spending [ZMW] 61.35 34.73 50.89 69.85 68.13 107.20Does not consider hh very poor 0.35 0.32 0.37 0.60 0.39 0.66
Table 7
IWP21 - UCTs in Zambia.qxp_Layout 1 30/08/16 15:10 Pagina 27

28
Can Unconditional Cash Transfers Lead to Sustainable Poverty Reduction? Evidence from two government-led programmes in ZambiaInnocenti Working Paper 2016-21
Baseline 24 months 36 monthsControl Treatment Control Treatment Control Treatment
Better off compared to 12 months ago 0.09 0.07 0.07 0.43 0.10 0.43Operating NFE 0.12 0.10 0.08 0.10Revenues from NFEs (ZMW) 19.34 32.38 16.18 29.12No outstanding debt 0.93 0.96 0.96 0.97Reduction in amount owed (log) -0.27 -0.15 -0.14 -0.12Amount owed (ZMW) 8.87 5.02 5.04 7.63No new borrowing 0.82 0.88 0.85 0.87Reduction in amount borrowed (log) -0.70 -0.49 -0.64 -0.55Amount borrowed (ZMW) 17.61 14.52 22.50 15.71
Women onlyHeld any savings 0.12 0.12 0.19 0.34 0.11 0.26Amount saved [log] 0.41 0.40 0.79 1.41 0.43 1.09Life will be better in the future 0.77 0.80 0.85 0.92 0.82 0.90
Children age 5-17Child has shoes 0.22 0.19 0.41 0.60 0.44 0.66Child has two sets of clothing 0.79 0.74 0.96 0.97 0.91 0.97Child has a blanket 0.63 0.58 0.83 0.93 0.80 0.93All needs met 0.17 0.14 0.38 0.57 0.40 0.63
Children age 11-17Currently attending 0.80 0.75 0.70 0.76 0.66 0.71Full attendance prior week 0.64 0.60 0.53 0.56 0.43 0.48
Heterogeneous impacts
We investigated whether there were heterogeneous programme impacts by baseline levels ofconsumption (Table A22, page 45). We found no indication that impacts depended on baseline levelsof consumption.
7. DISCUSSION AND CONCLUSION
A relatively simple flat cash transfer, unconditional and paid bimonthly, has wide-ranging effects onultra-poor households in rural Zambia, significantly raising consumption, food security andchildren’s schooling and material well-being, while at the same time strengthening economiccapacity and assets. The annual amount transferred to a household is USD144 (or USD288 PPP).We compare this annual transfer to what households spend based on the estimates shown above.We track and/or quantify all expenditure that we can measure in our survey instrument, notablyconsumption expenditures, savings, debt reduction, spending on non-consumption items such asagricultural inputs (tools, seeds, fertilizer) and livestock purchases. For productive tools andlivestock, we estimate the impact on the number purchased and monetize using market prices takeneither from the community price questionnaire fielded as part of the evaluation, from the NationalLiving Standards Measurement Survey if not in our own survey, or by direct observation in localmarkets. Other spending items are already measured in Kwacha. All monetary values are deflated
Table 8
IWP21 - UCTs in Zambia.qxp_Layout 1 30/08/16 15:10 Pagina 28

29
Can Unconditional Cash Transfers Lead to Sustainable Poverty Reduction? Evidence from two government-led programmes in ZambiaInnocenti Working Paper 2016-21
to baseline Kwacha (2010 for CGP and 2011 for MCP), annualized, and compared to the annualamount transferred to each household in Kwacha. Only statistically significant impacts areconsidered. We base our calculations on 24-month impact estimates, 36-month impact estimates,and the average of the 24- and 36-month impact estimates (pooled impact estimates) to get a rangeof estimated spending.
Results of this exercise are shown in Table 9, and range from 1.23 in the CGP at 36-months to 2.08 inthe MCP at 36 months. Using the pooled estimates and averaging across both programmes gives amultiplier of 1.59. This means that households spend 59 per cent more ZMW than they actuallyreceive through the cash transfer. This multiplier must operate through increased income evoked bythe cash transfer. For the CGP this is through non-farm business activity and the increased revenuegenerated from these businesses. The CGP also has a significant impact on the value of sales ofagricultural products (Daidone et al 2014). For the MCP, this is through the value of crop production,and given the large increment in livestock holdings, possibly through the sale of livestock-derivedproducts such as eggs though we do not capture these revenue sources in our data.6
Table 9 – Estimated multiplier effects of the two programmes
Notes: The multiplier effect is computed as the ratio of the sum total ofannualized spending impacts over the annual value of the transfer; spendingimpacts include: consumption, savings, loan repayment, livestock purchasesand productive tools. Impacts are based on estimated econometric resultsreported in the Appendix (and pooled estimates, available upon request).Only statistically significant (at the 5 per cent level) impact estimates areconsidered. Loan repayments were not measured in the CGP at 24 months.
These estimates are not directly comparable to those from Banerjee et al (2015), who considerthe initial two years of the graduation programme as the investment period, and then calculate thebenefits as the present value of the future stream of consumption and revenue assumingthat benefits one year after the programme ended are maintained permanently. Our estimates donot assume an investment period because the goal of these UCTs is protection and not investment.For this reason we prefer a ‘follow the money’ approach to see if the programme leads tohouseholds boosting their spending over and above what they actually receive, a multiplier thatwould be generated if households used some of it to improve their income-earning capacity.
The generalizability of the results presented here is quite high. The majority of existing national cashtransfer programmes in SSA are unconditional and target beneficiaries at similar levels of poverty.In terms of demographic structure, large programmes in Ethiopia, Ghana, Kenya, Malawi,
6 Spending and investments of programme participants can generate impacts beyond the beneficiary population througheconomic transactions. Our collaborators at the FAO have estimated a local economy multiplier of the CGP of 1.79, withthe majority of these spill-overs occurring to non-beneficiaries (Thome et al. 2016 ). Hence the estimates reported hereare under-estimates of the total multiplier generated by these programmes.
CGP MCP24-month impacts 1.64 [0.96-2.33] 1.38 [0.63-2.10]36-month impacts 1.23 [0.65-1.81] 2.08 [1.09-3.07]Pooled impacts 1.46 [0.88-2.05] 1.72 [0.94-2.50]
IWP21 - UCTs in Zambia.qxp_Layout 1 30/08/16 15:10 Pagina 29

30
Can Unconditional Cash Transfers Lead to Sustainable Poverty Reduction? Evidence from two government-led programmes in ZambiaInnocenti Working Paper 2016-21
Mozambique and Zimbabwe target so-called ‘labour-constrained’ households with high dependencyratios and demographic profiles similar to the MCP, while the largest cash transfer programme on thecontinent is the South African Child Support Grant which targets children up to age 17. Like the twoZambian programmes, these are all implemented by national governments and are unconditional.
It has recently been suggested that all development interventions should be ‘benchmarked’ againsta ‘pure’ unconditional cash transfer.7 If the two Zambian programmes studied here represent sucha benchmark, the results in this paper suggest a high bar for other interventions to match. It is notstraightforward to compare these programmes with the graduation models without a head-to-headcomparison. A quick comparison of results with the graduation model evaluated by Banerjee et al(2015) suggests a range of effects and effect sizes which are comparable. However Banerjee et al(2015) measured impacts one year after the programme ended and three years after the initial assetplus cash injection began. The estimates we present are while the programme is ongoing, andwe therefore cannot make any conclusions about the long-run sustainability of these impacts ifbeneficiaries stopped receiving cash. Indeed our knowledge of the local context suggests to us thatin the absence of any additional interventions to increase skills, or provide new farming technology,or improve off-farm employment opportunities, it would not be surprising to see these effectsdisappear a few years after households were ‘graduated’ from the programme.
Perhaps a more relevant comparison to consider is between an unconditional and conditional cashtransfer. A few experiments have been designed to make head-to-head comparisons betweenconditional and unconditional programmes (e.g. Baird et al. 2011) but these necessarily focus onoutcomes that are subject to conditions (typically school enrolment and health care use), whereaswhat the Zambia evaluations hint at is what conditional programmes might lose by forcingbeneficiaries to focus on health and schooling, such as increased economic productivity and assetaccumulation which are core to household survival and can also generate increases in demand forschooling and health through income effects. In the Zambia case, the impacts on schooling,typically an outcome that is a focus of the CCT programmes, are well within the range of thosereported for large-scale CCTs in Colombia and Mexico.
In conclusion, two government-led unconditional cash transfer programmes in rural Zambia lead tostrong protective and productive impacts for ultra-poor households. Some of the impacts onconsumption and asset accumulation are comparable to graduation type programmes recentlyevaluated in the literature, while the schooling impacts are comparable to those generated by CCTsin Latin America. The overarching objective of unconditional cash transfers is to support foodsecurity and consumption, and productive objectives tend to be secondary. However the results wepresent imply sizeable productive effects, leading to income multipliers of around 59 per cent onaverage. Are these households ready to graduate? Given the extreme poverty and harshenvironmental conditions facing them, it would very likely take more than just USD12 per month forthree years to permanently move these households out of poverty. Nevertheless, unconditionalcash transfer programmes are clearly not ‘hand-outs’ that lead to dependency. By allowinghouseholds to meet their consumption needs and to eventually diversify livelihoods andaccumulate assets, they can make an important contribution to the inclusive growth agenda of thegovernments of developing countries.
7 http://www.cgdev.org/event/cash-transfers-new-benchmark-foreign-aid
IWP21 - UCTs in Zambia.qxp_Layout 1 30/08/16 15:10 Pagina 30

31
Can Unconditional Cash Transfers Lead to Sustainable Poverty Reduction? Evidence from two government-led programmes in ZambiaInnocenti Working Paper 2016-21
REFERENCES
Abdi, H. (2007). ‘Bonferroni and Šidák Corrections for Multiple Comparisons.’ In Encyclopedia ofMeasurement and Statistics, edited by N. J. Salkind. Thousand Oaks, CA: Sage.
Anderson, M. L. (2008). ‘Multiple Inference and Gender Differences in the Effects of Early Intervention: AReevaluation of the Abecedarian, Perry Preschool, and Early Training Projects.’ Journal of theAmerican Statistical Association 103 (484): 1481–1495.
AIR (2011). Zambia’s Child Grant Program: Baseline Report, American Institutes for Research Washington DC.
AIR (2013). Zambia’s Child Grant Program: 24-month impact report. Washington, DC: Author.
AIR (2014a). Zambia’s Child Grant Program: 36-month impact report. Washington, DC: Author.
AIR (2012). Zambia’s Multiple Category Cash Transfer Program: Baseline Report, American Institutes forResearch Washington DC.
AIR (2014b). Zambia’s Multiple Category Cash Transfer Program: 24-month impact report. Washington,DC: Author.
AIR (2015). Zambia’s Multiple Category Cash Transfer Program: 36-month impact report. Washington,DC: Author.
Attanasio, O. and A. Mesnard (2006). ‘The Impact of a Conditional Cash Transfer Programme onConsumption in Colombia’, Fiscal Studies 27 (4), 421–442.
Attanasio, O., Fitzsimons, E., Gomez, A., Gutiérrez, MI., Meghir, C. & Mesnard, A. (2010). Children’sschooling and work in the presence of a conditional cash transfer programme in rural Colombia.Economic Development and Cultural Change, 58(2): 181–210.
Baird, S., McIntosh, C. and Ozler, B. (2011). ‘Cash or Condition? Evidence from a Cash Transfer Experiment,’The Quarterly Journal of Economics, Oxford University Press, vol. 126(4), pages 1709-1753.
Bandiera, O., Burgess, R., Das, N., Gulesci, S., Rasul, I. and Sulaiman, M. (2016). ‘Labor markets andpoverty in Village Economies,’ LSE working paper.
Banerjee, A., E. Duflo, N. Goldberg, D. Karlan, R. Osei, W. Pariente, J. Shapiro, B. Thuysbaert, and C.Udry (2015). ‘A Multifaceted Program Causes Lasting Progress for the Very Poor: Evidence from SixCountries.’ Science 348, no. 6236 (May 14, 2015): 1260799–1260799.
Blattman, C., E. P. Green, J. C. Jamison, M. C. Lehmann, and J. Annan (2016). The Returns toMicroenterprise Support among the Ultra-Poor: A Field Experiment in Post-War Uganda. AmericanEconomic Journal: Applied Economics, 8(2):35-64.
Covarrubias, K., Davis, B. and Winters, P. (2012). From protection to production: productive impacts ofthe Malawi Social Cash Transfer scheme, Journal of Development Effectiveness, 4:1, 50-77.
de Groot, R., Handa, S., Park, M., Darko, R. O., Osei-Akoto, I., Bhalla, G. and Ragno, L.P. (2015).Heterogeneous Impacts of an Unconditional CashTransfer Programme on Schooling: Evidencefrom the Ghana LEAP Programme, Innocenti Working Paper no. 2015-10, UNICEF Office of Research -Innocenti, Florence.
Daidone, S., Asfaw, S., Davis, B., Handa, S., and Winters, P. (2016). ‘The household and individual-leveleconomic impacts of cash transfer programmes in Sub-Saharan Africa’ FAO, Rome.
IWP21 - UCTs in Zambia.qxp_Layout 1 30/08/16 15:10 Pagina 31

32
Can Unconditional Cash Transfers Lead to Sustainable Poverty Reduction? Evidence from two government-led programmes in ZambiaInnocenti Working Paper 2016-21
Daidone, S., Davis, B., Dewbre, J., González-Flores, M., Handa, S., Seidenfeld, D. and Tembo, G. (2014).Zambia’s Child Grant Programme: 24-month impact report on productive activities and labourallocation, FAO, Rome.
Garcia, M. and C., Moore (2012). The Cash Dividend: The Rise of Cash Transfer Programs in Sub-SaharanAfrica. Washington, DC, The World Bank.
Gertler, P., Martinez, S. W. and M. Rubio-Codina (2012). Investing Cash Transfers to Raise Long-TermLiving Standards. American Economic Journal: Applied Economics, 4(1): 164-92.
Handa, S., Natali, L., Seidenfeld, D., Tembo, G. and the Zambia Cash Transfer Evaluation Team (2016).The Impact of Zambia’s Unconditional Child Grant on Schooling and Work: Results from a large-scale social experiment, Journal of Development Effectiveness (forthcoming).
Handa, S., Seidenfeld, D., Davis, B., Tembo, G. and the Zambia Cash Transfer Evaluation Team (2016).The Social and Productive Impacts of Zambia’s Child Grant, Journal of Policy Analysis andManagement, Volume 35, Issue 2, pages 357–387, Spring 2016
Hoddinott, J. and E. Skoufias (2004). ‘The Impact of PROGRESA on Food Consumption’, EconomicDevelopment and Cultural Change 53 (1), 37–61.
Kenya CT-OVC Evaluation Team (2012). The Impact of Kenya’s Cash Transfer for Orphans and VulnerableChildren on Human Capital. Journal of Development Effectiveness, Vol. 4(1): pp.38-49.
King, E. and J. Behrman (2009). Timing and Duration of Exposure in Evaluation of Social Programs,World Bank Research Observer, 24(1): 55-82.
Kling, J., Liebman, J., and Katz, L. (2007). Experimental analysis of neighborhood effects. Econometrica75, 83–119 (2007).
Maluccio, J. and R. Flores (2005). Impact Evaluation of the Pilot Phase of the Nicaraguan Red de ProtecciónSocial. Research Report 141.Washington, D.C.: International Food Policy Research Institute.
Maluccio, J. (2010). The Impact of Conditional Cash Transfers on Consumption and Investment inNicaragua, Journal of Development Studies, 46, issue 1, p. 14-38.
Natali, L., S. Handa, A. Peterman, D. Seidenfeld, G. Tembo, Zambia Cash Transfer Evaluation Team (2016).Making Money Work: Unconditional cash transfers allow women to save and re-invest in ruralZambia, Innocenti Working Paper No.2016-02, UNICEF Office of Research, Florence.
PtoP (2014). The Economic Impacts of Cash Transfer Programmes in sub-Saharan Africa, FAO Policy Brief.
Raza, W. A., Das, N. C. and F. A. Misha (2012) Can Ultrapoverty be Sustainably Improved? Evidence fromBRAC in Bangladesh, Journal of Development Effectiveness, 4:2, 257-276.
Schultz, T. (2004). School Subsidies for the Poor: Evaluating the Mexican Progresa poverty program, Journalof Development Economics, Elsevier, vol. 74(1), pages 199-250, June.
Seidenfeld, D., Handa, S., Tembo, G., Michelo, S., Harland Scott, C. and Prencipe, L. (2014). The Impact ofan Unconditional Cash Transfer on Food Security and Nutrition: The Zambia Child GrantProgrammeme, IDS Bulletin, September 2014.
Thome, K., Taylor, J.E., Filipski, M., Davis, B., Handa, S. (2016). The Local Economy Impacts of SocialCash Transfers: A comparative analysis of seven sub-Saharan countries, FAO.
World Bank (2015). The State of Social Safety Nets 2015. Washington, DC: World Bank.
IWP21 - UCTs in Zambia.qxp_Layout 1 30/08/16 15:10 Pagina 32

33
Can Unconditional Cash Transfers Lead to Sustainable Poverty Reduction? Evidence from two government-led programmes in ZambiaInnocenti Working Paper 2016-21
DOMAIN
CONSUMPTION
FOOD SECURITY
ASSETS
FINANCE / DEBT
Indicators
Overall per capita consumption Food consumption
Non-food consumption
Never or rarely worries about foodAble to eat preferred foodNever or rarely eats food he/she does not wantto it due to lack of resources Never or rarely eats smaller meal than neededNever or rarely eats fewer meals because thereis not enough food Never or rarely has no food to eat because oflack of resourcesNever or rarely goes to sleep hungry Never or rarely goes a whole day/night w/oeating
Food security scale (HFIAS, 0-24 where highermeans more food secure)*
Domestic Asset indexLivestock index
Productive index
Savings, extensive marginSavings, intensive margin
Whether household has new loan
Reduction in the amount borrowedNot having an outstanding longer-term loan(loans taken out more than 6 months before thefollow-up considered)Reduction in the amount owed
Level
Household(pc)
Household
Household
Woman
Household
Sum of responses for 217 individualconsumption item for food and non-food.Module taken in its entirety from Zambia LivingConditions Monitoring Survey. Recall periodranges from last 7 days for frequent items tolast month, last 3 months and last 12 months forless frequent items. Food includes value of ownproduction. All items include value of gifts.Aggregate deflated by household size andfurther deflated to study baseline (either 2010or 2011). Logged.
Reference period is last 4 weeks.Codes are 0=never; 1=rarely(once or twice);2=sometimes (3-10 times); 3=often (more than10 times). We turn this categorical variable intoa dummy by considering food secure those thatnever or rarely (codes 0 and 1) experience eachone of the 8 situations described.
Scale score created by aggregating theresponses to the eight individual food securityquestions.
Computed by PCA on number of householdassets/livestock/productive assets owned(restricting to assets for which informationis available in all waves). The index is thenturned positive through a monotonictransformation and then logged.
Binary variable equals to 1 if woman is currentlysaving in cashAmount saved by women in the last monthIn the last year did you or anyone in thehousehold borrow money from any personor institution?How much did your household borrow overallfrom each source, in the last 6 months?Does your household still owe money for anyloan contracted before …? (6 months beforefollow-up considered)How much does your household still owe?
APPENDIX
Table A1 – Indicator definitions
IWP21 - UCTs in Zambia.qxp_Layout 1 30/08/16 15:10 Pagina 33

34
Can Unconditional Cash Transfers Lead to Sustainable Poverty Reduction? Evidence from two government-led programmes in ZambiaInnocenti Working Paper 2016-21
DOMAIN
INCOMEANDREVENUES
RELATIVE(and/or subjective)POVERTY
MATERIAL NEEDS
SCHOOLING
NUTRITION OFYOUNG CHILDREN[CGP only]
Indicators
Value of harvest ZMW Total crop expenditures
NFEs [operating or not]
NFEs [revenues]
Not considering household very poor
Better off compared to 12 months ago
Think life will be better than it is now ineither 1, 3 or 5 years
Shoes
BlanketTwo sets of clothes
All needs met*
School enrolmentDays attended in prior week
Not underweight
Not wasted
Not stunted
Level
Household
Household
Woman
Child(5-17)
Child(11-17)
Child(0-5)
Did you operate any non-farm enterprises orprovide any services (store, transport, homebrewing, trade, etc) in the last 12 months?Total revenue from these businesses in anaverage month.
Do you consider your household to be non-poor,moderately poor or very poor?Compared to 12 months ago, do you consideryour household to be better off, the same orworse-off now?Do you think your life will be better in[…] from now?[…] from 1 year[…] from 3 years[…] from 5 yearsIn this case the variable, is a dummy equal toone if any of the three questions reported aboveis equal to one.
Does […] have a pair of shoes?Does […] have a blanket? (either sharedor owned)Does […] have at least two sets of clothes?Dummy variable equal to 1 if the child has all theabove needs (shoes, blanket, clothes) met.
Is […] currently attending school?How many days did […] attend in the past week?
Underweight (moderate) definition: belowminus two standard deviations from medianweight for age of reference population.Wasting (moderate): below minus two standarddeviations from median weight for weight ofreference population.Stunting (moderate): below minus two standarddeviations from median height for age ofreference population.
Table A1
IWP21 - UCTs in Zambia.qxp_Layout 1 30/08/16 15:10 Pagina 34

35
Can Unconditional Cash Transfers Lead to Sustainable Poverty Reduction? Evidence from two government-led programmes in ZambiaInnocenti Working Paper 2016-21
Table A2 – Baseline balance tests for children [0-59m] indicators (balanced household panel) [CGP]
All Control Treatment P-value of differenceNot stunted 0.65 0.65 0.66 0.65Not wasted 0.94 0.94 0.94 0.45Not underweight 0.84 0.84 0.83 0.65Child’s weight-for-age: z-score -0.90 -0.87 -0.93 0.32Child’s height-for-age: z-score -1.41 -1.41 -1.42 0.92Underweight 0.16 0.16 0.17 0.65
P-values are reported from Wald tests on the equality of means of Treatment and Control for each variable. Standard errorsare clustered at the community level. N=3,564; of which 1,778 in the treatment group.
Table A3 – Attrition analysis of key and outcome indicators among hhs at baseline [CGP] balanced panel
Control Treatment DifferenceAttritors Non- P-value Attritors Non- P-value Col(1)- P-value
attritors attritors Col(4)(1) (2) (3) (4) (5) (6) (7) (8)
Recipient widowed 0.06 0.06 1.00 0.12 0.06 0.08 -0.05 0.21Recipient never married 0.06 0.11 0.02 0.07 0.11 0.08 -0.01 0.75Recipient divorced or separated 0.08 0.09 0.79 0.08 0.06 0.43 -0.00 0.94Recipient ever attended school 0.79 0.70 0.01 0.79 0.74 0.16 0.00 0.95Female recipient 0.98 0.99 0.33 0.98 0.99 0.71 0.00 0.95Age of recipient 30.20 29.58 0.56 31.36 29.91 0.11 -1.16 0.43Household size 5.66 5.63 0.90 5.71 5.76 0.85 -0.05 0.88Number of people aged 0-5 2.10 1.90 0.00 1.80 1.89 0.28 0.30 0.00Number of people aged 6-12 1.15 1.27 0.35 1.31 1.27 0.77 -0.15 0.40Number of people aged 13-18 0.46 0.53 0.33 0.61 0.60 0.86 -0.15 0.14Number of people aged 19-35 1.28 1.30 0.75 1.30 1.36 0.46 -0.02 0.85Number of people aged 36-55 0.55 0.54 0.85 0.58 0.54 0.59 -0.03 0.74Number of people aged 56 - 69 0.10 0.07 0.19 0.08 0.07 0.71 0.02 0.62Number of people aged 70 or older 0.02 0.03 0.30 0.03 0.03 0.88 -0.02 0.37Total household expenditure per personin the household 38.32 39.60 0.69 40.83 41.57 0.85 -2.51 0.61
Value of harvest 509.17 328.84 0.02 280.32 360.12 0.10 228.85 0.02Does not worry about food 0.13 0.21 0.09 0.23 0.20 0.62 -0.09 0.15Able to eat preferred food 0.13 0.21 0.07 0.23 0.21 0.71 -0.10 0.10Does not go to sleep hungry at night 0.40 0.43 0.61 0.44 0.50 0.27 -0.04 0.60Does not go whole day w/o eating 0.48 0.50 0.75 0.55 0.56 0.85 -0.07 0.47Food security scale (HFIAS) 7.92 8.73 0.21 9.29 9.04 0.66 -1.37 0.09Owned any chickens in last 12 months 0.37 0.43 0.15 0.33 0.44 0.02 0.04 0.45Owned any goats in last 12 months 0.04 0.01 0.15 0.03 0.03 0.59 0.01 0.56Owns a pick 0.02 0.03 0.80 0.01 0.03 0.06 0.02 0.30
Overall N for control is 1,259 (In study/non-attritors=1,133; Attritors=126). Overall N for treated is 1,260 (In study/non-attritors=1,139; Attritors=121).*** p<0.01, ** p<0.05, *** p<0.1 T-tests based on standard errors clustered at the community level.
IWP21 - UCTs in Zambia.qxp_Layout 1 30/08/16 15:10 Pagina 35

36
Can Unconditional Cash Transfers Lead to Sustainable Poverty Reduction? Evidence from two government-led programmes in ZambiaInnocenti Working Paper 2016-21
Table A4 – Attrition analysis of key household indicators at baseline [MCP]
Control Treatment DifferenceAttritors Non- P-value Attritors Non- P-value Col(1)- P-value
attritors attritors Col(4)(1) (2) (3) (4) (5) (6) (7) (8)
Household size 4.66 5.02 0.41 4.78 5.00 0.46 -0.12 0.83Number of people aged 0-5 0.87 0.68 0.20 0.79 0.73 0.48 0.07 0.67Number of people aged 6-12 1.00 1.23 0.29 1.01 1.31 0.01 -0.01 0.96Number of people aged 13-18 0.74 0.98 0.09 0.90 0.93 0.80 -0.16 0.38Number of people aged 19-35 0.81 0.82 0.91 0.87 0.76 0.36 -0.06 0.72Number of people aged 36-55 0.49 0.54 0.67 0.53 0.52 0.89 -0.04 0.77Number of people aged 56-69 0.34 0.37 0.67 0.23 0.39 0.00 0.11 0.19Number of people aged 70 or older 0.42 0.40 0.82 0.45 0.36 0.15 -0.03 0.75Total household expenditure per personin the household 62.01 51.50 0.12 70.01 49.71 0.01 -8.00 0.45
Female recipient 0.79 0.75 0.46 0.77 0.76 0.84 0.02 0.78Recipient age 57.81 56.97 0.73 55.45 56.16 0.73 2.36 0.48Recipient widowed 0.09 0.55 0.00 0.06 0.56 0.00 0.04 0.46Recipient never married 0.04 0.04 0.95 0.03 0.03 0.86 0.00 0.92Recipient divorced 0.08 0.10 0.57 0.07 0.09 0.33 0.01 0.88Recipient ever attended school 0.66 0.64 0.81 0.64 0.64 0.94 0.02 0.85Value of harvest 708.16 1,058.37 0.00 836.69 874.64 0.75 -128.54 0.42Does not worry about food 0.17 0.15 0.70 0.16 0.15 0.86 0.01 0.86Able to eat preferred food 0.16 0.16 0.98 0.15 0.14 0.87 0.01 0.92Does not go to sleep hungry at night 0.56 0.54 0.84 0.69 0.52 0.00 -0.13 0.16Does not go whole day w/o eating 0.62 0.60 0.79 0.70 0.58 0.03 -0.09 0.33Food security scale (HFIAS) 9.44 9.34 0.90 10.29 9.25 0.09 -0.85 0.38Owned any chickens in last 12 months 0.38 0.50 0.11 0.44 0.45 0.78 -0.05 0.60Owned any goats in last 12 months 0.04 0.13 0.00 0.09 0.10 0.74 -0.05 0.16Owns a pick 0.06 0.09 0.32 0.11 0.07 0.15 -0.06 0.23
Overall N for control is 1,517 (In study/non-attritors=1,464; Attritors=53). Overall N for treated is 1,561 (In study/non-attritors=1,474; Attritors=87).*** p<0.01, ** p<0.05, *** p<0.1 T-tests based on standard errors clustered at the community level.
IWP21 - UCTs in Zambia.qxp_Layout 1 30/08/16 15:10 Pagina 36
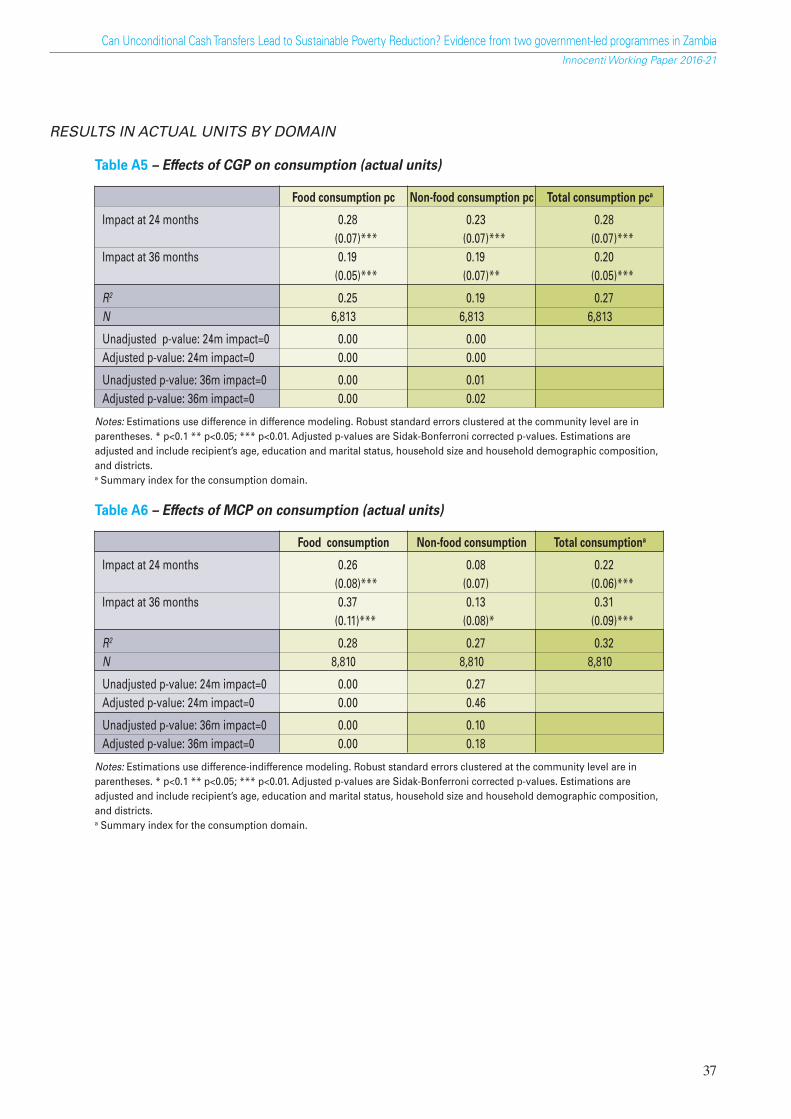
37
Can Unconditional Cash Transfers Lead to Sustainable Poverty Reduction? Evidence from two government-led programmes in ZambiaInnocenti Working Paper 2016-21
RESULTS IN ACTUAL UNITS BY DOMAIN
Table A5 – Effects of CGP on consumption (actual units)
Food consumption pc Non-food consumption pc Total consumption pca
Impact at 24 months 0.28 0.23 0.28(0.07)*** (0.07)*** (0.07)***
Impact at 36 months 0.19 0.19 0.20(0.05)*** (0.07)** (0.05)***
R2 0.25 0.19 0.27N 6,813 6,813 6,813
Unadjusted p-value: 24m impact=0 0.00 0.00Adjusted p-value: 24m impact=0 0.00 0.00
Unadjusted p-value: 36m impact=0 0.00 0.01Adjusted p-value: 36m impact=0 0.00 0.02
Notes: Estimations use difference in difference modeling. Robust standard errors clustered at the community level are inparentheses. * p<0.1 ** p<0.05; *** p<0.01. Adjusted p-values are Sidak-Bonferroni corrected p-values. Estimations areadjusted and include recipient’s age, education and marital status, household size and household demographic composition,and districts.a Summary index for the consumption domain.
Table A6 – Effects of MCP on consumption (actual units)
Food consumption Non-food consumption Total consumptiona
Impact at 24 months 0.26 0.08 0.22(0.08)*** (0.07) (0.06)***
Impact at 36 months 0.37 0.13 0.31(0.11)*** (0.08)* (0.09)***
R2 0.28 0.27 0.32N 8,810 8,810 8,810
Unadjusted p-value: 24m impact=0 0.00 0.27Adjusted p-value: 24m impact=0 0.00 0.46
Unadjusted p-value: 36m impact=0 0.00 0.10Adjusted p-value: 36m impact=0 0.00 0.18
Notes: Estimations use difference-indifference modeling. Robust standard errors clustered at the community level are inparentheses. * p<0.1 ** p<0.05; *** p<0.01. Adjusted p-values are Sidak-Bonferroni corrected p-values. Estimations areadjusted and include recipient’s age, education and marital status, household size and household demographic composition,and districts.a Summary index for the consumption domain.
IWP21 - UCTs in Zambia.qxp_Layout 1 30/08/16 15:10 Pagina 37

38
Can Unconditional Cash Transfers Lead to Sustainable Poverty Reduction? Evidence from two government-led programmes in ZambiaInnocenti Working Paper 2016-21
Table A7 – Effects of CGP on food security (actual units)
Does not Able to Does not Does not Does not Does not Does not Does not Foodworry eat eat eat eat lack food go to go whole securityabout preferred unwanted smaller fewer food due sleep day w/o scalefood food food meal meals to scarse hungry eating (HFIAS)a
resources
Impact at 24 months 0.17 0.12 0.15 0.18 0.19 0.14 0.08 0.04 2.46(0.05)*** (0.05)** (0.05)*** (0.05)*** (0.05)*** (0.05)** (0.06) (0.06) (0.61)***
Impact at 36 months 0.16 0.11 0.11 0.15 0.21 0.07 0.03 -0.01 2.39(0.05)*** (0.05)** (0.05)** (0.05)*** (0.05)*** (0.05) (0.05) (0.05) (0.69)***
R2 0.06 0.04 0.04 0.07 0.09 0.21 0.19 0.19 0.22N 6,815 6,802 6,813 6,812 6,810 6,804 6,813 6,808 6,776
Unadjusted p-value:24m impact=0
0.00 0.02 0.01 0.00 0.00 0.01 0.17 0.52
Adjusted p-value:24m impact=0
0.01 0.16 0.04 0.01 0.00 0.09 0.78 1.00
Unadjusted p-value:36m impact=0
0.00 0.04 0.04 0.01 0.00 0.22 0.52 0.88
Adjusted p-value:36m impact=0
0.02 0.30 0.31 0.05 0.00 0.87 1.00 1.00
Notes: See notes to Table A5.a Summary index for the food security domain.
Table A8 – Effects of MCP on food security (actual units)
Does not Able to Does not Does not Does not Does not Does not Does not Foodworry eat eat eat eat lack food go to go whole securityabout preferred unwanted smaller fewer food due sleep day w/o scalefood food food meal meals to scarse hungry eating (HFIAS)a
resources
Impact at 24 months 0.11 0.13 0.14 0.13 0.13 0.03 0.11 0.05 1.88(0.04)*** (0.04)*** (0.04)*** (0.04)*** (0.04)*** (0.05) (0.05)** (0.04) (0.49)***
Impact at 36 months 0.18 0.18 0.19 0.18 0.17 0.16 0.17 0.13 2.75(0.05)*** (0.05)*** (0.04)*** (0.04)*** (0.04)*** (0.04)*** (0.04)*** (0.04)*** (0.56)***
R2 0.05 0.06 0.07 0.07 0.07 0.13 0.15 0.16 0.17N 8,800 8,778 8,801 8,799 8,792 8,794 8,802 8,801 8,733
Unadjusted p-value: 0.01 0.01 0.00 0.00 0.00 0.51 0.03 0.2124m impact=0Adjusted p-value: 0.08 0.04 0.02 0.01 0.03 1.00 0.20 0.8424m impact=0
Unadjusted p-value: 0.00 0.00 0.00 0.00 0.00 0.00 0.00 0.0036m impact=0Adjusted p-value: 0.00 0.00 0.00 0.00 0.00 0.00 0.00 0.0336m impact=0
Notes: See notes to Table A6.a Summary index for the food security domain.
IWP21 - UCTs in Zambia.qxp_Layout 1 30/08/16 15:10 Pagina 38

39
Can Unconditional Cash Transfers Lead to Sustainable Poverty Reduction? Evidence from two government-led programmes in ZambiaInnocenti Working Paper 2016-21
Table A9 – Effects of CGP on assets (actual units)
Asset index Livestock index Productive asset index
Impact at 24 months 0.15 0.15 0.10(0.02)*** (0.03)*** (0.03)***
Impact at 36 months 0.18 0.16 0.09(0.03)*** (0.03)*** (0.03)***
R2 0.21 0.11 0.11N 6,801 6,808 6,794
Unadjusted p-value: 24m impact=0 0.00 0.00 0.00Adjusted p-value: 24m impact=0 0.00 0.00 0.00
Unadjusted p-value: 36m impact=0 0.00 0.00 0.00Adjusted p-value: 36m impact=0 0.00 0.00 0.01
Notes: Estimations use difference in difference modeling. Robust standard errors clustered at the community level are inparentheses. * p<0.1 ** p<0.05; *** p<0.01. Adjusted p-values are Sidak-Bonferroni corrected p-values. Estimations areadjusted and include recipient’s age, education and marital status, household size and household demographic composition,and districts.
Table A10 – Effects of MCP on assets (actual units)
Asset index Livestock index Productive asset index
Impact at 24 months 0.13 0.19 0.08(0.04)*** (0.03)*** (0.03)***
Impact at 36 months 0.24 0.28 0.11(0.04)*** (0.04)*** (0.03)***
R2 0.13 0.12 0.25N 8,801 8,580 8,801
Unadjusted p-value: 24m impact=0 0.00 0.00 0.01Adjusted p-value: 24m impact=0 0.00 0.00 0.02
Unadjusted p-value: 36m impact=0 0.00 0.00 0.00Adjusted p-value: 36m impact=0 0.00 0.00 0.00
Notes: Estimations use difference-indifference modeling. Robust standard errors clustered at the community level are inparentheses. * p<0.1 ** p<0.05; *** p<0.01. Adjusted p-values are Sidak-Bonferroni corrected p-values. Estimations areadjusted and include recipient’s age, education and marital status, household size and household demographic composition,and districts.
IWP21 - UCTs in Zambia.qxp_Layout 1 30/08/16 15:10 Pagina 39

40
Can Unconditional Cash Transfers Lead to Sustainable Poverty Reduction? Evidence from two government-led programmes in ZambiaInnocenti Working Paper 2016-21
Table A11 – Effects of CGP on relative poverty (actual units)
Does not consider Better off than Believes life household very poor 12 months ago will be better in future
Impact at 24 months 0.28 0.46 0.06(0.05)*** (0.03)*** (0.04)
Impact at 36 months 0.20 0.24 0.03(0.05)*** (0.03)*** (0.05)
R2 0.14 0.23 0.10N 6,813 6,801 6,707
Unadjusted p-value: 24m impact=0 0.00 0.00 0.16Adjusted p-value: 24m impact=0 0.00 0.00 0.41
Unadjusted p-value: 36m impact=0 0.00 0.00 0.49Adjusted p-value: 36m impact=0 0.00 0.00 0.87
Notes: Estimations use difference in difference modeling. Robust standard errors clustered at the community level are inparentheses. * p<0.1 ** p<0.05; *** p<0.01. Adjusted p-values are Sidak-Bonferroni corrected p-values. Estimations areadjusted and include recipient’s age, education and marital status, household size and household demographic composition,and districts.
Table A12 – Effects of MCP on relative poverty (actual units)
Does not consider Better off than Believes life household very poor 12 months ago will be better in future
Impact at 24 months 0.26 0.37 0.04(0.05)*** (0.03)*** (0.03)
Impact at 36 months 0.30 0.35 0.04(0.06)*** (0.03)*** (0.04)
R2 0.09 0.18 0.05N 8,811 8,811 7,879
Unadjusted p-value: 24m impact=0 0.00 0.00 0.19Adjusted p-value: 24m impact=0 0.00 0.00 0.47
Unadjusted p-value: 36m impact=0 0.00 0.00 0.23Adjusted p-value: 36m impact=0 0.00 0.00 0.54
Notes: Estimations use difference-indifference modeling. Robust standard errors clustered at the community level are inparentheses. * p<0.1 ** p<0.05; *** p<0.01. Adjusted p-values are Sidak-Bonferroni corrected p-values. Estimations areadjusted and include recipient’s age, education and marital status, household size and household demographic composition,and districts.
IWP21 - UCTs in Zambia.qxp_Layout 1 30/08/16 15:10 Pagina 40

41
Can Unconditional Cash Transfers Lead to Sustainable Poverty Reduction? Evidence from two government-led programmes in ZambiaInnocenti Working Paper 2016-21
Table A13 – Effects of CGP on incomes and revenues (actual units)
Value of Amount spent Operating Revenues Operating Revenuesharvest on agricultural NFE from NFEs NFE from NFEs
inputs
Impact at 24 months 0.40 0.89 0.17 1.11(0.25) (0.19)*** (0.04)*** (0.24)***
Impact at 36 months 0.33 0.09 0.14 0.81(0.28) (0.20) (0.03)*** (0.17)***
R2 0.13 0.08 0.09 0.12 0.17 0.17N 6,816 6,816 2,272 2,272 2,272 2,272
Unadjusted p-value: 24m impact=0 0.11 0.00 0.00 0.00Adjusted p-value: 24m impact=0 0.38 0.00 0.00 0.00
Unadjusted p-value: 36m impact=0 0.24 0.66 0.00 0.00Adjusted p-value: 36m impact=0 0.67 0.99 0.00 0.00
Notes: Estimations use difference-in-difference modelling (single-difference for NFE outcomes). Robust standard errors clustered at the communitylevel are in parentheses. * p<0.1 ** p<0.05; *** p<0.01. Adjusted p-values are Sidak-Bonferroni corrected p-values. Estimations are adjusted andinclude recipient’s age, education and marital status, household size and household demographic composition, and districts.
Table A14 – Effects of MCP on incomes and revenues (actual units)
Value of Amount spent Operating Revenues Operating Revenuesharvest on agricultural NFE from NFEs NFE from NFEs
inputs
Impact at 24 months 0.67 1.04 -0.01 -0.02(0.21)*** (0.22)*** (0.03) (0.14)
Impact at 36 months 1.09 1.41 0.02 0.11(0.21)*** (0.20)*** (0.02) (0.10)
R2 0.13 0.11 0.02 0.02 0.02 0.02N 8,811 8,811 2,937 2,937 2,934 2,934
Unadjusted p-value: 24m impact=0 0.00 0.00 0.64 0.91Adjusted p-value: 24m impact=0 0.01 0.00 0.98 1.00
Unadjusted p-value: 36m impact=0 0.00 0.00 0.42 0.29Adjusted p-value: 36m impact=0 0.00 0.00 0.89 0.74
Notes: Estimations use difference-in-difference modeling (single difference for NFE outcomes). Robust standard errors clustered at the communitylevel are in parentheses. * p<0.1 ** p<0.05; *** p<0.01. Adjusted p-values are Sidak-Bonferroni corrected p-values. Estimations are adjusted andinclude recipient’s age, education and marital status, household size and household demographic composition, and districts.
IWP21 - UCTs in Zambia.qxp_Layout 1 30/08/16 15:10 Pagina 41

42
Can Unconditional Cash Transfers Lead to Sustainable Poverty Reduction? Evidence from two government-led programmes in ZambiaInnocenti Working Paper 2016-21
Table A15 – Effects of CGP on finance and debt (actual units)
Holding Amount No Reduction No new Reductionany savings saved outstanding in amount borrowing in amount(women) (women) debt owed borrowed
Impact at 24 months 0.22 1.09(0.05)*** (0.18)***
Impact at 36 months 0.10 0.57 0.06 0.26 0.02 0.05(0.05)** (0.18)*** (0.02)*** (0.08)*** (0.03) (0.11)
R2 0.08 0.10 0.02 0.02 0.01 0.02N 6,667 6,658 2,272 2,270 2,271 2,271
Unadjusted p-value: 24m impact=0 0.00 0.00Adjusted p-value: 24m impact=0 0.00 0.00
Unadjusted p-value: 36m impact=0 0.03 0.00 0.00 0.00 0.56 0.67Adjusted p-value: 36m impact=0 0.17 0.01 0.00 0.00 0.99 1.00
Notes: Estimations use difference-in-difference modelling (single-difference for outstanding debt and credit outcomes). Robust standard errorsclustered at the community level are in parentheses. * p<0.1 ** p<0.05; *** p<0.01. Adjusted p-values are Sidak-Bonferroni corrected p-values.Estimations are adjusted and include recipient’s age, education and marital status, household size and household demographic composition, and districts.
Table A16 – Effects of MCP on finance and debt (actual units)
Holding Amount No Reduction No new Reduction No Reduction No new Reductionany savings saved outstanding in amount borrowing in amount outstanding in amount borrowing in amount(women) (women) debt owed borrowed debt owed borrowed
Impact at 24 months 0.14 0.63 0.03 0.11 0.05 0.22(0.04)*** (0.18)*** (0.01)** (0.05)** (0.02)** (0.09)**
Impact at 36 months 0.14 0.67 0.01 0.02 0.02 0.10(0.03)*** (0.14)*** (0.01) (0.03) (0.02) (0.08)
R2 0.05 0.06 0.02 0.02 0.03 0.03 0.01 0.02 0.02 0.02N 7,860 7,854 2,936 2,930 2,933 2,926 2,936 2,932 2,934 2,933
Unadjusted p-value: 0.00 0.00 0.03 0.03 0.02 0.0124m impact=0Adjusted p-value: 0.02 0.00 0.14 0.15 0.12 0.0924m impact=0
Unadjusted p-value: 0.00 0.00 0.31 0.53 0.24 0.2136m impact=0Adjusted p-value: 0.00 0.00 0.89 0.99 0.81 0.7536m impact=0
Notes: Estimations use difference-in-difference modeling (single difference for debt and credit outcomes). Robust standard errors clustered at thecommunity level are in parentheses. * p<0.1 ** p<0.05; *** p<0.01. Adjusted p-values are Sidak-Bonferroni corrected p-values. Estimations areadjusted and include recipient’s age, education and marital status, household size and household demographic composition, and districts.
IWP21 - UCTs in Zambia.qxp_Layout 1 30/08/16 15:10 Pagina 42

43
Can Unconditional Cash Transfers Lead to Sustainable Poverty Reduction? Evidence from two government-led programmes in ZambiaInnocenti Working Paper 2016-21
Table A17 – Effects of CGP on schooling 11-17 (actual units)
Currently attending Number of daysin attendance prior week
Impact at 24 months -0.01 -0.00(0.03) (0.16)
Impact at 36 months 0.02 0.14(0.03) (0.16)
R2 0.08 0.08N 6,033 5,905
Unadjusted. p-value: DD24=0 0.60 0.99Adjusted p-value: DD24=0 0.84 1.00
Unadjusted p-value: DD36=0 0.45 0.38Adjusted p-value: DD36=0 0.70 0.62
Notes: See notes to Table A5. Controls also include the age and gender of the child.
Table A18 – Effects of MCP on schooling 11-17 (actual units)
Currently attending Number of days inattendance prior week
Impact at 24 months 0.11 0.43(0.02)*** (0.18)**
Impact at 36 months 0.09 0.52(0.03)*** (0.16)***
R2 0.04 0.04N 10,442 9,854
Unadjusted p-value: DD24=0 0.00 0.02Adjusted p-value: DD24=0 0.00 0.04
Unadjusted p-value: DD36=0 0.00 0.00Adjusted p-value: DD36=0 0.00 0.00
Notes: See notes to Table A6. Controls also include the age and gender of the child.
IWP21 - UCTs in Zambia.qxp_Layout 1 30/08/16 15:10 Pagina 43

44
Can Unconditional Cash Transfers Lead to Sustainable Poverty Reduction? Evidence from two government-led programmes in ZambiaInnocenti Working Paper 2016-21
Table A19 – Effects of CGP on material needs 5-17 (actual units)
Child has shoes Child has two sets Child has blanket All needs met1
of clothing
Impact at 24 months 0.34 0.08 0.20 0.36(0.05)*** (0.05) (0.05)*** (0.05)***
Impact at 36 months 0.27 0.02 0.12 0.28(0.04)*** (0.05) (0.05)** (0.04)***
R2 0.25 0.21 0.22 0.27N 14,828 14,821 14,827 14,813
Unadjusted p-value: DD24=0 0.00 0.14 0.00Adjusted p-value: DD24=0 0.00 0.37 0.00
Unadjusted p-value: DD36=0 0.00 0.70 0.02Adjusted p-value: DD36=0 0.00 0.97 0.05
Notes: See notes to Table A5. Controls also include the age and gender of the child.1 Summary index for the material needs domain.
Table A20 – Effects of MCP on material needs 5-17 (actual units)
Child has shoes Child has two sets Child has a blanket All needs met1
of clothing
Impact at 24 months 0.22 0.06 0.15 0.22(0.05)*** (0.03)* (0.04)*** (0.04)***
Impact at 36 months 0.25 0.11 0.18 0.26(0.04)*** (0.03)*** (0.04)*** (0.03)***
R2 0.15 0.11 0.13 0.17N 18,179 18,159 18,184 18,133
Unadjusted p-value: DD24=0 0.00 0.06 0.00Adjusted p-value: DD24=0 0.00 0.11 0.00
Unadjusted p-value: DD36=0 0.00 0.00 0.00Adjusted p-value: DD36=0 0.00 0.01 0.00
Notes: See notes to Table A6. Controls also include the age and gender of the child.1 Summary index for the material needs domain.
IWP21 - UCTs in Zambia.qxp_Layout 1 30/08/16 15:10 Pagina 44

45
Can Unconditional Cash Transfers Lead to Sustainable Poverty Reduction? Evidence from two government-led programmes in ZambiaInnocenti Working Paper 2016-21
Table A21 – Effects of CGP on anthropometric indicators 0-59m (actual units)
Not stunted Not wasted Not underweight
Impact at 24 months 0.02 0.00 0.03(0.02) (0.01) (0.02)
Impact at 36 months -0.05 -0.01 0.00(0.02)* (0.02) (0.02)
R2 0.03 0.01 0.01N 9,073 9,043 9,979
Unadjusted p-value: DD24=0 0.36 0.99 0.13Adjusted p-value: DD24=0 0.73 1.00 0.35
Unadjusted p-value: DD36=0 0.07 0.74 0.95Adjusted p-value: DD36=0 0.19 0.98 1.00
Notes: See notes to Table A5. Controls also include the age and gender of the child.
Table A22 – Heterogeneous impacts
Total Food Overall Relative Incomes Financeconsumption security asset poverty & &
pc scale index index Revenues Debt(HFIAS) index index
CGP (1) (2) (3) (4) (5) (6)24-month*Treatment 0.462*** 0.545*** 0.539*** 1.038*** 0.408*** 0.537***
(0.103) (0.130) (0.102) (0.136) (0.129) (0.169)36-month*Treatment 0.372*** 0.606*** 0.507*** 0.785*** 0.175 0.321**
(0.0919) (0.148) (0.109) (0.128) (0.147) (0.133)Bottom 50*24-month*Treatment 0.104 -0.00232 0.0523 0.157 0.0140 0.110
(0.116) (0.141) (0.108) (0.138) (0.142) (0.162)Bottom 50*36-month*Treatment 0.0850 -0.134 0.110 -0.0788 -0.0842 -0.102
(0.113) (0.131) (0.120) (0.134) (0.160) (0.142)Observations 6,807 6,768 6,807 6,805 6,807 6,659R2-squared 0.373 0.111 0.229 0.232 0.144 0.080
MCP (1) (2) (3) (4) (5) (6)24-month* Treatment 0.250*** 0.420*** 0.413*** 0.984*** 0.350*** 0.207*
(0.0770) (0.116) (0.0911) (0.135) (0.107) (0.124)36-month* Treatment 0.459*** 0.546*** 0.703*** 0.825*** 0.583*** 0.442***
(0.123) (0.127) (0.106) (0.129) (0.101) (0.139)Bottom 50*24-month* Treatment 0.178 -0.0216 0.0263 0.0964 0.204** 0.289**
(0.123) (0.126) (0.0786) (0.138) (0.0981) (0.134)Bottom 50*36-month* Treatment 0.00443 -0.0333 0.000938 0.262** 0.111 0.0869
(0.135) (0.129) (0.102) (0.128) (0.0870) (0.141)Observations 8,810 8,733 8,811 8,811 8,811 7,860R2-squared 0.392 0.092 0.279 0.182 0.160 0.047
See notes (in the main text) to Table 5 for the CGP and to Table 6 for the MCP.
IWP21 - UCTs in Zambia.qxp_Layout 1 30/08/16 15:10 Pagina 45