the impact of storm-water runoff in the toms river · · 2018-01-26the impact of storm-water...
TRANSCRIPT
1
The Impact of Storm-water Runoff in the Toms River
The effects of storm drains located in Beachwood Beach in
Beachwood Township, N.J., and West Beach in Pine Beach, N.J.
on the Toms River
August 12, 2011
Mentors: Dr. John Wnek, Mrs. Danielle Donkersloot, Ms. Cara Muscio
Joseph Convery with Danielle Clancy, Kevin Dillon, and Lauren Mae Henry
With Save Barnegat Bay’s Barnegat Bay Student Grant Program (BBSGP)

2
Abstract
The Toms River in New Jersey is a location that has been scrutinized for its
high bacteria levels along its bathing beaches. Two such locations have been
under fire from the National Resources Defense Council for several years
now. Frequently exceeding public safety standards for safe swimming
bacteria levels, Beachwood Beach and West beach became a focus for a
storm-monitoring project. Utilizing scientific methodology that ensures
accuracy and reliability of data in combination with quality assurance
methods approved by the New Jersey Department of Environmental
Protection, a two month long study was conducted on the bathing beaches.
Testing for E. coli and Enterococci, the Barnegat Bay Student Grant
Program focused its attention on making a difference in the two areas.
Ultimately, two storm drains displayed frequent bacterial “hot spots” which
led to a list of recommendations including more frequent inspections and
cleanings of said storm drains. In rain storms over 0.10 inches of rain, there
can be significant increases in water-borne bacteria that can exceed public
safety standards and pose a risk to human health.
Introduction
Along the Toms River in New Jersey
(Figure 10), an interest in public health is
steadily rising due to the abnormal
bacteriological readings found at several
bathing beaches located near the area. One
such beach is known as Beachwood Beach
located in Beachwood Township, New
Jersey. According to the National Resources
Defense Council (NRDC), Beachwood
Beach’s bathing water exceeded safety
standards for bacteria in approximately 27
percent of all 2010 samples (National
Resources, 2011). The NRDC reports the
Department of Environmental Protection’s
tests of Enterococcus bacteria in the water.
The national safety limit of Enterococcus
bacteria is 104 colony forming units (CFUs)
per 100 milliliters of water (National
Resources, 2011). Since there were only 33
samples taken that year, 9 of those samples
were above 104 CFUs/100mL of water.
These elevated levels are concerning to the
public that wishes to bathe safely in the
Toms River. In addition to Beachwood
Beach, another location approximately three
quarters of a mile away (or 1.05 miles by
car) also managed to arouse attention to
public health. West Beach located in Pine
Beach, New Jersey is a partial bathing beach
that is expected to have replenishment work
done sometime in the near future. Since
beach replenishment is an expensive task,
the area must have potential for income;
however, West Beach exceeded safety
standards in 15% of 26 samples in 2010
(National Resources, 2011). These two
locations have alarmed many local citizens
and have drawn much attention to the area.
The significant link between the two areas
and elevated bacteria levels is suspected to
be associated with storm-water runoff.
Storm-water sampling is difficult due
to several factors of variance. The first
factor is the sheer unpredictability of the
weather. Certain systems can have
unpredictable starts and stops; however, it is
usually considered an acceptable sample
once the rainfall total exceeds 0.10 inches of
rain (Dufour & Ballentine, 1986). It is
important to limit the amount of variance as
much as possible. By taking samples both
during a storm and during dry weather, one

3
can collect a wide variety of data that can be
used for comparisons. It is also important for
samplers to conduct sampling at several
locations because human structures can
influence the water quality of an area. One
such structure, for example, is a storm drain
(Figure 1). During a rainfall event, storm
Figure 1: Storm drain located in the
Beachwood Beach parking lot.
drains located throughout a municipality
will collect water through drains located on
the sides of roads, in parking lots, and other
areas that are highly trafficked. These drains
lead to larger water bodies and can influence
readings during storm events because the
rainwater from other locations may be
flowing out of the drains. To collect more
accurate samples during rainfall events, one
must also receive a sample from the first and
second flushes of a storm. The first flush of
a storm is associated with a period of 30
minutes after a storms initialization (Dufour
& Ballentine, 1986). The first flush is the
recognized time where most bacteria and
other matter will flow out of a storm drain
(Dufour & Ballentine, 1986). A second flush
sample can also be conducted up to one hour
after the storms initialization in order to
obtain a sample after the initial discharge.
These sampling periods are important
because they represent the true storm-water
effects on both the water body and the drain
itself. Usually if there are high levels of
bacteria recorded during the first flush, the
assumption can be made that there is a fault
with the storm drain. The storm drain may
need cleaning; however, the storm drain
could also have an infrastructure problem
(Figure 2). While it is likely that a rainfall
Figure 2: Storm drain with slight
infrastructure problem. Water is leaking
out of a crack in the drain.
event will lead to an increase the amount of
bacteria in a water body, a dramatic increase
could be linked to a problem with the storm
drains in the area. If a problem with a storm
drain is suspected, sampling should be
conducted in the storm drain as well as a
distance away from it.
One major threat to bathers during a
rainfall event is the potential for increased
bacteriological activity. Bacteria and
humans coexist and certain bacteria also
have a symbiotic relationship with human
beings. One such relationship exists with the
bacteria Escherichia coli. E. coli lives in
human intestines and aids with the digestion
process; however, if E. coli is relocated to
any other part of the body, the host can
become infected and fall ill. For this reason,
E. coli is studied as a pathogenic fecal
coliform (U.S. Environmental, 1999). E. coli
is part of a fecal coliform group (U.S.
Environmental, 1999). These fecal coliforms
will not necessarily themselves infect
people; however, they are indicators that

4
other infectious pathogens can be present in
the water (U.S. Environmental, 1999). The
main problem with relying on E. coli as an
indicator for bacteria in water is its tolerance
range. E. coli levels are not accurate in
marine water settings; therefore, the study of
Enterococcus bacteria is required (U.S.
Environmental, 1992). Enterococcus
bacteria has been designated by the
Environmental Protection Agency as the
standard for marine water bacterial
monitoring (U.S. Environmental, 1992).
Studies have shown that high levels of
Enterococci in marine waters have had a
strong correlation with gastroenteritis, a
disease that also has the same correlation
with high levels of fecal coliforms (Chen et
all., n.d.). In New Jersey, the NRDC cites
that the safe swimming limit for
Enterococcus bacteria is 104 CFUs/100mL
of water (National Resources, 2011).
Beaches in excess of this standard are
subject to retesting and then closing should
the level remain above the standard. The
main issue between testing for the two types
of bacteria is saltwater versus freshwater.
Since rainfall and storm-water runoff should
be fresh, it might seem appropriate to
conduct E. coli tests on water; however, the
salinity of a bathing beach will usually be
above the acceptable mean salinity of a
freshwater. This would require testing for
Enterococcus bacteria. For an accurate
storm-water monitoring program, it may be
accurate to test both parameters.
Since storm drains are known to
elevate bacteria levels in bathing beaches, it
is appropriate to question whether the
increases are due to natural or unnatural
causes. One potential method to determine
the source of impact is to look for optical
brighteners in water. Optical brighteners (or
fluorescent whitening agents) are chemicals
commonly found in detergents that will
adsorb to fabrics during the cleaning process
(Optical brighteners, 2007). These chemicals
are acclaimed to fluoresce in ultraviolet light
which will make the whites appear “whiter”
(Optical brighteners, 2007). Optical
brighteners have the potential to reveal
human source pollution because only a
portion of the chemicals are adsorbed,
whereas the rest are emitted as part of a
household’s wastewater (Optical
brighteners, 2007). Optical brighteners also
have great potential to reveal human source
pollution because they do not biodegrade;
rather, they photochemically degrade
(Floresguerra, 2003). Should people be
dumping detergents down a drain, should
people be cleaning boats in excess, or should
infrastructure problems lead to links
between wastewater and storm-water pipes,
there should, theoretically, be an increase in
optical brightener levels in the outflow of a
storm drain.
Figure 3: Image of Ocean County and the
Barnegat Bay. Testing location along the
Toms River is labeled with a yellow peg.
Image courtesy of Google Earth.
To obtain a better sample, it is
important to include several water quality
parameters. As part of New Jersey’s
Ambient Water Quality Monitoring
Program, several parameters are tested as
opposed to just one or two (NJDEP Bureau,
2011). As part of the program, the following
parameters are tested by field samplers:
dissolved oxygen, turbidity, pH,

5
temperature, salinity, and specific
conductance (NJDEP Bureau, 2011). These
parameters are tested because water flows
from several locations into larger bodies of
water such as the Barnegat Bay (Figure 3).
Such parameters may be of importance to
obtain for storm-water sampling as well
since storm drains will flush into larger
bodies of water too.
Quality assurance is the final
component of a proper storm-water
monitoring program. The New Jersey
Department of Environmental Protection
(NJDEP) regulates several actions that must
be taken in order to receive recognition for
data collected on New Jersey water bodies
(NJDEP Office, 2011). Quality assurance
officers around the state will review and
certify plans according to a tier system
(Presenting Data, 2011). Tier A recognized
environmental education, Tier B recognizes
stewardship, Tier C recognizes a community
or watershed assessment, and Tier D
recognizes a regulatory response (Presenting
Data, 2011). These tiers are designed to give
credibility to the data received based on the
rigor and accuracy of the sampling
methodology. The more rigorous the
methodology, the higher the tier indicated.
The goal of a solid storm-water monitoring
program is to achieve a Tier B or higher
recognition in order to have the data
recognized and used by decision making
officials (Presenting Data, 2011). By
introducing quality assurance to a project, it
ensures that the data will be recognized and
accurate according the approved plan.
Methodology
To plan the experiment, several
meetings were held to discuss the most
effective methodology. Said methodology
must include the most viable field options
for quick and accurate storm sampling in
order to obtain samples that best represented
the Toms River. The methodology also had
to incorporate the NJDEP quality assurance
guidelines in order to obtain accurate
samples that can be recognized at a different
level. The proposed plan was approved by
the NJDEP at the Tier B level.
To conduct the experiment, several
tools had to be prepared in a laboratory
setting as well as for a field setting.
Thiosulfate treated, sterile, labeled Whirl-
Paks were used to obtain water from
Figure 4: Thiosulfate treated sampling
Whirl-paks.
the sampling locations (Figure 4). A cooler
with ice packs was also used to keep
samples cool. Waders were required to enter
the water to collect samples, and nitrile
gloves were used both in the field and in the
laboratory. A Turner Designs Aquafluor was
used to test for optical brighteners and
turbidity in sample water. To properly
calibrate the Aquafluor, the NJDEP issued a
5 percent detergent solution to calibrate the
optical brightener channel to a 50 on the
relative optical brightener scale. The NJDEP
also issued 100 NTU turbidity fluid to
calibrate the turbidity channel of the
Aquafluor. Plastic cuvettes were used to run
samples through the Aquafluor. Plastic 1
milliliter pipettes were used to move small
amounts of sample water from the Whirl-
Paks to other locations. A graduated
cylinder was used to measure liquid
6
volumes. AYSI-85 meter was used to check
water quality parameters such as dissolved
oxygen, percent saturation, conductivity,
salinity, and temperature. An Oakton
Handheld pH Meter was used to assess pH
of sample water. The YSI-85 was calibrated
for dissolved oxygen by comparison to a
Winkler Titration. The YSI-85 was also
calibrated to NJDEP issued conductivity
calibration fluid. To check the calibrations,
instruments were also given a blank sample
of deionized water. Due to sterilization
techniques and calibrations, a large carbuoy
of deionized water was utilized. Please note
that the carbuoy had to be refilled on several
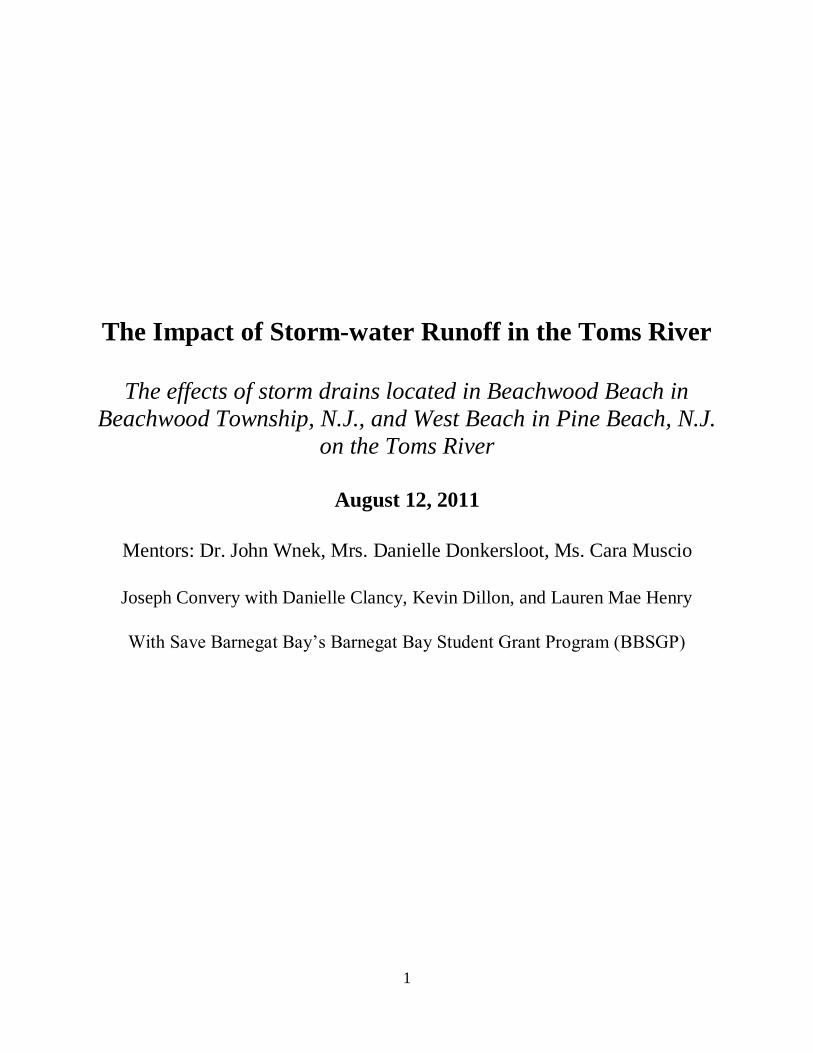
occasions. To conduct the bacteriological
assessments, two incubators were used
(Figure 5). One incubator was constantly set
to 35 degrees Celsius for the incubation of
Coliscan plates. The other incubator was
constantly set to 41 degrees Celsius for the
IDEXX Enterolert Quanti-Trays. Coliscan
Easygel media and petri dishes were used to
assess E. coli in the samples. An IDEXX
sealer (Figure 5) as well as IDEXX
Enterolert media was used to assess
Figure 5: Incubators and the IDEXX
sealer at the lab in Dr. Wnek’s garage.
From left to right: incubator, incubator,
sealer.
Enterococcus sp. in the sample water. In
addition to the sealer and media, IDEXX
Quanti-Tray/2000 and Quanti-Trays were
used to house the sample water and media
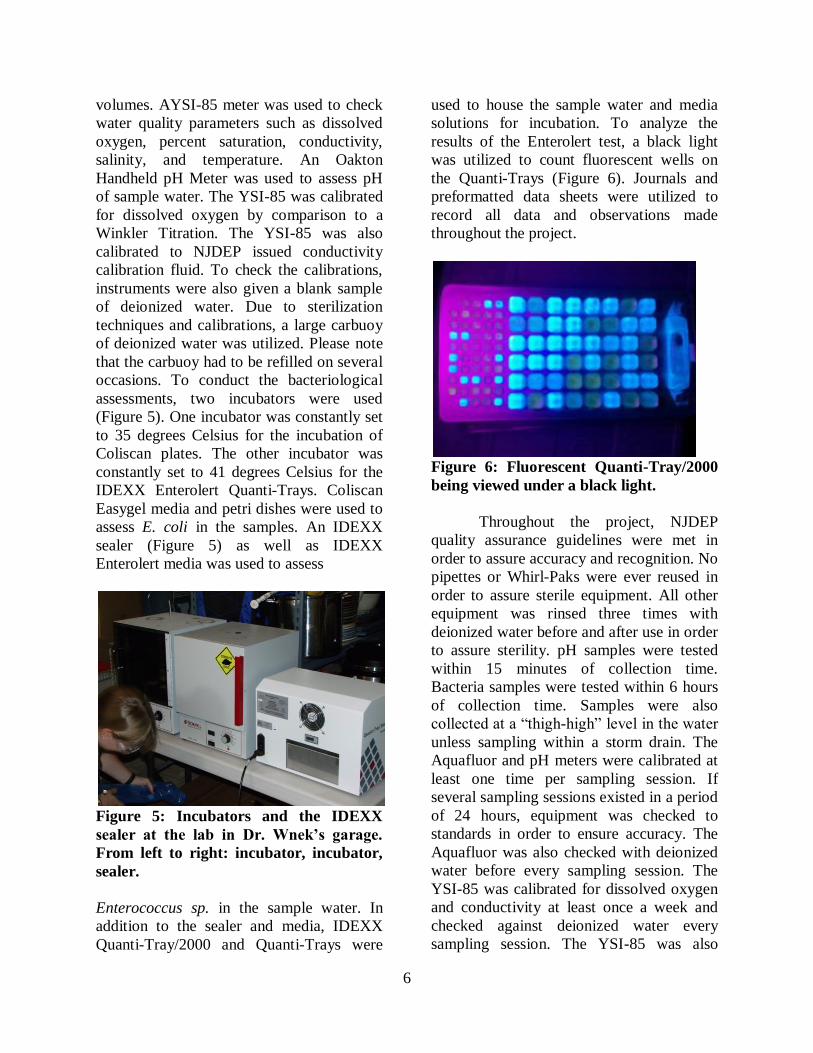
solutions for incubation. To analyze the
results of the Enterolert test, a black light
was utilized to count fluorescent wells on
the Quanti-Trays (Figure 6). Journals and
preformatted data sheets were utilized to
record all data and observations made
throughout the project.
Figure 6: Fluorescent Quanti-Tray/2000
being viewed under a black light.
Throughout the project, NJDEP
quality assurance guidelines were met in
order to assure accuracy and recognition. No
pipettes or Whirl-Paks were ever reused in
order to assure sterile equipment. All other
equipment was rinsed three times with
deionized water before and after use in order
to assure sterility. pH samples were tested
within 15 minutes of collection time.
Bacteria samples were tested within 6 hours
of collection time. Samples were also
collected at a “thigh-high” level in the water
unless sampling within a storm drain. The
Aquafluor and pH meters were calibrated at
least one time per sampling session. If
several sampling sessions existed in a period
of 24 hours, equipment was checked to
standards in order to ensure accuracy. The
Aquafluor was also checked with deionized
water before every sampling session. The
YSI-85 was calibrated for dissolved oxygen
and conductivity at least once a week and
checked against deionized water every
sampling session. The YSI-85 was also

7
calibrated to NJDEP meters for further
accuracy. For each sampling session—or
approximately every twenty samples should
several sessions exist in one day—a
duplicate sample was collected to compare
to original results. A blank sample was run
on the same basis in order to conduct a
handling check. In order to assure sterility,
nitrile gloves were worn when collecting or
handling samples (Figure 7). Storm
sampling generally required a 0.10 inch
rainfall before sampling the first and second
flush was possible. This plan for quality
assurance was submitted to the NJDEP and
was approved at the Tier B level.
Two locations were sampled
throughout the project; Beachwood Beach
and West Beach. These locations were
optimal because both have suffered periods
of high bacterial activity (National
Resources, 2011). These locations are also
approximately 0.75 miles apart, so sampling
both locations in the event of a storm was
possible. Beachwood Beach was broken
down into six sampling locations: L1S1,
L1S2, L1S2i, L1S3, L1S4, L1S4i (Figure 8).
These locations were assigned said codes to
convey the location with ease. “L1” was the
code for Beachwood Beach. “Sx” was the
code for sampling site at the indicated
location. Codes containing a lowercase “i”
Figure 7: Sampler Danielle Clancy
collecting samples wearing gloves
according to the quality assurance plan.
were sampling sites inside a given storm
drain. All other sampling sites were taken at
a thigh-high depth in the water. Sites 1 and 3
at Beachwood Beach were taken for
controls, whereas sites 2 and 4 at
Beachwood Beach were taken due to their
relativity to a storm drain. At West Beach
near Avon Road in Pine Beach, New Jersey,
there were four sampling locations: L2S1,
L2S2, L2S2i, L2S3 (Figure 9). “L2” in the
codes indicates the West Beach location. All
other characters in the codes follow the
same guidelines as the Beachwood Beach
codes. Sites 1 and 3 at West Beach were
taken for controls, and site 2 was taken due
to its relativity to a storm drain.
Two main types of sampling were
utilized throughout the project: baseline
sampling and storm sampling. Baseline
sampling was used as a reference point to
determine what would be a typical day on
the Toms River. Baseline sampling was only
conducted on Mondays so the received data
could be compared to the same data
collected by the Ocean County Health
Department. During baseline sampling, two
samplers would go out in waders; one to
Figure 8: Aerial view of Beachwood
Beach in Beachwood Township, New
Jersey. Sampling locations are labeled
next to yellow pegs. Image courtesy of
Google Earth.

8
Beachwood Beach and the other to West
Beach. At their locations, they would begin
around the same approximate time and start
at site one for each respective location.
Samplers would move through the sites only
collecting sample water (excluding any
storm-drain sampling due to a lack of
stormwater flow on baseline sampling days).
Samplers would also test for pH when in the
Figure 9: Aerial view of West Beach in
Pine Beach, New Jersey. Sampling
locations are labeled by yellow pegs.
Image courtesy of Google Earth.
water, assuming a pH meter was available.
Once the samplers obtained all samples,
they then placed the samples in coolers for
transport to Dr. Wnek’s garage which was
used as a laboratory. Once at the lab, the
samples were tested with the Aquaflor and
YSI-85 for any water quality parameters.
After these tests were conducted,
bacteriological assessments were performed
on the sample water. One milliliter of
sample water was used for the Easygel
plating process. Ten milliliters of sample
water was then used for a 10:1 dilution of
sample water for the IDEXX Enterolert
method. After preparing samples, they were
then placed in their respective incubators for
a period of 24 hours. After 24 hours, the
samples were removed from the incubators
and then the bacteria content of each was
assessed. The only main difference between
storm sampling and baseline sampling was
the sample collection process and the type of
tray used for the Enterolert method. The
laboratory procedures were all the same as
per the quality assurance plan that was
approved by the NJDEP. During a storm
event, samples were collected approximately
30 minutes after the storm’s initiation. The
purpose of this was to capture the first flush
of a storm drain. Approximately one hour
after a storms initiation began the second
round of sampling. This was to capture the
second flush of a storm drain. These samples
were all kept in coolers and transported to
the laboratory. Furthermore, storm sampling
required the use of the Quanti-Tray/2000 for
the Enterolert method whereas baseline
sampling only required the regular Quanti-
Tray. All data was recorded on data sheets,
and all observations were recorded in
journals.
Figure 10: Image of the Toms River.
Sampling locations are marked by yellow
pins. Image courtesy of Google Earth.
Results
There were several complications
with collecting the data. The first issue was
a problem with the incubation of the IDEXX
Quanti-Trays; therefore, several data points
were replaced with the more accurate NRDC
Enterococcus data. Furthermore, several pH
meters broke throughout the project due to

9
Table 1: Mean values for all baseline parameters at Beachwood Beach and West Beach.
Parameter L1S1 L1S2 L1S3 L1S4 L2S1 L2S2 L2S3
Percent Saturation (%) 84.8 85.0 91.4 89.4 89.4 95.4 91.8
Dissolved Oxygen (mg/L) 6.57 6.62 6.88 6.79 6.40 6.90 6.80
Conductivity (mS/cm) 17.52 17.65 17.47 19.70 23.83 23.57 24.38
Salinity (‰) 10.3 10.5 10.5 11.5 13.7 13.8 14.0
Temperature (⁰C) 25.4 25.3 25.6 26.3 28.0 27.9 27.9
pH 6.9 7.0 7.0 7.1 7.7 7.9 7.9
Optical Brighteners 83.56 95.34 90.77 99.23 87.94 395.47 135.85
Turbidity (NTUs) 6.207 4.440 3.351 4.369 5.718 3.633 3.258
E. coli (CFUs/100mL) 650 880 1380 760 260 440 280
Enterococcus (mpn) 18 16 24.2 20 18.2 26.8 16
Table 2: Mean values for all first flush data collected at Beachwood Beach and West Beach.
Parameter L1S1 L1S2 L1S2i L1S3 L1S4 L1S4i L2S1 L2S2 L2S2i L2S3
Percent Saturation
(%) 95.5 94.1 85.2 93.4 96.9 95.2 95.0 92.4 88.9 93.8
Dissolved Oxygen
(mg/L) 7.48 7.38 6.55 7.32 7.49 7.19 7.04 7.06 6.49 6.87
Conductivity
(mS/cm) 15.27 16.75 15.96 18.35 21.93 21.61 22.61 20.05 24.48 25.42
Salinity (‰) 9.6 9.5 9.0 10.5 12.7 12.6 14.1 14.8 14.5 15.2
Temperature (⁰C) 26.7 26.6 26.6 26.7 26.7 26.6 26.0 26.4 26.2 25.9
Optical Brightners 110.80 123.25 158.58 120.90 56.45 100.60 86.42 95.91 103.92 82.88
Turbidity (NTUs) 7.663 9.484 8.889 5.506 14.947 5.203 5.091 5.474 7.317 6.821
E. Coli
(CFUs/100 mL) 1000 800 17850 1400 700 2100 900 200 2500 1000
Enterococcus
(mpn) 77.5 75 88 85.25 77.5 77.5 72 35 40 60
Table 3: Mean values for second flush parameters at Beachwood Beach and West Beach.
Parameters L1S1 L1S2 L1S2i L1S3 L1S4 L1S4i L2S1 L2S2 L2S2i L2S3
Percent Saturation
(%) 95.3 95.8 84.7 89.8 92.5 90.8 84.3 89.7 85.5 88.5
Dissolved Oxygen
(mg/L) 7.36 7.47 6.97 6.75 7.35 6.73 6.75 7.06 6.12 6.59
Conductivity
(mS/cm) 16.31 16.09 10.47 17.08 17.82 20.13 23.98 20.16 19.58 24.82
Salinity (‰) 9.1 9.4 5.8 9.7 10.9 12.0 14.5 14.5 11.6 14.8
Temperature (⁰C) 25.4 25.2 23.6 25.3 25.6 25.3 25.2 25.8 25.9 26.0
pH 7.4 7.3
6.8 6.8
Optical Brightners 106.79 104.21 181.13 127.68 97.55 94.50 101.52 86.82 105.11 87.18
Turbidity (NTUs) 4.491 3.583 7.313 4.035 4.398 4.682 5.749 3.839 4.334 5.203
E. Coli
(CFUs/100mL) 10740 4825 18725 1440 840 1175 3967 967 8333 933
Enterococcus (mpn) 4899 1435 4938 362 265 246 3416 695 2792 227

10
Figure 11: Visual display of mean E. coli levels at Beachwood Beach for baseline, first
flush, and second flush time periods. The red bar illustrates the recommended safe
swimming level for freshwater bathing beaches.
Figure 12: Average E. coli levels at West Beach for baseline, first flush, and second flush
events. The red bar annotates the recommended freshwater safe swimming level of E. coli.
1
10
100
1000
10000
100000
L1S1 L1S2 L1S2i L1S3 L1S4 L1S4i
cfu
/100m
L
Sampling Locations
Mean Beachwood E. coli Levels
Baseline
First Flush
Second Flush
1
10
100
1000
10000
L2S1 L2S2 L2S2i L2S3
cfu
/100m
L
Sampling Locations
Average E. coli Levels at West Beach
Baseline
First Flush
Second Flush

11
Figure 13: Average E. coli levels in suspected problematic pipes during the second flush of
a storm. The red bar indicates the 200 CFU/100mL standard of E. coli for freshwater
bathing beaches.
Figure 14: Average Enterococcus bacteria levels at Beachwood Beach during baseline, first
flush, and second flush sampling. The red bar represents the recommended 104
CFU/100mL standard for marine bathing beaches.
17850 18725
2500
8333.33
1
10
100
1000
10000
100000
First Flush Second Flush
cfu
/100m
L
Sampling Period
Average E. coli Levels in Problematic Pipes (Second Flush)
L1S2i
L2S2i
1
10
100
1000
10000
L1S1 L1S2 L1S2i L1S3 L1S4 L1S4i
Mea
n P
rob
ab
le N
um
ber
Sampling Locations
Enterococcus Bacteria Averages for Beachwood Beach
Baseline
First Flush
Second Flush
12
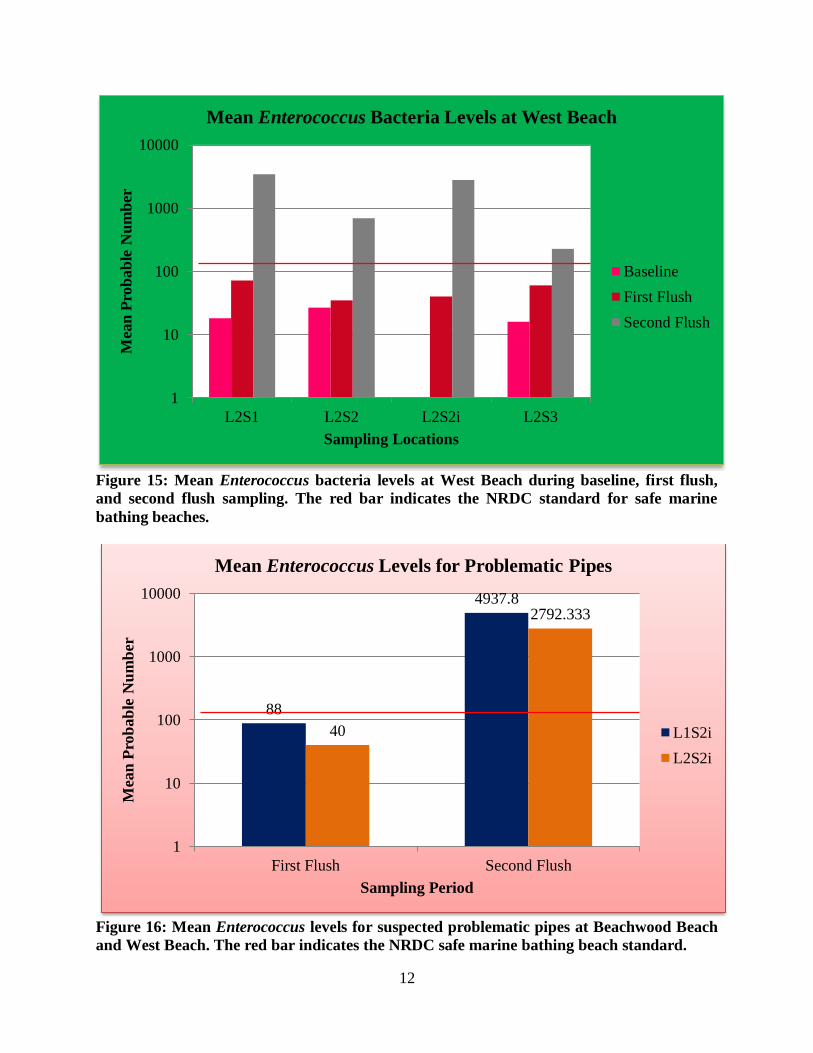
Figure 15: Mean Enterococcus bacteria levels at West Beach during baseline, first flush,
and second flush sampling. The red bar indicates the NRDC standard for safe marine
bathing beaches.
Figure 16: Mean Enterococcus levels for suspected problematic pipes at Beachwood Beach
and West Beach. The red bar indicates the NRDC safe marine bathing beach standard.
1
10
100
1000
10000
L2S1 L2S2 L2S2i L2S3
Mea
n P
rob
ab
le N
um
ber
Sampling Locations
Mean Enterococcus Bacteria Levels at West Beach
Baseline
First Flush
Second Flush
88
4937.8
40
2792.333
1
10
100
1000
10000
First Flush Second Flush
Mea
n P
rob
ab
le N
um
ber
Sampling Period
Mean Enterococcus Levels for Problematic Pipes
L1S2i
L2S2i

13
Figure 17: Mean optical brightener levels at Beachwood Beach during baseline, first flush,
and second flush sampling events.
Figure 18: Mean optical brightener levels at West Beach during baseline, first flush, and
second flush sampling events.
0
20
40
60
80
100
120
140
160
180
200
L1S1 L1S2 L1S2i L1S3 L1S4 L1S4i
Un
its
Sampling Location
Mean Optical Brightener Levels at Beachwood Beach
Baseline
First Flush
Second Flush
0
50
100
150
200
250
300
350
400
450
L2S1 L2S2 L2S2i L2S3
Un
its
Sampling Location
Mean Optical Brightener Levels at West Beach
Baseline
First Flush
Second Flush

14
Figure 19: Enterococcus values plotted against optical brightener values. The r-squared
value is 0.00009.
Figure 20: Enterococcus bacteria levels plotted against rainfall levels. The r-squared value
is 0.4146.
y = 0.2657x + 946.45
R² = 9E-05
1
10
100
1000
10000
100000
1 10 100 1000 10000
Mea
n P
rob
ab
le N
um
ber
Optical Brightener Units
Enterococcus Versus Optical Brighteners
y = 6E-05x + 0.1237
R² = 0.4146
0
0.2
0.4
0.6
0.8
1
1.2
1.4
1.6
1.8
1 10 100 1000 10000 100000
Ra
infa
ll (
inch
es)
Enterococcus (MPN)
Enterococcus Levels Versus Rainfall

15
Table 4: Comparison of values received during sampling to values received by the Ocean
County Health Department.
Date Beachwood (CFU/100 mL) Avon (CFU/100 mL)
Health Dept. Ours (Average) Health Dept. Ours (Average)
6/27/2011 10 11.892 34.64 18.371
7/18/2011 10 10 10 10
7/25/2011 40 13.269 10 14.581
8/1/2011 20 11.892 30 18.566
Table 5: Comparison of values received during sampling to values received by the Leed’s
Point Lab Staff.
Location Leed’s (CFU/ 100 mL) Ours (CFU/100 mL)
L1S1 30 10
L1S2 20 10
L1S3 37 10
L1S4 3 20
water damage so there is a low number of
accurate pH data representing the locations.
Table 1 displays the average of all
quantified baseline parameters. No samples
were taken inside the pipes during baseline
sampling due to a lack of flow from the
storm drains. Table 2 displays the averages
of first flush data for all sampling locations.
Table 3 displays the averages of second
flush data for all sampling locations.
General trends can be seen in Figures 11 and
12 which illustrate the elevated levels of E.
coli throughout the first and second flush
sampling periods. Figure 13 highlights some
of the more dramatic increases in E. coli at
L1S2i and L2S2i which are both storm drain
locations at Beachwood Beach and West
Beach respectively. Figures 14 and 15
highlight some of the increases in
Enterococcus bacteria with the first and
second flushes. Figure 16 portrays another
dramatic increase in bacteria levels
(Enterococcus) at the same storm drains that
had high increases in E. coli. The mean
optical brightener levels are portrayed in
Figures 17 and 18; however, there appears to
be no set pattern to the levels. Figure 19
displays Enterococcus bacteria levels plotted
against optical brightener levels, and Figure
20 shows Enterococcus bacteria levels
plotted against rainfall levels. Table 4
displays data received throughout the project
as well as data received by the Ocean
County Health Department. Table 5 displays
data received throughout the project as well
as data received by the Leed’s Point Lab
Staff.
Discussion
Throughout the project, several
spikes in both E. coli and Enterococcus
bacteria were seen throughout rainfall
events. It can be seen in Figures 11 and 12
that the levels of E. coli in the water were
abnormally high for baseline, first flush, and
second flush sampling sessions. While E.
coli may not be a great indicator for
bacteriological activity in marine water,
studying Enterococcus bacteria is an

16
acceptable method for both freshwater and
marine water (Dufour & Ballentine, 1986);
therefore, the elevated levels of E. coli are
supported by the elevated levels of
Enterococcus bacteria (Figures 14 & 15).
The higher levels of bacteria throughout first
and second flush samples are indications
that storm-water runoff is the main factor
behind such dramatic increases in bacteria.
To further this statement, ANOVA was run
on baseline E. coli values and there was a
significant difference between the baseline
data and the second flush data (α = 0.05, p =
0.026, f = 5.304, df = 1). In addition, an
ANOVA test was also run on the
Enterococcus values received during
baseline sampling and second flush
sampling. The results of this test showed
that there was, yet again, a significant
difference between the two sets of data (α =
0.05, p = 0.023, f = 5.130, df = 1). Since
there is such a significant difference
between baseline data and second flush data,
it is suggested that the discharge from
storm-drains are affecting the bacteria levels
on both Beachwood Beach and West Beach.
Recorded observations support both the
trends as well as the statistical indices. On
storm sampling dates over 0.10 inches of
rain, a leaf litter discharge was emitted from
the storm drain closest to the Beachwood
Beach bathing section (L1S2i). On July 8th,
a gray discharge was being emitted from the
L1S2i storm-drain and a strong odor of
septic was found close to the drain as well
(Figure 21). Leaf litter seemed to be
scattered around the pipe on this date. On
July 29th
, there was a large amount of
rainfall (approximately 1.25 inches of rain)
before the second flush. By the time
sampling occurred, leaf litter was spotted
near L1S1 (due to tides in the Toms River)
and near L1S2i (due to the storm-drain).
These two locations had the highest bacteria
readings of that sampling session.
Rainfall data plotted against
Enterococcus bacteria data may be
indicative of elevated bacteria levels due to
Figure 21: Gray cloud discharge coming
from L1S2i on July 8th
, 2011.
rainfall. As previously mentioned, there is a
significant difference in baseline and second
flush bacteria levels; therefore, it can be
understood that there is some factor
influencing such dramatic changes. When
graphed against one another, it appears that
there is a possible correlation between
Enterococcus bacteria and rainfall data. It
appears that, on a graph, the higher the
amount of rainfall, the higher the amount of
Enterococcus bacteria. Again, Enterococci
levels are the best method of determining
bacterial influence in systems that may have
both marine and freshwater influences.
When correlating Enterococci values with
rainfall in inches, the R2 value is
approximately 0.4146 (Figure 20). This
number indicates that there is a statistical
correlation between the two factors. By
using the previous data that average bacteria
levels were highest near storm drains, it can
be assumed that the storm drains are the
cause of bacterial increases during rainfall
since bacteria counts are high near storm
drains and there is a correlation between
rainfall and Enterococci values.

17
Figure 22: Sludge composition at the
bottom of a Pine Beach storm drain.
By utilizing both E. coli and
Enterococcus bacteria as an assessment of
the water quality near West Beach and
Beachwood Beach, assumptions can be
made that the storm drains are either
clogged with debris or have an infrastructure
problem. By viewing Figure 22, one can see
the sludge-like composition within a storm
drain on the side of a road in Pine Beach.
With unclean storm drains, all sludge,
bacteria, and other waste products dumped
down roadside or parking lot drains will be
disposed of directly into the Toms River
through outflow pipes placed at beaches
such as Beachwood Beach and West Beach.
In the storm drains, it is possible that a
biofilm buildup could also be the cause of
such high bacteria levels (Ferguson, 2006).
A biofilm buildup occurs on just about any
surface that has contact with water and can
appear in several forms such as a film
coating the object’s surface, or even a
sludgy material as shown in Figure 22
(Ferguson, 2006). Biofilms can house
colonies of both E. coli and Enterococcus
bacteria which could explain the dramatic
increases in these organisms after a rainfall
event (Ferguson, 2006). In order to clean the
storm drains, they must be flushed out and
the waste product must be contained through
a vacuum. In order to remove biofilm,
however, ultrasonic cleaning is required in
order to separate the bacterial colonies from
their adhering surface. Should an
infrastructure problem be present, optical
brighteners would usually indicate a
problem should there not be interference.
The other way to identify an infrastructure
problem would be to use a camera to
investigate the pipes and determine if there
are any breaks or separations in the original
structures. It is possible that by inspecting
the pipes the problem can be identified and
corrected. Should the storm drains be free of
debris and have no infrastructure problems,
theoretically, the bacteria counts from their
discharge should be minimal.
The optical brightener averages
throughout the study proved to be of little
use for the overall assessment of the area.
The average optical brightener levels for
each sampling site can be viewed in Figures
17 and 18. On these figures, it can be seen
that there is no strong trend or pattern in the
optical brightener levels. This may be due to
interference from salt water conditions or
possibly due to tannins in the water which
may also affect the optical brighteners.
When viewing Figure 19, one can see
Enterococci values plotted against optical
brightener levels on the relative scale. The
R2 value for this comparison is 0.0009. This
number represents very little, if any,
correlation. As previously stated, optical
brightener levels may be a great indicator of
human influence in an area; however, with
so many variable affecting the experiment, it
cannot be definitively stated that they have a
correlation with any of our pertinent data.
This test may have significance in a
freshwater system; however, in a marine
water body the fluctuations are too great to
truly quantify.
Throughout the project, quality
assurance and data comparisons to outside
sources seemed to verify the data collected.
By running an ANOVA test on the Table 4,
one can see that there is no statistical

18
difference between the data collected in this
experiment and the data collected by the
Ocean County Health Department (α = 0.05,
p = 0.151, f = 2.308, df = 1). Furthermore,
there was no significant difference (Table 5)
between the Enterococci data collected and
the Enterococci data evaluated at the Leed’s
Point Laboratory (α = 0.05, p = 0.247, f =
1.648, df = 1). Since these outside sources
are more credible than the water quality
team, it is suggested that since there is no
significant difference between their data and
the data received in this experiment, that the
data collected is accurate by comparison.
Throughout the project, bacterial
increases were seen throughout different
storms and different amounts of rainfall.
One storm, a rainfall of 0.06 inches was
received and was enough to cause a first and
second flush in the storm drains. The data
received for that storm was slightly higher
than the recommended safe bathing level of
bacteria. This means that small quantities of
rain are enough to cause an increase in
bacteria levels. Storms over 0.10 inches of
rain seemed to, however, consistently cause
hazardous bacteria levels. While storms over
0.10 inches of rain have caused the most
consistent increases in bacteria, it should be
advised that storms of lesser rainfall can
potentially increase bacteria levels as well.
After assessing the storm drains at
both Beachwood Beach and West Beach, it
can be assumed that there is a potential for
both debris and infrastructure problems with
the L1S2i and L2S2i pipes. After viewing
the drainage spots alongside roads and
parking lots, there is a sludge material in the
drains which would indicate a biofilm
growth. In addition, there is an extreme lag
time in flushing materials. On several
occasions the team had to wait longer than
30 minutes for the appearance of the first
flush. For example, on July 8th
the team had
to wait one full hour after the storms
initialization before any discharge was
emitted from the pipes. This lag time in the
pipes could represent an infrastructure
problem or a blockage in the pipes.
Furthermore, the first flush of a storm drain
should have the highest bacterial counts of
all sampling periods; however, in this
experiment, the highest bacterial counts
occurred in the second flush. This could be
indicative of an infrastructure problem or
blockage that is reducing the flow in these
storm pipes. This theory is backed by the
crushed appearance of the L2S2i pipe, the
gurgling noises in the L2S3 pipe, and the
blockage of the L2S1 pipe. Due to the
blockages of the L2S1 and L2S3 pipes,
sampling within the pipes was not even
possible. The same potential exists within
the other more active storm drains.
One observed storm drain did not
experience intense changes in bacterial
levels. The storm drain located at L1S4i
(Figure 23) appeared to have changes in
bacterial levels during storms; however, the
significance of the changes is not well
understood. L1S4i seemed to have small
Figure 23: Location 1 Site 4 storm drain
pictured with researchers Danielle Clancy
and Kevin Dillon.
variations in bacteria levels which could
mean one of two things. The pipe could
either blocked and any flush resulting from
the pipe was merely a result of its
submersion; or, the pipe could be clean and

19
have little or no infrastructure problems.
Throughout the project it was difficult to
determine the significance of this pipe’s
influence on bacteria levels because it was
constantly in a state of partial submersion.
This leads to the questioning of true flushing
or tidal influence from the Toms River. To
determine the true influence of this pipe,
further inspection would be required.
Conclusions/Recommendations
With the data received, it is
suggested that the pipe closest to the
Beachwood Beach bathing area (Figure 24)
and the submerged pipe at West Beach pose
health hazards to bathers. During rainfall
events over 0.10 inches, these storm drains
will emit a discharge that contains high
levels of bacteria that will exceed the Health
Department’s recommended safe swimming
limit for Enterococci of 104 CFUs/100 mL.
It has also been concluded that there should
be an inspection of the pipe located to the
east of Beachwood Beach since its
significance in this experiment is
undetermined. The optical brightener levels
received, while a useful tool in other
experiments, were too variable to conclude
with any significance in this study.
Recommendations for the hazardous storm
drains include monthly inspections and
cleanings of the storm drains. Storm drains
can be cleaned by flushing out debris and
using a wet-vacuum truck to contain the
waste. Ultrasonic cleaning is also
recommended for the storm drains to
eliminate biofilm residue and completely
remove bacteria colonies from the storm
drain. Possible ultraviolet treatments could
be used inside the storm drains as well in
order to sterilize the drains to prevent
bacteriological growth and the spread of
other diseases including salmonella and
MRSA. In order to inspect the storm drains,
cameras can be utilized by permission of the
Ocean County Health Department to inspect
the infrastructure of a storm drain. Should
there be a cross connection between storm
drains and other networks, the problem can
be identified and corrected after a thorough
inspection. Township municipalities should
also have a diagram of the storm drain
networks to get an idea of what the system
should look like as opposed to what it may
or may not look like in its present state.
Until the problem is corrected, a
recommended waiting period of 72 hours
before bathing in Beachwood Beach and
West Beach should be enforced before
resuming recreational swimming or beach
bathing. This period should allow the
bacteria to completely flush out and let the
beach return to its prior state. Furthermore,
the regulation mandating that a beach should
close only after a test and retest of bacteria
should be used as a guideline rather than a
standard. In the best interest of public
health, safety closings should be conducted
as a precautionary method whenever rainfall
over 0.10 inches is suspected. Several other
townships abide by a pre-cautionary closing
method (National Resources, 2011) and this
could help decrease public exposure to
potentially high bacteria levels.
Figure 24: Coliscan petri dish after
culturing. The plate represents 41,900
CFUs/100mL from L1S2i.

20
The potential for error in this study
was high due to the unpredictable nature of
the weather. By utilizing quality assurance
guidelines, the error was reduced; however,
there are still potential forms of error in any
study. Error could have been possible in the
incubation process of the bacteria. Error
could have been made when handling
samples or storing them for cooling. Error
could have been made in the measurements
of the fluids and while conducting
bacteriological tests. Error could have been
made in labeling samples or data as to
confuse readings. The human potential for
error is limitless; however, by following the
proposed methodology, the error potential
was decreased.
Recommendations for future studies
include studying several locations as to
optimize data. A larger team could possibly
lead to the utilization of more data; however,
it also requires more equipment. Future
students should be completely dedicated to
the project because it is a huge undertaking
and the methodology must be followed in
order to receive optimal results. By working
well as a team, the project can be much
easier and if everyone does their part the
experiment becomes that much easier. The
biggest recommendation is to continue with
quality assurance and Enterococci studies.
By utilizing quality assurance, the data can
be recognized instead of ignored. In
addition, by studying Enterococci, one can
determine bacteria levels in the water
without regard to salinity which is the major
complication with E. coli sampling. By
organizing a stringent methodology in
advance, creating an efficient system of data
collection, and developing an effective way
to organize and record data, the project
won’t be nearly as hard as it would without
such organization and planning.
Acknowledgements
There are several groups I would like
to thank for their support, aid, and
encouragement for this study. I would first
like to thank all the organizations that aided
in the support of this study. These
organizations include: Save Barnegat Bay,
The Barnegat Bay Student Grant Program,
The Marine Academy of Technology and
Environmental Science, the New Jersey
Department of Environmental Protection,
The Rutgers Co-Operative Extension of
Ocean County, and the DEP Leed’s Point
Lab Staff. Furthermore, I would like to
thank our mentors for this project. Without
their constant support and help, there is no
way we would have achieved as much
significance to our data as we did. This
experiment truly would not have been
possible without Dr. John Wnek of MATES,
Mrs. Danielle Donkersloot of the NJDEP,
and Ms. Cara Muscio of the Rutgers Co-Op.
Finally, I would like to thank my teammates
for this project. We all worked well together
and managed to make this study a huge
success. We spent time sampling in the rain
and driving all around Ocean County to
further our understanding of this project.
Thank you to Kevin Dillon, Danielle
Clancy, and Lauren Mae Henry for
everything you’ve done throughout this
project.
References
Chen, C. M., Doherty, K., Gu, H.,
Dichter, G., & Naqui, A.
(n.d.). Enterolert- a rapid method for
detection of enterococcus spp.
Dufour, A. P., & Ballentine, R. K.
U.S. Environmental Protection
Agency, Office of Water Regulations
and Standards. (1986). ambient
water quality criteria for bacteria -

21
198 (EPA440/5-84-002).
Washington, DC: Government
Printing Office. Retrieved from
http://water.epa.gov/scitech/swguida
nce/standards/upload/2001_10_12_cr
iteria_ambientwqc_bacteria1986.pdf
Ferguson, D. (2006). Growth of e. coli and
enterococci in storm drain
biofilm. Proceedings of the Orange
County Public Health Laboratory,
http://www.tetratech-
ffx.com/beach_conf06/pdf/sessionIX
/ferguson.pdf
Floresguerra, S. M. (2003). The use of
selected water quality parameters to
identify fecal coliform sources in
support of the sinking creek total
maximum daily load. Unpublished
manuscript, Department of
Environmental Health Science, East
Tennessee State University, Johnson
City, Tennessee.
National Resources Defense Council,
(2011). Testing the waters
2011 NRDC. Retrieved from
http://www.nrdc.org/water/oceans/tt
w/sumnewj.pdf
New Jersey Department of Environmental
Protection, Bureau of Freshwater and
Biological Monitoring.
(2011). Supplemental ambient
surface water monitoring
network New Jersey: Retrieved from
http://www.state.nj.us/dep/wms/bfb
m/saswmn.html
New Jersey Department of Environmental
Protection, Office of Quality
Assurance. (2011). Quality
assurance program New Jersey:
Retrieved from
http://www.nj.gov/dep/oqa/qap.html
Optical brighteners. Turner Designs
Coproration. Sunnydale, CA. (2007,
September 05).
Presenting data effectively,
(2011). Proceedings of the New
Jersey Department of Environmental
Protection.
U.S. Environmental Protection Agency,
Alabama Water Watch.
(1999). Quality assurance plan for
bacteriological monitoring
U.S. Environmental Protection Agency,
Office of Water Regulations and
Standards. (1992). Npdes storm
water sampling guidance
document (EPA 833-8-92-001).
Washington, DC: Government
Printing Office.