the impact of powder x-ray diffraction on mineral science ... · environment and contain...
TRANSCRIPT
The impact of powder X-ray diffraction on mineral science, mineral processing and process optimization
Johan PR de Villiers Department of Materials Science and Metallurgical
Engineering University of Pretoria
1
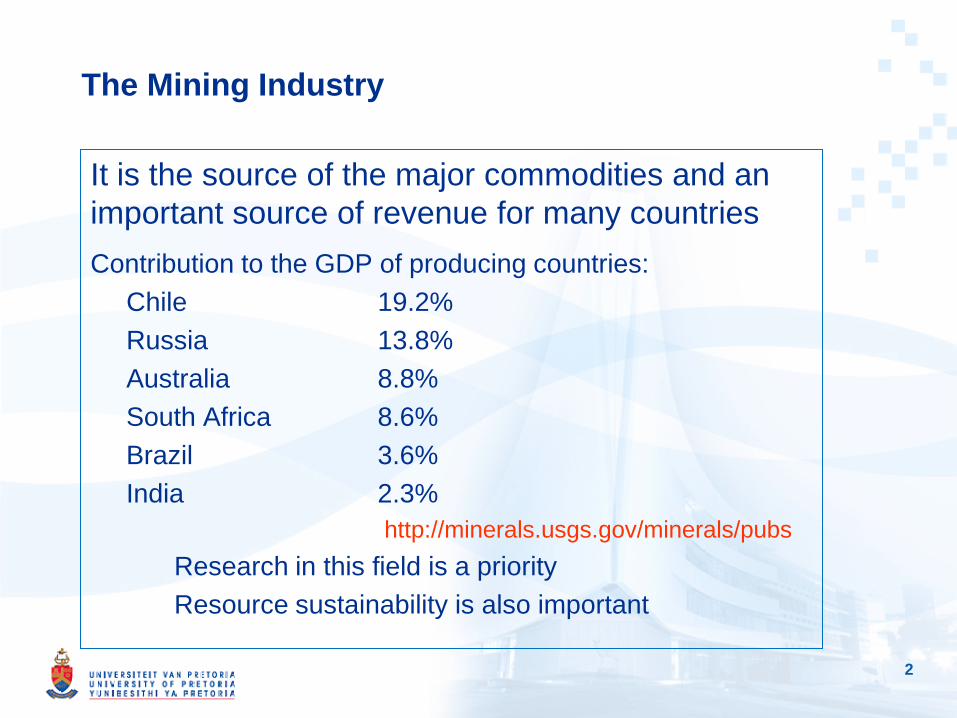
The Mining Industry
It is the source of the major commodities and an important source of revenue for many countries Contribution to the GDP of producing countries: Chile 19.2% Russia 13.8% Australia 8.8% South Africa 8.6% Brazil 3.6% India 2.3%
http://minerals.usgs.gov/minerals/pubs Research in this field is a priority Resource sustainability is also important
2

XRD in the Minerals Industry
Research and process evaluation are needs driven and often dictated by industry
They usually have important financial implications
They rely heavily on methods developed by academia and instrument developers
Accuracy is as relevant here as elsewhere
Examples
Exploration and orebody evaluation
Minerals processing
High-temperature processing
Materials characterization
3
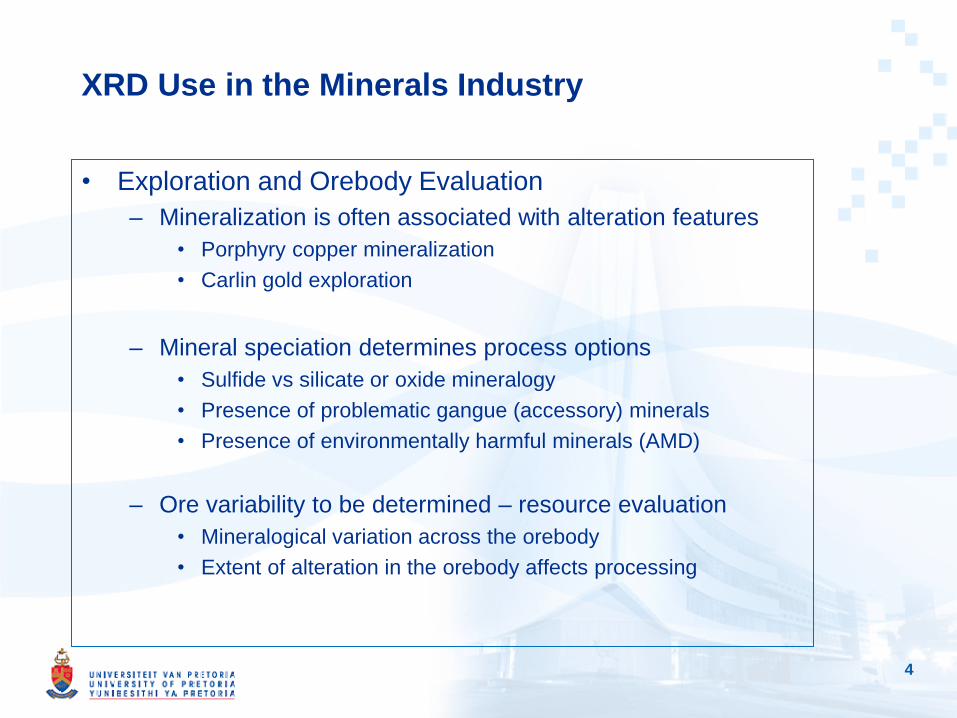
XRD Use in the Minerals Industry
• Exploration and Orebody Evaluation – Mineralization is often associated with alteration features
• Porphyry copper mineralization • Carlin gold exploration
– Mineral speciation determines process options
• Sulfide vs silicate or oxide mineralogy • Presence of problematic gangue (accessory) minerals • Presence of environmentally harmful minerals (AMD)
– Ore variability to be determined – resource evaluation • Mineralogical variation across the orebody • Extent of alteration in the orebody affects processing
4

Wall Rock Alteration as an Exploration Tool – Don Hausen, 1981
At Kalamazoo, San Manuel District, Nevada, copper mineralization is enclosed by a sericite mica alteration zone, as determined by quantitative XRD
5
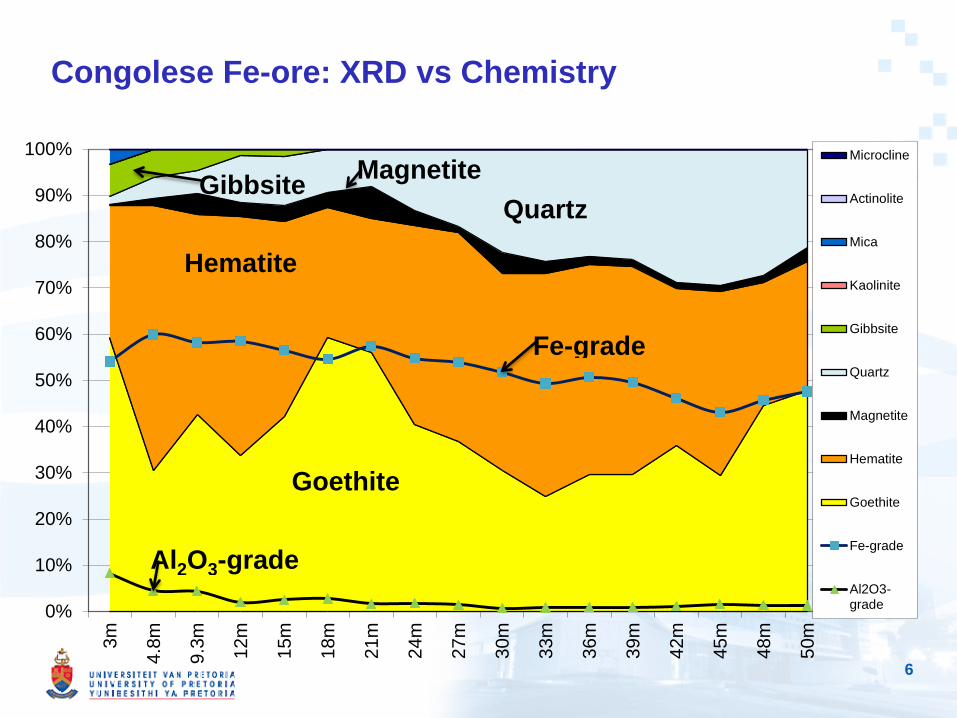
Congolese Fe-ore: XRD vs Chemistry
0
10
20
30
40
50
60
70
80
90
100
0%
10%
20%
30%
40%
50%
60%
70%
80%
90%
100%
3m
4.8m
9.3m 12
m
15m
18m
21m
24m
27m
30m
33m
36m
39m
42m
45m
48m
50m
Microcline
Actinolite
Mica
Kaolinite
Gibbsite
Quartz
Magnetite
Hematite
Goethite
Fe-grade
Al2O3-grade
Goethite
Hematite
Quartz Magnetite
Fe-grade
Al2O3-grade
Gibbsite
6
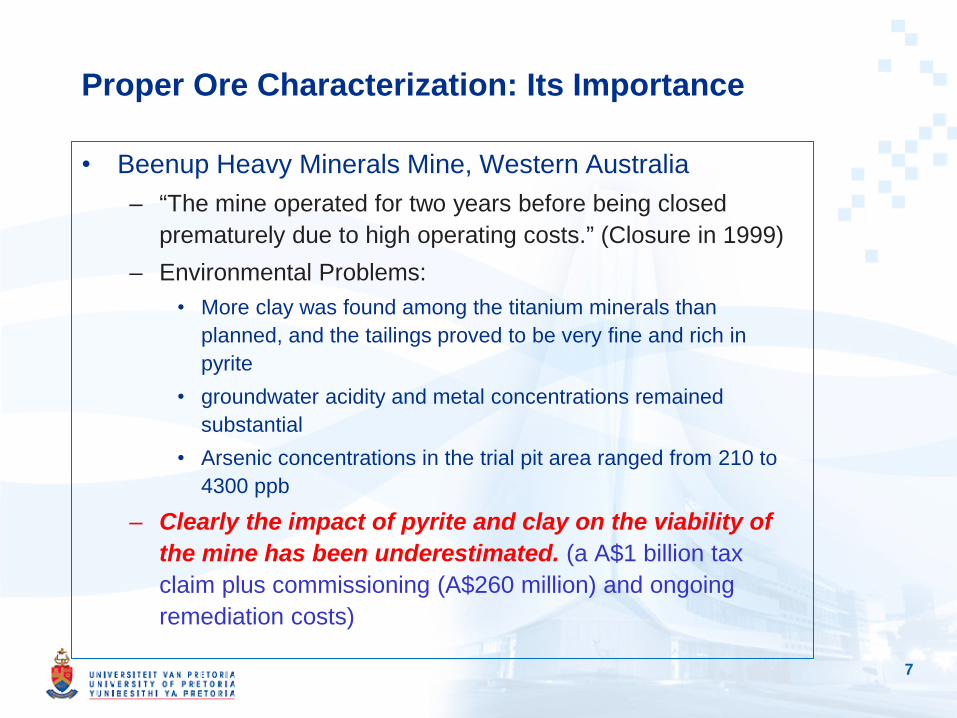
Proper Ore Characterization: Its Importance
• Beenup Heavy Minerals Mine, Western Australia – “The mine operated for two years before being closed
prematurely due to high operating costs.” (Closure in 1999) – Environmental Problems:
• More clay was found among the titanium minerals than planned, and the tailings proved to be very fine and rich in pyrite
• groundwater acidity and metal concentrations remained substantial
• Arsenic concentrations in the trial pit area ranged from 210 to 4300 ppb
– Clearly the impact of pyrite and clay on the viability of the mine has been underestimated. (a A$1 billion tax claim plus commissioning (A$260 million) and ongoing remediation costs)
7

Applicability of QPA for Ore Evaluation
• XRD is most used for the quantification of ores with major amounts of valuable minerals – Iron/Mn ores 55% Fe(Sishen) 20% Fe(Labrador trough) – Fluorspar 9-10% (USGS) – Ilmenite/rutile 8% (Hard Rock) 2-3% (Heavy minerals
• Gangue minerals can be quantified – Effects of gangue minerals on processing – Zoning of mineralization defined by silicate minerals – Fine-grained ores are easily quantified (<5 μm sizes are
below the resolution limit of micro-analysis) • Relatively easy and representative sample preparation
compared to sampling and polishing for SEM analysis
8
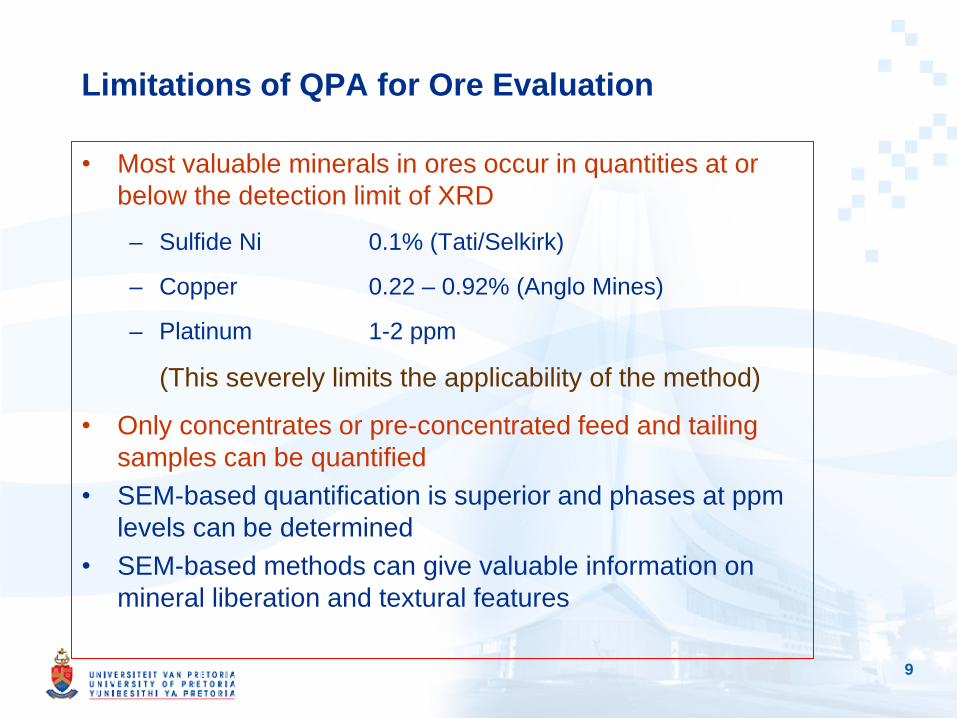
Limitations of QPA for Ore Evaluation
• Most valuable minerals in ores occur in quantities at or below the detection limit of XRD – Sulfide Ni 0.1% (Tati/Selkirk)
– Copper 0.22 – 0.92% (Anglo Mines)
– Platinum 1-2 ppm
(This severely limits the applicability of the method)
• Only concentrates or pre-concentrated feed and tailing samples can be quantified
• SEM-based quantification is superior and phases at ppm levels can be determined
• SEM-based methods can give valuable information on mineral liberation and textural features
9

XRD Use in the Minerals Industry
• Mineral processing – Minerals and not chemical species are processed – Gangue minerals affect recovery of valuable minerals – Mass balance calculation to assess the extent of upgrading
possible
• Pyrometallurgical processing – Evaluation of reaction mechanisms – Kinetics of metallurgical reactions – Troubleshooting of processes – Assessment of suitability of slag reprocessing/reuse
10
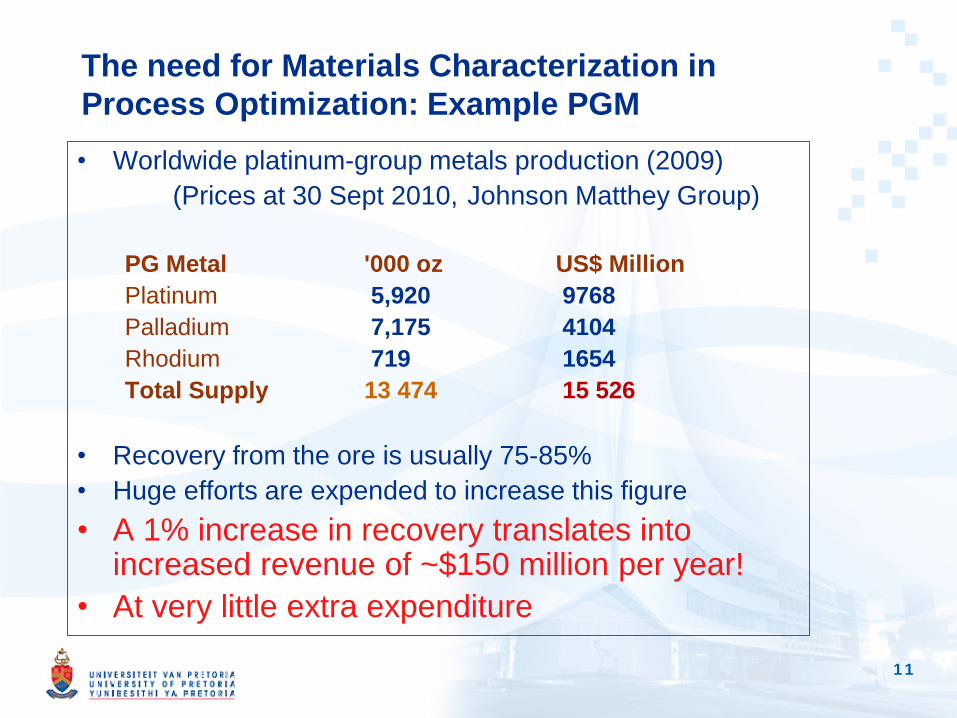
The need for Materials Characterization in Process Optimization: Example PGM • Worldwide platinum-group metals production (2009) (Prices at 30 Sept 2010, Johnson Matthey Group)
PG Metal '000 oz US$ Million Platinum 5,920 9768 Palladium 7,175 4104 Rhodium 719 1654 Total Supply 13 474 15 526
• Recovery from the ore is usually 75-85% • Huge efforts are expended to increase this figure • A 1% increase in recovery translates into
increased revenue of ~$150 million per year! • At very little extra expenditure
11
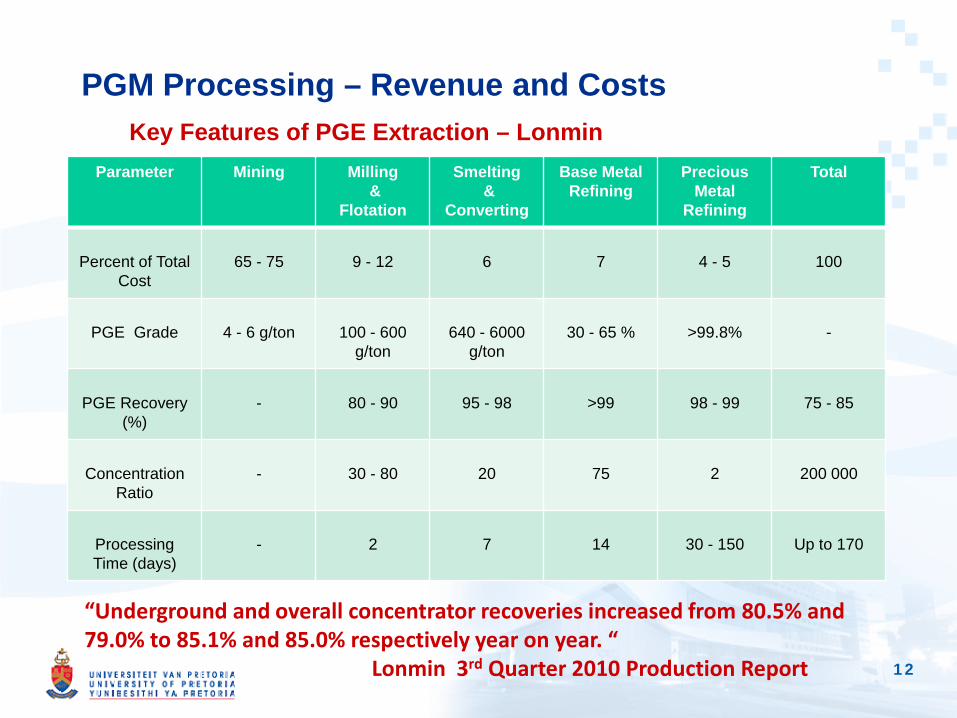
PGM Processing – Revenue and Costs
Parameter Mining Milling &
Flotation
Smelting &
Converting
Base Metal Refining
Precious Metal
Refining
Total
Percent of Total
Cost
65 - 75
9 - 12
6
7
4 - 5
100
PGE Grade
4 - 6 g/ton
100 - 600
g/ton
640 - 6000
g/ton
30 - 65 %
>99.8%
-
PGE Recovery
(%)
-
80 - 90
95 - 98
>99
98 - 99
75 - 85
Concentration
Ratio
-
30 - 80
20
75
2
200 000
Processing Time (days)
-
2
7
14
30 - 150
Up to 170
Key Features of PGE Extraction – Lonmin
“Underground and overall concentrator recoveries increased from 80.5% and 79.0% to 85.1% and 85.0% respectively year on year. “ Lonmin 3rd Quarter 2010 Production Report
12
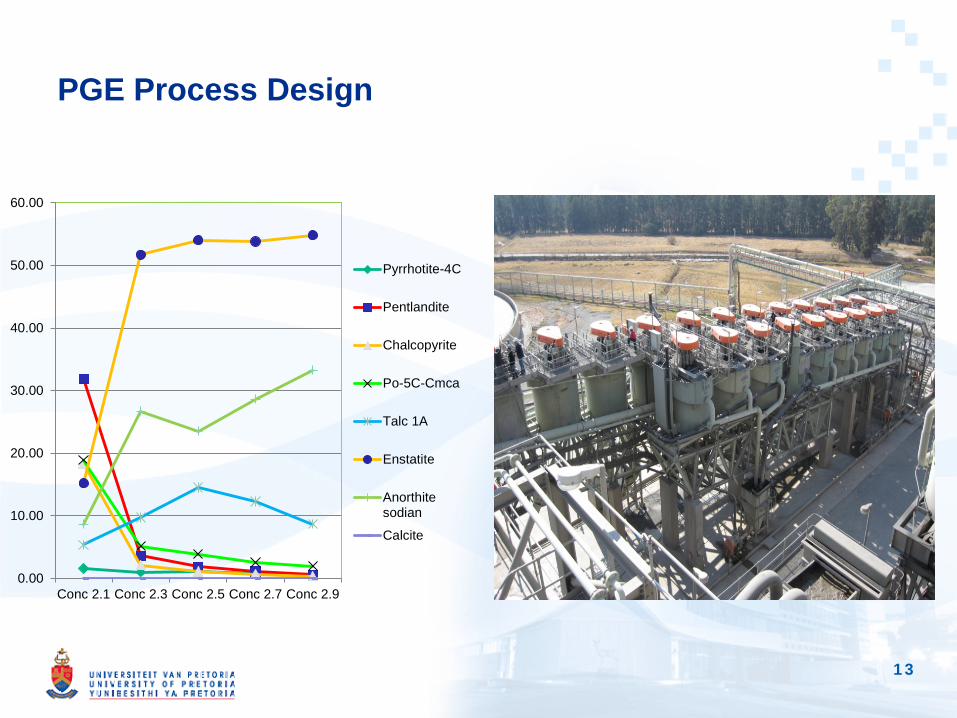
PGE Process Design
0.00
10.00
20.00
30.00
40.00
50.00
60.00
Conc 2.1 Conc 2.3 Conc 2.5 Conc 2.7 Conc 2.9
Pyrrhotite-4C
Pentlandite
Chalcopyrite
Po-5C-Cmca
Talc 1A
Enstatite
Anorthitesodian
Calcite
13

Element Distribution in Iron Ores BS
BSE Fe
Al Si
14

Mass Balance: Combination of XRD and XRF
QPA can be seriously in error because of: • the presence of undetected phases or minerals • the presence of amorphous material • preferred orientation and micro-absorption effects Mass balance can alert the analyst of serious discrepancies
Mass Balance Calculation - Fe ore FCF11-AMass Balance Fraction(XRD) SiO2 Al2O3 TiO2 Fe2O3 LOI P2O5 K2OAnnite 0.21 0.06 0.02 0.00 0.09 0.00 0.00 0.03Gibbsite 0.17 0.00 0.11 0.00 0.00 0.06 0.00 0.00Goethite 60.48 2.49 3.09 0.81 47.80 6.29 0.00 0.00Hematite 32.78 0.33 0.46 0.00 31.99 0.00 0.00 0.00Kaolinite 2.17 1.00 0.85 0.00 0.00 0.30 0.00 0.00Magnetite_ 3.82 0.00 0.01 0.00 3.94 0.00 0.00 0.00Quartz 0.38 0.38 0.00 0.00 0.00 0.00 0.00 0.00Total 100.01 4.27 4.54 0.81 83.83 6.64 0.00 0.04 100.12 R(%)Analysis 3.59 4.54 0.69 82.58 7.44 0.11 0.00 98.95 3.03
15

Al and Fe Distribution in Iron Ore Minerals COMMENTS • The percentage deviation (3%) in the mass balance calculation is acceptable to draw conclusions • 68% of the Al in the sample is due to the presence of goethite • The goethite also contains 60% of the iron in the sample and cannot be removed • Therefore, if Al is to be removed, only kaolinite and gibbsite can be eliminated without major iron loss • Only 22% of the Al can be removed by flotation or other methods
Annite0%
Gibbsite0%
Goethite60%
Hematite40%
Kaolinite0%
FCF11-A Fe distribution
Gibbsite3%
Goethite68%
Hematite10%
Kaolinite19%
FCF11-A Al distribution
16
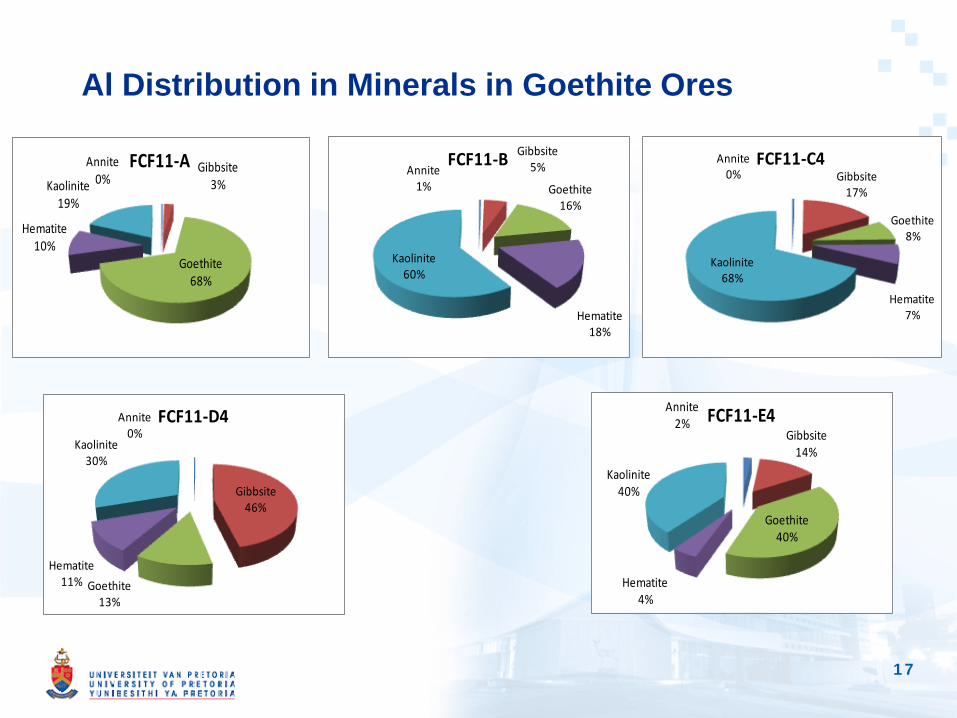
Al Distribution in Minerals in Goethite Ores
17
Annite0%
Gibbsite3%
Goethite68%
Hematite10%
Kaolinite19%
FCF11-A Annite1%
Gibbsite5%
Goethite16%
Hematite18%
Kaolinite60%
FCF11-B Annite0% Gibbsite
17%
Goethite8%
Hematite7%
Kaolinite68%
FCF11-C4
Annite0%
Gibbsite46%
Goethite13%
Hematite11%
Kaolinite30%
FCF11-D4 Annite2%
Gibbsite14%
Goethite40%
Hematite4%
Kaolinite40%
FCF11-E4

Contrasting Hematite and Magnetite
M
H
To distinguish Hematite and Magnetite in sinters using SEM methods is problematic
With XRD it is easy!
19

Accretion layers in Titania slag furnaces
• Accretion layers form in titania slag furnaces
• The layers prevent the accumulation of molten pig iron in the furnace hearth
• Accretion layers also reduce the furnace volume leading to lower throughput
• The accretion layers consist of anosovite (Almost pure Ti3O5) with a very high solidus temperature (1775°C)
• The metal phase is a mixture of iron and cementite (Fe3C)
• Removal of the accretion layer without furnace shutdown ? Ilmenite addition
M3O5-Monocl
Met2007_Metallic_Sample10.raw - Met2007_Metallic_Sample10.raw
2 Theta / °4038363432302826242220
I / c
ps
750
700
650
600
550
500
450
400
350
300
250
200
150
100
50
0
M3O5-Ortho
Differences
2 Theta / °4038363432302826242220
I / cps
300
200
100
0
-100
-200
-300
21

Titania Slag Disintegration:
• Disintegration of slag blocks collected from 1.5 MW pilot furnace
• Excessive fine material is generated – Causes problems in fluid bed chlorination reactors
• Mechanism?
22
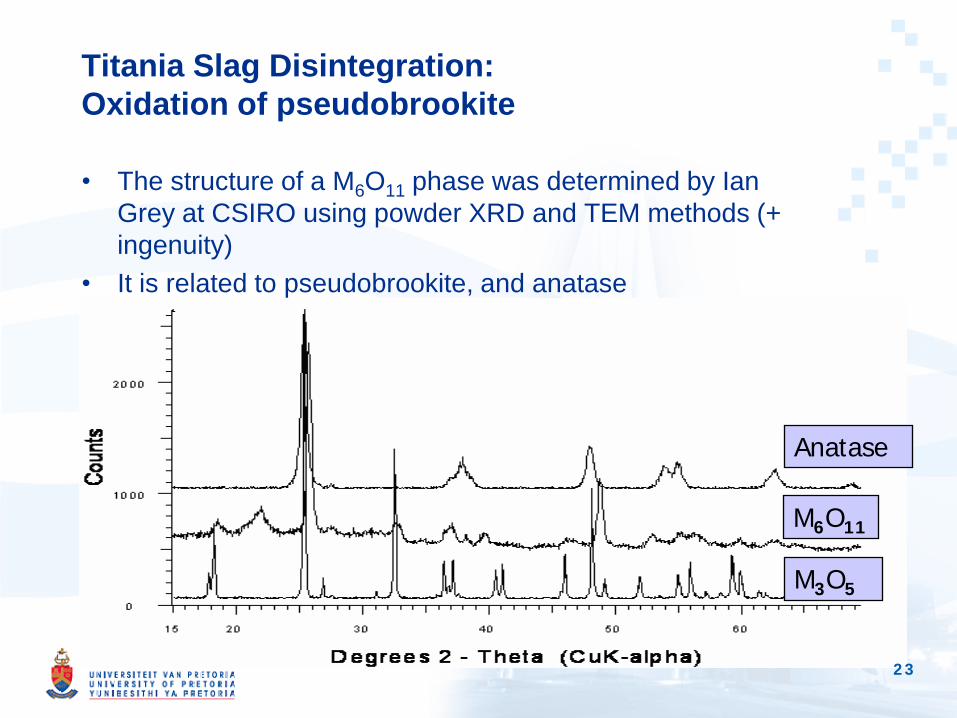
Titania Slag Disintegration: Oxidation of pseudobrookite
• The structure of a M6O11 phase was determined by Ian Grey at CSIRO using powder XRD and TEM methods (+ ingenuity)
• It is related to pseudobrookite, and anatase
Anatase
M6O11
M3O5
23
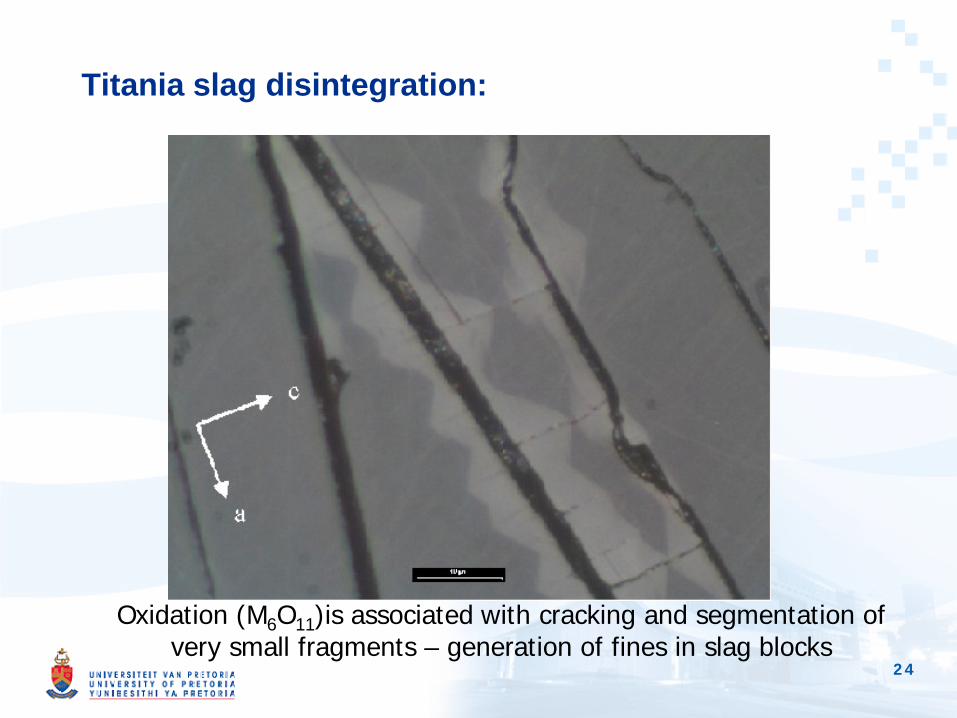
Titania slag disintegration:
Oxidation (M6O11)is associated with cracking and segmentation of very small fragments – generation of fines in slag blocks
24

Dimensional Changes: Lattice Constants
3.72
3.74
3.76
3.78
3.80
50 100 150 200 250 300 350
Temperature (°C)
a-ax
is(Å
)
9.4
9.6
9.8
10.0
10.2
b,c-
axis
(Å)
a axis
b axis
c axis
25
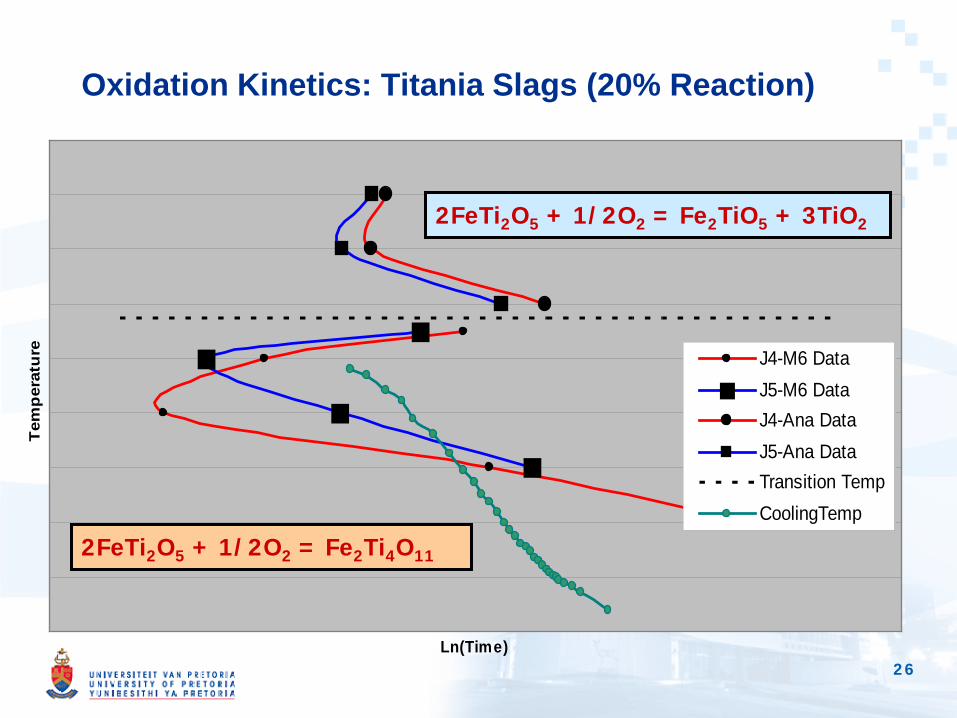
Oxidation Kinetics: Titania Slags (20% Reaction)
Ln(Time)
Tem
pera
ture J4-M6 Data
J5-M6 DataJ4-Ana DataJ5-Ana DataTransition TempCoolingTemp
2FeTi2O5 + 1/2O2 = Fe2TiO5 + 3TiO2
2FeTi2O5 + 1/2O2 = Fe2Ti4O11
26
Lattice Constant Refinement Example: Ilmenite Purification
• Ilmenite is used as a feedstock for rutile pigment production
• Impurities such as Cr and V are undesirable as they colour the white pigment
• Other impurities such as Ca and Mg cause problems in the fluid bed chlorination of ilmenite or titania slag, produced from ilmenite
• Most plants use oxidative roasting to modify the magnetic properties of ilmenite, so that it can easily be purified
• The Fe2+ is oxidised to Fe3+ with the formation of anatase or rutile:
FeTiO3 + O2 ⇒ TiO2 + (Fe2O3-FeTiO3)ss • The longer the oxidation – the more Fe-rich the solid
solution
27
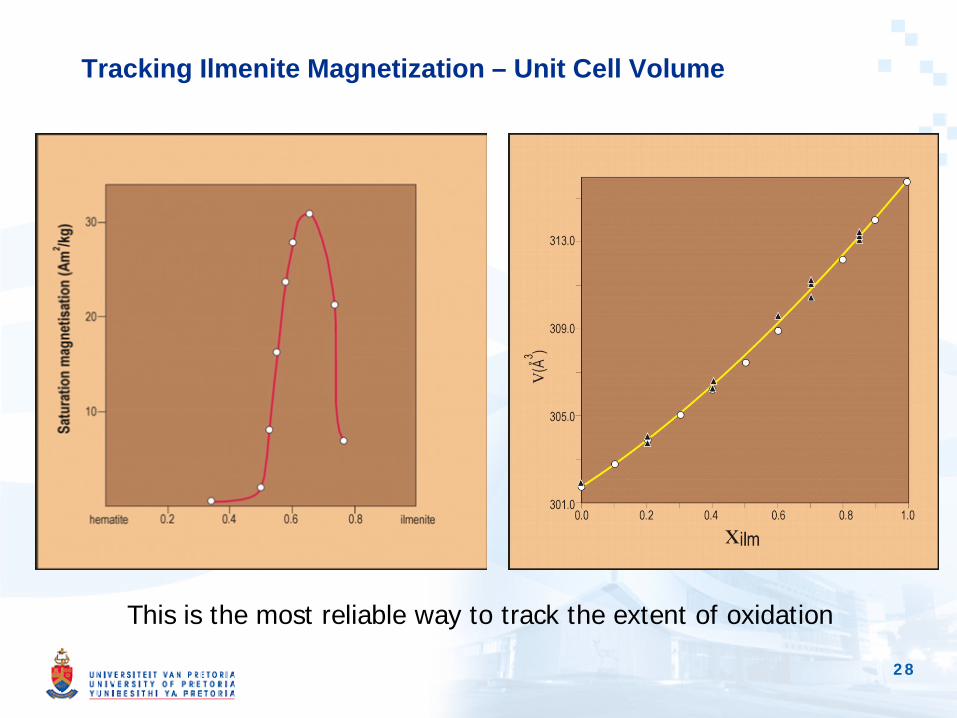
Tracking Ilmenite Magnetization – Unit Cell Volume
This is the most reliable way to track the extent of oxidation
28
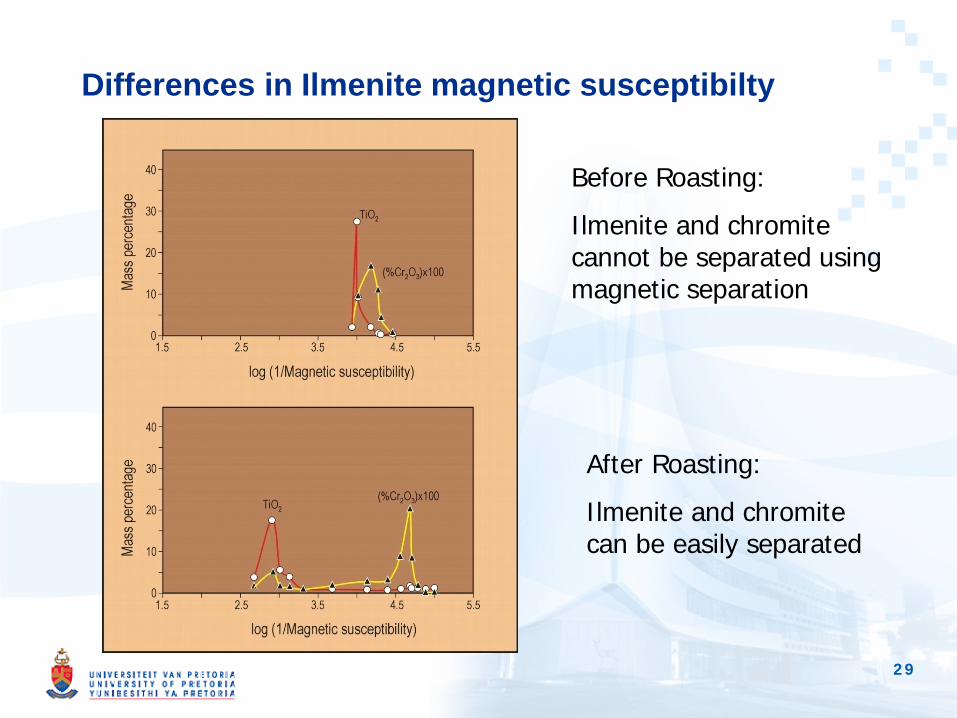
Differences in Ilmenite magnetic susceptibilty
Before Roasting: Ilmenite and chromite cannot be separated using magnetic separation
After Roasting: Ilmenite and chromite can be easily separated
29
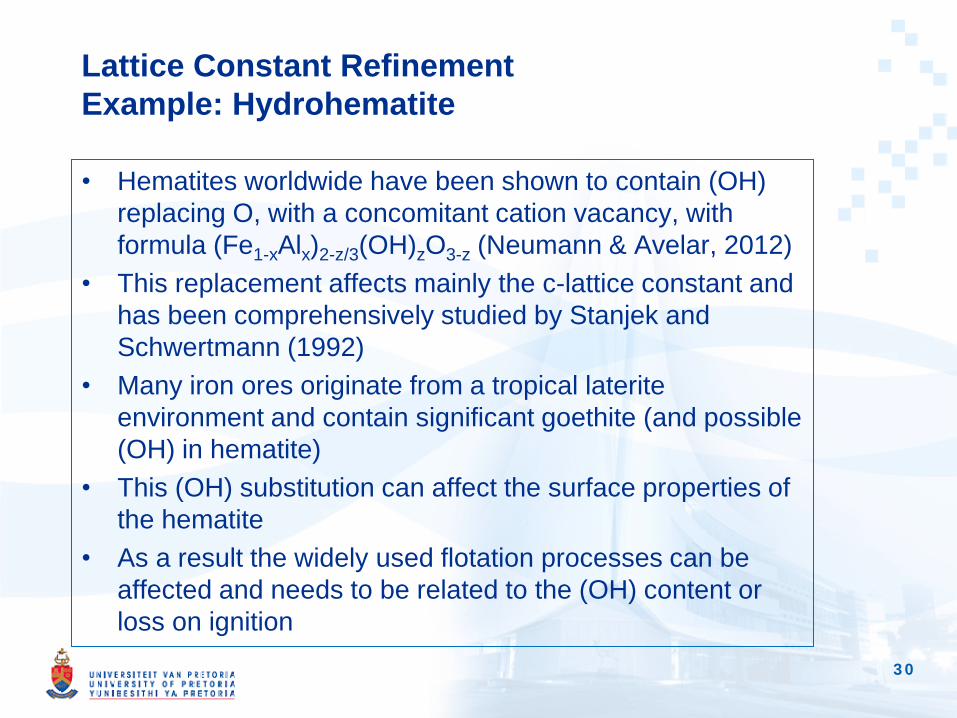
Lattice Constant Refinement Example: Hydrohematite
• Hematites worldwide have been shown to contain (OH) replacing O, with a concomitant cation vacancy, with formula (Fe1-xAlx)2-z/3(OH)zO3-z (Neumann & Avelar, 2012)
• This replacement affects mainly the c-lattice constant and has been comprehensively studied by Stanjek and Schwertmann (1992)
• Many iron ores originate from a tropical laterite environment and contain significant goethite (and possible (OH) in hematite)
• This (OH) substitution can affect the surface properties of the hematite
• As a result the widely used flotation processes can be affected and needs to be related to the (OH) content or loss on ignition 30
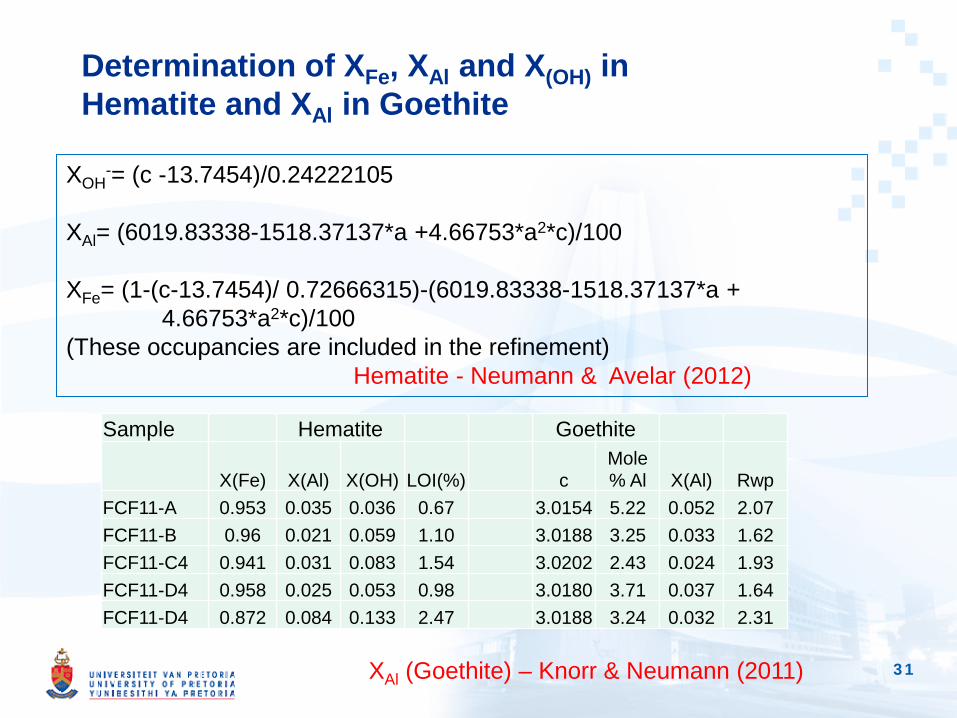
Determination of XFe, XAl and X(OH) in Hematite and XAl in Goethite
Sample Hematite Goethite
X(Fe) X(Al) X(OH) LOI(%) c Mole % Al X(Al) Rwp
FCF11-A 0.953 0.035 0.036 0.67 3.0154 5.22 0.052 2.07 FCF11-B 0.96 0.021 0.059 1.10 3.0188 3.25 0.033 1.62 FCF11-C4 0.941 0.031 0.083 1.54 3.0202 2.43 0.024 1.93 FCF11-D4 0.958 0.025 0.053 0.98 3.0180 3.71 0.037 1.64 FCF11-D4 0.872 0.084 0.133 2.47 3.0188 3.24 0.032 2.31
XOH-= (c -13.7454)/0.24222105
XAl= (6019.83338-1518.37137*a +4.66753*a2*c)/100 XFe= (1-(c-13.7454)/ 0.72666315)-(6019.83338-1518.37137*a + 4.66753*a2*c)/100 (These occupancies are included in the refinement) Hematite - Neumann & Avelar (2012)
XAl (Goethite) – Knorr & Neumann (2011) 31

Challenges for Powder XRD and its Wider Application in Mineral Science
• Decrease the detection limits of the various phases
• More reliable quantification of minor and trace phases
• Need better formalisms for preferred orientation and micro-absorption
• Increased use of cluster analysis for ore characterization
• Choice of appropriate crystal structures for the minerals present in the samples (39 chromites, 95 diopsides, etc. in the Topas database)
• Better and faster sample grinding and micronising to reduce particle size without overmilling
• Spray drying and micro-agglomeration to reduce preferred orientation must be given serious consideration 32
Summary – Research Opportunities
• Research is driven mostly by industry needs – Use in exploration – Proper ore characterization – Process optimization is as important as before
• Materials characterization – Some common minerals and phases need better
characterization • Materials behaviour in metallurgical processes
– Can evaluate the kinetics of the reactions – Can assist in the thermodynamic analysis
• Troubleshooting of processes – Examination of side reactions – Possible elimination of problematic situations
33

Acknowledgments
• Reiner Neumann • Nathan Webster , Liming Lu and Ian Madsen of CSIO • Solly Theron of EXXARO • Deon Bessinger of Kumba Iron Ore • Johan Nell of Hatch (SA)
34