effect of ph on the formation of goethite and hematite ... 31/31-4-277.pdf · effect of ph on the...
TRANSCRIPT
Clays and Clay Minerals, Vol. 31, No. 4, 277-284, 1983.
EFFECT OF pH ON THE FORMATION OF GOETHITE AND HEMATITE FROM FERRIHYDRITE
U. SCHWERTMANN AND E. MURAD
Lehrstuhl f/ir Bodenkunde, Technische Universit~t M/Jnchen D-8050 Freising-Weihenstephan, Federal Republic of Germany
Abstraet~Storage of ferrihydrite in aqueous suspensions at 24~ and pHs between 2.5 and 12 for as long as three years resulted in the formation of goethite and hematite. The proportions and crystallinity of these products varied widely with the pH. Maximum hematite was formed between pH 7 and 8, and maximum goethite at pH 4 and at pH 12. The crystallinity of both products, as indicated by X-ray powder diffraction line broadening and magnetic hyperfine field values and distribution widths, was poorer, the lower the proportion of the corresponding product in the mixture. The existence of two competitive formation pro- cesses is suggested: goethite is formed via solution, preferably from monovalent Fe(III) ions [Fe(OH)z § and Fe(OH)4-], and hematite by internal rearrangement and dehydration within the ferrihydrite aggregates. This concept relates the proportions of goethite and hematite to the activity of the Fe(III) ion species in solution, and implies that conditions favorable for the formation of goethite are unfavorable for that of hematite and vice versa.
Key Words---Ferrihydrite, Goethite, Hematite, Mrssbauer spectroscopy, pH, X-ray powder diffraction.
INTRODUCTION
Brhm (1925) first showed that freshly precipitated, so-called "amorphous Fe(III) hydroxide" turns rapidly into pure goethite if kept for 2 hr under 2 M KOH at 150~ whereas hematite is the dominant end-product if the material is heated under water. A strong pH in- fluence on the transformation products of what is now known as ferrihydrite is obvious from these early re- sults. Whether or not pH is important in soils where goethite and hematite are commonly associated is not known; however, K~impf and Schwertmann (1983) found the goethite/hematite ratios in soils of southern Brazil to increase with decreasing pH within the soil pH range of 4.0-5.6.
To obtain more information on the influence of pH on the formation of Fe-oxides under pedogenic condi- tions, a long-term experiment was conducted in which freshly prepared ferrihydrite was stored in aqueous suspensions at 24~ and pH 2.5-12.0 for almost three years. In this paper the results are described, and a pH- dependent mechanism for the formation ofgoethi te and hematite is suggested.
MATERIALS AND METHODS
Several 100-ml batches of freshly prepared 0.1 M Fe(NO3)3 solution were precipitated with ammonia at pH 7.5-8.0. The precipitate is a very poorly ordered ferrihydrite, which gives only 2 broad X-ray powder diffraction (XRD) peaks at 2.5 and 1.5 A. The precipi- tates were thoroughly washed with water between pH 7 and 8 and resuspended with 250 ml of water. The sus- pensions were adjusted to pH values of 2.5, 3.0, 4.0, 5.0, 6.0, 7.0, 8.0, 9.0, 10.0, and 12.0 with HNO3 or NaOH and kept in a constant-temperature room at 24~ The
Copyright �9 1983, The Clay Minerals Society
pH was readjusted at first at weekly intervals, later once every several months.
Subsamples were taken at certain intervals, and the proportion of oxalate-soluble Fe (Fe0; Schwertmann, 1959, 1964) in these samples was used as an indicator of the degree of transformation of ferrihydrite to goe- thite and/or hematite. After 441 days the samples were investigated by X-ray powder diffraction (XRD) (CoK~ radiation, Philips PW 1130 diffractometer, graphite dif- fracted-beam monochromator), Mrssbauer spectros- copy, and transmission electron microscopy (TEM) (Zeiss EM 10; 80 kV). Samples were also investigated by XRD after 970 days.
Mrssbauer spectra were taken at room temperature on samples having an average Fe density of 10 mg/cm ~. Instrumentation included a 57Co/Rh source mounted on a loudspeaker-type drive system, a Kr proportional counter, and a 1024-channel analyzer. The hematite components of the spectra were fitted with one quad- rupole split sextet; those of goethite, which shows dis- tributions of magnetic hyperfine fields, were fitted with series of up to 15 sextets of different intensities.
For quantitative determination of hematite (Hm) and goethite (GO by XRD the integrated intensity (maxi- mum intensity times width at half height) of the 012 line of hematite multiplied by 3.5 (empirical factor for the 104/012-intensity ratio) and the integrated intensity of the 110 line of goethite were used.
For the determination of Hm/(Hm + Gt) ratios by Mrssbauer spectroscopy, the hematite subspectra were fitted with one sextet. The goethite subspectra, which showed asymmetrically broadened lines typical for this mineral, were each fitted with sets of three sextets of identical isomer shift and quadrupole splitting (a sim-
277
278 Schwertmann and Murad Clays and Clay Minerals
1,0"
Feo
0.1
0.01
0.001
pH
\ ~ \ \
\ 7
, , , , , , , �9
500 1000
Time (doys)
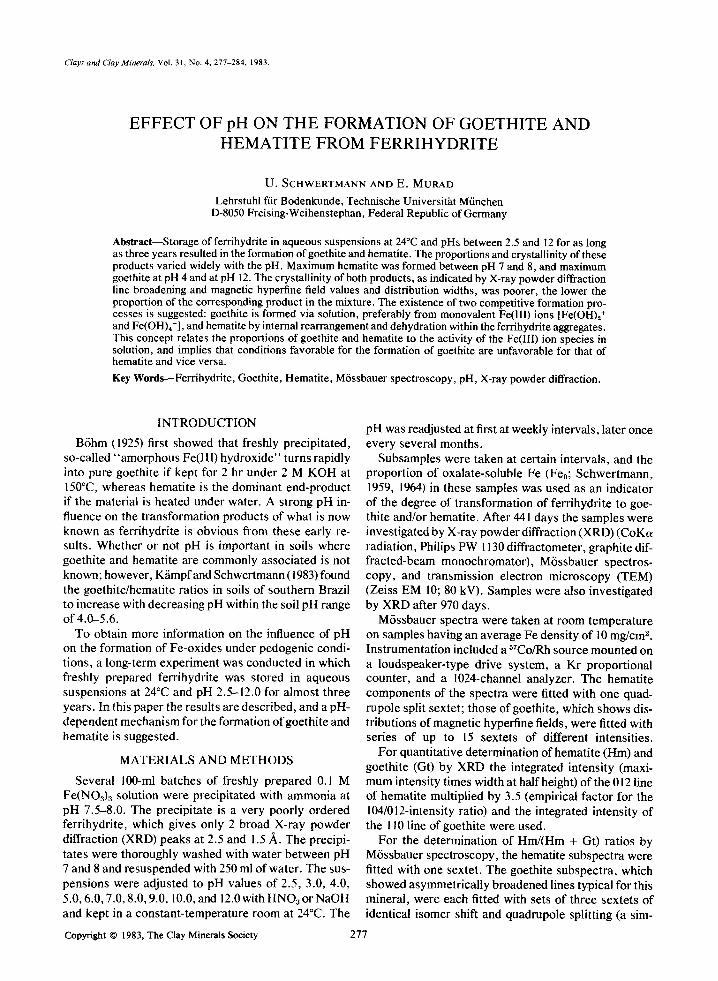
Figure 1. First-order reaction plot for the transformation of ferrihydrite at various pH values.
plified version of the hyperfine field distribution model used to characterize this mineral by Murad, 1982).
RESULTS
Rate of transformation
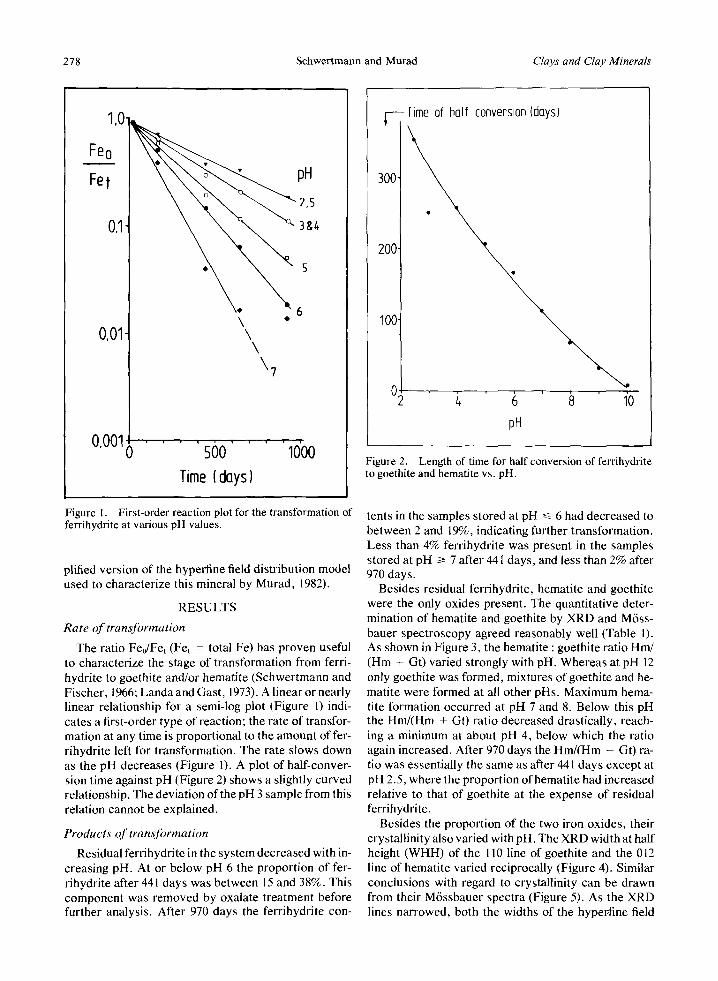
The ratio Fe0/Fet (Fet = total Fe) has proven useful to characterize the stage of transformation from ferri- hydrite to goethite and/or hematite (Schwertmann and Fischer, 1966; Landa and Gast, 1973). A linear or nearly linear relationship for a semi-log plot (Figure 1) indi- cates a first-order type of reaction; the rate of transfor- mation at any time is proportional to the amount offer- rihydrite left for transformation. The rate slows down as the pH decreases (Figure 1). A plot of haft-conver- sion time against pH (Figure 2) shows a slightly curved relationship. The deviation of the pH 3 sample from this relation cannot be explained.
Products of transformation
Residual ferrihydrite in the system decreased with in- creasing pH. At or below pH 6 the proportion of fer- rihydrite after 441 days was between 15 and 38%. This component was removed by oxalate treatment before further analysis. After 970 days the ferrihydrite con-
300
200
100
Time of holf conversion (doys)
i I
6 8 1'o pH
Figure 2. Length of time for half conversion of ferrihydrite to goethite and hematite vs. pH.
tents in the samples stored at pH ~ 6 had decreased to between 2 and 19%, indicating further transformation. Less than 4% ferrihydrite was present in the samples stored at pH/> 7 after 441 days, and less than 2% after 970 days.
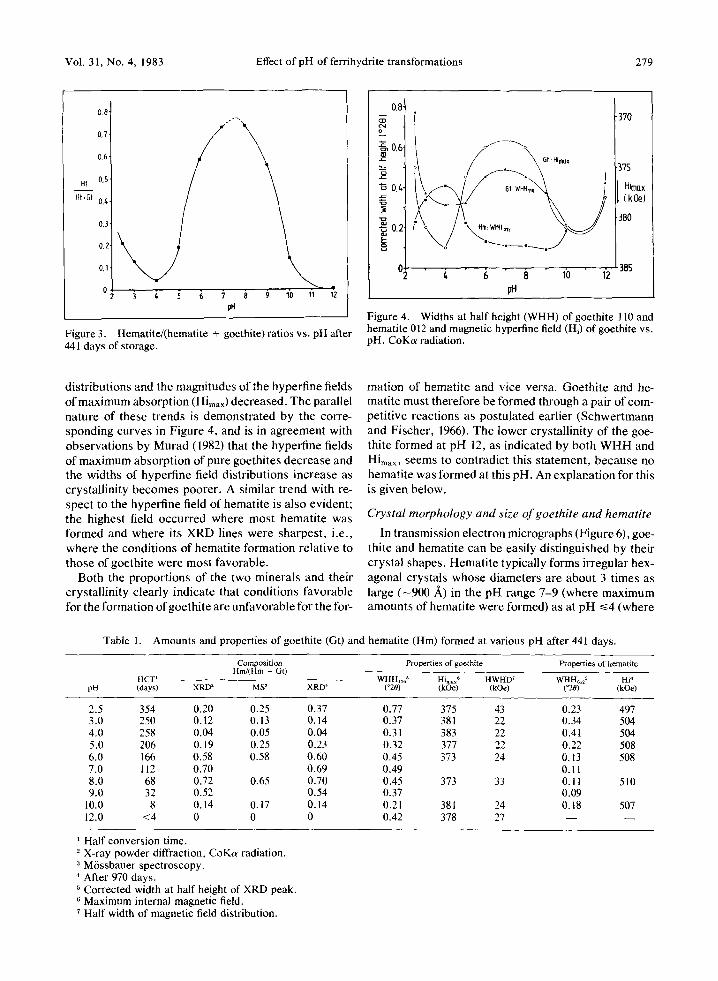
Besides residual ferrihydrite, hematite and goethite were the only oxides present. The quantitative deter- mination of hematite and goethite by XRD and M6ss- bauer spectroscopy agreed reasonably well (Table I). As shown in Figure 3, the hematite : goethite ratio Hm/ (Hm + Gt) varied strongly with pH. Whereas at pH 12 only goethite was formed, mixtures ofgoethite and he- matite were formed at all other pHs. Maximum hema- tite formation occurred at pH 7 and 8. Below this pH the Hm/(Hm + Gt) ratio decreased drastically, reach- ing a minimum at about pH 4, below which the ratio again increased. After 970 days the Hm/(Hm + Gt) ra- tio was essentially the same as after 441 days except at pH 2.5, where the proportion of hematite had increased relative to that of goethite at the expense of residual ferrihydrite.
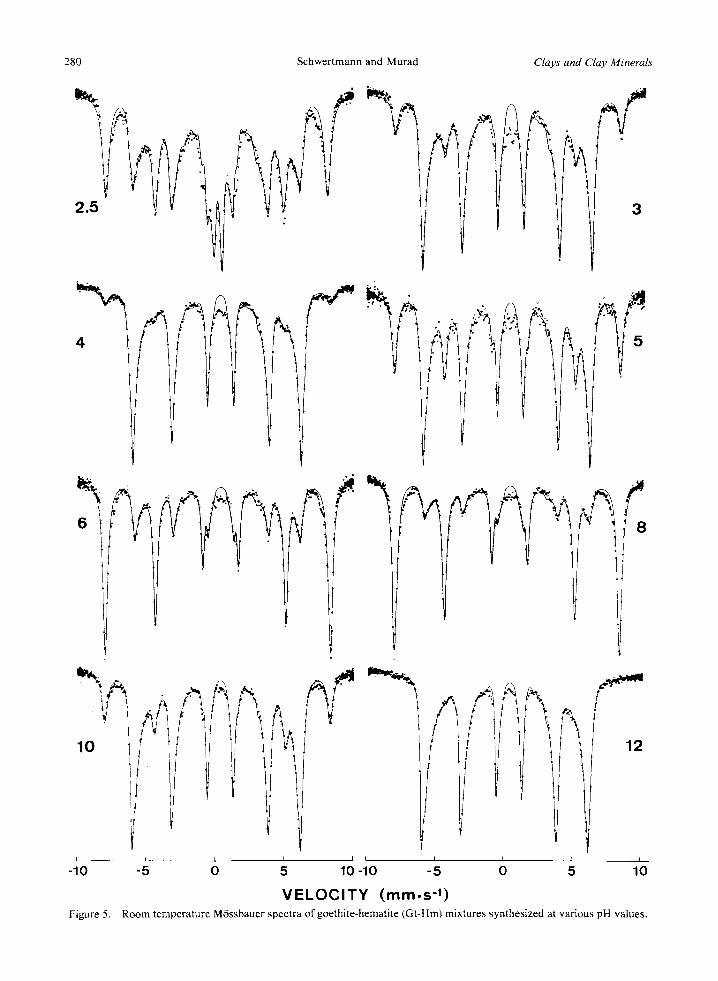
Besides the proportion of the two iron oxides, their crystallinity also varied with pH. The XRD width at half height (WHH) of the l l0 line of goethite and the 012 line of hematite varied reciprocally (Figure 4). Similar conclusions with regard to crystallinity can be drawn from their M6ssbauer spectra (Figure 5). As the XRD lines narrowed, both the widths of the hyperfine field
Vol. 31, No. 4, 1983 Effect of pH of ferrihydrite transformations 279
0.8"
0,7"
0,6"
HI 05
- ~ 0,4
0,3
0.2
0.1
01 3 4 5 6 7 8 9 10 11 12 pH
Figure 3. Hematite/(hematite + goethite) ratios vs. pH after 441 days of storage.
O.B')
"4 }
g o.6t
~ o.~4
g ~ o.2t
370
l / ~ 6 f :Hi.x \ o, 3 , , i ImQx
x : WMH,,2 380
\ / .--_._.___J
i, " 6 ~ 8 ' 1'0 ' 1'2 385
Figure 4. Widths at half height (WHH) of goethite 110 and hematite 012 and magnetic hyperfine field (Hi) of goethite vs. pH. CoKc~ radiation.
distributions and the magnitudes of the hyperfine fields of maximum absorption (Himax) decreased. The parallel nature of these trends is demonstrated by the corre- sponding curves in Figure 4, and is in agreement with observations by Murad (1982) that the hyperfine fields of maximum absorption of pure goethites decrease and the widths of hyperfine field distributions increase as crystallinity becomes poorer. A similar trend with re- spect to the hyperfine field of hematite is also evident; the highest field occurred where most hematite was formed and where its XRD lines were sharpest, i.e., where the conditions of hematite formation relative to those of goethite were most favorable.
Both the proportions of the two minerals and their crystallinity clearly indicate that conditions favorable for the formation ofgoethite are unfavorable for the for-
Table I. Amounts and properties of goethite (Gt) and
mation of hematite and vice versa. Goethite and he- matite must therefore be formed through a pair of com- petitive reactions as postulated earlier (Schwertmann and Fischer, 1966). The lower crystallinity of the goe- thite formed at pH 12, as indicated by both WHH and Hima• seems to contradict this statement, because no hematite was formed at this pH. An explanation for this is given below.
Crystal morphology and size of goethite and hematite
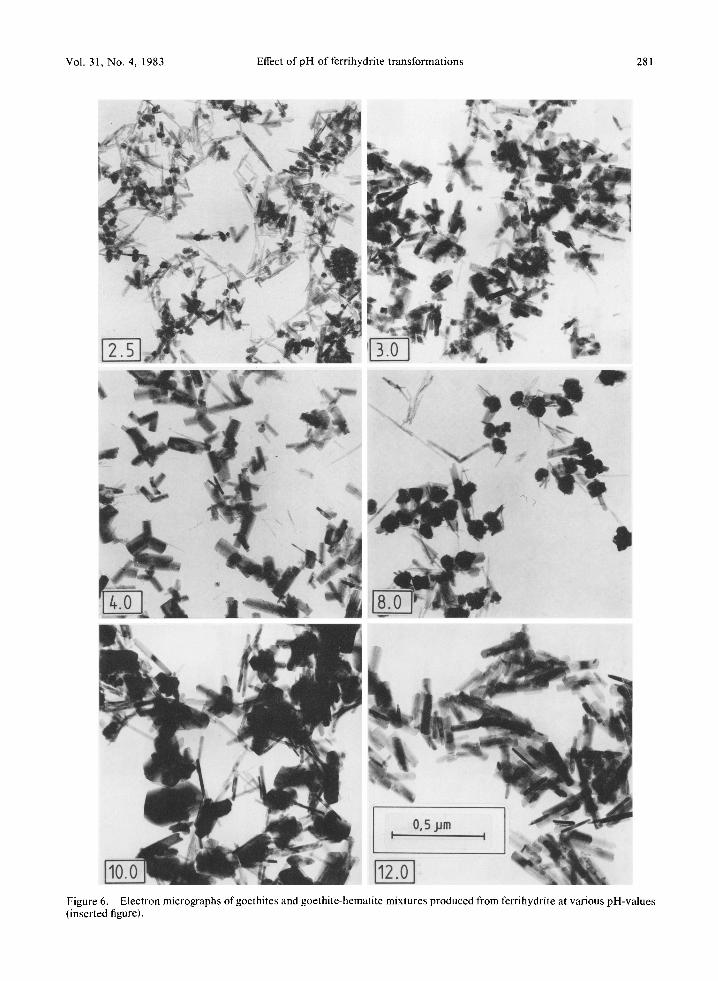
In transmission electron micrographs (Figure 6), goe- thite and hematite can be easily distinguished by their crystal shapes. Hematite typically forms irregular hex- agonal crystals whose diameters are about 3 times as large ( -900 A) in the pH range 7-9 (where maximum amounts of hematite were formed) as at pH ~<4 (where
hematite (Hm) formed at various pH after 441 days.
Composition Hm/(Hm + Gt)
HCT ~ pH (days) XRD 2 MS 3 XRD 4
Properties of goethite Properties of hematite
WHH.o s Him.x 6 HWHD 7 WHH~ s Hi S (~ (kOe) (kOe) (~ (kOe)
2.5 354 0.20 0.25 0.37 3.0 250 0.12 0.13 0.14 4.0 258 0.04 0.05 0.04 5.0 206 0.19 0.25 0.23 6.0 166 0.58 0.58 0.60 7.0 112 0.70 0.69 8.0 68 0.72 0.65 0.70 9.0 32 0.52 0.54
10.0 8 0.14 0.17 0.14 12.0 <4 0 0 0
0.77 375 43 0.23 497 0.37 381 22 0.34 504 0.31 383 22 0.41 504 0.32 377 22 0.22 508 0.45 373 24 0.13 508 0.49 0.11 0.45 373 33 0.11 510 0.37 0.09 0.21 381 24 0.18 507 0.42 378 27 - - - -
1 Half conversion time. 2 X-ray powder diffraction, CoKa radiation. 3 Mtssbauer spectroscopy. 4 After 970 days.
Corrected width at half height of XRD peak. 6 Maximum internal magnetic field. 7 Half width of magnetic field distribution.
280 Schwertmann and Murad
4
~ ~
!
Clays a n d Clay Minera l s
3
~~ ~ ~~
> 10
I
/ 19
, , . , , , , , , .
-10 -5 0 5 10 -10 -5 0 5 1 o
V E L O C I T Y ( m m . s -1) Figure 5. Room temperature M6ssbauer spectra of goethite-hematite (Gt-Hm) mixtures synthesized at various pH values.
Vol. 31, No. 4, 1983 Effect of pH of ferrihydrite transformations 281
Figure 6. Electron micrographs of goethites and goethite-hematite mixtures produced from ferrihydrite at various pH-values (inserted figure).
282 Schwertmann and Murad Clays and Clay Minerals
_~ 100 z 95
P~
9O
r"
I I I I I
-10 -5 0 5 10 VELOCITY (ram s -t)
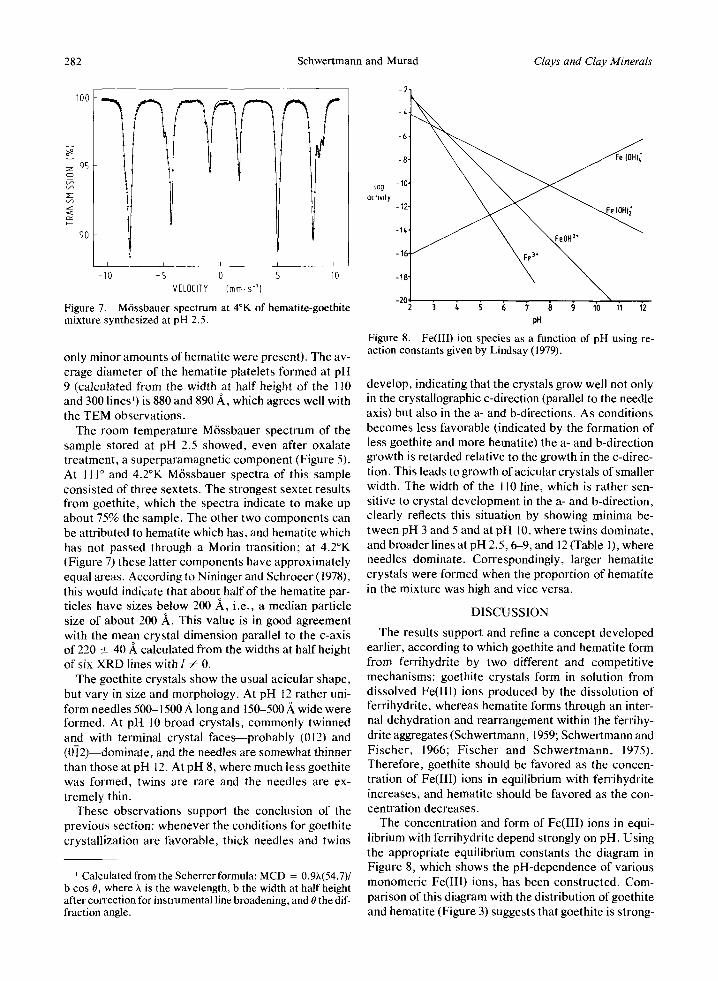
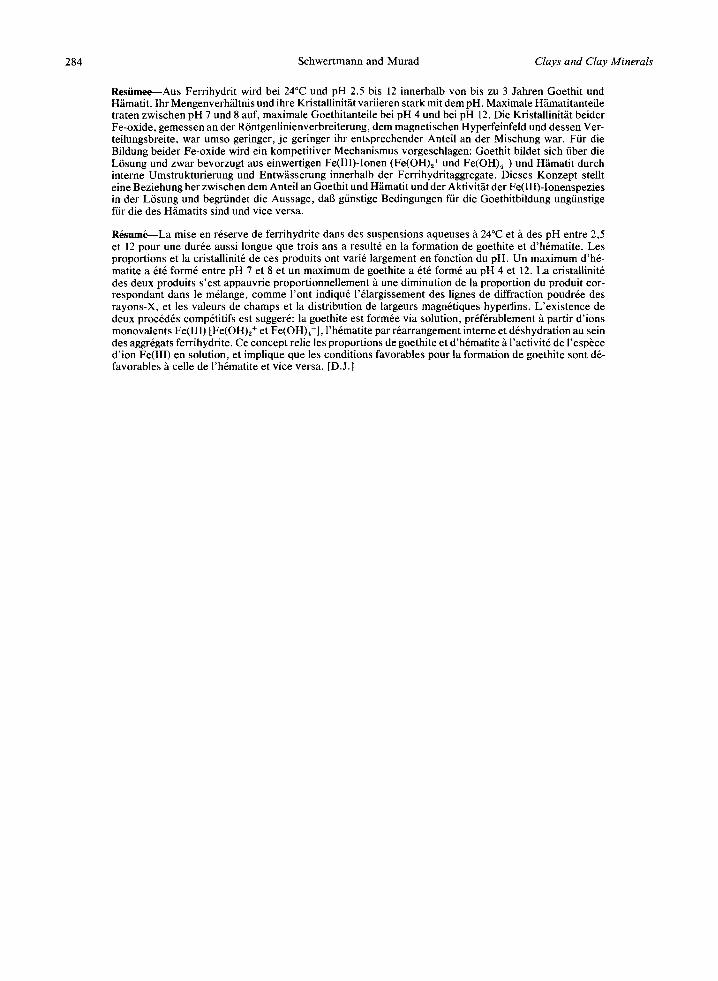
Figure 7. M6ssbauer spectrum at 4~ of hematite-goethite mixture synthesized at pH 2.5.
only minor amounts of hematite were present). The av- erage diameter of the hematite platelets formed at pH 9 (calcuJated from the width at half height of the 1 I0 and 300 lines 1) is 880 and 890 ~,, which agrees well with the TEM observations.
The room temperature M6ssbauer spectrum of the sample stored at pH 2.5 showed, even after oxalate treatment, a superparamagnetic component (Figure 5). At 111 ~ and 4.2~ M6ssbauer spectra of this sample consisted of three sextets. The strongest sextet results from goethite, which the spectra indicate to make up about 75% the sample. The other two components can be attributed to hematite which has, and hematite which has not passed through a Morin transition; at 4.2~ (Figure 7) these latter components have approximately equal areas. According to Nininger and Schroeer (1978), this would indicate that about half of the hematite par- ticles have sizes below 200 ~ , i.e., a median particle size of about 200 ~ . This value is in good agreement with the mean crystal dimension parallel to the c-axis of 220 --- 40 ,~ calculated from the widths at half height of six XRD lines with l ~ 0.
The goethite crystals show the usual acicular shape, but vary in size and morphology. At pH 12 rather uni- form needles 500-1500,~ long and 150-500,~ wide were formed. At pH 10 broad crystals, commonly twinned and with terminal crystal faces---probably (012) and (0]2)--dominate, and the needles are somewhat thinner than those at pH 12. At pH 8, where much less goethite was formed, twins are rare and the needles are ex- tremely thin.
These observations support the conclusion of the previous section: whenever the conditions for goethite crystallization are favorable, thick needles and twins
1 Calculated from the Scherrer formula: MCD = 0.9k(54.7)/ b cos 0, where h is the wavelength, b the width at half height after correction for instrumental line broadening, and 0 the dif- fraction angle.
t0g achvify 10 Fe (OH)~
-16
2 3 t~ 5 6 ? 8 9 10 11 12 pH
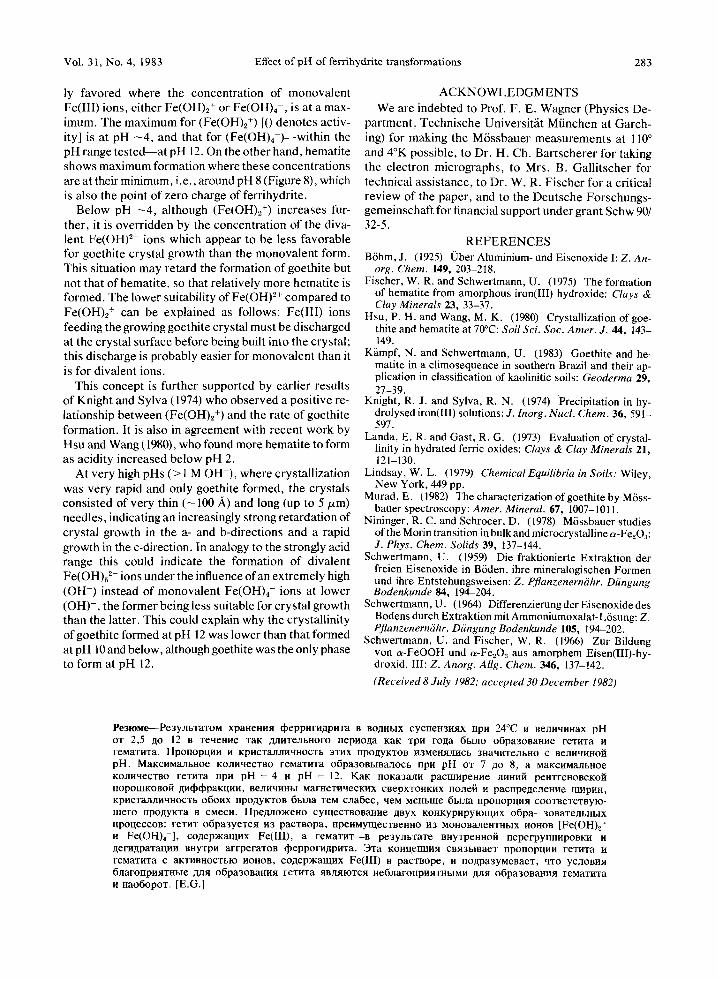
Figure 8. Fe(III) ion species as a function of pH using re- action constants given by Lindsay (1979).
develop, indicating that the crystals grow well not only in the crystallographic c-direction (parallel to the needle axis) but also in the a- and b-directions. As conditions becomes less favorable (indicated by the formation of less goethite and more hematite) the a- and b-direction growth is retarded relative to the growth in the c-direc- tion. This leads to growth of acicular crystals of smaller width. The width of the 110 line, which is rather sen- sitive to crystal development in the a- and b-direction, clearly reflects this situation by showing minima be- tween pH 3 and 5 and at pH 10, where twins dominate, and broader lines at pH 2.5, 6-9, and 12 (Table 1), where needles dominate. Correspondingly, larger hematite crystals were formed when the proportion of hematite in the mixture was high and vice versa.
DISCUSSION
The results support and refine a concept developed earlier, according to which goethite and hematite form from ferrihydrite by two different and competitive mechanisms: goethite crystals form in solution from dissolved Fe(III) ions produced by the dissolution of ferrihydrite, whereas hematite forms through an inter- nal dehydration and rearrangement within the ferrihy- drite aggregates (Schwertmann, 1959; Schwertmann and Fischer , 1966; F ischer and Schwer tmann, 1975). Therefore, goethite should be favored as the concen- tration of Fe(III) ions in equilibrium with ferrihydrite increases, and hematite should be favored as the con- centration decreases.
The concentration and form of Fe(III) ions in equi- librium with ferrihydrite depend strongly on pH. Using the appropriate equilibrium constants the diagram in Figure 8, which shows the pH-dependence of various monomeric Fe(III) ions, has been constructed. Com- parison of this diagram with the distribution of goethite and hematite (Figure 3) suggests that goethite is strong-
Vol. 31, No. 4, 1983 Effect of pH of ferrihydrite transformations 283
ly favored where the concentration of monovalent Fe(III) ions, either Fe(OH)2 § or Fe(OH)4-, is at a max- imum. The maximum for (Fe(OH)2 +) [0 denotes activ- ity] is at pH - 4 , and that for (Fe(OH)a)- -wi th in the pH range tested--at pH 12. On the other hand, hematite shows maximum formation where these concentrations are at their minimum, i.e., around pH 8 (Figure 8), which is also the point of zero charge of ferrihydrite.
Below pH - 4 , although (Fe(OH)2 +) increases fur- ther, it is overridden by the concentration of the diva- lent Fe(OH) ~+ ions which appear to be less favorable for goethite crystal growth than the monovalent form. This situation may retard the formation of goethite but not that of hematite, so that relatively more hematite is formed. The lower suitability of Fe(OH) z+ compared to Fe(OH)2 + can be explained as follows: Fe(IlI) ions feeding the growing goethite crystal must be discharged at the crystal surface before being built into the crystal; this discharge is probably easier for monovalent than it is for divalent ions.
This concept is further supported by earlier results of Knight and Sylva (1974) who observed a positive re- lationship between (Fe(OH)~ +) and the rate of goethite formation. It is also in agreement with recent work by Hsu and Wang (1980), who found more hematite to form as acidity increased below pH 2.
At very high pHs (> I M OH-), where crystallization was very rapid and only goethite formed, the crystals consisted of very thin ( -100 A) and long (up to 5/xm) needles, indicating an increasingly strong retardation of crystal growth in the a- and b-directions and a rapid growth in the c-direction. In analogy to the strongly acid range this could indicate the formation of divalent Fe(OH)52- ions under the influence of an extremely high (OH-) instead of monovalent Fe(OH)4- ions at lower (OH)-, the former being less suitable for crystal growth than the latter. This could explain why the crystallinity ofgoethite formed at pH 12 was lower than that formed at pH 10 and below, although goethite was the only phase to form at pH 12.
A C K N O W L E D G M E N T S
We are indebted to Prof. F. E. Wagner (Physics De- partment, Technische Universit/it M/inchen at Garch- ing) for making the M6ssbauer measurements at 110 ~ and 4~ possible, to Dr. H. Ch. Bartscherer for taking the electron micrographs, to Mrs. B. Gallitscher for technical assistance, to Dr. W. R. Fischer for a critical review of the paper, and to the Deutsche Forschungs- gemeinschaft for financial support under grant Schw 90/ 32-5.
R E F E R E N C E S
B6hm, J. (1925) l~lber Aluminium- und Eisenoxide I: Z. An- org. Chem. 149, 203-218.
Fischer, W. R. and Schwertmann, U. (1975) The formation of hematite from amorphous iron(III) hydroxide: Clays & Clay Minerals 23, 33-37.
Hsu, P. H. and Wang, M. K. (1980) Crystallization ofgoe- thite and hematite at 70~ Soil Sci. Soc. Amer. J. 44, 143- 149.
Kiimpf, N. and Schwertmann, U. (1983) Goethite and he- matite in a climosequence in southern Brazil and their ap- plication in classification of kaolinitic soils: Geoderma 29, 27-39.
Knight, R. J. and Sylva, R. N. (074) Precipitation in hy- drolysed iron(III) solutions: J. Inorg. Nucl. Chem. 36, 591- 597.
Landa, E. R. and Gast, R. G. (1973) Evaluation of crystal- linity in hydrated ferric oxides: Clays & Clay Minerals 21, 121-130.
Lindsay, W. L. (1979) Chemical Equilibria in Soils: Wiley, New York, 449 pp.
Murad, E. (1982) The characterization ofgoethite by M6ss- bauer spectroscopy: Amer. Mineral. 67, 1007-101 I.
Nininger, R. C. and Schroeer, D. (1978) M6ssbauer studies of the Morin transition in bulk and microcrystalline a-Fe203: J. Phys. Chem. Solids 39, 137-144.
Schwerlmann, U. (1959) Die fraktionierte Extraktion der freien Eisenoxide in B6den, ihre mineralogischen Formen und ihre Entstehungsweisen: Z. Pflanzenerniihr. Diingung Bodenkunde 84, 194-204.
Schwertmann, U. (1964) DifferenzierungderEisenoxidedes Bodens durch Extraktion mit Ammoniumoxalat-L6sung: Z. Pflanzenerniihr. Diingung Bodenkunde 105, 194-202.
Schwertmann, U. and Fischer, W. R. (1966) Zur Bildung von a-FeOOH und c~-FezO3 aus amorphem Eisen(III)-hy- droxid. III: Z. Anorg. Allg. Chem. 346, 137-142.
(Received 8 July 1982; accepted 30 December 1982)
Pe31oMe----Pe3y.rlbTaTOM xpaHeHnfl qbeppnrn)lpnTa a ao~InblX cycneH3nax npn 24~ n Be.rIHqHnax pH OT 2,5 ~10 12 a TeqeHne TaK ~nTenbnoro nepno~Xa raK Tpn ro~la 6blJIO o6pa3oaa~ne reTnTa n reMaTnTa. IIponoplmn n rpncTa.q~nqnocTb aTnx npo~xyKToa naMeu~ncb 3naqHTeJIhHO C ae~nqnnofi pH. MaKcnsia_~hnoe ro~nqecTao reuaTnTa o6paaoabiaaaocb npn pHOT 7 ~o 8, a MarcnMa~bnoe KonnqecTao reTnTa npn pH = 4 tl pH = 12. Kar uoKa3ann pacmnpenne annnfi penTrenoacKofi nopomKoso~ ~lnqbqbpart~nn, ae~nq~Hbl MarneTnqecv0ax caepxTonKnx nonefi ~ pacnpe~e~eRHe mnpun, KpnCTa_aYll4qnOCT~, o6onx npo~lyKTOS 6b~na TeM cza6ee, qeM Menbme 6bI3Ia ilponopt~na COOTaeTCTayIo- mero npo~yrTa s cMecn. Hpepjio~eno cyulecTBoaanne ~layx ronrypnpy~oulnx o6pa- 3oaaTe~bnb~x upoueccoa: reT~IT o6pa3yeTca n3 pacxaopa, npenMyulecTaenno n3 MOnOBaaenTUbIX norton [Fe(OH)2 +
Fe(OH)4-], co~ep~aumx Fe(III), a reMaTnT--a pe3y~bTaTe BnyTpennofi neperpynnnpoarn n Jlerv~apaTatlHn anyTpn arrperaTos qbepporngpnTa. 3Ta ~ouuentms Caa3bIaaeT nponopunn reTnTa n reMaTnTa c arTnaUOCTbtO norton, coJlep~aulnx Fe(III) a pacxaope, n no~lpa3yMeaaeT, qTO yc~oana 6:iaronpn~Tn~ie ,n;na o6pa3oaaHn~ reTltTa aa.rLqloTCa ne6~aronpnaTnb~M~i ~.qa o6pa3onagn~ reMaTnTa u Hao6opoT. [E.G.]
284 Schwertmann and Murad Clays and Clay Minerals
Resiim~ Aus Ferrihydrit wird bei 24~ und pH 2.5 bis 12 innerhalb von bis zu 3 Jahren Goethit und Hamatit. lhr Mengenverh~iltnis und ihre Kristallinit~it variieren stark mit dem pH. Maximale H~imatitanteile traten zwischen pH 7 und 8 auf, maximale Goethitanteile bei pH 4 und bei pH 12. Die Kristallinit~.t beider Fe-oxide, gemessen an der R6ntgenlinienverbreiterung, dem magnetischen Hyperfeinfeld und dessen Ver- teilungsbreite, war umso geringer, je geringer ihr entsprechender Anteil an der Mischung war. Ffir die Bildung beider Fe-oxide wird ein kompetitiver Mechanismus vorgeschlagen: Goethit bildet sich fiber die L6sung und zwar bevorzugt aus einwertigen Fe(III)-Ionen (Fe(OH)2 § und Fe(OH)4-) und Hamatit durch interne Umstrukturierung und Entw~isserung innerhalb der Ferrihydritaggregate. Dieses Konzept stellt eine Beziehung her zwischen dem Anteil an Goethit und Hamatit und der Aktivit~it der Fe(III)-Ionenspezies in der L6sung und begriindet die Aussage, dab g/instige Bedingungen ffir die Goethitbildung ungfinstige fiir die des H~matits sind und vice versa.
R6sum~---La mise en r6serve de ferrihydrite dans des suspensions aqueuses a 24~ et ~t des pH entre 2,5 et 12 pour une dur6e aussi longue que trois ans a result6 en la formation de goethite et d'h6matite. Les proportions et la cristallinit6 de ces produits ont vari6 largement en fonction du pH. Un maximum d'h6- matite a 6t6 form6 entre pH 7 et 8 et un maximum de goethite a 6t6 form6 au pH 4 et 12. La cristaUinit6 des deux produits s 'est appauvrie proportionnellement ~t une diminution de la proportion du produit cor- respondant dans le m61ange, comme l 'ont indiqu6 l'61argissement des lignes de diffraction poudr6e des rayons-X, et les valeurs de champs et la distribution de largeurs magn6tiques hyperfins. L'existence de deux proc6d6s comp6titifs est sugger6: la goethite est form6e via solution, pr6f6rablement ~t partir d'ions monovalents Fe(III) [Fe(OH)2 + et Fe(OH)4-], l 'h6matite par r6arrangement interne et d6shydration au sein des aggr6gats ferrihydrite. Ce concept relie les proportions de goethite et d'h6matite ~ l'activit6 de l'esp~ce d'ion Fe(llI) en solution, et implique que les conditions favorables pour la formation de goethite sont d6- favorables ~ celle de l'h6matite et vice versa. [D.J.]