the impact of permeability heterogeneity on liquid
TRANSCRIPT

Graduate Theses, Dissertations, and Problem Reports
2019
The Impact of Permeability Heterogeneity on Liquid Recovery The Impact of Permeability Heterogeneity on Liquid Recovery
from Gas Condensate Reservoir from Gas Condensate Reservoir
Bashayer Alsanea [email protected]
Follow this and additional works at: https://researchrepository.wvu.edu/etd
Part of the Engineering Commons
Recommended Citation Recommended Citation Alsanea, Bashayer, "The Impact of Permeability Heterogeneity on Liquid Recovery from Gas Condensate Reservoir" (2019). Graduate Theses, Dissertations, and Problem Reports. 7398. https://researchrepository.wvu.edu/etd/7398
This Thesis is protected by copyright and/or related rights. It has been brought to you by the The Research Repository @ WVU with permission from the rights-holder(s). You are free to use this Thesis in any way that is permitted by the copyright and related rights legislation that applies to your use. For other uses you must obtain permission from the rights-holder(s) directly, unless additional rights are indicated by a Creative Commons license in the record and/ or on the work itself. This Thesis has been accepted for inclusion in WVU Graduate Theses, Dissertations, and Problem Reports collection by an authorized administrator of The Research Repository @ WVU. For more information, please contact [email protected].

The Impact of Permeability Heterogeneity on the Liquid Recovery from
Gas Condensate Reservoir
Bashayer Alsanea
Thesis Submitted to the Benjamin M. Statler College of Engineering and Mineral
Resources Department of Petroleum and Natural Gas Engineering
At West Virginia University
in partial fulfillment of the requirements for the degree of
Master of Science in Petroleum and Natural Gas Engineering
Kashy Aminian, Ph.D., Committee Chair Samuel Ameri, Ph.D.
Mehrdad Zamirian, Ph.D.
Department of Petroleum and Natural Gas Engineering
Morgantown, West Virginia 2019
Keywords: Gas Condensate, EoS, Reservoir Heterogeneity, Permeability, Liquid
Recovery
Copyright 2019 Bashayer Alsanea

Abstract
The Impact of Permeability Heterogeneity on the Liquid Recovery from Gas Condensate Reservoir
Bashayer Alsanea In gas condensate reservoirs, when reservoir pressure drops below dew point pressure as production takes place at the surface, hydrocarbon liquids begin to form. The volume of the liquid formed in the reservoir increases as the reservoir pressure declines below dew point pressure. In most gas condensate reservoirs, the liquid saturation in the formation does not reach to the critical level for liquid flow to occur. Therefore, the liquid formed as result of the pressure decline becomes trapped in the formation. The formation of the liquid in the reservoir causes the produced gas composition to change continuously leading to lower liquid recovery at the surface facilities. The formation permeability directly impacts the pressure in the reservoir and as consequence the amount of liquid that is trapped in a gas condensate reservoir. In this study, a gas condensate reservoir model was developed to investigate the impact of permeability and heterogeneity of the gas condensate reservoir on the liquid recovery. The constant compositional changes in the gas condensate reservoir require rigorous evaluation of the fluid system to determine the hydrocarbon recovery accurately. A generic gas condensate reservoir model was constructed to simulate the liquid recovery and investigate the impact of permeability heterogeneity on the natural gas liquid recovery. Phase behavior model based on Peng-Robinson EoS equation of state (EoS) was developed by matching the results of a constant volume depletion (CVD) experiment obtained from a gas condensate reservoir in the Appalachian Basin. The phase behavior model was then incorporated into the reservoir model. The results of the investigation with the generic gas condensate reservoir model indicated that the permeability heterogeneity has a negative impact on the liquid recovery from a gas condensate reservoir.

iii
Table of Contents Abstract ............................................................................................................................................................ I Chapter 1. Introduction .............................................................................................................................. 1 Chapter 2. Literature Review ................................................................................................................... 2
2.1. Gas Condensate Reservoirs ......................................................................................................... 2 2.4. Constant Volume Depletion Test (CVD) ............................................................................... 3 2.2. Equation of State ............................................................................................................................ 4 2.3. CMG Software ................................................................................................................................ 5
2.3.1. WinProp .................................................................................................................................... 5 2.3.2. GEM ........................................................................................................................................... 6
Chapter 3. Methodology ............................................................................................................................ 7 3.1. Fluid Characterization (WinProp) ............................................................................................ 7 3.2. Generic Gas Condensate Reservoir Model Development ............................................. 11
Chapter 4. Results ..................................................................................................................................... 17 4.1. Model Development ................................................................................................................... 17 4.2. Reservoir Simulator Model ...................................................................................................... 19
Chapter 5. Conclusions and Recommendation ............................................................................... 26 Recommendation ................................................................................................................................. 26
References ................................................................................................................................................... 27

iv
List of Figures
Figure 1 - Schematic of the Constant Volume Depletion process ............................................... 3 Figure 2 - CVD test .................................................................................................................................. 10 Figure 3 - Reservoir simulator settings ............................................................................................. 11 Figure 4 - Reservoir layers .................................................................................................................... 12 Figure 5– Reservoir Fluid Components after Lumping ............................................................... 17

v
List of Tables Table 1 – Original Reservoir Fluid Composition .............................................................................. 8 Table 3 - CVD experiment results ...................................................................................................... 10 Table 4 - Separator conditions .............................................................................................................. 13 Table 5 - Homogenous reservoir models .......................................................................................... 14 Table 6 - Permeability variation by layers for model 1 ............................................................... 15 Table 7 - Permeability variation by layers for model 4 ............................................................... 16 Table 8 - Summary of CVD test calculation after regression .................................................... 18 Table 9 - HC analyses of produced gas phase mole % ................................................................ 19 Table 10 - Liquid and gas recovery from homogenous models ................................................ 19 Table 11 - Liquid recovery from heterogeneous cases for model 1 ......................................... 20 Table 12 - Liquid recovery from heterogeneous cases for model 4 ......................................... 21 Table 13 – Case 5A and 5B showing the location the reduced permeability layer ............ 22 Table 14 – Liquid recovery from case 5, 5A, and 5B ................................................................... 22 Table 15 - Case 6A, 6B, and 6C showing the location the reduced permeability layers .. 23 Table 16 - Liquid recovery from case 6, 6A, 6B, and 6C ........................................................... 23 Table 17 - Case 7A, 7B, and 7C showing the location the reduced permeability layers .. 24 Table 18 - Liquid recovery from case 7, 7A, 7B, and 7C ........................................................... 24 Table 19 - Case 8A and 8B showing the location the reduced permeability layers ........... 25 Table 20 - Liquid recovery from case 8, 8A, and case 8B .......................................................... 25
1
Chapter 1. Introduction Gas condensate reservoirs usually exhibit complex behavior due to the phase change that
occurs when the reservoir pressure declines below dewpoint pressure during production.
As the reservoir pressure drops, constant changes to fluid compositions the reservoir
occur therefore understanding the behavior of the fluid system in gas condensate
reservoir to has always been a major focus for reservoir engineers in the oil and gas
industry. A proper reservoir fluid characterization is essential to establish an
understanding the fluid behavior in the reservoir for an accurate prediction of the amount
of the liquid recovered and eventually optimize liquid recovery.
The amount of liquid and gas produced from a gas condensate reservoir is impacted by
both reservoir fluid composition and reservoir rock properties. The impact of fluid
composition on the liquid recovery from gas condensate reservoir has been investigated
before. However, the impact of the reservoir rock properties, more specifically reservoir
permeability, and the reservoir heterogeneity on the liquid recovery has not been
investigated. The main objective of this study is investigate the impact of the reservoir
permeability and reservoir heterogeneity on the liquid recovery from a gas condensate
reservoir using a numerical model that is developed with all the necessary PVT data and
fluid compositions as well as reservoir conditions using computer modeling group
software.

2
Chapter 2. Literature Review 2.1. Gas Condensate Reservoirs A gas condensate reservoir refers to a gas system with a temperature being between
cricondentherm and the critical temperature on pressure-temperature phase diagram. Gas
condensate reservoirs are known to have a very distinctive fluid behavior. When the
reservoir pressure is higher than dewpoint pressure, a single gas phase system exists
within the reservoir. However, when the reservoir pressure drops below the dewpoint as
the asset is put into production, liquid condenses from the gas and accumulates in the
reservoir. Dewpoint pressure or saturation pressure is the pressure at which the first drop
of liquid drops out of gas. The condensate typically has a high-API gravity. The existence
of the liquid phase is dependent on pressure and temperature conditions in the reservoir.
With the pressure constantly dropping during production, the compositions of the gas and
liquid (condensate) in the reservoir constantly change which complicates the prediction
of the fluid behavior in the reservoir. A multi-stage separator usually attached to the
producer wells under selected pressure and temperature conditions to maximize liquid
recovery at the surface. One of the problems associated with gas condensate reservoir is
the accumulation of liquid around the wellbore which could to lead reduction in gas
permeability and reduction in the productivity.

3
2.4. Constant Volume Depletion Test (CVD) Constant volume depletion experiment is usually performed on a gas condensate to
achieve a variety of important information to be used in reservoir calculations. Constant
Volume Depletion test, also known as CVD experiment, aims at simulating the actual
behavior of a gas condensate reservoir. The results of the experiment are used for the
calculation of the surface gas condensate recovery in relation to the pressure. The results
can be influenced by whether the provided gas condensate splits into two phases or
occurs as single phase. During the process, as shown in Figure 1, the CVD test begins at
the dew point pressure of the identified condensate value of the gas. Thereafter, the
measurements pertaining to the saturation volume of the substance at the dew point are
obtained and recorded as Vsat.
To produce relevant and accurate results, different deliverables such as measured values
recorded on a computer-generated table are provided. These values show the relationship
between pressure and volume. For instance, as the level of the pressure decreases, the
volume is supposed to increase to facilitate the formation of the gas condensate.
Figure 1 - Schematic of the Constant Volume Depletion process

4
2.2. Equation of State Peng-Robinson is the equation of state (PR-EoS) is commonly used to describe the phase
behavior of hydrocarbons and it has become the most popular and widely used in the
petroleum industry. This equation is developed to calculate the fluid properties in the
natural gas process and to validate PVT obtained from laboratory analysis. As a result, it
is considered to be the most reliable cubic equations of state for prediction of the
gas/condensate system behavior. The PR-EoS (1978) is major component of the WinProp
model of the CMG software and was used in this study in order to characterize the fluid
properties and phase behavior
PR-EoS is considered the most applicable model for volumetric and thermodynamic
calculations in academic and petroleum industry and is recommended to be used for
characterization of the rich gas condensate reservoirs. The PR-EoS was used in this
study to describe the fluid phase behavior and tuned by regression to match the
experimental data, in this case, CVD experimental data.. CMG software WinProp was
used in this study for the tuning process. A tuned equation of state is required to develop
an accurate simulation model to evaluate the fluid system in the reservoir. The use of
EoS model can lead to a reliable prediction of the fluid behavior in gas condensate
reservoir to accurately predict the oil and gas quantities recovered from the reservoir.
To obtain accurate results, the first model for the application of the equation was as
follows:
(𝑃 + !"!!!!!"!!!
) 𝑣 − 𝑏 = 𝑅𝑇 (1)

5
For the depiction of pressure, the above equation can also be written as:
P = !"!!!
– !" !!!!!"!!!
(2)
The introduction of the centric factor by Soave caused Peng and Robinson to consider the
inclusion of the temperature factor. This was followed by the presentation of different
fitting parameters that described the first two models. However, there was a change in the
denominator of the pressure variable. Coefficients such ‘a’ and ‘b’ consist of functions
depicting the characteristics of the critical elements under specified conditions. The
equations devised formulas for coefficients influencing pressure, temperature, and gas
centric factor. As a result, Peng-Robinson equation of state produced accurate estimation
of the relationship between pressure and temperature of gas. This assisted in the
calculation of the solubility rate of the gases.
2.3. CMG Software
2.3.1. WinProp WinProp is CMG fluid characterization tool that used to determine the impact of pressure
and temperature on fluid properties. It is an integral component in advanced reservoir
simulation modeling and is extremely useful for multi-phase and special processes where
compositional variations exist. Therefore, it offers techniques for illustrating the heavy
ends of the petroleum fluids, lumping of components, reservoir fluid characterization,
matching laboratory PVT data through regression, and EoS characterization.
Furthermore, WinProp also considers several laboratory experiments some of which are
recombination of separator oil and gas, compressibility measurements along with the
PVT experiments such as differential liberation, constant volume depletion, and constant

6
composition expansion. For this study specifically, WinProp is used to characterize
reservoir fluids to tune the EoS and match lab data from constant volume depletion
experiment. Since WinProp has the option of selecting from various equations of state
models, the Peng-Robisnon (1976) equation of state is tuned to match the PVT results in
the creation of the reservoir model. It contributes to enhance the understanding of the
reservoir fluid and fluid phase behavior with advanced PVT calculations.
2.3.2. GEM GEM in general is a world leading Equation-of-State reservoir simulator for
compositional, chemical and unconventional reservoir modeling. It offers numerous of
techniques in enhancing oil recovery, geomechanics, fracture modeling, and performance
optimization. For this study in specific, GEM was utilized to optimize performance
efficiency and run large, complex simulation jobs in the shortest amount of time which
makes it feasible to complete the study.

7
Chapter 3. Methodology
This study was carried out in two parts. The first part was to use WinProp for the purpose
of characterizing reservoir fluid by tuning EoS to precisely match the collected CVD
laboratory experiment data and investigate fluid behavior. Compositional simulation
study using a tuned Equation of State is required to evaluate fluid behavior and
production from the gas condensate reservoir.
In the second part of the study, CMG-Builder (GEM) was used to develop a generic
model for a gas condensate reservoir with all the required data and fluid
compositions incorporated to generate an accurate simulation model. Homogenous gas
condensate reservoirs models consist of five layers were generated to investigate the
impact of permeability. Following the creation of the homogenous models, a number of
different cases of permeability variations were executed to study the impact of
permeability heterogeneity on the liquid recovery. That was done by altering
permeability values in each layer of the reservoir in a consistent pattern and running the
data in CMG to calculate the resulted amount of liquid and gas recovery. All obtained
data for this study were used as an input to simulate the conditions encountered in the
reservoir.
3.1. Fluid Characterization (WinProp) In this part of the study, the Peng-Robinson equation of state was tuned to match the PVT
data of an actual gas condensate reservoir located in the Appalachian Basins. The input
data include the original fluid composition, reservoir temperature and pressure, and CVD
test results.

8
The first step in modeling condensate fluid was to characterize reservoir fluid through
splitting and lumping calculations option in WinProp. The obtained extended reservoir
fluid compositions were utilized in the software to start the process of tuning the EoS and
match experimental data. Table 1 shows the extended reservoir fluid composition.
Table 1 – Original Reservoir Fluid Composition
The fluid system in the reservoir consists of a large number of components starting from
C1 up to C22, which made fluid characterization and component lumping essential to
avoid the excessive run time for an accurate EoS calculation. Properties of the plus
fractions C7+ such as molecular weight, specific gravity, and mole fraction shown in
Table 2 were also entered to characterize the heavy fraction properties and specify plus
fraction.

9
Component lumping is a process of reducing many components system into fewer
pseudo-components used in EoS calculation for an accurate saturation pressure prediction
and to simplify the EoS model in order to obtain reasonable results. WinProp determined
the number of pseudo-components used in characterizing the heavy fraction of reservoir
fluid. Component C7 up to C22 were grouped and lumped into 3 pseudo-components
with a single carbon number.
The next step in the tuning process after component lumping was to match the
available experimental data through regression. The regression feature in WinProp
was used to tune the equation of state to have a better match of the experimental
results. Tuning through regression of the EoS parameters to match CVD experimental
results and to improve the prediction of the saturation pressure. The required data for
tuning are gas produced, liquid dropout, gas deviation factor, and pressure steps,
which were derived from CVD test. Constant volume depletion specification
experimental data were recorded for regression purpose in order to check the quality
of the laboratory data by tuning the EoS. Table 3 shows the collected CVD laboratory
experiment data that were used in the program.
SG 0.763MW C7+ 127.593Mole, y% 1.74
Table 2 -‐ C7+ Properties

10
Table 3 - CVD experiment results
Based on the PVT data, original reservoir pressure was estimated to be 2760 psia and
reservoir temperature was 120 F. The initial guess for the saturation pressure (dew point)
for this experiment was 2700 psia. This value is required by the program to use in the
saturation pressure calculation. The first column labeled Pressure was for pressure levels
and column 2 through 5 were used for entering experimental data as shown in Figure 2.
Figure 2 - CVD test
The data set was saved and ready to run. An output file was generated containing a
summary of the resulting data.

11
Moving forward, the equation of state model in WinProp was written in a format suitable
for CMG’s compositional simulator GEM to continue the study and reach the desired
results. The file then can be imported into a GEM data set using Builder.
3.2. Generic Gas Condensate Reservoir Model Development Upon opening Builder, the window illustrated in Figure 3 appeared and the desired
options were selected to set the reservoir simulator.
Figure 3 - Reservoir simulator settings
After setting the simulator, Cartesian grids were created by clicking on reservoir icon
using the software. The synthetic reservoir simulator consisted of five layers with a size
of 386 acres. Each layer is 10 ft thick, the top grid of the model is at a depth of 6000 ft
with an initial pressure of 2760 psia, three permeabilities in I, J, and K directions were
considered, and reservoir porosity of 10%. To facilitate the process, the bottom layer of
the reservoir is labeled as layer 5 and the top layer is labeled as layer 1. The figure below
illustrates the layers of the reservoir.

12
Figure 4 - Reservoir layers
The GEM model generated from WinProp was imported into the simulator to include the
fluid compositions and fluid properties of the gas condensate fluid contained in the
reservoir into the reservoir simulator. The EoS model imported contained EoS type and
parameters, component critical properties, volume shifts, EoS omega parameters,
reservoir temperature, and other important parameters.
The presumed, reference pressure of 2760 psia and reference depth of 6000 ft were
entered as the initial conditions of the reservoir. Water Gas was selected as the initial
fluid in the reservoir.
The next step in creating the model was to specify reservoir properties. The reservoir
model at the beginning was designed to be homogenous. The physical properties in all
the layers were equal and uniformed. Creating a homogenous reservoir model prior to

13
changing its properties was essential to acquire the optimal production data, and have
them as reference for the comparison of the different permeability cases.
Lastly, a producer well was added and attached to a multistage separator. The primary
need for a multistage separator was to improve the liquid production and cause liquid to
be formed at the surface under selected pressure and temperature.
Table 4 shows the separator stage conditions. The last stage of the separator corresponds
to the stock tank conditions.
Table 4 - Separator conditions
The well was located at the center of the reservoir and completed vertically. Only one
producer well needed to achieve the final results. Adding one producer well was
preferable in this study to have a uniform production and to focus on a single drainage
area of the reservoir. The well operated under two specified constraints. Minimum
bottom-hole pressure of 600 psi and a maximum surface gas rate of 3 MMscfd.
The gas condensate reservoir simulator now is ready to predict the hydrocarbon recovery.
Several permeability cases were made in order to see how the permeability and the
heterogeneity of the reservoir impacted liquid recovery from gas condensate reservoir.
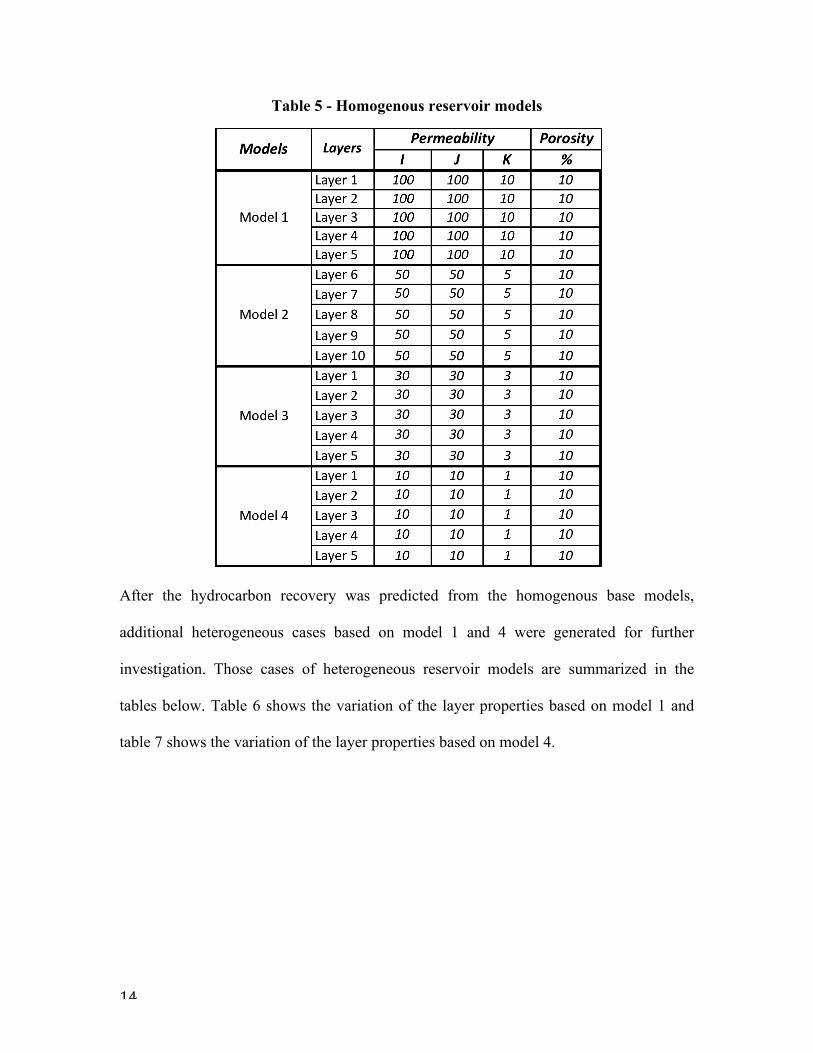
Table 5 below shows four different homogenous reservoir models generated and utilized
in this study to investigate the impact of permeability.
14
Table 5 - Homogenous reservoir models
After the hydrocarbon recovery was predicted from the homogenous base models,
additional heterogeneous cases based on model 1 and 4 were generated for further
investigation. Those cases of heterogeneous reservoir models are summarized in the
tables below. Table 6 shows the variation of the layer properties based on model 1 and
table 7 shows the variation of the layer properties based on model 4.

15
Table 6 - Permeability variation by layers for model 1
In case 1 only the top layer of the reservoir was reduced to 10 md and the other four
layers remained at 100 md. In the second case, the first two layers were reduced and the
rest were kept the same. The same thing applies to the third and fourth cases, case 3 only
the top three Layers were decreased in permeability and in the last case four layers were
reduced to 10 md as well. The same variation in permeability was applied to the
homogeneous model 4.

16
Table 7 - Permeability variation by layers for model 4
The liquid recovery from all the models and the cases presented was calculated to see
how the heterogeneity of the reservoir impacts the liquid recovery. Finally, to reach an
ultimate understating of the impact of the permeability, additional heterogeneous cases
were generated to see if the location of the reservoir layers with low permeability was
altered, what impact it might have on the liquid recovery.

17
Chapter 4. Results
4.1. Model Development The output file from WinProp generated a variety of important information needed to
successfully build the reservoir model. The resulting file included a summary of
condensate heptane plus splitting, Constant Volume Depletion calculations before and
after regression at 120F, Peng- Robinson equation of state component properties before
and after regression, hydrocarbon analyses of produced gas phase Mole %, and summary
of cumulative recovery during CV depletion at 120 F. Figure 5 shows the fluid
compositions in mole fraction after component selection. The column where it says
“primary” corresponds to the reservoir fluid and “secondary” corresponds to injection
fluid, which was replaced with since there was no injection fluid utilized in this study.
Figure 5– Reservoir Fluid Components after Lumping

18
The EoS was developed successfully to match the CVD experimental data and accurately
predicted the saturation pressure, as it is appear in Table 8. Based on this table we can see
the predicted saturation and the mole percentage of the fluid compositions closely
matching the original data from the condensate reservoir.
Table 8 - Summary of CVD test calculation after regression
The first column represents the predicted saturated reservoir fluid and the mole
percentage of gas compositions at that pressure. It can be found that the saturation
pressure (dewpoint pressure) is 2,696.5 psia and fluid compositions are in agreement with
the obtained data from the lab. Moreover, looking back at Table 3, the HC analyses of
produced gas phase mole percent summary results from WinProp show a good match of
the liquid dropout percentage and mole% of cumulative gas produced of the actual
experiment results as summarized in Table 9.

19
Table 9 - HC analyses of produced gas phase mole %
Nonetheless, the data generated from WinProp output file verify that EoS has been
successfully tuned and the experimental values were matched quite closely. Tuning the
EoS was beneficial since it provided many important EoS parameters of the fluid
components and pseudo-components such as specific gravity, critical temperature,
critical, pressure, molecular weight, volume shift, heat value, etc. to assist in the creation
of an effective reservoir simulation.
4.2. Reservoir Simulator Model Several cases of layer properties variations were generated in CMG to address the impact
of permeability on liquid production from a gas condensate reservoir. Prior to that,
homogeneous models of the reservoir were created to investigate the impact of the
permeability on the production from a uniform formation. Table 10 shows liquid and gas
recovery percentage from the homogenous models. All the models were set to run for 20
years.
Table 10 - Liquid and gas recovery from homogenous models
2696.5 2100 1500 900 500Gas Produced, Mole % 0 21.16 45.54 69.04 82.98Liquid, Vol % 0 4.1 5.33 4.7 3.882 phase z factor 0.6972 0.6879 0.7105 0.7483 0.7545
Pressure Levels, psia

20
The result here shows that the permeability does have a slight impact on the liquid
recovery. As the permeability decreases in the homogenous reservoir models, liquid
recovery decreases especially when comparing liquid recovery from Model 1 to Model 4.
Based on these results, model 1 with the highest permeability value of 100 was chosen to
further investigate the impact of the reservoir heterogeneity on the production. Table 6
illustrated the cases of permeability variations for model 1. The liquid recovery
percentage from these cases is shown Table 11.
Table 11 - Liquid recovery from heterogeneous cases for model 1
It can be observed by comparing these cases to one another that the reduction in the
liquid recovery from case 1 through 4 is not very significant and the difference is very
small when compared to the liquid recovery from the homogenous model.
A conclusion can be drawn based on the liquid percentages recovery that 100 md is high
enough that even when the permeability is reduced in a number of layers we can’t see any
major changes in the liquid recovery. 100 md was too high to see the impact of the
permeability heterogeneity on the production therefore; additional heterogeneous cases
were generated based on model 4 with permeability of 10 to see if we can observe any
major changes regarding the liquid recovery from the reservoir.
Table 7 illustrated the cases made in order to accomplish the primary goal of this study.
Results from these cases are summarized in the Table 12 below.

21
Table 12 - Liquid recovery from heterogeneous cases for model 4
The result from these cases indicates a sufficient reduction in the liquid recovery as the
number of layers with low permeability increases. In case 5, the top layer was reduced to
1 md while the rest of the layers were remained at 10 md. Case 5 only the top two layers
were reduced in permeability. Case 7 the first three layers were reduced and case 8 the
first four layers were reduced to 1 md which explains the huge difference in the liquid
recovery between case 6 and case 8.
Now that we reached an understanding that the liquid recovery decreases gradually as the
permeability is reduced in the reservoir layers, a further step was taken into analyzing
which layer of the five reservoir layers has the most impact on the reduction of the liquid
recovery. To achieve that, the order of the layers was altered and the location of the
layers with reduced permeability value was changed to see if the location had an impact
on the liquid recovery.

22
Table 13 – Case 5A and 5B showing the location the reduced permeability layer
Based on Table 13, as opposed to case 5 where the top reservoir layer was reduced in
permeability, case 5A the middle layer of the reservoir was reduced in permeability and
in case 5B the bottom layer was reduced instead. The liquid recovery was calculated and
represented in Table 14 below.
Table 14 – Liquid recovery from case 5, 5A, and 5B
As we can see, the order of the layers in this case had almost no impact on the liquid
recovery.
Similarly, the location of layers with reduced permeability in case 6 was changed as
illustrated in Table 15 and liquid recovery was calculated.

23
Table 15 - Case 6A, 6B, and 6C showing the location the reduced permeability layers
In case 6A, the permeability in the bottom two layers was reduced and in case 6B the top
and the bottom layers were change and in case 6C layer 2 and 3 were changed. The
results from these cases compared to the original case, case 6, are shown in table 16.
Table 16 - Liquid recovery from case 6, 6A, 6B, and 6C
Based on the results, the liquid recovery from case 6 and case 6A is exactly the same
whereas the recovery from case 6B and 6C is slightly higher but not very significant.

24
Table 17 - Case 7A, 7B, and 7C showing the location the reduced permeability layers
In the same way, in cases 7A, 7B, and 7C the order of the three layers was changed as
shown in table 17.
Table 18 - Liquid recovery from case 7, 7A, 7B, and 7C
As summarized in Table 18, liquid recovery did not have any significant changes.
In case 8 where the first four layers were reduced in permeability to 1md as layer 5
remained at 10 md, the location of these layers were altered in case 8A and 8B as shown
in Table 19 below.

25
Table 19 - Case 8A and 8B showing the location the reduced permeability layers
In case 8A the bottom four layers were changed whereas in case 8B the middle layer,
layer 3, remained at 10 md and the rest of the layers were reduced in permeability.
Table 20 - Liquid recovery from case 8, 8A, and case 8B
As a result, illustrated in Table 20, the liquid recovery was slightly reduced in case 8A
and 8B compared to case 7. The change in the recovery in case 8A compared to case 8 is
not significant however when comparing case 8B to case 8 we can see some changes in
the recovery.
We can conclude that the location of the layer with low permeability in the reservoir does
not impact the liquid recovery from a gas condensate reservoir as much as the number of
layers with low permeability in the reservoir does.

26
Chapter 5. Conclusions and Recommendation Based on the analysis of the results obtained from this research study, the following
conclusions can be made regarding the developed EoS model and the impact of the
reservoir heterogeneity and properties on production from gas condensate.
1. An EoS fluid model was successfully developed and tuned via regression and was
matched with the experimental data.
2. The liquid recovery from a homogenous gas condensate reservoir is impacted by the
permeability.
3. Reservoir heterogeneity in a high-permeability gas condensate reservoir does not
have significant impact on the liquid recovery.
4. Reservoir heterogeneity in a low-permeability gas condensate reservoir negatively
impacts the liquid recovery.
5. As the severity of the reservoir heterogeneity (the number of layers with the reduced
permeability) increases the liquid recovery decreases.
6. The location of the reservoir heterogeneity (layers with the reduced permeability)
does not have a significant impact on the liquid recovery reduction.
Recommendation The impact of the followings on the liquid recovery from a heterogeneous gas condensate
reservoir needs to be investigated:
1. Different variations of fluid composition.
2. Reservoir pressure and temperature.
3. Separator conditions.

27
References Alex, M. (n.d.). Splitting and lumping schemes of the plus-fraction. Retrieved from https://www.academia.edu/9688009/Splitting_and_lumping_schemes_of_the_plus-fraction. Arabi,H. Farahani,S. Javadifar,A. Theoretical and Experimental Analysis of Constant Volume Depletion Test and Flash Calculation by Using a Modified Algorithm, NAFTA. 2012. McCain, W. D. (2017). The properties of petroleum fluids. Tulsa, OK: PennWell. Peng-Robinson Equation of State. (n.d.). Retrieved from https://www.sciencedirect.com/topics/chemistry/peng-robinson-equation-of-state. Raffie, H., & Tennyson, J. (2003, January 1). Optimizing the Number of Components in Tuning the Peng-Robinson Equation-of-State for Trinidad's Gas Condensates. Society of Petroleum Engineers. doi:10.2118/81113-MS Singh, K., Mantatzis, K., Whitson, C. H., & Benjemia, R. (2011, January 1). Reservoir Fluid Characterization and Application for Simulation Study. Society of Petroleum Engineers. doi:10.2118/143612-MS Suwono, S. bin, Marhaendrajana, T., Nugroho, B., Febrianto, D. H., & Hendraningrat, L. (2012, January 1). Multiple EOS Fluid Characterization for Modeling Gas Condensate Reservoir with Different Hydrodynamic System: A Case Study of Senoro Field. Society of Petroleum Engineers. doi:10.2118/150822-MS. Winprop version 2016.10, computer modeling group, West Virginia University.