the impact of natural disasters on child health and investments in
TRANSCRIPT

The Impact of Natural Disasters on Child Health and Investments in Rural India ASHLESHA DATAR, JENNY LIU,SEBASTIAN LINNEMAYR, AND CHAD STECHER
WR-886
May 2011
This paper series made possible by the NIA funded RAND Center for the Study of Aging (P30AG012815) and the NICHD funded RAND Population Research Center (R24HD050906).
WORK ING P A P E R
This product is part of the RAND Labor and Population working paper series. RAND working papers are intended to share researchers’ latest findings and to solicit informal peer review. They have been approved for circulation by RAND Labor and Population but have not been formally edited or peer reviewed. Unless otherwise indicated, working papers can be quoted and cited without permission of the author, provided the source is clearly referred to as a working paper. RAND’s publications do not necessarily reflect the opinions of its research clients and sponsors.
is a registered trademark.
1
The Impact of Natural Disasters on Child Health and Investments in Rural India
Ashlesha Datara, Jenny Liub, Sebastian Linnemayrb, Chad Stecherc
May 2011
Abstract
Natural disasters are becoming more frequent worldwide and there is growing concern
that they may adversely affect short- and long-term health outcomes in developing countries.
Prior research has primarily focused on the impact of single, large disaster events but very little
is known about how small to moderate disasters, which are more typical, affect population health.
In this paper, we present one of the first investigations of the impact of small and moderate
disasters on childhood morbidity, physical growth, and immunizations by combining household
data from three waves of the Indian National Family and Health Survey with an international
database of natural disasters (EM-DAT). We find that exposure to a natural disaster in the past
month increases the likelihood of acute illnesses such as diarrhea, fever, and acute respiratory
illness in children under 5 year by 9-18%. Exposure to a disaster in the past year reduces height-
for-age and weight-for-age z-scores by 0.12-0.15 standard deviations, increases the likelihood of
stunting and underweight by 7%, and reduces the likelihood of having full age-appropriate
immunization coverage by nearly 18%. We also find that disasters’ effects vary significantly by
gender, age, and socioeconomic characteristics. Most notably, the adverse effects on growth
outcomes are much smaller among boys and infants.
a Corresponding Author; RAND Corporation, 1776 Main Street, P.O. Box 2138, Santa Monica, CA 90407.; Email: [email protected]; Phone: 310-393-0411x7367; Fax: 310-260-8161. b RAND Corporation, Santa Monica, CA. c University of California, Los Angeles. This research was funded by a National Institute for Child Health and Human Development grant (R03 R03HD056021). All opinions expressed are those of the authors and not of the funding agency. We thank Deborah Balk for comments on an earlier draft.

2
1. Introduction
Natural disasters are a common occurrence in many developing countries, and there is a
growing concern that they may become more frequent due to climate change (Van Aalst, 2006).
Disasters result in significant economic damage: for example, in 2009, 335 natural disasters were
reported worldwide, killing over 10,000 people and causing damages totaling over 41 billion
USD (Vos et al., 2010). They can result in large-scale death, such as the 2004 Indian Ocean
earthquake and tsunami that registered a death toll of well over 150,000 (Liu et al., 2005), and
are frequently followed by epidemics (Watson, Gayer, and Connolly, 2007). It is likely that such
disasters also result in more indirect, long-term health effects, in particular on children when they
are exposed during critical growth phases. Indeed, adverse conditions in childhood have been
consistently shown to have significant impact on long-term outcomes (Alderman, Hoddinott and
Kinsey, 2006; Victora et al., 2008; Case and Paxson 2006, 2009, 2010).
Prior research examining the effects of natural disasters on children’s health generally
focuses on single, large disaster events. For example, studies show that the 1994-1995 drought in
Zimbabwe slowed the growth of children under two (Hoddinott and Kinsey 2001), forest fires in
Southeast Asia increased child mortality (Frankenberg et al., 2004; Sastry, 2002; Jayachandran,
2006), and Hurricane Mitch in Nicaragua had negative effects on children’s health and nutrition
and increased their labor force participation1 While understanding the effects of large disaster
events is important, nations are more frequently affected by several smaller-scale disasters,
which may also impact children’s health. In fact, large disasters typically attract greater
international aid and resources to the affected regions (Stroemberg 2007), potentially mitigating
1 Other studies of this kind have studied forest fires in Singapore (Emmanuel 2000), drought in Indonesia (Rukumnuaykit 2003), floods in the U.K. (1970), and other disasters in Bangladesh (Rousham 1996). Other health outcomes, such as post-traumatic stress disorder, have also been shown to be higher after Hurricane Mitch (1998) in Nicaragua (Goenjian et al., 2001) and the earthquake in Ano Liosia, Greece, in 1999 (Roussos et al., 2005).
3
some of the adverse effects. In contrast, smaller disasters often do not receive as wide attention
and may lead to significant detrimental effects on child health and access to heath care, even
though the immediate effects on mortality may be small. Consequently, impacts of large-scale
disaster events may not be generalizable to the majority of disasters, particularly for developing
countries. Only one recent study (Pörtner 2010) has examined the impact of several different
natural disasters of varying types on child health using data from Guatemala.2 The study found
that most disasters had negative and often large effects on children’s long-term health; each
disaster occurrence reduced children’s height-for-age by 0.1-0.2 standard deviations.
In this paper, we examine the effects of exposure to natural disasters on children’s health and
critical health investments using data from rural households in India over three periods of time.
The focus on India is useful for several reasons. First, it is the second most populous country in
the world, after China, with nearly 1.2 billion people and ranks among the lowest in terms of key
child health indicators, including malnutrition and under-5 mortality. The UN estimates that 2.1
million Indian children die before reaching the age of 5 every year, mostly from preventable
illnesses such as diarrhea, typhoid, malaria, measles and pneumonia (United Nations 2008).
Every day, 1,000 Indian children die because of diarrhea alone. Second, the country is annually
struck by several natural disasters of varying intensity and types causing significant damage to
life and property. From 1992 to 2006, the period of time spanning our data, there were 228
natural disasters reported in India that led to over 96,000 fatalities and affected several million
people. While a majority of these disasters did not result in large fatalities, there has been no
systematic examination of whether exposure to these disasters affected morbidity, nutrition, and
immunization against vaccine-preventable diseases.
2 Pörtner (2010) estimates the impact of frost, hurricanes, storms, heavy rains, and floods on child health as measured by height-for-age, weight-for-height, and the occurrence of fever, diarrhea, or acute respiratory infections during the two weeks preceding the interview.

4
We use data on over 80,000 children from three waves of India’s National Family and Health
Surveys (1992-93, 1998-99, 2005-06) linked to EM-DAT, a database of natural disaster
occurrences. Our analytical approach is similar to that of Pörtner (2010) in that we include year
and state fixed effects to control for time trends as well as time-invariant heterogeneity across
states which can confound identification in a cross-sectional setting. We find that exposure to
disasters has significant short- and medium-term impacts on children. A natural disaster in the
past month significantly increases the likelihood of diarrhea, fever, and acute respiratory illness
(ARI) by 9-18%. In addition, exposure to a disaster in the past year reduces height-for-age and
weight-for-age z-scores by 0.12-0.15 standard deviations, increases the likelihood of stunting and
underweight by 7%, and reduces the likelihood of having full age-appropriate immunization
coverage by nearly 18%.
However, we find important differences in the impacts of natural disasters by gender and age
of the child, mother’s education, and between Northern and Southern Indian states, but not by
scheduled caste or tribe (SC/ST) status. Although no differences by gender are found in the
likelihood of coming down with an acute illness (diarrhea, fever, ARI), boys are significantly
less likely to be stunted and underweight after being exposed to a disaster relative to girls. This
suggests that there may be little difference in biological susceptibility to the effects of disasters,
but that there may be some preferential treatment by parents towards investments for sons. We
also find that the youngest children— those under age one—are more likely to have acute
illnesses such as diarrhea immediately after a disaster but are less likely to be stunted,
underweight, and wasted after being exposed to a disaster relative to older children. The
attenuated effects on infants’ growth suggests that breastfeeding practices—over 97% of children
under one are breastfed—may protect the nutritional intake of infants in the aftermath of a
5
disaster. With respect to maternal education, we find that children of uneducated mothers are
more likely to be stunted and underweight after a disaster occurs. Finally, children in the
southern states of India weigh significantly more and are more likely to be vaccinated than those
in the rest of the country following a disaster, which is consistent with relatively greater
economic development among southern states.
The remainder of the paper proceeds as follows. Section 2 outlines the conceptual framework
for understanding how disasters impact child health. Section 3 describes the data used in the
empirical analysis, Section 4 outlines the methods, and Sections 5 describes the results. Finally,
Section 6 concludes with a discussion of our findings.
2. Conceptual framework
Natural disasters can affect children’s health in three main ways. The first is a direct effect on
children’s morbidity and mortality (e.g., a child drowns in a flood, illnesses from contamination
of food or water). Family disruption due to the loss of a parent or other caretaker can also result
in poor health outcomes after a disaster occurs.
The second effect is through the disaster’s impact on the supply of health care. By destroying,
damaging, or straining health infrastructure, natural disasters might affect access to health care.
Increased search or travel costs following health infrastructure destruction increases the marginal
cost of health investments.3 For example, damage to hospitals or health clinics may result in
reduced prenatal care, fewer births under the supervision of an obstetrician or nurse, less
3 In response to large disasters, foreign aid and medical emergency teams often come to affected areas, potentially mitigating the negative health consequences of disasters. Unfortunately, data about emergency response to natural disasters is not currently being systematically collected and we are unable to explicitly account for these types of post-disaster interventions that would likely reduce estimated effects. As such, we believe that our results represent a lower bound for the health consequences of natural disasters in the presence of unobserved emergency response. Furthermore, most disasters in our study are relatively small-scale in terms of mortality and hence are unlikely to spark large emergency responses.

6
postnatal care, and incomplete immunization. In addition, disasters may also compromise other
infrastructure that can have an impact on child health, such as disruption of clean water supply or
appropriate disposal of waste.
The third effect is through the disaster’s impact on the demand for health inputs, mainly
through loss of income as well as increased expenditures needed to cope with a disaster. In
agricultural societies, such as much of rural India, disasters such as droughts and floods may lead
to significant income shocks from the damage to crops and livestock, in turn reducing the
demand for health inputs. The need to relocate or reconstruct housing, replenish food reserves or
replace lost livestock may crowd out critical early childhood health investments (e.g., nutrition
and immunization). Disasters may also reduce the marginal returns to health investments. For
example, the benefits of immunizing children may be less in the event of a famine if the risk of
dying from hunger is high.
The impacts of natural disasters are also likely to vary by child and household characteristics,
such as child’s gender and age, mother’s education, a household’s SC/ST status, and between
northern and southern Indian states. Differential investments across boys and girls is a well-
documented fact in developing countries (for a review, see Miller 1997), particularly in India
(e.g. Rosenzweig and Schultz 1982; Das Gupta 1987; Behrman 1988). One of the main
hypotheses for gender discrimination is that boys have larger returns to human capital
investments relative to girls. In this situation, one might expect that the crowding out of health
inputs due to a disaster may be larger for girls than boys, resulting in attenuated effects of
disasters among boys relative to girls. The differential impact of disasters by a child’s age is less
clear. On the one hand, infants may be less prone to nutritional deficiencies or adverse health
effects from water or food contamination because of exclusive breastfeeding. On the other hand,
7
they may be more vulnerable to diseases and other environmental hazards due to less-developed
immune systems. Similarly, differential impacts by SC/ST status are also not clear a priori. One
the one hand, SC/ST households may not be able to smooth consumption due to lack of access to
credit markets or other informal mechanisms, leading to greater adverse effects of disasters. On
the other hand, the effects on SC/ST households might be smaller if health outcomes are already
much worse than the general population, and shocks brought about by natural disasters represent
only one among a large set of health shocks to the child. Mother’s education has been shown to
be critical for determining a variety of child health outcomes across developing countries (Desai
and Alva 1998), and these effects may be more pronounced after a natural disaster when critical
decisions regarding disease management and prevention, and nutrition must be made. Finally,
wide regional disparities in economic and human development exist in India with Southern states
(Kerala, Karnataka, Andhra Pradesh, and Tamil Nadu) having more favorable socioeconomic
and child health indicators than Northern states (Murthi, Guio, and Dreze 1995; Mishra, Roy,
and Retherford 2004; Rani, Bonu, and Harvey 2008). As a result, children in Southern states may
be expected to fare somewhat better than their Northern counterparts in the aftermath of a
disaster.
3. Data
This study combines child health data collected in three waves of the National Family Health
Surveys conducted in India with information on occurrences of natural disasters in the
Emergency Events Database (EM-DAT). This effort represents the first time that the EM-DAT
data have been linked to micro-level household survey data, enabling a comprehensive
assessment of the impact of natural disasters across different types of disasters.
8
Emergency Events Database
Since 1988, the World Health Organization Collaborating Center for Research on the
Epidemiology of Disasters has collected data on the nature, magnitude, scale, and basic human
impact of over 12,800 disasters that have occurred since 1900. The EM-DAT includes an event
as a disaster if at least 10 persons were reported killed, 100 persons were reported to be affected
(i.e. requiring immediate assistance during a period of emergency), or the affected state either
declared a state of emergency or made a call for international assistance. For a given disaster,
EM-DAT provides information on where the disaster occurred, the type of disaster4, the
beginning and ending dates, and the damage incurred (i.e. number of people killed, injured, and
rendered homeless, and estimated damages in dollars). Geographic specificity of the disaster
includes identifiers such as name of a city, village, department, province, state, or district
depending on the relevance. These data have been used extensively in disasters and public health
journals, and also underlie a number of papers in the economics literature (see, for example,
Kahn (2005), Toya and Skidmore (2007), or Strömberg (2007)).
All disasters occurring in India were downloaded from this database and categorized by date.
To enable merging of the disasters data with NFHS data, the occurrences of disasters were
aggregated to the state level, the lowest level of geographic identifiers consistently available
across all the NFHS waves.5 Although the EM-DAT provides detail on the type of disaster, we
4 EM-DAT categorizes natural disasters into the following types: droughts, earthquakes, epidemics, extreme temperatures (both high and low), floods, mass movements (i.e. landslides, avalanches), storms (including hurricanes and tsunamis), and wildfires. 5 There are currently 29 states in India. Three new states were created in 2000: Jharkhand, Uttaranchal, and Chhattsgarh. This analysis uses Indian state units as defined by their pre-2000 boundaries because it is impossible to assign boundaries which did not previously exist to these new states. However, exposure of children to disasters is based on the state-level identifiers existing at the time of the survey; children in the 2005-06 NFHS are linked to the EM-DAT according to the post-2000 state boundaries whereas children in the 1992-93 and 1998-99 NFHSs are linked according to the pre-2000 state boundaries..
9
do not distinguish between different types for two reasons. First, a string of disaster events may
be serially correlated (e.g., floods as a result of storms, epidemics as a results of floods), making
it difficult to attribute or apportion resulting impacts across each of these types. Second, there is
wide variation in geography and climate in India, and some regions are particularly prone to
specific types of disasters (e.g., typhoons in the southeast, avalanches in the northern
mountainous states). Examining disasters by type is likely to capture much of these regional
differences rather than the overall effect of a given disaster. Furthermore, we exclude epidemics
from our disaster measure as disease outbreak is often triggered by the occurrence of a disaster
and not an independent event in of itself. Therefore, we focus on the occurrence of any non-
epidemic disaster in any state in order to generalize across all disasters in India.
The geographic distribution of natural disasters across India during the one-year exposure
window prior to the NFHS survey month is displayed in Figure 1. As we describe in further
detail later, most of the disasters in our exposure window were floods, droughts, and extreme
temperatures. There is considerable variation in the occurrences of unique disaster events both
within states over time and across states. Moreover, the increase in the number of events
occurring over time is not unique to any single state, but appears to affect most states in India.
We will exploit these sources of variation in our difference-in-difference estimation approach.
National Family Health Surveys (NFHS)
Data on child health status and investments are obtained from the National Family and
Health Surveys conducted in 1992-93, 1998-99, and 2005-06. Each woman aged 15-49 is asked
to provide a full birth history for up to 20 children. For all children under five years of age,
NFHS collects information on specific health conditions during the two weeks prior to the

10
survey—diarrhea, fever, and acute respiratory infection or cough. We create a binary indicator
for the occurrence of any one of these conditions, as well as an indicator for whether any
medication was obtained to treat these health conditions. Due to the narrow reference window
for which these indicators were collected, these measures will only reflect the immediate effects
of disasters.
Medium- and longer-term effects of disasters can be analyzed through physical growth
measurements. Anthropometrics are important indicators of nutritional status during childhood.
Stunting, or low height-for-age, is caused by long-term insufficient nutrient intake and frequent
infections, and its effects are largely irreversible. Wasting, or low weight-for-height, is a strong
predictor of mortality among children under five. It is usually the result of acute significant food
shortage and/or disease. NFHS collects objective height (length for infants) and weight
measurements which are age-standardized according to World Health Organization growth
charts and converted to z-scores. We examine the continuous measures of height-for-age,
weight-for-age, and weight-for-height z-scores as well as binary indicators for stunting,
underweight, and wasting, identified as those children who are less than two standard deviations
below the reference median in height-for-age, weight-for-age, and low weight-for-height,
respectively.
Finally, we examine child health investments by looking at immunizations. Mothers
interviewed in the NFHS are asked about different vaccinations for each of her eligible children
and, when possible, this information was verified against the child’s vaccination card.
Specifically, the survey asked whether the child had been vaccinated against tuberculoses (BCG),
diphtheria (DPT, all doses), polio (all doses) and measles. Since the questions are asked
retrospectively, we classify a child as having the “age-appropriate” vaccination if the child has

11
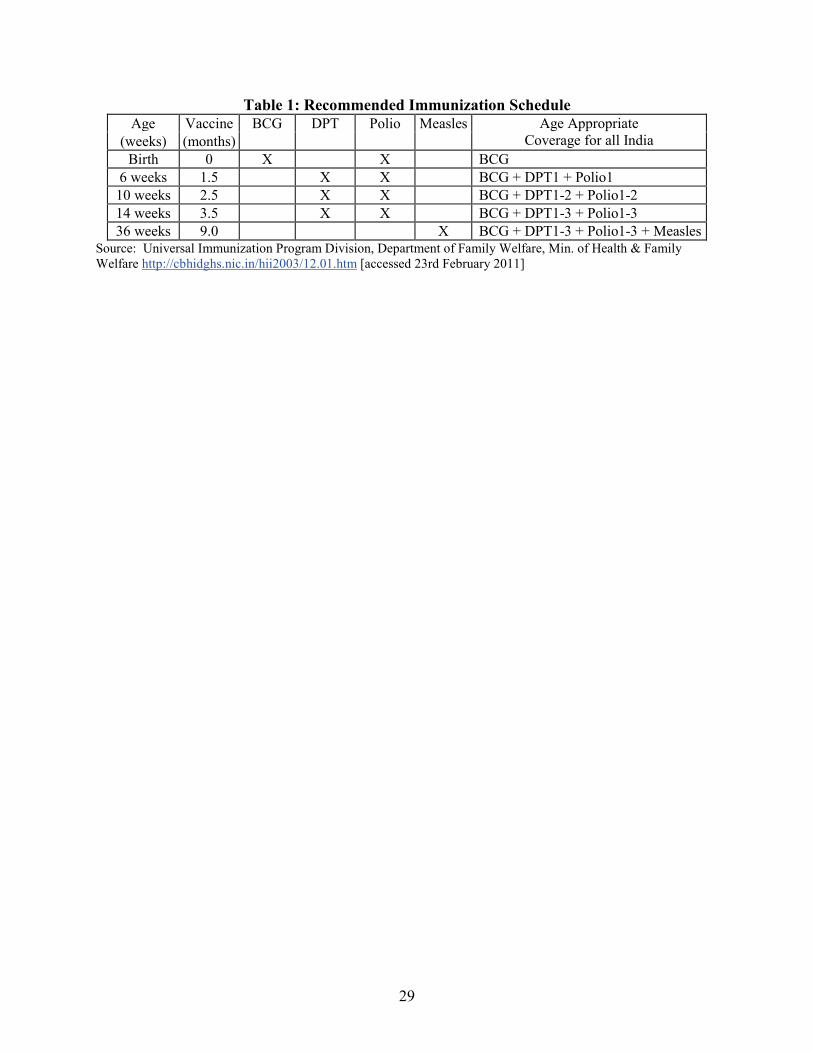
received the recommended doses of each immunization regimen according to the Government of
India’s Recommended Immunization Schedule (see Table 1). For example, a child who is three
months old at the time of survey who has received BCG would thus be classified as being current
for BCG vaccine. However, if she has not received polio dose 2, she would be classified as not
having age-appropriate polio vaccine. Hence, separate indicators are created for each
immunization regimen. In addition, a composite indicator is created to identify whether a child is
current on all immunization regimens. For example, a child who is 3 months old would only be
categorized as “fully current” if she has received BCG, DPT doses 1 and 2, and polio doses 1 and
2. Since many diseases require multiple doses to provide full immunization coverage across a
range of strains of the disease (e.g., polio) we use this classification scheme to distinguish
between children who are fully protected against childhood infectious diseases and those who
may have been vaccinated at one point in time, but who only have partial immunological
protection.
Other individual and household characteristics collected in the NFHS are used to control for
observable differences across children. These include the child’s age, sex, birth order, age of the
mother at the time of birth, the mother’s and father’s highest level of educational attainment,
schedule caste or tribe, and religion.
Defining exposure
Exposure to disasters is calculated relative to the month the NFHS interview was conducted.
Because acute illnesses (fever, ARI, diarrhea) are only recalled for the two weeks prior to the
interview, the length of exposure for these short-term outcomes is defined to be the month
preceding the interview, including the interview month. For longer-term health and investment
12
outcomes—anthropometrics and immunizations—exposure to disasters is defined to be the 11
months leading up to the interview date, including the month of the interview. Although we
show the 11-month exposure period in the main results, we also test the sensitivity of the
regression specification to the definition of this exposure period and find the results to be robust
to different exposure lengths (e.g., 6 months).
The exposure variable is coded as a dummy indicator for having been exposed to any disaster
in the 11 months (one month for acute illnesses) prior to and including the month of the
interview. The dummy variable definition avoids double-counting a disaster that may have
occurred over multiple months and facilitates interpretation of the results. There is also reason to
believe that length of disaster is not necessarily indicative of its severity, as some disasters are
short in duration, such as earthquakes. However, we also explore the use of a continuous variable
that reflects the months of exposure to a disaster. While estimates generally showed that
exposure to more disaster months was also significantly related to child health outcomes, there
were no significant differences observed by disaster length. Therefore, we report the dummy
variable estimates in our main results. Findings from additional robustness checks examining
non-linear effects of disasters are discussed in the results.
Sample
The final sample is comprised of all children in rural households who were less than five
years of age and for whom health questions were asked. We further limit the analysis to only to
children from singleton births and exclude those with extreme anthropometric scores (i.e. beyond
five standard deviations of the reference mean).6 The final analytic sample includes over 80,000
6 Children of multiple births are often underweight at birth and are likely to proceed on a different growth trajectory during their formative years compared to children of singleton births. Therefore, we drop these 604 children from

13
children with valid information on acute illnesses and over 59,000 children with valid height and
weight measurements. For vaccination outcomes, the sample is further restricted to only children
who were eligible to receive the vaccination within the previous 11-month disaster exposure
period. For example, because children should receive a complete polio immunization regimen by
four months of age, only children up to 15 months of age at the time of survey would have been
“at risk” of not receiving the vaccination during the prior 11 months. For assessing whether
children are “fully current” for all scheduled immunizations, the sample is restricted to children
who are 20 months of age and younger since the last scheduled vaccination, measles, should be
obtained by 9 months of age.
Table 2 summarizes the individual and household characteristics for the largest sample of
children analyzed for recent acute illnesses (N1993=31,973, N1999=21,688, N2006=27,475). The
proportion of children experiencing acute illnesses during the last two weeks varies across type
of illness and wave, ranging from 9-35%. Of those with illnesses, at most about 60% of children
are given medication. Indian children are more than 1.6 standard deviations shorter and lighter
than the reference population. This translates into about 45-50% being stunted and underweight,
and about 17% being wasted. Obtaining the age-appropriate vaccination appears to improve over
survey waves. By 2006, 86% of children have ever been vaccinated with 40% being fully current
compared to only 49% being ever vaccinated and 30% being fully current in 1993.
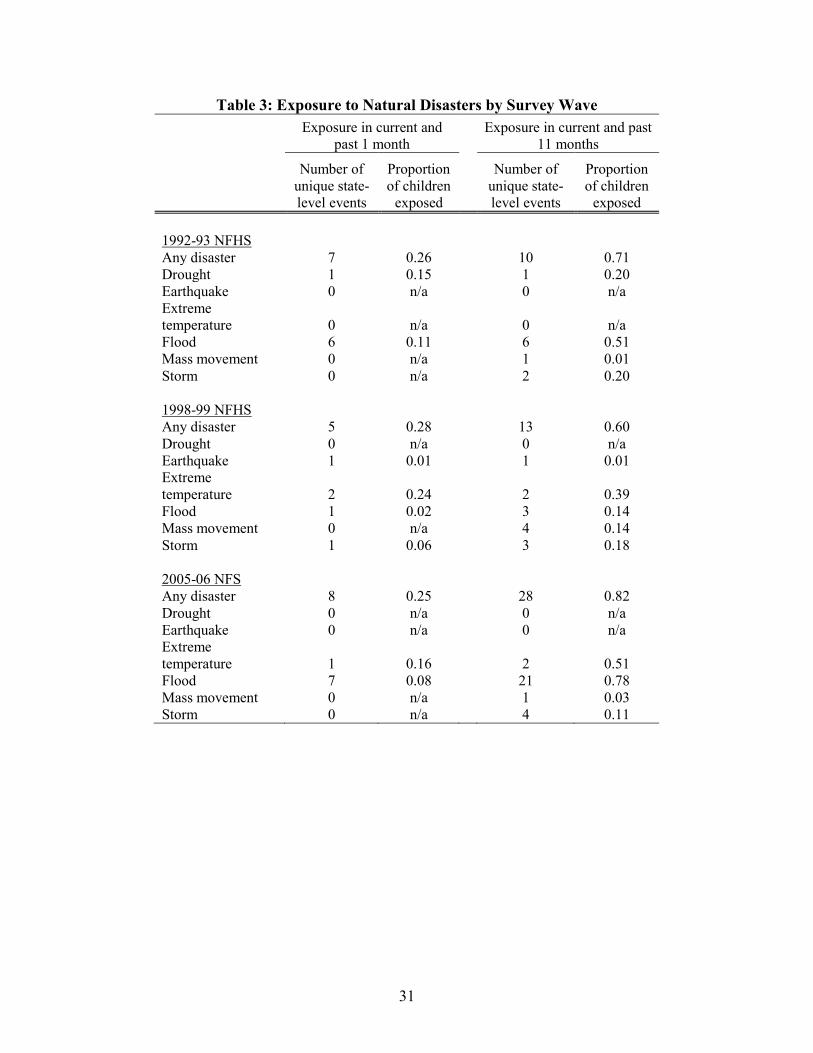
Table 3 describes the exposure to disasters in both the previous one month for children
included in the analysis of acute illnesses and 11 months for children included in the analysis of
anthropometric outcomes. From one month before the survey, there were seven unique state-
level disasters that occurred in the 1992-93 NFHS, exposing 26% of children to a disaster. These
our sample. We also drop 2131 children who have extreme z-score values for anthropometric measurements to reduce the possibility that outliers skew estimated results.
14
were mostly droughts and floods. Five and eight disasters occurred in the 1998-99 and 2005-06
surveys, respectively, (mostly extreme temperature) each exposing about 25-28% of children.
When the exposure time is extended to the year leading up to the survey, 10 state-level events
occurring in the 1992-93 survey round (mostly floods and droughts) exposed 71% of children, 13
events leading up to the 1998-99 survey (mostly extreme temperature) exposed 60% of children,
and 28 events leading up to the 2005-06 survey (mostly floods and extreme temperature)
exposed 82% of children.
4. Methods
The general econometric model used to estimate the effect of natural disasters in the month
or year leading up to the survey on our outcome measures of interest is as follows:
(1) istsitstist XDY εµηββα +++++= −t2
11
where Yist stands for the health variable of child i in state s observed at time t; D-1st captures
whether there was a natural disaster in the child’s state within the last month or year; and Xit
includes controls for child and family characteristics (male, quadratic in mother's age at birth,
mother's education, father's education, Muslim religion, SC/ST, birth order, and gender-specific
month of birth quartic polynomial). The primary coefficient of interest is β1, which captures the
effect of exposure to natural disasters on child health within the first month or year after the
occurrence of the disaster. In order to examine whether the impact of natural disasters varies by
child’s gender, age, and socioeconomic status of the child’s family, we estimate the model in
equation (1) using an interaction of D-1st with child’s gender, age (0-1 year versus greater than 1
year), scheduled caste or tribe (SC/ST) status, maternal education, and indicator for residing in a
South India state.

15
As mentioned earlier, there may be unobserved differences across affected and unaffected
areas within countries that might bias the estimated effect of disasters on health outcomes. In
order to address this concern, we employ all three available waves of NFHS data for India. The
availability of repeated cross-sections of data allows us to estimate difference-in-difference
models. This approach essentially compares changes in health outcomes in disaster affected
states to changes in health outcomes in unaffected states. Specifically, sη in the above equation
represents a vector of state fixed-effects and μt survey (wave) time fixed-effects. The state fixed
effects control for all unobserved state-level confounders that are constant over time. In other
words, the parameter β1 in equation (1) will be estimated by using each state as its own control
group. In addition, the time fixed-effects will control for any general time trend in disasters and
child health that affects all regions equally. All regressions for binary outcomes are estimated
using a linear probability model. Standard errors in all models are adjusted for clustering at the
level of the primary sampling unit, a group of approximately twenty households living in close
vicinity.
5. Results
5.1 Immediate Effects on Acute Illnesses
Table 4 summarizes the estimates for predicting the likelihood of illnesses occurring in the
last two weeks. Each row is estimated with a separate regression. Row one displays the main
effect of disasters, showing that a disaster in the past month significantly increases the likelihood
of diarrhea, fever, and ARI by about two to three percentage points. Given the mean rate of
illnesses between 13-23% within the sample, these effect sizes represent a 18%, 9%, and 15%

16
increase in diarrhea, fever, and ARI, respectively. However, experiencing a disaster in the past
month is not significantly related to receiving medication to treat the condition.
5.2 Effects on Nutrition-Related Outcomes
For longer-term anthropometric outcomes displayed in Table 5, exposure to a disaster in the
year leading up to the survey month is significantly related to worse height and weight outcomes
(row 1). Height-for-age is reduced by 0.15 standard deviations and weight-for-age by 0.12
standard deviations. Stunting and underweight are each significantly higher by three percentage
points or about a 7% increase. Given that estimates for height are larger in magnitudes than for
weight, the negative signs for the weight-for-height ratio and wasting make sense.
5.3 Effects on Immunization
Estimates for immunization outcomes are summarized in Table 6. For all vaccinations—
BCG, DPT, polio, and measles—a disaster in the past year significantly reduces the likelihood of
having received the age-appropriate doses. In fact, children are 4 percentage points less likely to
have ever been vaccinated, and 5 percentage points significantly less likely to be fully current on
all their vaccinations in relation to experiencing a disaster in the past year.
5.4 Heterogeneous Effects
Investigation of heterogeneous effects of disasters that may come about due to the reasons
discussed in section 2 shows important differences in outcomes by gender and age of the child,
as well as mother’s education and between north and south India. No differences by gender are
found for the likelihood of coming down with an acute illness. Although boys are more likely to
be given medication if they become ill (Table 4, row 2), the estimate is not statistically
significant. However, significant differences by gender are observed for physical growth
outcomes (Table 5, row 2). Boys are significantly less likely to be stunted and underweight than

17
girls. This suggests that there may little difference in biological susceptibility to the immediate
effects of disasters, but that there may be some preferential treatment by parents towards
investments for sons. In comparison, no differences in attainment of vaccinations by gender are
found, suggesting that disasters’ effects on immunizations may be operating mainly through
supply-side shocks (e.g. inability of mobile health units to vaccinate children due to floods)
instead of demand-side shocks.
Younger children—particularly those under age one—are more likely to be given medication
in response to acute illnesses and to consistently have better growth outcomes. While there is
suggestive evidence that children under one may be more susceptible to acute illnesses (i.e.
significantly more likely to have diarrhea, but not other conditions), they are also significantly
more likely to be given medication to treat the condition. These children are also less likely to be
stunted, underweight, and wasted than older children. Considering that over 97% of children
under age one are breastfed, these results suggest that breastfeeding practices may protect the
nutritional intake of infants in the aftermath of a disaster.
We find few differences by SC/ST status in disasters’ impacts on child health or
immunizations, but other proxies for SES—mother’s education, and northern versus southern
India—do show some differential impacts. Adverse outcomes for children appear to be stronger
among those born to uneducated mothers. These children are significantly shorter and weigh less
after being exposed to a disaster than those born to more educated mothers. Children of
uneducated mothers are also more likely to suffer from fever immediately after a disaster occurs;
however, significant differences are not observed for other acute illnesses or for vaccination
outcomes. Between north and south India, children in the south appear to do significantly better
in terms of weight, are more likely to receive BCG vaccination as well as any vaccination, and

18
are less likely to have diarrhea. These differences may reflect relatively better health care access
and socioeconomic conditions in southern states.
5.5 Robustness Checks
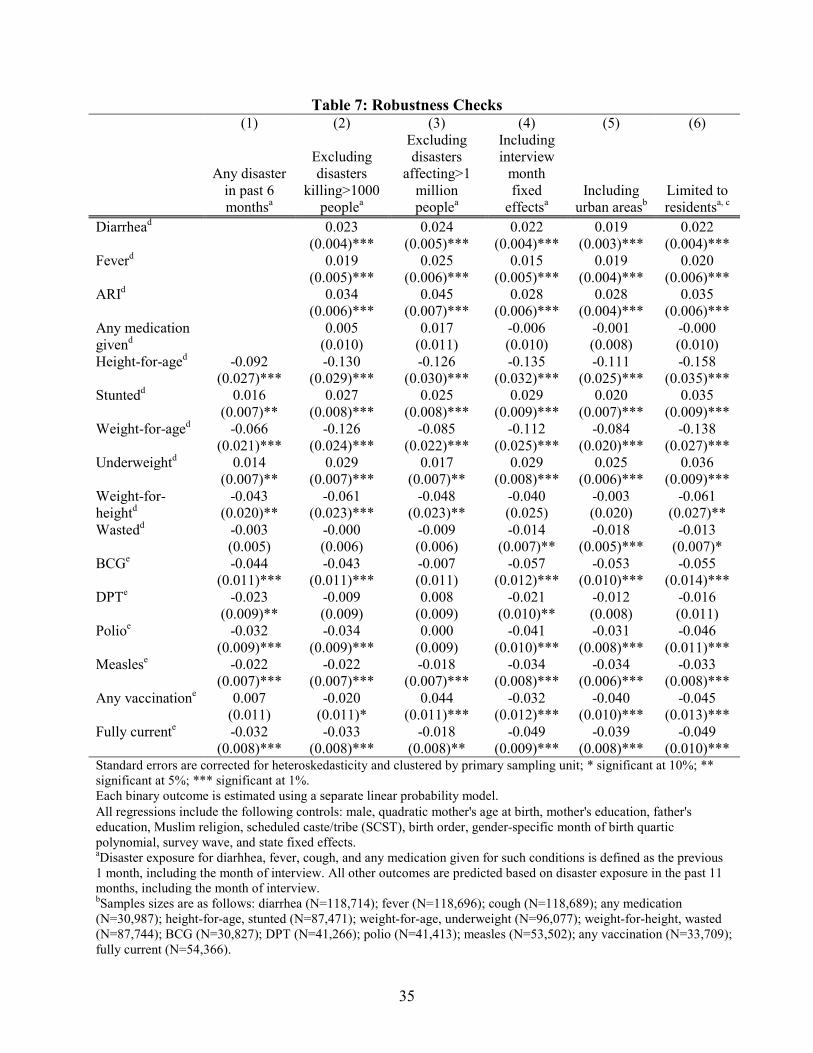
The above results are robust to a variety of sensitivity analyses (Table 7). First, since the
choice of a one-year disaster exposure period was somewhat arbitrary, we rerun our analyses
using a six-month exposure period (Table 7, Column 1). While point estimates do change
somewhat because this redefinition essentially narrows the window of any disaster lagged effects,
the substantive results do not change. Second, we test for the possibility that the occurrence of
any single large disaster may be driving our results. We separately drop disasters killing more
than 1000 people (Table 7, Column 2) and disasters affecting more than one million people
(Column 3) from our disasters exposure measure. These thresholds represent about the 95th
percentile of all disasters in India in the EM-DAT in terms of mortality and destruction.
Resulting estimated coefficients for all outcomes do not substantively change. Third, we include
interview month fixed effects in our regressions to account for potential seasonal trends that
affect both disasters and health outcomes (Column 4) and find similar results. Fourth, we include
urban children in our estimation sample (column 5) and find that some effect sizes become
smaller, suggesting that effects for urban children are also generally smaller than those observed
for rural children. However, additional investigation of potential interaction effects revealed few
differences across urban and rural areas (results not shown). Finally, we restrict our sample to
households who report residing in the current location for two or more years (Column 6) to limit
bias due to migration. We find that exclusion of recent migrants does not change our results.
In additional analyses not reported here, we also tested for nonlinearities in the effects of
disaster exposure. First, regressions using a continuous indicator of exposure to disaster months
19
produce results that are consistent with those found with the dummy variable definition. Second,
we investigate whether there may be nonlinear effects in being exposed to more months of
disasters by using either a quadratic term or by specifying dummy variables at different
thresholds (e.g., 1-2 disaster months, 3-9 disaster months). Resulting estimates show that there
are no nonlinearities or thresholds of disasters that consistently predict different growth and
immunization outcomes. We also tested for various ways to control for differences in age cohorts:
birth year dummies, additional quartic age polynomials interacted with scheduled caste/tribe.
Neither specification of age controls affects the point estimates in the main results.
6. Conclusions and Discussion
There is a growing concern that climate change will lead to more frequent natural disasters of
increasing intensity. For example, a substantial increase in hazards related to heavy rain is
expected over central India in the future (Goswami et al 2006). While the effects of specific,
large disaster events (e.g Hurricane Mitch, Indonesian forest fires) on child health have been
examined in several recent studies, not much is known about how natural disasters in general
affect child health. In this paper, we examined the immediate and medium-run effects of natural
disasters on child health and investments by linking three waves of household survey data from
India to information on all natural disasters that children were exposed to in the year prior to the
survey to estimate difference-in-difference models. The vast majority of natural disasters during
our study period were small or moderate in size; the median disaster led to 48 deaths, which is
orders of magnitude smaller than the deaths caused by large events (e.g., over 16,000 deaths in
India due to the 2004 Indian Ocean Tsunami).

20
Our results show that even small-to-moderate disasters can have significant short- and long-
term effects on health. Several robust findings emerge from our results. First, disasters have
significant immediate effects on morbidity, as measured by fever, ARI, and diarrhea. Failure to
treat these illnesses effectively and promptly can lead to serious consequences. Both ARI and
diarrhea are the leading causes of mortality among children under five, together responsible for
almost 40 percent of the child mortality in this age group each year (UNICEF/WHO 2009).
Second, exposure to a disaster in the past year is associated with significantly worse nutrition-
related outcomes, including a greater likelihood of stunting and underweight among exposed
children. Malnutrition in childhood has been linked to adverse health and socioeconomic
outcomes in the long run (for a review, see Victora, Adair, Fall, et al. 2008). Finally, exposure to
a disaster significantly lowers the likelihood of receiving age-appropriate immunization against
vaccine-preventable diseases such as polio, tuberculosis, and measles, placing children at greater
risk for these infectious diseases.
The magnitude of disasters’ effects on morbidity, physical growth, and immunizations are
fairly large. Exposure to a natural disaster in the past month increases the likelihood of acute
illness by 9-18%. Exposure to a disaster in the past year reduces height-for-age and weight-for-
age z-scores by 0.12-0.15 standard deviations, increases the likelihood of stunting and
underweight by 7%, and reduces the likelihood of having full age-appropriate immunization
coverage by nearly 18%. These effects are comparable to those of maternal education on the
same outcomes. For example, children in our sample born to uneducated mothers are 5-8% more
likely to be stunted or underweight and are 13-16% less likely to receive age-appropriate doses
of BCG, polio, and measles vaccinations.
21
Our findings pertaining to the differential effects of disasters by gender, age, maternal
education and region have important implications for policy. We show that, while there is little
difference in biological susceptibility to the effects of disasters between boys and girls, there
appear to be important gender differences in the behavioral responses of parents to disasters. We
find that the adverse effects of disasters on nutrition-related outcomes are significantly attenuated
among boys relative to girls, suggesting that disasters’ effects on children’s growth may largely
result from demand-side shocks that reduce the households’ resources. These findings are
consistent with a vast literature documenting gender discrimination in India and suggest the need
for policies that counter these effects. In contrast, we did not find any gender differences in
disasters’ effects on immunizations, suggesting that the mechanisms through which disaster
exposure affects immunizations may operate largely through supply side shocks that influence
girls and boys similarly. For example, community outreach workers are an important component
of vaccine delivery in India, particularly in remote areas (Datar, Mukherji and Sood 2007), and
natural disasters such as floods may significantly impair the ability of such workers to access
vulnerable populations.
With respect to a child’s age, we find that the adverse effects of disasters on infants’
nutrition-related outcomes are significantly attenuated relative to older children. These findings
highlight the critical role that breastfeeding plays in the event of disasters. Exclusive
breastfeeding may shelter infants from food- or waterborne illnesses relative to their peers who
are not exclusively breastfed. However, young children who are no longer breastfeeding may be
particularly vulnerable after disasters, highlighting the need for programs that support their
nutritional needs.

22
Finally, our results suggest that the negative effects of disasters are stronger among children
living in lower socio-economic conditions (northern states and less maternal education). To the
extent disaster relief efforts are targeted towards less developed areas or vulnerable
subpopulations, the true effects of disasters may be even larger than what we estimate since we
are unable to control for these policy responses. This also suggests, however, that existing policy
efforts in response to disasters have been inadequate in mitigating large negative effects on
children’s health.
Our results should be interpreted in light of additional caveats. While our difference-in-
differences strategy controls for time-invariant unobserved heterogeneity across states, we
cannot rule out with certainty the influence of other unobservable factors (unrelated to disasters)
on child health outcomes in the state (e.g. state-specific maternal and child health investments).
As we also cannot account for emergency response to disasters, our estimated effects may
represent a lower bound for the true effect of natural disasters. In addition, measuring disaster
exposure at the state level ignores within-state heterogeneity in exposure, contributing to
measurement error, particularly in large states. While recent waves of the Demographic and
Health Surveys have been collecting detailed data on the geographic location of households, a
similar level of geographic specificity is not yet consistently available for the EM-DAT natural
disasters data. Lastly, our estimates capture the effects of disasters on households that remained
in the same location after the disaster and among children who were alive at the time of the
survey.
23
References
Alderman, H., Hoddinott J, and Kinsey B. (2006): “Long term consequences of childhood
malnutrition.” Oxford Economic Papers 58(3): 450-474.
Behrman, Jere R. (1988): “Intrahousehold Allocation of Nutrients in Rural India: Are Boys
Favored? Do Parents Exhibit Inequality Aversion?” Oxford Economic Papers, New Series,
40(1), 32-54.
Case, A., Paxson, C. (2006): “Stature and Status: Height, Ability, and Labor Market Outcomes,”
Journal of Political Economy 116(3), 499-532.
Case, A., Paxson, C. (2009): “Early Life Health and Cognitive Function in Old Age,”American
Economic Review: Papers & Proceedings 99:2, 104–109.
Case, A., Paxson, C. (2010): “Causes and Consequences of Early Life Health,” Demography 47,
supplement 2010, S65-S85.
Cesar G Victora, Linda Adair, Caroline Fall, Pedro C Hallal, Reynaldo Martorell, Linda Richter,
Harshpal Singh Sachdev (2008): “Maternal and child undernutrition: consequences for adult
health and human capital,” Lancet 371(9609), 340-357.
Das Gupta, Monica (1987): “Selective Discrimination against Female Children in Rural Punjab,
India, “Population and Development Review, 13(1), 77-100.
Datar, A., Mukherji, A. and Neeraj Sood (2007): “The Role of Rural Health Infrastructure in
Expanding Immunization Coverage in India.” Indian Journal of Medical Research 125: 29-
40.
Desai, Sonalde and Soumya Alva (1998): “Maternal Education and Child Health: Is there a
Strong Causal Relationship?” Demography 35(1), 71-81.
24
Emmanuel, S. (2000): “Impact to Lung Health of Haze from Forest Fires: The Singapore
Experience,” Respirology, 5(2), 175–182.
Frankenberg, E., D. McKee, and D. Thomas (2004): “Health Consequences of Forest Fires in
Indonesia,” Demography, 42(1), 109–129.
Goenjian, A. K., Molina, L., Steinberg, A. M., Fairbanks, L. A., Alvarez, M. L., & Goenjian, H.
A. et al. (2001): Posttraumatic stress and depressive reactions among Nicaraguan
adolescents after Hurricane Mitch. American Journal of Psychiatry, 158 (5), 788-794.
Goswami B.N., Venugopal V., Sengupta D., Madhusoodanan M.S., Xavier Prince K. (2006):
Increasing trend of Extreme Rain Events over India in a Warming Environment, Science,
314, 5804, 1 December, 1442-1445.
Hoddinott J and Kinsey B. (2001): “Child growth in the time of drought.” Oxford Bulletin of
Economics and Statistics, 63(4):409–436.
Jayachandran, S. (2006): “Air Quality and Early-Life Mortality: Evidence from Indonesia’s
Wildfires.” Stanford economics department, unpublished manuscript.
Kahn, M. (2005): “The death toll from natural disasters: the role of income, geography, and
institutions.” Review of Economics and Statistics, 87(2): 271-284.
Kahn, Matthew (2005): “The Death Toll from Natural Disasters: The Role of Income,
Geography, and Institutions,” Review of Economics and Statistics 87(2), 271-284.
Liu, P. et al. (2005): “Observations by the International Tsunami Survey Team in Sri Lanka,”
Science 308(5728), 1595.
Miller, Barbara (1997): “Social class, gender and intrahousehold food allocations to children in
South Asia,” Social Science & Medicine, 44(11), 1685-1695.

25
Vinod Mishra, T. K. Roy, Robert D. Retherford. “Sex Differentials in Childhood Feeding, Health
Care, and Nutritional Status in India,” Population and Development Review, Vol. 30, No. 2
(Jun., 2004), pp. 269-295
Mueller, Valerie, and Daniel Osgood (2009): “Long-Term Impacts of Droughts on Labour
Markets in Developing Countries: Evidence from Brazil,” Journal of Development Studies
45(10), 1651-1662.
Murthi, Mamta, Anne-Catherine Guio, and Jean Dreze (1995): “Mortality, Fertility, and Gender
Bias in India: A District-Level Analysis.” Population and Development Review 21(4), 745-
782.
Pörtner C. (2010). Natural Hazards and Child Health. University of Washington, Department of
Economics, Working Paper UWEC-2010-3, May 2010.
Rani, M., S. Bonu, et al. (2008). "Differentials in the quality of antenatal care in India."
International Journal for Quality in Health Care 20(1): 62-71.
Rosenzweig, Mark R and T. Paul Schultz. (1982): “Market Opportunities, Genetic Endowments,
and Intrafamily Resource Distribution: Child Survival in Rural India,” The American
Economic Review, 72 (4), 803-815.
Rousham EK. (1996): “Socio-economic influences on gender inequalities in child health in rural
Bangladesh,” Eur J Clin Nutr 50(8): 560-4.
Roussos A, Goenjian AK, Steinberg AM, Sotiropoulou C, Kakaki M, Kabakos C, Karagianni S,
and Manouras V. (2005): “Posttraumatic Stress and Depressive Reactions Among Children
and Adolescents After the 1999 Earthquake in Ano Liosia, Greece.” Am J Psychiatry,
162(3):530–537.

26
Rukumnuaykit, P. (2003): “Crises and Child Health Outcomes: The Impacts of Economic and
Drought and Smoke Crises on Infant Mortality and Birthweight in Indonesia,” Mimeo,
Michigan State.
Sastry, N. (2002): “Forest Fires, Air Pollution, and Mortality in Southeast Asia,” Demography,
39(1), 1–23.
Strömberg, David (2007): “Natural Disasters, Economic Development, and Humanitarian Aid.”
Journal of Economic Perspectives 21(3), pp.199–222.
Thomas, T., Christiaensen, L., Do, Q., Trung, L. (2010): “Natural disasters and household
welfare: evidence from Vietnam,” World Bank Policy Research Working Paper 5491,
December 2010.
Toya, H. Skidmore, M. (2007): “Economic development and the impacts of natural disasters,”
Economics Letters 94, 20-25.
United Nations Children’s Fund. 2008. State of Asia-Pacific’s Children 2008. UNICEF, New
York. Available at: http://www.unicef.org/publications/files/SOAPC_2008_080408.pdf.
Accessed 01 March 2011.
UNICEF, WHO. “Diarrhoea: why children are still dying and what can be done”. New York:
United Nations Children's Fund, 2009. Available at:
http://whqlibdoc.who.int/publications/2009/9789241598415_eng.pdf.
Van Aalst, M. (2006): “The impact of climate change on the risk of natural disasters,” Disasters
30(1), 5-18.
Victora, Cesar G. and Linda Adair, Caroline Fall, Pedro C Hallal, Reynaldo Martorell, Linda
Richter, Harshpal Singh Sachdev, and for the Maternal and Child Undernutrition Study

27
Group (2008): “Maternal and child undernutrition: consequences for adult health and human
capital,” Lancet, 371(9609), 340–357.
Vos F, Rodriguez J, Below R, Guha-Sapir D. Annual Disaster Statistical Review 2009: The
Numbers and Trends. Brussels: CRED; 2010.
Watson, J., Gayer, M., Connolly, M. (2007): “Epidemics after Natural Disasters,” Emerging
Infectious Diseases 13(1), 1-5.

28
Figure 1. Natural disasters occurring in current and previous 11 months
a. 1992-93 NFHS b. 1998-99 NFHS
c. 2005-06 NFHS
29
Table 1: Recommended Immunization Schedule Age Vaccine BCG DPT Polio Measles Age Appropriate
Coverage for all India (weeks) (months) Birth 0 X X BCG
6 weeks 1.5 X X BCG + DPT1 + Polio1 10 weeks 2.5 X X BCG + DPT1-2 + Polio1-2 14 weeks 3.5 X X BCG + DPT1-3 + Polio1-3 36 weeks 9.0 X BCG + DPT1-3 + Polio1-3 + Measles
Source: Universal Immunization Program Division, Department of Family Welfare, Min. of Health & Family Welfare http://cbhidghs.nic.in/hii2003/12.01.htm [accessed 23rd February 2011]

30
Table 2: Child Characteristics in the Indian National Family and Health Surveys 1992-93 NFHS 1998-99 NFHS 2005-06 NFHS (N=31,973) (N=21,688) (N=27,475) Mean SD Mean SD Mean SD Illness in last 2 weeks Diarrhea 0.11 0.31 0.20 0.40 0.09 0.29 Fever 0.21 0.41 0.30 0.46 0.15 0.35 Cough 0.19 0.39 0.35 0.48 0.17 0.38 Any medication given 0.63 0.48 0.61 0.49 0.42 0.49 Anthropometrics Height-for-age -1.87 1.61 -1.72 1.57 -1.62 1.51 Stunted 0.49 0.50 0.45 0.50 0.42 0.49 Weight-for-age -1.93 1.27 -1.74 1.28 -1.81 1.15 Underweight 0.52 0.50 0.45 0.50 0.47 0.50 Weight-for-height -0.92 1.18 -0.84 1.22 -1.05 1.08 Wasted 0.17 0.37 0.16 0.36 0.17 0.38 Age-appropriate vaccination BCG 0.54 0.50 0.62 0.49 0.72 0.45 Polio 0.46 0.50 0.53 0.50 0.74 0.44 DPT 0.45 0.50 0.47 0.50 0.53 0.50 Measles 0.53 0.50 0.62 0.49 0.64 0.48 Ever vaccinated 0.49 0.50 0.69 0.46 0.86 0.35 Fully current 0.30 0.46 0.31 0.46 0.40 0.49 Individual characteristics Age (months) 22.49 13.90 16.78 10.35 29.42 17.32 Male 0.51 0.50 0.52 0.50 0.52 0.50 First born 0.25 0.44 0.26 0.44 0.27 0.45 Second born 0.23 0.42 0.24 0.43 0.25 0.43 Third born 0.18 0.38 0.17 0.38 0.16 0.37 Fourth born 0.12 0.32 0.11 0.32 0.10 0.31 Fifth born 0.08 0.27 0.08 0.27 0.07 0.26 Sixth born or higher 0.14 0.35 0.14 0.34 0.14 0.34 Mother's age at birth 24.47 5.65 24.42 5.47 24.69 5.42 Mother: no education 0.67 0.47 0.57 0.49 0.49 0.50 Mother: primary school 0.16 0.37 0.17 0.37 0.16 0.36 Mother: secondary school 0.16 0.37 0.21 0.41 0.32 0.47 Mother: higher education 0.01 0.10 0.05 0.21 0.03 0.17 Father: no education 0.38 0.48 0.31 0.46 0.29 0.46 Father: primary school 0.26 0.44 0.18 0.39 0.16 0.37 Father: secondary school 0.32 0.46 0.37 0.48 0.47 0.50 Father: higher education 0.05 0.22 0.14 0.35 0.07 0.26 Muslim religion 0.12 0.32 0.13 0.33 0.11 0.32 Scheduled caste/tribe 0.29 0.46 0.36 0.48 0.40 0.49
31
Table 3: Exposure to Natural Disasters by Survey Wave
Exposure in current and
past 1 month Exposure in current and past
11 months
Number of unique state-level events
Proportion of children
exposed
Number of unique state-level events
Proportion of children
exposed 1992-93 NFHS Any disaster 7 0.26 10 0.71 Drought 1 0.15 1 0.20 Earthquake 0 n/a 0 n/a Extreme temperature 0 n/a 0 n/a Flood 6 0.11 6 0.51 Mass movement 0 n/a 1 0.01 Storm 0 n/a 2 0.20 1998-99 NFHS Any disaster 5 0.28 13 0.60 Drought 0 n/a 0 n/a Earthquake 1 0.01 1 0.01 Extreme temperature 2 0.24 2 0.39 Flood 1 0.02 3 0.14 Mass movement 0 n/a 4 0.14 Storm 1 0.06 3 0.18 2005-06 NFS Any disaster 8 0.25 28 0.82 Drought 0 n/a 0 n/a Earthquake 0 n/a 0 n/a Extreme temperature 1 0.16 2 0.51 Flood 7 0.08 21 0.78 Mass movement 0 n/a 1 0.03 Storm 0 n/a 4 0.11

32
Table 4: Effects of Disasters on Acute Illnesses in the Last Two Weeks (1) (2) (3) (4) Diarrhea Fever ARI Any medication (1) Any disaster in past month 0.023 0.020 0.035 0.005 (0.004)*** (0.005)*** (0.005)*** (0.010)
Interaction Effects of Disaster Exposure (2) X male 0.006 0.006 0.010 0.023 (0.006) (0.007) (0.007) (0.015) (3) X scheduled caste/tribe -0.003 -0.001 0.001 0.010 (0.007) (0.008) (0.009) (0.017) (4) X age 0-1 0.019 -0.007 0.004 0.037 (0.007)*** (0.007) (0.008) (0.015)** (5) X no education 0.008 0.017 0.008 0.017 (0.006) (0.008)** (0.008) (0.016) (6) X South -0.038 -0.008 0.010 0.047 (0.011)*** (0.016) (0.017) (0.026)* Observations 81136 81122 81126 22230 Sample mean(y) 0.127 0.212 0.228 0.598 95% confidence interval in parentheses. Standard errors are corrected for heteroskedasticity and clustered by primary sampling unit; * significant at 10%; ** significant at 5%; *** significant at 1%. Each cell is estimated with a separate regression; binary outcomes are estimated using linear probability models. All regressions include the following controls: male, quadratic mother's age at birth, mother's education, father's education, Muslim religion, scheduled caste/tribe, birth order, gender-specific month of birth quartic polynomial, survey wave, and state fixed effects.

33
Table 5: Effects of Disasters on Physical Growth (1) (2) (3) (4) (5) (6)
Height-for-age Stunted
Weight-for-age
Underweight
Weight-for-height Wasted
(1)
Any disaster in past year
-0.148 0.031 -0.123 0.032 -0.045 -0.014
(0.033)**
* (0.009)**
* (0.026)**
* (0.008)*** (0.026)* (0.007)**
Interaction Effects of Disaster Exposure (2) X male 0.037 -0.027 0.061 -0.018 0.044 -0.003
(0.029) (0.009)**
* (0.022)**
* (0.009)** (0.024)* (0.007) (3) X scheduled
caste/tribe 0.011 -0.015 -0.022 0.008 -0.065 -0.007
(0.042) (0.012) (0.032) (0.011) (0.032)** (0.009) (4) X age 0-1 0.079 -0.054 -0.032 -0.043 0.121 -0.051
(0.028)**
* (0.008)**
* (0.021) (0.008)*** (0.023)**
* (0.007)**
* (5) X no education -0.024 0.032 0.119 0.010 0.324 -0.026
(0.077) (0.022) (0.052)** (0.020) (0.058)**
* (0.018) (6) X South -0.020 0.029 0.109 0.014 0.300 -0.021
(0.077) (0.022) (0.052)** (0.020) (0.058)**
* (0.018) Observations 59145 59145 65650 65650 59346 59346 Sample mean(y) -1.727 0.448 -1.839 0.483 -0.950 0.166 95% confidence interval in parentheses. Standard errors are corrected for heteroskedasticity and clustered by primary sampling unit; * significant at 10%; ** significant at 5%; *** significant at 1%. Each cell is estimated with a separate regression; binary outcomes are estimated using linear probability models. All regressions include the following controls: male, quadratic mother's age at birth, mother's education, father's education, Muslim religion, scheduled caste/tribe, birth order, gender-specific month of birth quartic polynomial, survey wave, and state fixed effects.

34
Table 6: Effects of Disasters on Immunizations (1) (2) (3) (4) (5) (6)
BCG DPT Polio Measles Any
vaccination Fully
current (1) Any disaster in past
year -0.053 -0.019 -0.042 -0.034 -0.037 -0.049
(0.012)*** (0.010)* (0.010)*** (0.008)*** (0.012)*** (0.009)***
Interaction Effects of Disaster Exposure (2) X male 0.005 -0.012 -0.014 0.001 -0.005 -0.004 (0.014) (0.012) (0.012) (0.009) (0.013) (0.010) (3) X scheduled
caste/tribe 0.008 0.015 0.026 -0.006 0.009 0.011
(0.018) (0.014) (0.015)* (0.012) (0.017) (0.013) (4) X no education -0.014 0.003 0.013 -0.011 0.022 -0.018 (0.016) (0.013) (0.014) (0.010) (0.015) (0.012) (5) X South 0.086 0.020 -0.009 -0.024 0.096 0.004 (0.030)*** (0.028) (0.028) (0.021) (0.028)*** (0.027) Observations 21746 29119 29246 37517 25579 38195 Sample mean(y) 0.515 0.424 0.467 0.669 0.564 0.276 Sample ages (months) 0-11 0-15 0-15 0-20 0-20 0-20 Standard errors are corrected for heteroskedasticity and clustered by primary sampling unit; * significant at 10%; ** significant at 5%; *** significant at 1%. Each cell is estimated with a separate regression; binary outcomes are estimated using linear probability models. All regressions include the following controls: male, quadratic mother's age at birth, mother's education, father's education, Muslim religion, scheduled caste/tribe (SCST), birth order, gender-specific month of birth quartic polynomial, survey wave, and state fixed effects.
35
Table 7: Robustness Checks (1) (2) (3) (4) (5) (6)
Any disaster in past 6 monthsa
Excluding disasters
killing>1000 peoplea
Excluding disasters
affecting>1 million peoplea
Including interview
month fixed
effectsa Including
urban areasb Limited to residentsa, c
Diarrhead 0.023 0.024 0.022 0.019 0.022 (0.004)*** (0.005)*** (0.004)*** (0.003)*** (0.004)*** Feverd 0.019 0.025 0.015 0.019 0.020 (0.005)*** (0.006)*** (0.005)*** (0.004)*** (0.006)*** ARId 0.034 0.045 0.028 0.028 0.035 (0.006)*** (0.007)*** (0.006)*** (0.004)*** (0.006)*** Any medication givend
0.005 0.017 -0.006 -0.001 -0.000 (0.010) (0.011) (0.010) (0.008) (0.010)
Height-for-aged -0.092 -0.130 -0.126 -0.135 -0.111 -0.158 (0.027)*** (0.029)*** (0.030)*** (0.032)*** (0.025)*** (0.035)*** Stuntedd 0.016 0.027 0.025 0.029 0.020 0.035 (0.007)** (0.008)*** (0.008)*** (0.009)*** (0.007)*** (0.009)*** Weight-for-aged -0.066 -0.126 -0.085 -0.112 -0.084 -0.138 (0.021)*** (0.024)*** (0.022)*** (0.025)*** (0.020)*** (0.027)*** Underweightd 0.014 0.029 0.017 0.029 0.025 0.036 (0.007)** (0.007)*** (0.007)** (0.008)*** (0.006)*** (0.009)*** Weight-for-heightd
-0.043 -0.061 -0.048 -0.040 -0.003 -0.061 (0.020)** (0.023)*** (0.023)** (0.025) (0.020) (0.027)**
Wastedd -0.003 -0.000 -0.009 -0.014 -0.018 -0.013 (0.005) (0.006) (0.006) (0.007)** (0.005)*** (0.007)* BCGe -0.044 -0.043 -0.007 -0.057 -0.053 -0.055 (0.011)*** (0.011)*** (0.011) (0.012)*** (0.010)*** (0.014)*** DPTe -0.023 -0.009 0.008 -0.021 -0.012 -0.016 (0.009)** (0.009) (0.009) (0.010)** (0.008) (0.011) Polioe -0.032 -0.034 0.000 -0.041 -0.031 -0.046 (0.009)*** (0.009)*** (0.009) (0.010)*** (0.008)*** (0.011)*** Measlese -0.022 -0.022 -0.018 -0.034 -0.034 -0.033 (0.007)*** (0.007)*** (0.007)*** (0.008)*** (0.006)*** (0.008)*** Any vaccinatione 0.007 -0.020 0.044 -0.032 -0.040 -0.045
(0.011) (0.011)* (0.011)*** (0.012)*** (0.010)*** (0.013)*** Fully currente -0.032 -0.033 -0.018 -0.049 -0.039 -0.049 (0.008)*** (0.008)*** (0.008)** (0.009)*** (0.008)*** (0.010)*** Standard errors are corrected for heteroskedasticity and clustered by primary sampling unit; * significant at 10%; ** significant at 5%; *** significant at 1%. Each binary outcome is estimated using a separate linear probability model. All regressions include the following controls: male, quadratic mother's age at birth, mother's education, father's education, Muslim religion, scheduled caste/tribe (SCST), birth order, gender-specific month of birth quartic polynomial, survey wave, and state fixed effects. aDisaster exposure for diarhhea, fever, cough, and any medication given for such conditions is defined as the previous 1 month, including the month of interview. All other outcomes are predicted based on disaster exposure in the past 11 months, including the month of interview. bSamples sizes are as follows: diarrhea (N=118,714); fever (N=118,696); cough (N=118,689); any medication (N=30,987); height-for-age, stunted (N=87,471); weight-for-age, underweight (N=96,077); weight-for-height, wasted (N=87,744); BCG (N=30,827); DPT (N=41,266); polio (N=41,413); measles (N=53,502); any vaccination (N=33,709); fully current (N=54,366).
36
cResidents are defined as mothers who report residing in the current location for two or more years. dSample is restricted to all children under 5 years of age at the time of survey. Samples for vaccination outcomes are restricted to ages 0-11 months for BCG, 0-15 months for DPT and Polio, and 0-20 months for measles and any vaccination. eSamples are restricted to ages 0-11 months for BCG, 0-15 months for diphtheria and polio, and 0-20 months for measles, any vaccination, and being fully current on all vaccinations.