the impact of monomer sequence and ...d-scholarship.pitt.edu/31125/1/thesis_mawashington_4-10...iv...
TRANSCRIPT

i 1`
THE IMPACT OF MONOMER SEQUENCE AND STEREOCHEMISTRY ON THE
BULK PROPERTIES OF REPEATING SEQUENCE POLY(LACTIC-CO-GLYCOLIC
ACID) MATRICES
by
Michael Andrew Washington
Bachelors of Science, Seton Hill University, 2010
Submitted to the Graduate Faculty of the
Kenneth P. Dietrich School of Arts and Sciences in partial fulfillment
of the requirements for the degree of
Doctor of Philosophy in Chemistry
University of Pittsburgh
2017

ii
UNIVERSITY OF PITTSBURGH
DIETRICH SCHOOL OF ARTS AND SCIENCES
This dissertation was presented
by
Michael Andrew Washington
It was defended on
April 7th, 2017
and was approved by
Geoffrey R. Hutchison, Assistant Professor, Department of Chemistry
W. Seth Horne, Associate Professor, Department of Chemistry
Steven R. Little, William Kepler Whiteford Endowed Professor and Chair, Department of
Chemical Engineering, Bioengineering, Pharmaceutical Sciences, Ophthalmology,
Immunology, and the McGowan Institute for Regenerative Medicine
Dissertation Advisor: Tara Y. Meyer, Associate Professor, Department of Chemistry and the
McGowan Institute for Regenerative Medicine

iii
Copyright © by Michael Andrew Washington
2017

iv
Poly(lactic-co-glycolic acid) (PLGA)-based biodegradable materials have attracted
considerable interest in the field of bioengineering due to their biocompatibility, FDA approval
and tunable physico-chemical properties. Current methods for tuning the properties of PLGAs
for a specific therapeutic application are, however, limited to changing the monomeric ratio and
stereochemistry of cyclic diesters prior to ring-opening polymerization (ROP), a reaction that
produces an unsequenced random copolymer. To understand how sequence, both structural and
stereochemical, can be exploited to tune PLGA properties for specific applications, copolymers
bearing periodic repeating sequences of lactic and glycolic acid were prepared using segmer
assembly polymerization (SAP), an approach for controlling the sequence and stereochemistry
within PLGA. A series of sequenced PLGAs were prepared, fabricated into various therapeutic
devices, and characterized both in their initial states and after exposure to physiological
conditions to promote hydrolytic degradation. Changes in sequence, stereochemistry, and
monomeric ratios were shown to have a profound effect on such properties as in vitro erosion,
swelling, compressive modulus, ultimate compressive stress, internal morphology, and
crystallinity in implantable pellets. Data acquired from thermal analysis, gel permeation
chromatography, and proton nuclear magnetic resonance established that the onset of molecular
weight loss and oligomer formation via hydrolytic cleavage may be delayed based on backbone
sequence. Two-photon microscopy studies of PLGA microparticles dramatically illustrate the
THE IMPACT OF MONOMER SEQUENCE AND STEREOCHEMISTRY ON THE
BULK PROPERTIES OF REPEATING SEQUENCE POLY(LACTIC-CO-
GLYCOLIC ACID) MATRICES
Michael Andrew Washington, PhD
University of Pittsburgh, 2017

v
profound influence of backbone sequence on the hydrolysis profile and development of the
internal acidic microclimate. Sequenced PLGA microparticles were found to maintain their
initial internal pH over a 28 d time period compared to their random analogues. These results
were confirmed by evaluating the in vivo foreign body response to subcutaneous microparticle
injections. After 28 d in vivo, the alternating stereopure PLGA, poly LG, had minimal giant cell
infiltrate compared to the commonly used random analogue, PDLGA-50. These discoveries
establish a greater understanding of the role of sequence in controlling properties for
bioengineering applications in addition to providing valuable insight into the preferential
hydrolysis mechanism of sequenced PLGAs.

vi
TABLE OF CONTENTS
LIST OF TABLES ...................................................................................................................... XI
LIST OF FIGURES .................................................................................................................. XII
LIST OF SCHEMES .............................................................................................................. XXV
LIST OF EQUATIONS ........................................................................................................ XXVI
LIST OF ABBREVIATIONS ............................................................................................. XXVII
PREFACE .............................................................................................................................. XXXI
DEDICATION...................................................................................................................... XXXII
ACKNOWLEDGEMENTS .............................................................................................. XXXIII
1.0 INTRODUCTION ........................................................................................................ 1
1.1 SIGNIFICANCE .................................................................................................. 1
1.2 SYNTHETIC METHODS AND MICROSTRUCTURAL CONTROL ......... 2
1.3 MICROSTRUCTURE – PROPERTY RELATIONSHIPS............................. 5
1.4 STRATEGIES FOR SEQUENCE – CONTROLLED POLYMERS:
BIOLOGICAL AND SYNTHETIC .................................................................................... 7
1.4.1 Segmer Assembly Polymerization: Tailor-Made Sequences ..................... 10
1.5 EXPLOITING SEQUENCE TO CONTROL PROPERTIES ...................... 11
1.6 THESIS OVERVIEW ....................................................................................... 13

vii
2.0 THE IMPACT OF MONOMER SEQUENCE AND STEREOCHEMISTRY ON
THE SWELLING AND EROSION OF BIODEGRADABLE POLY(LACTIC-CO-
GLYCOLIC ACID) MATRICES .............................................................................................. 16
2.1 OVERVIEW ....................................................................................................... 16
2.2 INTRODUCTION ............................................................................................. 17
2.3 MATERIALS AND METHODS ...................................................................... 20
2.3.1 Materials ......................................................................................................... 20
2.3.2 Characterization ............................................................................................ 21
2.3.3 Preparation of cylindrical-shaped pellets .................................................... 22
2.3.4 In vitro swelling of sequenced and random PLGAs.................................... 22
2.3.5 In vitro erosion of sequenced and random PLGAs ..................................... 23
2.3.6 Water contact angle experiments ................................................................. 23
2.4 RESULTS ........................................................................................................... 24
2.4.1 Naming conventions and characterization of PLGA copolymers ............. 24
2.4.2 Characterization ............................................................................................ 26
2.4.3 In vitro swelling of sequenced and random PLGAs.................................... 29
2.4.4 In vitro erosion of sequenced and random PLGAs ..................................... 32
2.4.5 Correlated trends in swelling and erosion ................................................... 36
2.4.6 Changes in molecular weight and distribution ........................................... 37
2.4.7 Surface water contact angle .......................................................................... 38
2.5 DISCUSSION ..................................................................................................... 40
2.6 CONCLUSIONS ................................................................................................ 44

viii
3.0 MONOMER SEQUENCE IN PLGA MICROPARTICLES: EFFECTS ON
ACIDIC MICROCLIMATES AND IN VIVO INFLAMMATORY RESPONSE ................ 45
3.1 OVERVIEW ....................................................................................................... 45
3.2 INTRODUCTION ............................................................................................. 46
3.3 MATERIALS AND METHODS ...................................................................... 50
3.3.1 Materials ......................................................................................................... 50
3.3.2 Characterization ............................................................................................ 51
3.3.3 Preparation of PLGA microparticles .......................................................... 51
3.3.4 Fluorescent intensity ratio vs. pH standard curve ...................................... 52
3.3.5 Microclimate pH mapping inside microparticles ....................................... 52
3.3.6 Two-photon microscopy image acquisition ................................................. 53
3.3.7 Image processing for pH distribution .......................................................... 53
3.3.8 Scanning electron microscopy characterization of microparticle
morphology ................................................................................................................. 54
3.3.9 In vivo studies and histology ......................................................................... 54
3.4 RESULTS ........................................................................................................... 55
3.4.1 PLGA copolymer and microparticle synthesis and characterization ....... 55
3.4.2 LysoSensor Yellow/Blue DND-160 pH-dependent fluorescent response.. 58
3.4.3 Internal acidity and morphology changes within sequenced and random
PLGA microparticles ................................................................................................. 60
3.4.4 Trends in pH distribution for sequenced and random PLGA
microparticles ............................................................................................................. 64
3.4.5 External morphology changes in sequenced and random PLGAs............ 66

ix
3.4.6 Foreign body response to microparticle injections ..................................... 69
3.5 DISCUSSION ..................................................................................................... 70
3.6 CONCLUSIONS ................................................................................................ 75
4.0 THE EFFECT OF MONOMER SEQUENCE ON THE RETENTION OF
MECHANICAL PROPERTIES DURING HYDROLYTIC DEGRADATION FOR
SEQUENCE-DEFINED POLY(LACTIC-CO-GLYCOLIC ACID)S ................................... 76
4.1 OVERVIEW ....................................................................................................... 76
4.2 INTRODUCTION ............................................................................................. 78
4.3 MATERIALS AND METHODS ...................................................................... 81
4.3.1 Materials ......................................................................................................... 81
4.3.2 1H and 13C NMR spectroscopy ..................................................................... 82
4.3.3 Differential scanning calorimetry ................................................................ 82
4.3.4 Gel permeation chromatography ................................................................. 82
4.3.5 Fabrication of PLGA cylindrical constructs ............................................... 83
4.3.6 Compression testing methodology ............................................................... 83
4.3.7 In vitro thermal properties and molecular weight changes ....................... 84
4.3.8 Powder x-ray diffraction ............................................................................... 84
4.4 RESULTS ........................................................................................................... 85
4.4.1 Naming conventions and characterization of PLGA copolymers ............. 85
4.4.2 Mechanical properties of sequenced and random PLGA cylindrical
constructs .................................................................................................................... 87
4.4.3 Thermal properties for sequence-defined and random PLGAs as a
function of degradation ............................................................................................. 90

x
4.4.4 Molecular weight distributions for sequence-defined and random PLGAs
as a function of degradation ...................................................................................... 93
4.4.5 Characterization of hydrolyzed PLGAs using 1H-NMR............................ 96
4.4.6 Degradation induced crystallinity characterized using powder x-ray
diffraction ................................................................................................................... 98
4.5 DISCUSSION ................................................................................................... 100
4.6 CONCLUSIONS .............................................................................................. 105
5.0 PROSPECTUS ......................................................................................................... 106
APPENDIX A ............................................................................................................................ 108
APPENDIX B ............................................................................................................................ 135
APPENDIX C ............................................................................................................................ 143
BIBLIOGRAPHY ..................................................................................................................... 174

xi
LIST OF TABLES
Table 1. Characterization data for sequence-defined and random PLGAs utilized in swelling and
erosion studies. .............................................................................................................................. 25
Table 2. Characterization data for sequenced and random PLGAs utilized in acidic microclimate
study. ............................................................................................................................................. 57
Table 3. PLGA characterization data for sequence-defined and random PLGA analogues. ........ 87

xii
LIST OF FIGURES
Figure 1. Ring-opening and condensation polymerizations produce random poly(lactic-co-
glycolic acid)s with various microstructures. ................................................................................. 3
Figure 2. Microstructural variants of (A) poly(lactide) and (B) poly(lactide-co-glycolide) using
metal-mediated ring-opening polymerizations. .............................................................................. 4
Figure 3. Degradation times for various copolymers of lactic and glycolic acid including the
homopolymers. Image adapted from “Synthetic biodegradable polymers as orthopedic devices,”
by J.C. Middleton, 2000, Biomaterials, 21, 2338. Copyright 2000 Elsevier Science Ltd. Adapted
with permission. .............................................................................................................................. 7
Figure 4. Progress in synthetic polymerization methods towards achieving architectures similar
to those produced by biological systems. ....................................................................................... 9
Figure 5. Comparison of segmer assembly polymerization methodology (A) and traditional
condensation polymerizations (B) for preparing binary copolymers. Here, X and Y represent
orthogonal protecting groups. ....................................................................................................... 11
Figure 6. Deviations from typical random PLGA degradation times for various sequence-defined
PLGAs. Here, the gray space between the two curves represents the accessible degradation times
for sequenced PLGAs. .................................................................................................................. 14

xiii
Figure 7. Graphical abstract for Chapter 2 – The impact of monomer sequence and
stereochemistry on the swelling and erosion of biodegradable poly(lactic-co-glycolic acid)
matrices. ........................................................................................................................................ 16
Figure 8. 1H NMR (500 MHz) spectra of sequenced and random PLGAs (δ 5.5 – 4.5 and 2.0 –
1.2 ppm). Labels corresponding to the locations of methine (A), methylene (B), and methyl (C)
proton chemical shifts for poly(lactic-co-glycolic acid) are included for reference. .................... 27
Figure 9. 13C NMR (500 MHz) spectra of glycolyl (top) and lactyl (bottom) carbonyl regions of
sequenced and random PLGAs. .................................................................................................... 28
Figure 10. Side-view appearance of water-swollen cylindrical pellets as a function of hydrolysis
time. .............................................................................................................................................. 30
Figure 11. Swelling profiles of sequenced and random PLGAs over 8 weeks (top); enlargement
of the first 3-week time period (bottom). Open symbols represent random copolymer controls
and closed symbols represent sequenced copolymers. ................................................................. 31
Figure 12. Top-view appearance of eroded cylindrical pellets, after lyophilization, as a function
of hydrolysis time. ........................................................................................................................ 33
Figure 13. Erosion profiles of sequenced and random PLGAs over 19 weeks (top); enlargement
of weeks 2-9 (bottom). Open symbols represent random copolymer controls and closed symbols
represent sequenced copolymers. .................................................................................................. 34
Figure 14. Maximum swelling % (A) and erosion half-life (B) of sequenced and random PLGAs.
*Erosion half-life is approximately 10-14 weeks. Enlarged views (C) of cylindrical constructs of
PDLGA-50 and poly LG in week 2 of degradation highlighting the dramatic sequence-based
differences in swelling and erosion behavior. ............................................................................... 36

xiv
Figure 15. Weight average molecular weight (left); number average molecular weight (center);
dispersity (right) of sequenced and random PLGAs as a function of time. Open symbols
represent random copolymer controls and closed symbols represent sequenced copolymers. .... 37
Figure 16. Average water contact angles from unexposed films (initial) and films exposed to
physiological conditions over 8 days measured in their hydrated (post-wet) and lyophilized (post-
dry) states. Error bars represent the standard error of the mean. .................................................. 39
Figure 17. Differences in the rates of hydrolysis for random and sequenced PLGA copolymers
with the same L:G ratio................................................................................................................. 42
Figure 18. Graphical abstract for Chapter 3 – Monomer sequence in PLGA microparticles:
Effects on acidic microclimates and in vivo inflammatory response. ........................................... 45
Figure 19. Synthetic preparation of sequenced and random PLGAs and NMR characterization
(A) Synthesis of sequenced PLGA copolymers via segmer assembly polymerization (SAP)
methodology. (B) 1H NMR spectra (left) and 13C NMR spectra (right) for the sequenced periodic
PLGA copolymers. (C) Ring-opening polymerization synthesis of the purchased random PLGAs.
(D) 1H NMR spectra (left) and 13C NMR spectra (right) for the random PLGA copolymers. For
all polymers, the 1H NMR spectra display the methine, methylene, and methyl resonances from
left to right. 13C NMR spectra display the resonances for glycolyl, lactidyl, methine, methylene,
and methyl carbons from left to right. .......................................................................................... 56
Figure 20. Ratiometric properties of pH-sensitive dye, two-photon microscopy experimental
overview, and image acquisition parameters. (A) Chemical structure, emission profiles (λex = 360
nm), and emission window regions for the deprotonated and protonated LysoSensorTM pH probe.
(B) The low energy two-photon excitation, λex = 740 nm ≈ 2x one-photon λex, penetrates deep
into the interior of the microparticles providing a detailed pH map (C) Z-stack image acquisition

xv
of microparticles in solution were monitored using two separate λem windows. Merged images
are displayed throughout the manuscript. ..................................................................................... 59
Figure 21. Internal acidic microclimate distributions of sequenced and random PLGA
copolymers after 1, 3, 7, 9, 11 and 14 d in vitro (brightness normalized). *Image not obtained
due to laser mode-locking complications. Scale bar = 100 μm. ................................................... 61
Figure 22. Two-photon microscopy images of the internal acidic microclimate distribution
images within PDLGA-65, poly LracG, and poly LG at later time points; 21, 28, 35, 49, and 59 d.
‡ Ratiometric pH probe response was no longer discernable from background autofluorescence
resulting from dye-leaching. Scale bar = 100 μm. ........................................................................ 63
Figure 23. Contour maps of the internal pH of PLGA microparticles at time points 3, 7, 9, 11, 14,
21, 28, 35, 49 and 59 days: (A1) PDLGA-50, (B1) PLLGA-50, (C1) PDLGA-65, (D1) poly LG,
(E1) poly LracG and corresponding internal pH distribution histograms (A2-E2). *Profile not
obtained due to laser mode-locking complications. Data obtained from images containing
multiple microparticles. ................................................................................................................ 65
Figure 24. Scanning electron micrographs of sequenced and random PLGAs after 7, 14, 21, 28,
and 35 d in vitro under x350 magnification. *Sample no longer retained structural integrity. .... 67
Figure 25. Scanning electron micrographs of single particles of PDLGA-50 (t = 14 d) (A),
PDLGA-65 (t = 35 d) (B), PLLGA-50 (t = 35 d) (C), poly LracG (t = 35 d) (D), and poly LG (t =
35 d) (E) under x800 magnification. All images were taken at 35 d with the exception of
PDLGA-50, which only retained a spherical morphology up to 14 d. ......................................... 68
Figure 26. H&E staining of subcutaneous tissue microparticle depot injections in C57BL/6J
wild-type mice, 2 and 4 weeks after injections (x25). Section 1 and 2 are representative sections

xvi
of tissue from two different mice. Arrows indicate presence of foreign body giant-cells. Scale bar
= 100 μm. ...................................................................................................................................... 70
Figure 27. Linkage type(s) and distribution for PDLGA-50 (top) and poly LG (bottom) with
relative linkage hydrolysis rates.................................................................................................... 71
Figure 28. Graphical abstract for Chapter 4 – The effect of monomer sequence on the retention
of mechanical properties during hydrolytic degradation for sequence-defined poly(lactic-co-
glycolic acid)s. .............................................................................................................................. 76
Figure 29. Segmer assembly polymerization (SAP) methodology for synthesizing sequenced-
defined PLGAs, poly LG and poly LracG, in addition to the ring-opening polymerization (ROP)
of random PLGAs. ........................................................................................................................ 86
Figure 30. Compressive modulus (CM) (A) and ultimate compressive strength (UCS) (B) versus
degradation time for sequenced and random PLGA copolymers. Solid (sequenced PLGAs) and
dotted (random PLGAs) lines were fitted using a 1st order binomial smoothing algorithm and
error bars represent ± standard error of mean (n = 3). .................................................................. 88
Figure 31. Differential scanning calorimetry thermograms of random (A) and sequenced (B)
PLGAs as a function of degradation time. *Crystallinity was analyzed using x-ray diffraction. 91
Figure 32. Gel permeation chromatography chromatograms of random (A) and sequenced (B)
PLGAs as a function of degradation time. .................................................................................... 94
Figure 33. 1H NMR comparison in the region of δ 5.4 – 4.1 ppm for PDLGA-50 (A) and poly
LG (B) over the course of 63 d in vitro hydrolysis. ...................................................................... 97
Figure 34. Powder x-ray diffraction diffractograms of PLLGA-50, poly LracG, and poly LG at
various time points during the latter stages of degradation. ......................................................... 99

xvii
Figure 35. Multi-phase degradation behavior of PLGAs, where Δ1 and Δ2 represent differences in
property retention times, depend on the microstructural composition of the copolymer, and are
not equivalent. ............................................................................................................................. 102
Figure 36. Degradation scheme for random and sequenced PLGA copolymers as a function of
hydrolysis time where time T ≠ T' and τ ≠ τ', as these parameters depend on the microstructural
composition of the copolymer. Colors correspond to specific hydrolysis mechanisms (i.e.,
noncatalytic (yellow), autocatalytic (green), and end-scission (red)). Oligomeric crystallization is
represented in T7 and T7'. ............................................................................................................ 104
Figure A1. Synthesis of orthogonally protected lactic and glycolic acid building blocks, tert-
butyldiphenylsilyl protected alcohols (A) and benzyl protected carboxylic acids (B), and segmer
assembly methodology of simple (C) and complex (D) sequenced poly(lactic-co-glycolic acid)s.
..................................................................................................................................................... 108
Figure A2. Gel permeation chromatography (GPC) chromatograms of sequenced and random
PLGAs acquired using a THF mobile phase, calibrated relative to polystyrene standards. ....... 109
Figure A3. Differential scanning calorimetry (DSC) thermograms of sequenced and random
PLGAs acquired from the second heating cycle at a rate of 10 °C/min. .................................... 110
Figure A4. 1H NMR (500 MHz, δ 9.0 – 0.0 ppm) of 50:50 poly(D,L-lactide-co-glycolide)
(PDLGA-50) ............................................................................................................................... 111
Figure A5. 13C NMR (500 MHz, δ 220 – -10.0 ppm) of 50:50 poly(D,L-lactide-co-glycolide)
(PDLGA-50). .............................................................................................................................. 112
Figure A6. 1H NMR (500 MHz, δ 9.0 – 0.0 ppm) of 65:35 poly(D,L-lactide-co-glycolide)
(PDLGA-65). .............................................................................................................................. 113
xviii
Figure A7. 13C NMR (500 MHz, δ 220 – -10.0 ppm) of 65:35 poly(D,L-lactide-co-glycolide)
(PDLGA-65). .............................................................................................................................. 114
Figure A8. 1H NMR (500 MHz, δ 9.0 – 0.0 ppm) of 50:50 poly(L-lactide-co-glycolide)
(PLLGA-50). ............................................................................................................................... 115
Figure A9. 13C NMR (500 MHz, δ 220 – -10.0 ppm) of 50:50 poly(L-lactide-co-glycolide)
(PLLGA-50). ............................................................................................................................... 116
Figure A10. 1H NMR (500 MHz, δ 9.0 – 0.0 ppm) of poly LG. ................................................ 117
Figure A11. 13C NMR (500 MHz, δ 220 – -10.0 ppm) of poly LG. ........................................... 118
Figure A12. 1H NMR (500 MHz, δ 9.0 – 0.0 ppm) of poly LracG. ............................................. 119
Figure A13. 1C NMR (500 MHz, δ 220 – -10.0 ppm) of poly LracG.......................................... 120
Figure A14. 1H NMR (500 MHz, δ 9.0 – 0.0 ppm) of poly GLG. ............................................. 121
Figure A15. 13C NMR (500 MHz, δ 220 – -10.0 ppm) of poly GLG. ........................................ 122
Figure A16. 1H NMR (500 MHz, δ 9.0 – 0.0 ppm) of poly LLG. .............................................. 123
Figure A17. 13C NMR (500 MHz, δ 220 – -10.0 ppm) of poly LLG. ........................................ 124
Figure A18. 1H NMR (500 MHz, δ 9.0 – 0.0 ppm) of poly GLLG. ........................................... 125
Figure A19. 13C NMR (500 MHz, δ 220 – -10.0 ppm) of poly GLLG. ..................................... 126
Figure A20. 1H NMR (500 MHz, δ 9.0 – 0.0 ppm) of R-SAP. .................................................. 127
Figure A21. 13C NMR (500 MHz, δ 220 – -10.0 ppm) of R-SAP. ............................................. 128
Figure A22. MALDI-ToF-MS spectra acquired in reflector mode of polymers prepared via
segmer assembly polymerization in the mass range of 1000-2000 Da. Arrows indicate the
presence of impurities while sequence errors are labeled as “–G” or “–L”. Note: MALDI-ToF
spectra of these polyesters typically consist of only cyclic species. It is not clear if this pattern is

xix
due to preferential ionization/volatilization of the cyclics or to the selective formation of cyclics
in this molecular weight range. ................................................................................................... 129
Figure A23. 13C NMR spectral (500 MHz) comparison of R-SAP with several sequenced
copolymer standards demonstrating the complexity of glycolyl carbonyl peak assignments.
*Chemical shifts of conventional dimeric sequence assignments from PLGAs synthesized via
ring-opening polymerization of lactide and glycolide. ............................................................... 130
Figure A24. 1H NMR spectra overlay (δ 4.3-5.6 ppm) of poly LG. The small amount of
epimerization present in the 0 day sample (δ ~4.7, 4.8 ppm) does not increase with degradation
time and no addition resonances appear. Transesterification would be expected to introduce new
peaks. .......................................................................................................................................... 131
Figure A25. 1H NMR spectra overlay (δ 4.3-5.6 ppm) of poly LG at day 35. The day 35 poly LG
sample is compared with spectra of poly GLG and poly LLG to illustrate the chemical shifts that
would be expected if the sample was contaminated by transesterification-generated GG and LL
units. ............................................................................................................................................ 132
Figure A26. Surface water contact angles of films exposed to physiological conditions over 8
days measured in their hydrated (post-wet) state. The error bars represent ± standard error of the
mean (n=5). Note: this study was only performed on PDLGA-50 and poly LG because these
polymers exhibited the largest differences in swelling and erosion behavior. As their surface
contact angles under these conditions were nearly the same, other sequences were not explored.
Further evidence for the lack of sensitivity of this measurement to sequence can be found in the
comparison of PDLGA-50 with PDLGA-65. Despite the presence of significantly more
hydrophobic L units, the contact angle behavior cannot be differentiated from PDLGA-50. .... 133

xx
Figure A27. Surface water contact angles of films exposed to physiological conditions over 8
days measured in their lyophilized (post-dry) state. The error bars represent ± standard error of
the mean (n=5). Note: this study was only performed on PDLGA-50 and poly LG because these
polymers exhibited the largest differences in swelling and erosion behavior. As their surface
contact angles under these conditions were nearly the same, other sequences were not explored.
Further evidence for the lack of sensitivity of this measurement to sequence can be found in the
comparison of PDLGA-50 with PDLGA-65. Despite the presence of significantly more
hydrophobic L units, the contact angle behavior cannot be differentiated from PDLGA-50. .... 134
Figure B1. Gel permeation chromatography (GPC) chromatograms of sequenced and random
PLGA copolymers. ..................................................................................................................... 135
Figure B2. Differential scanning calorimetry (DSC) thermograms of PLGAs. The standard glass
transition temperatures of all polymers were measured in the second heating cycle (right).
Thermal data for non-loaded (left, solid lines) and LysoSensorTM loaded (left, dotted lines)
PLGA microparticles prepared by a single-emulsion (O/W) methodology were determined
during the first heating cycle....................................................................................................... 136
Figure B3. Scanning electron microscopy images (x80) of control (non-loaded) and
LysoSensorTM loaded PLGA microparticle prepared via a single-emulsion (O/W) fabrication
method......................................................................................................................................... 137
Figure B4. Fluorescence spectra overlay of LysoSensorTM pH probe in various 0.1 M citric acid
and 0.2 M Na2HPO4 buffer solutions (pH = 2.83 – 7.04).......................................................... 138
Figure B5. The pH sensitivity of LysoSensorTM Yellow/Blue DND-160 (PDMPO) at
concentration 2 µM. The third-order polynomial curve fitting data was y = -0.0449 x3 + 0.6305
x2 - 2.56295 x + 3.36182, where y = I450 nm/I530 nm and x = pH, r2 = 0.994. ...................... 138

xxi
Figure B6. Evolution of characteristic acidic microclimate features monitored using two-photon
microscopy. Displayed images are representative of the population at specific time intervals (top
right; days). *Data was unable to be acquired due to dye-loss. .................................................. 139
Figure B7. Two-photon microscopy images of hydrated microparticles without encapsulated dye.
Images were acquired using λex = 740 nm, 5.40 % intensity. Minimal to no fluorescent
interference was detected using the previously described image acquisition settings. Various
threshold settings were applied for each polymer: PDLGA-50 (Red (15-255), Green (10-255)),
PDLGA-65 (Red (35-255), Green (20-255)), PLLGA-50 (Red (25-255), Green (15-255)), poly
LG (Red (80-255), Green (50-255)), poly LracG (Red (75-255), Green (55-255)). .................. 140
Figure B8. Non-ratiometric two-photon microscopy images illustrating the failure morphologies
of sequenced and random PLGAs at specific time points. ......................................................... 141
Figure 9. Additional week 4 H&E staining images of subcutaneous tissue microparticle depot
injections from two different C57BL/6J wild-type mice (x25). Arrows indicate presence of
foreign body giant-cells. Scale bar = 100 μm. ............................................................................ 141
Figure B10. Scanning electron microscopy images (x550) of single-emulsion PDLGA-50 and
poly LG microparticles. These samples were injected subcutaneously to evaluate in vivo
inflammatory response. ............................................................................................................... 142
Figure C1. Synthesis of orthogonally protected lactic and glycolic acid building blocks, tert-
butyldiphenylsilyl protected alcohols (A) and benzyl protected carboxylic acids (B), and segmer
assembly polymerization methodology for sequenced poly(lactic-co-glycolic acid)s; poly LG
(C), poly LracG (D), poly GLLG (E), poly LLG (F). .................................................................. 143
Figure C2. 1H NMR (500 MHz, δ 9.0 – 0.0 ppm) of 50:50 poly(D,L-lactide-co-glycolide)
(PDLGA-50) ............................................................................................................................... 144

xxii
Figure C3. 13C NMR (500 MHz, δ 220 – -10.0 ppm) of 50:50 poly(D,L-lactide-co-glycolide)
(PDLGA-50). .............................................................................................................................. 145
Figure C4. 1H NMR (500 MHz, δ 9.0 – 0.0 ppm) of 65:35 poly(D,L-lactide-co-glycolide)
(PDLGA-65). .............................................................................................................................. 146
Figure C5. 13C NMR (500 MHz, δ 220 – -10.0 ppm) of 65:35 poly(D,L-lactide-co-glycolide)
(PDLGA-65). .............................................................................................................................. 147
Figure C6. 1H NMR (500 MHz, δ 9.0 – 0.0 ppm) of 50:50 poly(L-lactide-co-glycolide) (PLLGA-
50). .............................................................................................................................................. 148
Figure C7. 13C NMR (500 MHz, δ 220 – -10.0 ppm) of 50:50 poly(L-lactide-co-glycolide)
(PLLGA-50). ............................................................................................................................... 149
Figure C8. 1H NMR (500 MHz, δ 9.0 – 0.0 ppm) of poly LG. .................................................. 150
Figure C9. 13C NMR (500 MHz, δ 220 – -10.0 ppm) of poly LG. ............................................. 151
Figure C10. 1H NMR (500 MHz, δ 9.0 – 0.0 ppm) of poly LracG. ............................................. 152
Figure C11. 1C NMR (500 MHz, δ 220 – -10.0 ppm) of poly LracG. ......................................... 153
Figure C12. 1H NMR (500 MHz, δ 9.0 – 0.0 ppm) of poly LLG. .............................................. 154
Figure C13. 13C NMR (500 MHz, δ 220 – -10.0 ppm) of poly LLG.......................................... 155
Figure C14. 1H NMR (500 MHz, δ 9.0 – 0.0 ppm) of poly GLLG. ........................................... 156
Figure C15. 13C NMR (500 MHz, δ 220 – -10.0 ppm) of poly GLLG. ...................................... 157
Figure C16. Representative stress-strain curves for sequenced and random PLGAs acquired
during compression at a rate of 0.1 mm/min. ............................................................................. 158
Figure C17. Representative failure mechanism stress-strain curves for poly LG (brittle failure)
and poly GLLG (ductile failure) after 35 d in vitro acquired during compression at a rate of 0.1
mm/min. ...................................................................................................................................... 159

xxiii
Figure C18. 1H-NMR (500 MHz, CDCl3, δ 5.6 – 3.4 ppm) overlay of poly LG over the course of
63 days in vitro. The regions displayed correlate to the methine (δ 5.3 – 5.2 ppm) and methylene
(δ 4.9 – 4.6 ppm) proton resonances. .......................................................................................... 160
Figure C19. 1H-NMR (500 MHz, CDCl3, δ 1.8 – 1.3 ppm) overlay of poly LG over the course of
63 days in vitro. The region displayed correlates to the methyl proton resonance. .................... 161
Figure C20. 1H-NMR (500 MHz, CDCl3, δ 5.6 – 3.4 ppm) overlay of poly LracG over the course
of 63 days in vitro. The regions displayed correlate to the methine (δ 5.3 – 5.1 ppm) and
methylene (δ 4.9 – 4.6 ppm) proton resonances. ........................................................................ 162
Figure C21. 1H-NMR (500 MHz, CDCl3, δ 1.8 – 1.3 ppm) overlay of poly LracG over the course
of 63 days in vitro. The region displayed correlates to the methyl proton resonance. ............... 163
Figure C22. 1H-NMR (500 MHz, CDCl3, δ 5.6 – 3.4 ppm) overlay of poly GLLG over the course
of 63 days in vitro. The regions displayed correlate to the methine (δ 5.3 – 5.1 ppm) and
methylene (δ 4.9 – 4.6 ppm) proton resonances. ........................................................................ 164
Figure C23. 1H-NMR (500 MHz, CDCl3, δ 1.8 – 1.3 ppm) overlay of poly GLLG over the course
of 63 days in vitro. The region displayed correlates to the methyl proton resonance. ............... 165
Figure C24. 1H-NMR (500 MHz, CDCl3, δ 5.6 – 3.4 ppm) overlay of poly LLG over the course
of 63 days in vitro. The regions displayed correlate to the methine (δ 5.3 – 5.1 ppm) and
methylene (δ 4.9 – 4.6 ppm) proton resonances. ........................................................................ 166
Figure C25. 1H-NMR (500 MHz, CDCl3, δ 1.8 – 1.3 ppm) overlay of poly LLG over the course
of 63 days in vitro. The region displayed correlates to the methyl proton resonance. ............... 167
Figure C26. 1H-NMR (500 MHz, CDCl3, δ 5.6 – 3.4 ppm) overlay of 50:50 poly(D,L-lactide-co-
glycolide) (PDLGA-50) over the course of 42 days in vitro. The regions displayed correlate to
the methine (δ 5.3 – 5.1 ppm) and methylene (δ 4.9 – 4.5 ppm) proton resonances. ................. 168

xxiv
Figure C27. 1H-NMR (500 MHz, CDCl3, δ 1.8 – 1.3 ppm) overlay of 50:50 poly(D,L-lactide-co-
glycolide) (PDLGA-50) over the course of 42 days in vitro. The region displayed correlates to
the methyl proton resonance. ...................................................................................................... 169
Figure C28. 1H-NMR (500 MHz, CDCl3, δ 5.6 – 3.4 ppm) overlay of 50:50 poly(L-lactide-co-
glycolide) (PLLGA-50) over the course of 56 days in vitro. The regions displayed correlate to
the methine (δ 5.3 – 5.1 ppm) and methylene (δ 4.9 – 4.5 ppm) proton resonances. ................. 170
Figure C29. 1H-NMR (500 MHz, CDCl3, δ 1.8 – 1.3 ppm) overlay of 50:50 poly(L-lactide-co-
glycolide) (PLLGA-50) over the course of 56 days in vitro. The region displayed correlates to
the methyl proton resonance. ...................................................................................................... 171
Figure C30. 1H-NMR (500 MHz, CDCl3, δ 5.6 – 3.4 ppm) overlay of 65:35 poly(D,L-lactide-co-
glycolide) (PDLGA-65) over the course of 42 days in vitro. The regions displayed correlate to
the methine (δ 5.3 – 5.1 ppm) and methylene (δ 4.9 – 4.5 ppm) proton resonances. ................. 172
Figure C31. 1H-NMR (500 MHz, CDCl3, δ 1.8 – 1.3 ppm) overlay of 65:35 poly(D,L-lactide-co-
glycolide) (PDLGA-65) over the course of 42 days in vitro. The region displayed correlates to
the methyl proton resonance. ...................................................................................................... 173

xxv
LIST OF SCHEMES
Scheme 1. Synthesis of periodic PLGA copolymers using segmer assembly polymerization
(SAP) method along with random analogues synthesized by SAP and ring-opening
polymerization (ROP). .................................................................................................................. 25
xxvi
LIST OF EQUATIONS
Equation 1. .................................................................................................................................... 30
Equation 2. .................................................................................................................................... 33

xxvii
LIST OF ABBREVIATIONS
AcOH acetic acid
atm atmosphere
Bn benzyl protecting group
°C degrees Celsius
Ð dispersity (polymer chain dispersity)
Da dalton
DCC N,N’-dicyclohexylcarbodiimide
DIC N,N’-diisopropylcarbodiimide
DMAP 4-dimethylaminopyridine
DPTS 4-(Dimethylamino)pyridinium 4-toluenesulfonate
DSC Differential scanning calorimetry
EtOAc ethyl acetate
G glycolic acid monomeric unit
GPa gigapascal
GPC gel permeation chromatography
Hz hertz
kDa kilodalton
L (S)-lactic acid monomeric unit

xxviii
Lrac racemic lactic acid monomeric unit
M molar (moles per liter)
MALDI-ToF-MS matrix-assisted laser desorption/ionization time-of-flight
mass spectrometry
mg milligram
MHz megahertz
min minute
mL milliliter
Mn number average molecular weight
Mn(0) number average molecular weight at time = 0
Mn(t) number average molecular weight at time = t
mol mole
MPa megapascals
Mw weight average molecular weight
nm nanometer
NMR nuclear magnetic resonance spectroscopy
O/O oil/oil single-emulsion
PDLGA-50 50:50 poly(D,L-lactide-co-glycolide)
PDLGA-65 65:35 poly(D,L-lactide-co-glycolide)
PGA poly(glycolic acid)
PLA poly(lactic acid)
PLGA poly(lactic-co-glycolic acid)
PLGA (50/50) 50:50 poly(D,L-lactide-co-glycolide)

xxix
PLGA (70/30) 70:30 poly(D,L-lactide-co-glycolide)
PLGA (75/25) 75:25 poly(D,L-lactide-co-glycolide)
PLGA (80/20) 80:20 poly(D,L-lactide-co-glycolide)
PLGA (90/10) 90:10 poly(D,L-lactide-co-glycolide)
PLLGA-50 50:50 poly(L-lactide-co-glycolide)
ppm parts per million
ROP ring-opening polymerization
rt room temperature
Si tert-butyldiphenyl silyl protecting group
TBDPS tert-butyldiphenyl silyl protecting group
SAP segmer assembly polymerization
TBAF tetra-n-butylammonium fluoride
Tg glass transition temperature
THF tetrahydrofuran
Tm melting transition temperature
TPM two-photon microscopy
UCS ultimate compressive stress
W/O water/oil single-emulsion
W/O/W water/oil/water double-emulsion
XRD x-ray powder diffraction
χ Flory-Huggins parameter
δ chemical shift
λ wavelength
xxx
μL microliter
τ hydrolytic induction time period

xxxi
PREFACE
The work presented herein was conducted at the University of Pittsburgh. I was the lead
researcher whom was responsible for areas of concept formation, data collection and analysis, as
well as manuscript composition. Dr. Tara Y. Meyer was the supervisory author and primary
investigator on this project and was involved throughout the project in concept formation and
manuscript composition. The work presented within this thesis was funded by the National
Science Foundation (CHE-1410119).

xxxii
DEDICATION
To my parents and brother,
Carol S., Dale R., and Gregory A. Washington
grandparents,
Helen E. and Alphonse S. Gilius & Alma C. and Robert Washington
and fiancé,
Kasey E. Riddle
Without whom none of my success would be possible. Words cannot express how much your
love and support has meant to me throughout this journey.
“Your future hasn’t been written yet. No one’s has. Your future is whatever you make it, so
make it a good one.” – Emmett Brown

xxxiii
ACKNOWLEDGEMENTS
First, I would like to express my deepest gratitude to my advisor, Prof. Tara Y. Meyer for her
mentorship throughout my Ph.D. I was sincerely blessed to have had the opportunity to work
with such a patient, passionate, motivated, and dedicated advisor. Thank you to the members of
my thesis committee: Prof. Steven R. Little, Prof. Geoffrey R. Hutchison, and Prof. W. Seth
Horne for providing me with insightful comments, guidance, and positive encouragement.
I would like to extend my sincere thanks to Seton Hill University’s chemistry faculty:
Prof. John A. Cramer, Sr. Susan Yochum, Prof. Demetra Chengelis-Czegan, Prof. Diana Hoover,
and Prof. Tony Parker for believing in me and providing me with opportunities to grow as a
scientist throughout my collegiate career. To the late Dr. JoAnne W. Boyle, whose devotion to
learning and deep care and concern for my career was truly inspirational, thank you for making
your vision of Seton Hill a reality –“Hazard Yet Forward.” To all the past and present members
of the Meyer Group: Ryan M. Stayshich, Jian Li, Ryan M. Weiss, Amy L. Short, Jeffrey T.
Auletta, Shaopeng Zhang, Colin D. Ladd, Jamie A. Nowalk, Jordan H. Swisher, and Emily F.
Barker, thank you for the wonderful memories and continual support; we are forever a chemistry
family. Thank you to my undergraduates, Kerri R. Bell and Devin J. Swiner, who assisted with
portions of data acquisition reported in Chapter 2.
To my family, specifically Kristin N. Washington, Gary A. Riddle, Kimberly S. Riddle,
Ron P. Gilius, and Susan L. Gilius, thank you for your continual love and words of

xxxiv
encouragement. To my nephews, Bryce O. Washington and his new baby brother, Baby W.,
don’t be afraid to dream and always remember to do what you can’t.
I would like to sincerely thank our collaborators: Morgan V. Fedorchak, Steven R. Little,
Shilpa Sant, Simon C. Watkins, Yingfei Xu, Stephen C. Balmert, and Chong Liu for their helpful
guidance with manuscript composition and insightful comments. In addition, I would like to
thank the lab of Dr. Lei Li of the University of Pittsburgh, Department of Chemical & Petroleum
Engineering and the lab of Dr. Kevin Noonan, specifically Tyler Womble, of Carnegie Mellon
University, Department of Chemistry for assistance with instrumentation that was used for data
acquisition in Chapter 2. Thank you to the Center for Biologic Imaging of the University of
Pittsburgh, specifically Gregory Gibson for his assistance with the two-photon microscope,
Kevin Alber for data processing, and Julio Diaz-Perez of the Department of Dermatology,
University of Pittsburgh for the histological data analysis in Chapter 3.

1
1.0 INTRODUCTION
1.1 SIGNIFICANCE
Poly(lactic-co-glycolic acid) (PLGA) has emerged as the most investigated biodegradable
polymer over the past three decades due to its tunable release profiles, biocompatibility, and non-
toxicity.1 Additionally, unlike other biodegradable polymers, the U.S. Food and Drug
Administration (FDA) and European Medicine Association (EMA) have approved PLGA for
human use making it a strong candidate for biodegradable medical devices.2 Currently, 15
PLGA-based parenteral drug delivery systems are commercially available for treating various
ailments, such as prostate cancer, acromegaly, periodontitis, and malignant gliomas.3 Despite its
success in the aforementioned applications, PLGA-based technologies have made minimal
progress in clinical applications outside of controlled drug delivery. We hypothesize that the lack
of control over important characteristics, such as the rate of hydrolysis and retention of
mechanical properties, have limited PLGAs transition into other clinical applications.
Furthermore, we propose that sequence, an aspect of PLGA structure little explored prior to our
work, can be used to tune and improve the bulk properties of PLGAs.
Using a sequence-controlled polymerization method, segmer assembly polymerization
(SAP), a series of sequenced PLGAs were synthesized and compared to commonly used random
analogues with similar lactic (L) and glycolic (G) ratios to evaluate differences in swelling,

2
erosion, hydrophilicity, internal acidic distribution, in vivo inflammatory response, internal and
external morphology, mechanical properties, thermal properties, molecular weight distribution,
and end group formation rate as a function of degradation. This is the first comprehensive report
that compares the bulk properties of a set of novel sequence-defined PLGA copolymers to
random analogues.
1.2 SYNTHETIC METHODS AND MICROSTRUCTURAL CONTROL
Random poly(lactic-co-glycolic acid) (PLGA) is generally synthesized using one of two
synthetic pathways: 1) metal-catalyzed bulk ring-opening polymerization (ROP) of cyclic
diesters or 2) condensation of the α-hydroxy acids (Fig. 1).4-5 For ROP, the reaction is generally
catalyzed using tin(II) bis(2-ethylhexanoate) (Sn(Oct)2), which despite the known toxicity of tin,
has been accepted by the FDA as “generally recognized as safe (GRAS).” This approach
routinely produces high-molecular-weight polymers (105 – 106 Da) that are suitable for
biomedical applications. In contrast, polycondensation of the α-hydroxy acids generally yields
low-molecular-weight copolymers (102 – 103 Da) unless coupled to an azeotropic dehydration
strategy.6

3
Long-blocks Tapered-blocks Alternating
Figure 1. Ring-opening and condensation polymerizations produce random poly(lactic-co-glycolic acid)s with
various microstructures.
Although ROP has been successfully utilized to make high-molecular weight PLGAs,
transesterification processes can occur in parallel. Under concentrated and bulk conditions in
conjunction with high temperature and long reaction times, polyesters readily undergo intra- and
inter-molecular transesterification side-reactions. Using 1H and 13C NMR, Hu and coworkers
monitored microstructural changes in PLGA copolymers comprising L-lactic (LS) and glycolic
acid (G) units and observed a decrease in LS and G block lengths and concomitant racemization
of LS units with increasing reaction time.7 Similar results were observed by Kasperczyk and
coworkers in monitoring the appearance of transesterification induced LGL signals via 1H and
13C NMR.8-9 These detrimental sequence scrambling side-reactions and differing monomeric
reactivity ratios make batch-to-batch reproducibility of PLGA nearly impossible and result in
limited control over properties.
Interestingly, the homopolymer, poly(lactic acid) (PLA), can be synthesized with a high
degree of stereoselectivity and reproducibility.4, 10-12 Similar to PLGA, high-molecular-weight
PLAs are traditionally synthesized using ROP of lactide. Various diastereomers of lactide can be
prepared (i.e., L-lactide, D-lactide, meso-lactide, or rac-lactide) using a polycondensation-

4
depolymerization strategy of the chiral lactic acid. Stereochemically tailored PLAs of varying
tacticity can be prepared (e.g., atactic, heterotactic, isotactic, isotactic stereoblock, and
syndiotactic) depending on the identity of the input lactide monomer(s) and metal catalyst (Fig.
2A).13-15 Coates, Spassky and coworkers have made significant progress in developing a library
of stereoselective catalysts for tailoring the tacticity of lactide using ROP.14, 16-19 These catalysts
consist of transition, rare-earth, or main group metal coordination complexes that offer superior
control over tacticity and limit transesterification and epimerization side-reactions. Importantly,
stereochemical control is lost when ROP is performed on mixtures of lactide and glycolide
monomers and no control of the sequences of G and L units is achieved. 20 The higher reactivity
and achirality of glycolide significantly limits the microstructural diversity of PLGA to random
copolymers with long G-block and short atactic or isotactic L-blocks (Fig. 2B). The only
sequenced PLGA copolymer that can be prepared by ROP is the simple alternating (LG)n
sequence. Dong et al., recently synthesized atactic alternating PLGA from a single monomer,
D,L-3-methyl glycolide.21 Overall, it is not possible to use ROP to create complex L- and G-
sequences.
Figure 2. Microstructural variants of (A) poly(lactide) and (B) poly(lactide-co-glycolide) using metal-mediated
ring-opening polymerizations.

5
1.3 MICROSTRUCTURE – PROPERTY RELATIONSHIPS
Although sequence exploration in PLA and PLGA has been limited as described in the previous
section, there is evidence in the literature that suggests that controlling the microstructure of PLA
and PLGA copolymers offers specific advantages for tailoring various thermophysical and
physicochemical properties. For example, thermal properties, such as glass transition
temperature (Tg), melting temperature (Tm), and crystallinity, largely depend on the monomer-
and stereo-sequence of the copolymer. The thermal properties for PLAs vary based only on
tacticity; isotactic and syndiotactic are semi-crystalline with Tms of 175 and 155 °C, respectively,
whereas heterotactic and atactic are amorphous.22 The Tgs for PLAs tend to decrease as
stereoregularity decreases. Contrary to PLA, the thermal properties of PLGA are largely affected
by the lactic acid (L) to glycolic acid (G) ratio. Gilding and Reed evaluated a set of poly(L-
lactide-co-glycolide)s and determined that PLGAs with an L-content > 80% were semi-
crystalline with Tms of 185 °C (100%), 165 °C (90 %), and 120 °C (80%) and Tgs ~55 – 60 °C;
all other PLGAs were amorphous with Tgs ~50 – 55 °C.23
The mechanical properties of PLA and PLGA have also been shown to depend on stereo-
and structural sequence, again limited to the example sequences that can be prepared by ROP.
PLA (specifically isotactic PLA) is preferred over PLGA for load bearing applications due to its
osteo-similar and superior mechanical properties and cell adhesion compatability.24-27 Isotactic
PLA has a higher mechanical strength than amorphous atactic PLA, 2.7 and 1.9 GPa,
respectively, due to its semi-crystalline thermal properties. Mechanical strengths similar to
atactic PLA have been reported for semi-crystalline PLGAs with L-contents > 82%; however,
mechanical properties are retained over significantly shorter time periods compared to PLAs.
Decreasing the L-content below 80% results in lower mechanical strengths and shorter property

6
retention time periods. PLGAs are only utilized in short-term low-load bearing devices, such as
craniomaxillofacial plates, pins and staples and bioresorbable sutures and suture anchors, for
these reasons.28
It has been reported that the degradation behaviors of PLA and PLGA are drastically
different despite having similar thermophysical properties (Fig. 3).28 PLA stereovariants
typically degrade of the course of 20 – 24 months with isotactic PLA having the slowest
degradation rate.26 However, decreasing the L-content in isotactic random PLGA to 85% results
in a 4-fold decrease in degradation time, (i.e., 5 – 6 months). Shorter degradation time periods of
4 – 5 months and 1 – 2 months are typical for PLGA (75/25) and PLGA (50/50), respectively.
For PLGAs, not surprisingly, degradation is found to depend strongly on the L:G
composition of the copolymer. Controlling the input monomer ratio is the most common method
for adjusting the hydrolytic rates of PLGAs. For example, in a microparticle degradation study
conducted by Park, PLGA (50/50) and PLGA (70/30) microspheres degraded faster than
microspheres composed of PLGA (80/20) and PLGA (90/10). There were no significant
differences in molecular weight in this case, leading to the conclusion that the differences in
hydrolysis rates for specific linkage types (i.e., G-G > L-G & G-L > L-L) led to the variations in
degradation behavior.29 Although sequence control is limited in these systems, studies that
compare random copolymers with differing L- and G-block lengths suggest that the exploration
of sequence could prove fruitful.30-31

7
0
5
10
15
20
De
gra
dati
on
Tim
e (
mo
nth
s)
100 0Glycolic acid-content
0 100Lactic acid-content
Copolymer Ratio
Poly(glycolic acid)
Poly(lactic acid)
Figure 3. Degradation times for various copolymers of lactic and glycolic acid including the homopolymers. Image
adapted from “Synthetic biodegradable polymers as orthopedic devices,” by J.C. Middleton, 2000, Biomaterials, 21,
2338. Copyright 2000 Elsevier Science Ltd. Adapted with permission.
1.4 STRATEGIES FOR SEQUENCE – CONTROLLED POLYMERS: BIOLOGICAL
AND SYNTHETIC
The importance of sequence can be seen in Nature where monomer sequence regulation
strategies are readily employed to control the structure, properties, and dynamic functions of
biomacromolecules. The diverse needs of all living organisms are fundamentally satisfied by the
molecular framework of deoxyribonucleic acid (DNA). The nucleotide sequence within the
backbone of DNA encodes information that is translated into instructions for assembling
complex biopolymers, such as polypeptides and proteins.32 These biopolymers adopt unique
three-dimensional structures to accomplish various biological tasks based on the amino acid

8
sequences. Mimicking the dynamic abilities of these biopolymers with a sequenced copolymer is
particularly attractive from a synthetic point-of-view; however, our current synthetic approaches
for producing sequence-regulated copolymers are underdeveloped.
Sequence-regulated polymerization processes, chain-growth and step-growth, are
currently used to produce a variety of sequenced microstructures.33-36 Chain-growth living
radical and ring-opening polymerization methods, such as atom transfer radical polymerization
(ATRP),37 reversible addition/fragmentation chain transfer polymerization (RAFT),38 nitroxide-
mediated polymerization (NMP),39 and ring-opening metathesis polymerization (ROMP),40 have
been used to synthesize short sequenced-defined repeats within block, alternating, and gradient
copolymers (Fig. 4). These polymerization methods are synthetically practical, accommodate an
array of monomers, and offer control over molecular weight distribution (Ð ≈ 1.05). The
precision of the repeat-unit sequence is mechanistically limited due to instantaneous and
continuous propagation of monomer, making iterative single monomer propagations difficult.41
Controlled radical chain-growth polymerization methods excel in controlling polymer topology
(e.g., cyclic, linear, star, graft or brush, dendrimer, hyperbranched, networks) despite having
chain composition limitations. Using ATRP, Matyjaszewski and coworkers have led the charge
in synthesizing and characterizing the properties of these complex architectures.42-43

9
Syn
theti
cB
iolo
gic
al
DNA & RNA
CTA ATG AAC TCC TGAA AG
GAU UAC UUG AGG ACUU UC
Random
Peptides &
Proteins
MVS LPD AKV NKA AWGV KG
Imp
roved
Seq
uen
ce S
ele
cti
vit
y
Chain
-gro
wth Block
Gradient
Alternating
Mo
re P
racti
cal
Repeat Unit
001 111 000 111 0101 00
Periodic
Encoded
Ste
p-g
row
th
Figure 4. Progress in synthetic polymerization methods towards achieving architectures similar to those produced
by biological systems.
Levels of microstructural control similar to biological systems may only be achieved
using step-growth polymerizations.44-46 Unlike the previously mentioned chain-growth processes,
which rely on radical or transition metal mediated propagation mechanisms, step-growth
polymerization methods utilize reactive AB or AA + BB type monomers. These monomers are
sequentially coupled using a one-pot synthetic approach or solid support synthetic approach in
which orthogonal chemistries, such as copper-catalyzed azide-alkyne cycloaddition (CuAAC),47
thiol-ene,48 Passerini,49 and esterification50 reactions, are utilized to produce periodic and
encoded microstructures. Monodisperse precision polymers (Ð = 1.01 – 1.08) can be obtained
using the linear iterative solid support synthetic method; however, the production of high
molecular weight polymers requires numerous couplings-purification iterations and high reaction

10
yields.35, 51 The most complex sequenced macromolecules have been synthesized by Lutz and
coworkers52-53 and Börner and coworkers54 using solid-phase methods. Alternating and periodic
architectures are accessible using solid support methods; however, the more practical one-pot
approach has been utilized on gram scales by Meyer and coworkers55 and Joy and coworkers56-57
yielding polymers of high molecular weight.
1.4.1 Segmer Assembly Polymerization: Tailor-Made Sequences
Although recent progress has been made with controlling sequence in polymers, few studies have
produced a significant family of sequenced polymers based on a specific group of monomers.
The Meyer group, in contrast, has developed a step-growth polymerization method, segmer
assembly polymerization (SAP), which has been utilized to produce more than 30 periodic
copolymers.55 This method offers superior control over monomeric sequence compared to
traditional condensation methods (Fig. 5). Using the SAP methodology, sequenced (AmBn)x
copolymers are prepared using discrete monodisperse repeat units, termed “segmers.” Each
segmer is assembled using orthogonally protected building blocks that are coupled using
traditional esterification chemistry. A and B sequences of modest length (m + n = 2 – 7) may be
produced using an iterative divergent-convergent strategy consisting of sequential coupling-
deprotection reactions. The segmers are then polymerized using optimized condensation
conditions to yield periodic repeat sequences within the polymer backbone.

11
X Y
X or Y
X Y X Yor
Segmer Condensation
Polymerization
Repeat Unit
Periodically sequenced copolymerX or Y
Random copolymer
Condensation
Polymerization
mn +
A
B
Figure 5. Comparison of segmer assembly polymerization methodology (A) and traditional condensation
polymerizations (B) for preparing binary copolymers. Here, X and Y represent orthogonal protecting groups.
Various pilot experiments were conducted by the Meyer group using SAP in which
sequenced copolymer variants of commonly used biodegradable copolymers were synthesized.
Stayshich et al.,55 synthesized a library of periodic copolymers comprising L-, D-, and rac- lactic
acid and glycolic acid units with molecular weights of 14 – 40 kDa. Meyer and coworkers
expanded the aforementioned polyester family by including caprolactic acid units and (S)-3-
benzyloxy-2-hydroxypropionic acids in periodic copolymers where molecular weights ranged
from 18 – 49 kDa and 17 – 48 kDa, respectively.58-59 These model systems illustrated the
synthetic versatility and precision of SAP, but most importantly demonstrated that a family of
sequenced copolymers with similar molecular weights can be routinely produced.
1.5 EXPLOITING SEQUENCE TO CONTROL PROPERTIES
Portions of the background discussed in this section were previously published in “J.H. Swisher,
J.A. Nowalk, M.A. Washington, T.Y. Meyer “1. Properties and Applications of Sequence-
Controlled Polymers” and “J. Li, M.A. Washington, K.L. Bell, R.M. Weiss, S.M. Rothstein, S.R.

12
Little, H.M. Edenborn, T.Y. Meyer “Chapter 18. Engineering Hydrolytic Degradation Behavior
of Poly(lactic-co-glycolic acid) through Precise Control of Monomer Sequence” Sequence-
Controlled Polymers: Synthesis, Self-Assembly, and Properties. American Chemical Society:
2014; Vol. 1170, p 271-286.
The Meyer group has previously reported sequence-based property correlations for
PLGAs and PLGCAs (C = caprolactic unit; 6-hydroxyhexanoic acid). For binary copolymers in
which the composition was allowed to vary, as is the case with the series of polymers with
repeating units of LLLLC, LLLC, LLC, LLCLC, LLCCLC, and CLC, the Tgs were found to
closely adhere to the predictions of the Fox equation.58 However, when ternary copolymers with
identical compositions but different sequences were compared, poly GLC vs. poly LGC, a
difference of nearly 8 ºC was observed. The tendency towards crystallization and the Tm was
found to be very sensitive to sequence. In the pair described above, poly GLC was semi-
crystalline with a Tm = 37.7 ºC while poly LGC remained amorphous. Stereosequence also
affected the crystallinity in a significant fashion. The isotactic poly LSLSG, for example, is slow
to crystallize (Tm = 114 ºC) whereas both poly LSLRG and poly LRLSG crystallize easily and
exhibit a higher Tm (~ 155 ºC for both).55
The most dramatic sequence based behavior for PLGAs occurs, however, during
hydrolytic degradation. Behaviors that were by monitored by Meyer and coworkers during
degradation included molecular weight, lactic acid release, and rhodamine B release.60-61 All
were found to have a dramatic dependence on sequence. Molecular weight, for example, drops
exponentially for random PLGA controls, while the molecular weight of sequenced materials
with similar compositions decrease gradually. In addition, the molecular weight profile of 50:50
poly(D,L-lactide-co-glycolide) (PDLGA-50) broadened and became distinctly polymodal over

13
the course of degradation while the profiles of sequenced PLGAs exhibited only slight
broadening over the same time period. Lactic acid release was also sequence dependent, with the
random copolymers exhibiting rapid release of lactic acid while all other sequenced samples
were significantly slower. The lactic acid release of sequenced PLGAs followed in accordance
with the aforementioned hydrolysis rate hierarchy; poly GLG > poly LracG > poly LG > poly
LracLG > poly LLG. Meyer and coworkers have also discovered that both guest molecule
loading efficiencies and in vitro release rates depend on sequence. When rhodamine B dye was
loaded into microparticles prepared from both PDLGA-50 and poly LG, the random copolymer
consistently exhibited higher maximum loading efficiencies. When exposed to physiological
conditions, however, the dye was more gradually released from the sequenced copolymer, poly
LG, compared to the random PDLGA-50 copolymer.
1.6 THESIS OVERVIEW
Meyer and coworkers have demonstrated that monomer- and stereo-sequence strongly influence
the degradation properties of PLGA; sequence-defined PLGAs hydrolyze slower and more
uniformly compared to random analogues (Fig. 6). The overall objective of the current work is to
expand upon these findings and improve our understanding of how monomer-by-momoner
sequence affects the bulk properties of PLGA using matrices, which are commonly used in
biomedical applications (e.g, solid implants and microparticles). We hypothesize that matrices
fabricated with sequence-defined PLGAs will be able to retain a bulk property of interest over
longer time periods compared to random PLGA analogues due to their more homogenous
degradation profiles.

14
0
4
8
12
16
20
24
De
gra
da
tio
n T
ime
(m
on
ths
)
100 0poly(glycolide)
0 100poly(lactide)
Copolymer Ratio
Segmer-based PLGAs (SAP)
Random PLGAs (ROP)
poly LG
poly LracGpoly GLLG
poly GLG
poly LracLG
poly LLG
Glycolic acid-content
Lactic acid-content
Figure 6. Deviations from typical random PLGA degradation times for various sequence-defined PLGAs. Here, the
gray space between the two curves represents the accessible degradation times for sequenced PLGAs.
In Chapter 2 of this dissertation, a comprehensive examination of the swelling and
erosion behaviors of sequence-defined and random PLGA solid cylindrical matrices (3 mm x 3
mm and 3 mm x 1.5 mm) as a function of degradation time are reported. The goal of this study
was to monitor the in vitro degradation behavior of sequence-defined PLGAs over 8-week
(swelling) and 20-week (erosion) time periods to determine if the erosion mechanism of
sequence-defined PLGAs align more closely with a bulk or surface erosion mechanism; random
PLGAs erode via a bulk mechanism.
In Chapter 3 we focus on expanding our understanding of the degradation behaviors of
sequence-defined PLGAs by monitoring the evolution and release of acidic by-products from
PLGA microparticles, ~200 μm and ~30 μm, which has been considered a most serious
drawback for PLGA-based drug delivery systems. An innovative two-photon microscopy

15
method was utilized to map the in vitro internal acidic microclimate pH of sequence-defined and
random PLGA analogues over an 8-week time period. In addition, the release of acidic by-
product was qualitatively analyzed using subcutaneous microparticle injections in mice, where
the foreign body response was evaluated 2- and 4-weeks post-injection. This is the first report in
which a sequence-defined PLGA copolymer was utilized in vivo.
In Chapter 4 we focus on determining how monomer sequence affects the retention of
mechanical properties for solid cylindrical matrices, 3 mm x 3 mm. In this study, the
microstructural and macroscopic bulk properties of a series of sequence-defined and random
PLGAs were monitored in vitro over a 9-week time period. The results of this study provide
valuable insights into the preferential hydrolysis mechanism for sequence-defined PLGAs.

16
2.0 THE IMPACT OF MONOMER SEQUENCE AND STEREOCHEMISTRY ON
THE SWELLING AND EROSION OF BIODEGRADABLE POLY(LACTIC-CO-
GLYCOLIC ACID) MATRICES
2.1 OVERVIEW
This work presented in this chapter describes the mechanism of swelling and erosion for
sequenced and random poly(lactic-co-glycolic acid)s. This chapter has been previously published
and is summarized in Fig. 7.62
% S
we
llin
g
% M
as
s L
os
s
Swelling Erosion
Time Time
Sequenced PLGA
Figure 7. Graphical abstract for Chapter 2 – The impact of monomer sequence and stereochemistry on the swelling
and erosion of biodegradable poly(lactic-co-glycolic acid) matrices.

17
Monomer sequence is demonstrated to be a primary factor in determining the hydrolytic
degradation profile of poly(lactic-co-glycolic acid)s (PLGAs). Although many approaches have
been used to tune the degradation of PLGAs, little effort has been expended in exploring the
sequence-control strategy exploited by nature in biopolymers. Cylindrical matrices and films
prepared from a series of sequenced and random PLGAs were subjected to hydrolysis in a pH
7.4 buffer at 37 °C. Swelling ranged from 107% for the random racemic PLGA with a 50:50
ratio of lactic (L) to glycolic (G) units to 6% for the sequenced alternating copolymer poly LG.
Erosion followed an inverse trend with the random 50:50 PLGA showing an erosion half-life of
3-4 weeks while poly LG required ca. >10 weeks. Stereosequence was found to play a large role
in determining swelling and erosion; stereopure analogues swelled less and were slower to lose
mass. Molecular weight loss followed similar trends and increases in dispersity correlated with
the onset of significant swelling. The relative proportion of rapidly cleavable G-G linkages
relative to G-L/L-G (moderate) and L-L (slow) correlates strongly with the degree of swelling
observed and the rate of erosion. The dramatic sequence-dependent variation in swelling, in the
absence of a parallel hydrophilicity trend, suggest that osmotic pressure, driven by the
differential accumulation of degradation products, plays an important role.
2.2 INTRODUCTION
We have discovered that sequence can be used to control the degradation behavior of poly(lactic-
co-glycolic acid)s (PLGAs). Random PLGAs have been utilized extensively in controlled drug
delivery systems and clinical applications due to their biocompatibility, biodegradability, and
regulatory acceptance. Target applications include controlled release devices for anticancer

18
agents,63-65 surgical sutures and screws,1, 66 and porous scaffolds for tissue regeneration.67
Despite the number of literature reports on the utility of PLGAs for bioengineering, however,
there are currently only 15 FDA-approved PLA/PLGA-based drug products on the US market.68
We hypothesize that one contributing factor to the poor translation into application is the
relatively narrow range of performance of the random copolymer PLGAs during degradation, a
deficiency that has been addressed by others with a variety of strategies including adjusting
molecular weight, controlling ratio of lactic (L) and glycolic (G) units; tuning average L and G
block lengths, adding comonomers and chemical additives, and through the design and
configuration of devices.69-70
Our approach to expanding the accessible range of degradation profiles is to move
beyond random copolymers through the control the sequence of the monomers, an approach
which in biological polymers has been shown to provide diverse structure and function from a
limited monomer set. The potential for impact of this approach is further supported by the recent
promising reports of sequence control in other synthetic copolymers 34-35, 45-46, 58-59, 71-73 and by
intriguing studies by Sarasua et al., that link properties with statistical variations in chain
microstructure for selected biopolyesters.74-79
To probe the relationship between monomer order and properties, we have developed a
synthetic route that yields PLGAs with repeating sequences.55 For example, we have prepared
poly LG, which consists of an exact repeat of the LG dimer for the length of the polymer (i.e.,
(LG)n). Similarly, we have been able to prepare a variety of polymers bearing periodic repeats of
varying lengths (e.g., (LLG)n, (GLLG)n, etc…). Using NMR spectroscopy, which is uniquely
powerful for the characterization of this particular class of polymer due to solution phase
conformational preferences, the periodic structure of these polymers has been confirmed.

19
Moreover, sequence errors are easily detected and can be quantified.55 The ability to both
synthesize exact sequences and verify them enables, for the first time, a thorough exploration of
structure and function in PLGAs.
In initial properties studies of this new class of periodic PLGAs 60-61 we have found a
surprisingly strong correlation between sequence and properties. In microparticles prepared from
these copolymers, we observed a correlation of sequence with molecular weight loss, lactic acid
release, and thermal properties. In general, the sequenced PLGAs exhibited a slower and more
gradual loss of molecular weight and a longer preservation of morphology, including Tg, than the
random analogues. Differences were also observed between sequences, both structural- and
stereoisomers. The release of an encapsulated guest molecule, rhodamine B, was also studied and
found to depend directly on monomer order; the simple alternating copolymer poly LG released
the guest more slowly and gradually than did the random PLGA control.
Based on these results, we hypothesize that sequenced PLGAs may have positive
implications for bioengineering applications where prolonged delivery times and/or structural
integrity are particularly important. For example, a longer release time would be beneficial for
long-lasting intraocular implants. These implants, which are designed to replace eye drop
regimens, which have low patient compliance, allow for continuous drug release.80 We also
expect that the slower degradation of the sequenced PLGAs will minimize the accumulation of
pH-lowering acidic by-products compared to random PLGAs. This behavior could provide a
protective effect for tissues such the retina, which is known to be particularly sensitive to non-
physiological pH.81 The improved maintenance of morphology for the sequenced PLGAs could
also offer advantages for certain applications (e.g., the repair of craniofacial bony defects) which
20
require longer term mechanical strength during the delivery of critical osteogenic growth
factors.82
Swelling and erosion are deeply relevant to these application goals and their study should
also lend insight into any sequence-based differences in the underlying mechanism of erosion. It
has been previously reported and substantiated by numerous studies that matrices of random
PLGAs below certain dimensions degrade by bulk erosion.83-84 Observable behaviors associated
with this mechanism include, in most cases, significant swelling and a rapid loss of mass after an
initial latent period. At the other end of the continuum lie materials that decompose by surface
erosion. These materials (e.g., polyanhydrides) degrade without significant water uptake and
mass loss is gradual as the inner layers only begin to degrade as the outer layers are sequentially
hydrolyzed.85-89 This distinction is particularly important for the use of PLGA in drug delivery,
as it is expected and has been observed that the release profile of encapsulated drugs depends on
swelling and erosion.90 Herein, we examine the swelling and erosion of sequenced PLGAs to
determine, in part, whether their degradation behavior aligns more closely with a bulk or surface
mechanism.
2.3 MATERIALS AND METHODS
2.3.1 Materials
Periodic PLGA copolymers were prepared as previously described.55, 91 Poly(D,L-lactide-co-
glycolide) with a 50:50 ratio of lactic to glycolic acid-derived units and carboxylate end groups
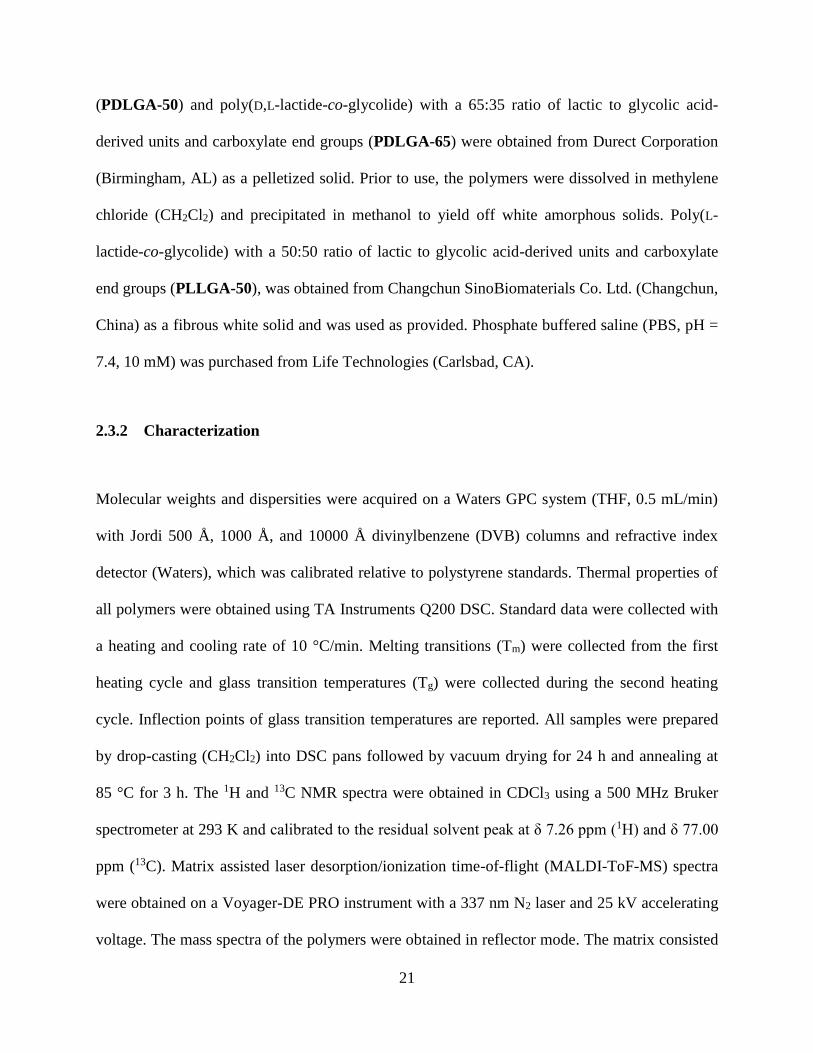
21
(PDLGA-50) and poly(D,L-lactide-co-glycolide) with a 65:35 ratio of lactic to glycolic acid-
derived units and carboxylate end groups (PDLGA-65) were obtained from Durect Corporation
(Birmingham, AL) as a pelletized solid. Prior to use, the polymers were dissolved in methylene
chloride (CH2Cl2) and precipitated in methanol to yield off white amorphous solids. Poly(L-
lactide-co-glycolide) with a 50:50 ratio of lactic to glycolic acid-derived units and carboxylate
end groups (PLLGA-50), was obtained from Changchun SinoBiomaterials Co. Ltd. (Changchun,
China) as a fibrous white solid and was used as provided. Phosphate buffered saline (PBS, pH =
7.4, 10 mM) was purchased from Life Technologies (Carlsbad, CA).
2.3.2 Characterization
Molecular weights and dispersities were acquired on a Waters GPC system (THF, 0.5 mL/min)
with Jordi 500 Å, 1000 Å, and 10000 Å divinylbenzene (DVB) columns and refractive index
detector (Waters), which was calibrated relative to polystyrene standards. Thermal properties of
all polymers were obtained using TA Instruments Q200 DSC. Standard data were collected with
a heating and cooling rate of 10 °C/min. Melting transitions (Tm) were collected from the first
heating cycle and glass transition temperatures (Tg) were collected during the second heating
cycle. Inflection points of glass transition temperatures are reported. All samples were prepared
by drop-casting (CH2Cl2) into DSC pans followed by vacuum drying for 24 h and annealing at
85 °C for 3 h. The 1H and 13C NMR spectra were obtained in CDCl3 using a 500 MHz Bruker
spectrometer at 293 K and calibrated to the residual solvent peak at δ 7.26 ppm (1H) and δ 77.00
ppm (13C). Matrix assisted laser desorption/ionization time-of-flight (MALDI-ToF-MS) spectra
were obtained on a Voyager-DE PRO instrument with a 337 nm N2 laser and 25 kV accelerating
voltage. The mass spectra of the polymers were obtained in reflector mode. The matrix consisted

22
of trans-2-[3-(4-t-butyl-phenyl)-2-methyl-2-propenylidene]malononitrile (DCTB) and sodium
trifluoroacetate as the cationization agent.
2.3.3 Preparation of cylindrical-shaped pellets
Cylindrical-shaped pellets of all PLGAs were prepared by heated compression molding in a
custom press. The colorless polymer (20-30 mg) was loaded into the press that was warmed to
85-95 °C and compressed with a 1,200-1,400 lb load for 10 min using a Carver press (Hydraulic
unit model #3912; Wabash, IN). The press and sample were then re-heated for 10 min in an oven
at 85 °C, and compressed again for 5 min under the same temperature and load. The resulting
pellets were opaque or translucent depending on the polymer used and had dimensions of 3 x 3
mm (swelling) or 3 x 1.5 mm (erosion), corresponding to a weight of ~26 mg and ~15 mg,
respectively.
2.3.4 In vitro swelling of sequenced and random PLGAs
Two samples of each polymer (26 mg each) were placed in separate Eppendorf tubes containing
2 mL of PBS. All tubes were incubated at 37 °C on a rotating mixer (8 rpm). Samples were
removed every 2 d for the first 10 d, then weekly depending on the degree of swelling. Both
PDLGA-50 and PLLGA-50 were removed every 2 d until sample degradation progressed to the
point that the remaining material could not be handled or weighed. Each sample was blotted dry
for 30 s and weighed on an analytical balance (± 1.0 x 10⁻⁴ g) until a stable reading was
displayed for 15 s. The phosphate buffer was replaced each week for the entirety of the study.

23
2.3.5 In vitro erosion of sequenced and random PLGAs
Ten samples of each polymer (15 mg each) were placed in separate Eppendorf tubes containing 2
mL of PBS. Samples of each polymer were then divided into 5 groups of 2 samples, each to
determine the mass loss at 5 different time intervals. All tubes were incubated at 37 °C on a
rotating mixer (8 rpm). The tubes were refilled with fresh PBS (2 mL) every week. At each time
point, duplicate samples of each polymer were collected, blotted dry for 15 s, flash-frozen in
liquid N2, then lyophilized for 2 d. After freeze-drying, the pellets were weighed on an analytical
balance (± 1.0 x 10⁻⁴ g). Masses were recorded once a stable reading was displayed for 15 s.
2.3.6 Water contact angle experiments
Water contact angle measurements were recorded using a VCA optima XE video contact angle
system at 24 °C and 42-48% relative humidity. A droplet with a volume of 1 μL was formed at
the end of the needle and then lowered carefully until contact was made with the sample. The
needle was withdrawn immediately so that the droplet was left on the sample surface. An image
of the droplet was acquired with a charge-coupled device (CCD) camera 5 s after contact with
the surface of the film. The static contact angle was calculated automatically by the VCA
software. Approximately 45 s was required to complete the whole measurement process. Each
measurement was repeated 5x per sample at different locations.
Films of all PLGAs were prepared using a drawdown coating method. Each of the
copolymer samples was dissolved in dichloromethane at a concentration of 250 mg/mL. A 20-30
µm film was deposited on a glass microscope slide using a 180-200 µL aliquot of the polymer
solution. The resulting film was dried in an oven at 70 °C for 1 h and stored in a vacuum

24
desiccator until used. Samples were exposed to PBS at 23 °C and the hydrated contact angle was
monitored over an 8 d time period. After the hydrated water contact angle was recorded, the
films were flash-frozen in liquid N2, lyophilized for 3 d, and the lyophilized film contact angle
was determined using the same method.
2.4 RESULTS
2.4.1 Naming conventions and characterization of PLGA copolymers
The L-lactic unit, racemic lactic unit, and glycolic unit are abbreviated as L, Lrac, and G,
respectively. The periodic copolymers utilized in this study were prepared using segmer
assembly polymerization (SAP). In this method, we prepare well-defined oligomers and
polymerize them using condensation conditions that have been optimized to preclude sequence
scrambling by transesterification (Fig. A1). The resulting copolymers are termed periodic
copolymers because they consist of a nearly perfect repetition of the input segmer. As such, a
segmer consisting of a lactic and glycolic acid-derived unit, would be termed LG and the
polymer would be named poly LG (Scheme 1). The SAP method was also used to prepare a
random copolymer, R-SAP, by condensation of a 1:1:1:1 ratio of the segmers LG, GL, LL and
GG. The random copolymers, PLLGA-50, PDLGA-50 and PDLGA-65, prepared by ring-
opening polymerization (ROP) of lactide and glycolide, were purchased. In this case, the
PLLGA-50 and PDLGA-50 are the stereopure and racemic versions of the copolymers with a
50:50 L:G-ratio and PDLGA-65 is the racemic derivative of a copolymer with a 65:35 L:G-ratio.
Sequenced copolymers prepared by SAP range in molecular weight from 18 to 30 kDa and are

25
comparable to purchased random PLGA controls (Table 1, Fig. A2). All polymers exhibited Tgs
in the range of 44 to 49 °C (Table 1, Fig. A3).
PDLGA-50
R-SAP
- Stereopure lactic acid units
- Shorter L- and G-blocks
- Racemic lactic acid units
- Longer L- and G-blocks
Scheme 1. Synthesis of periodic PLGA copolymers using segmer assembly polymerization (SAP) method along
with random analogues synthesized by SAP and ring-opening polymerization (ROP).
Table 1. Characterization data for sequence-defined and random PLGAs utilized in swelling and erosion studies.
Polymer Mna (kDa) Mw
a (kDa) Đa Tg (°C)b ratio L:Gc
Poly LG 23.5 30.0 1.3 44 50:50
Poly LracG 30.8 44.4 1.4 49 50:50
Poly GLG 21.6 28.3 1.3 45 34:66

26
Poly GLLG 18.7 25.1 1.3 45 50:50
R-SAP 24.1 33.3 1.4 46 44:56
PDLGA-50 30.7 38.4 1.3 48 51:49
PLLGA-50 23.9 38.8 1.6 47 54:46
PDLGA-65 28.3 39.2 1.4 47 65:35
a Determined by size exclusion chromatography in THF relative to polystyrene
standards. b Obtained in the second heating cycle at 10 °C/min. c Results based on 1H NMR spectroscopy and presented as the ratio of the lactic (L)
and glycolic (G) units.
2.4.2 Characterization
The copolymers were characterized by 1H NMR, 13C NMR, and MALDI-ToF mass spectrometry
(Figs. 8, 9, A4 – A22). As we have previously described in detail the assignment of 1H and 13C
NMR spectra of these polymers,55 we will comment on only few key features. Most importantly,
we note that these sequenced copolymer exhibit unusually sharp and well-resolved 1H NMR
peaks, even for high molecular weight samples. These copolymers have strong sequence-based
conformational preferences, which result in unique and assignable resonances for each variant.
The diastereotopic glycolyl protons are particularly useful in the 1H NMR spectrum. The
combination of clear sequence based differences in chemical shift, along with high resolution
means sequence mistakes are readily identifiable and quantifiable.
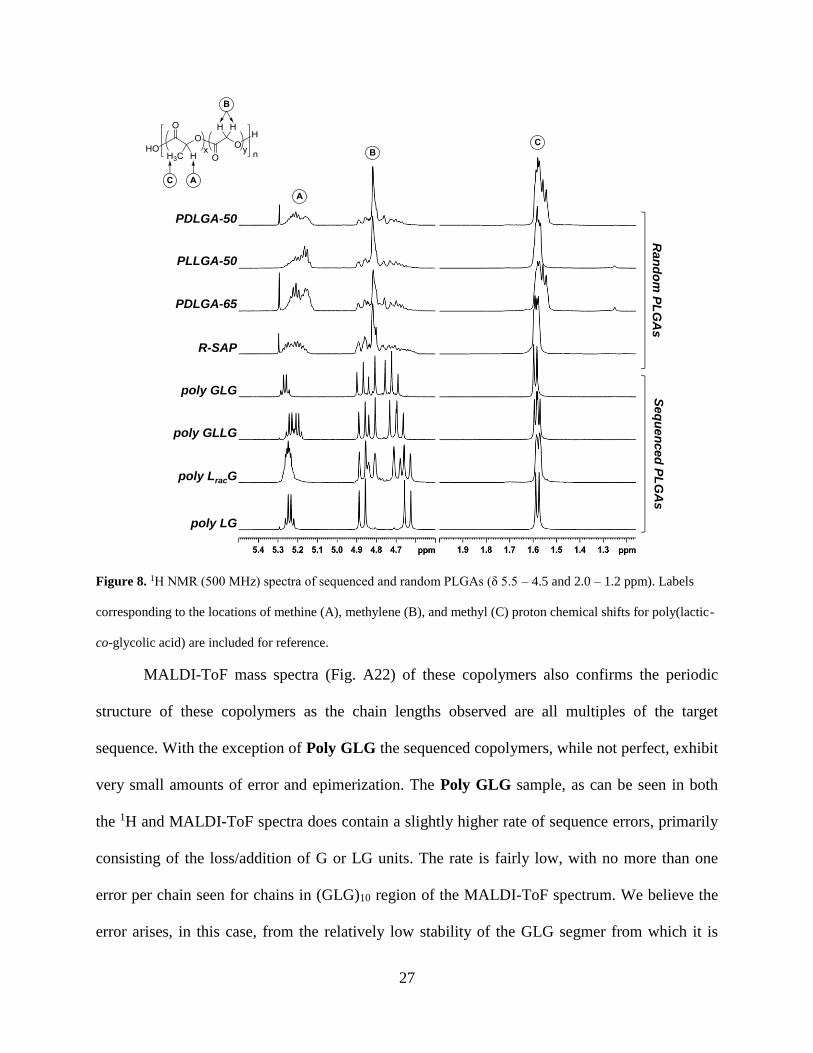
27
PDLGA-50
PLLGA-50
PDLGA-65
R-SAP
poly GLG
poly GLLG
poly LracG
poly LG
Ran
do
m P
LG
As
Seq
uen
ced
PL
GA
s
Figure 8. 1H NMR (500 MHz) spectra of sequenced and random PLGAs (δ 5.5 – 4.5 and 2.0 – 1.2 ppm). Labels
corresponding to the locations of methine (A), methylene (B), and methyl (C) proton chemical shifts for poly(lactic-
co-glycolic acid) are included for reference.
MALDI-ToF mass spectra (Fig. A22) of these copolymers also confirms the periodic
structure of these copolymers as the chain lengths observed are all multiples of the target
sequence. With the exception of Poly GLG the sequenced copolymers, while not perfect, exhibit
very small amounts of error and epimerization. The Poly GLG sample, as can be seen in both
the 1H and MALDI-ToF spectra does contain a slightly higher rate of sequence errors, primarily
consisting of the loss/addition of G or LG units. The rate is fairly low, with no more than one
error per chain seen for chains in (GLG)10 region of the MALDI-ToF spectrum. We believe the
error arises, in this case, from the relatively low stability of the GLG segmer from which it is

28
prepared. Again, it should be noted that the assignment of these NMR spectra has been
extensively investigated and is described in detail elsewhere.55 The 1H NMR spectra of the
random copolymers, PDLGA-50, PLLGA-50 and R-SAP were also acquired and the actual L:G
unit ratio (Table 1) was calculated by integration of the glycolic methylene and lactic methine
resonances.
The 13C NMR spectra of the carbonyl region of the sequenced and random copolymers
are particularly interesting to the current discussion as they highlight the dramatic difference in
numbers and types of sequence environments (Fig. 9). The random copolymers show a large
variety of carbonyl environments, while the sequenced copolymers exhibit only a few. The
introduction of stereosequences also increases the complexity of this region, even for the
periodic copolymer poly LracG.
R-SAPPDLGA-65PLLGA-50PDLGA-50 poly LG poly LracG poly GLLG poly GLG
Random PLGAs Sequenced PLGAs
Figure 9. 13C NMR (500 MHz) spectra of glycolyl (top) and lactyl (bottom) carbonyl regions of sequenced and
random PLGAs.
As R-SAP had been prepared from the dimers LL, GG, LG, and GL, we expect that the
average L and G block lengths are most probably shorter than those in commercial PDLGA-50

29
and PLLGA-50 produced from the ROP of lactide and glycolide. We were not, surprisingly,
able to confirm this hypothesis spectroscopically because we found that the 13C NMR resonances
of the periodic copolymers produced for this study and others overlapped in a way that precludes
a simple interpretation of this region for random mixtures (Fig. A23 for an example). We note
that the prior assignments of resonances that have been proposed based on ROP copolymer
syntheses 7, 9, 92-93 cannot be applied in the case of R-SAP because those analyses were based on
the predicted absence of resonances for certain sequences that are not forbidden in the R-SAP
case. That being said, it is clear from the observed differences in the glycolyl carbonyl region of
PLLGA-50 and R-SAP, that there are significant microstructural differences. These differences
should, based on our sequence hypothesis, be reflected in the properties.
2.4.3 In vitro swelling of sequenced and random PLGAs
PLGA performance has been examined in a variety of constructs including microparticles,29, 90
films,94-95 and solid matrices in a variety of geometries.84, 96 For the current studies, which focus
on bulk properties rather than drug release, we have chosen to fabricate the polymers into
macroscale cylindrical matrices to increase their relevance to larger implantable devices (e.g.,
screws and plates). To determine dependence of the uptake of water on sequence, swelling
studies were performed on cylindrical pellets (3 x 3 mm), two per polymer, prepared using
heated compression molding. For random PLGA, these matrices would be expected to degrade
by a bulk hydrolysis mechanism since they are thinner in all dimensions than the critical
thickness of 7.4 cm that has been identified as the transition point between bulk and surface
erosion for poly(-hydroxy ester)s.84 Data for cylindrical constructs similar to those used in this
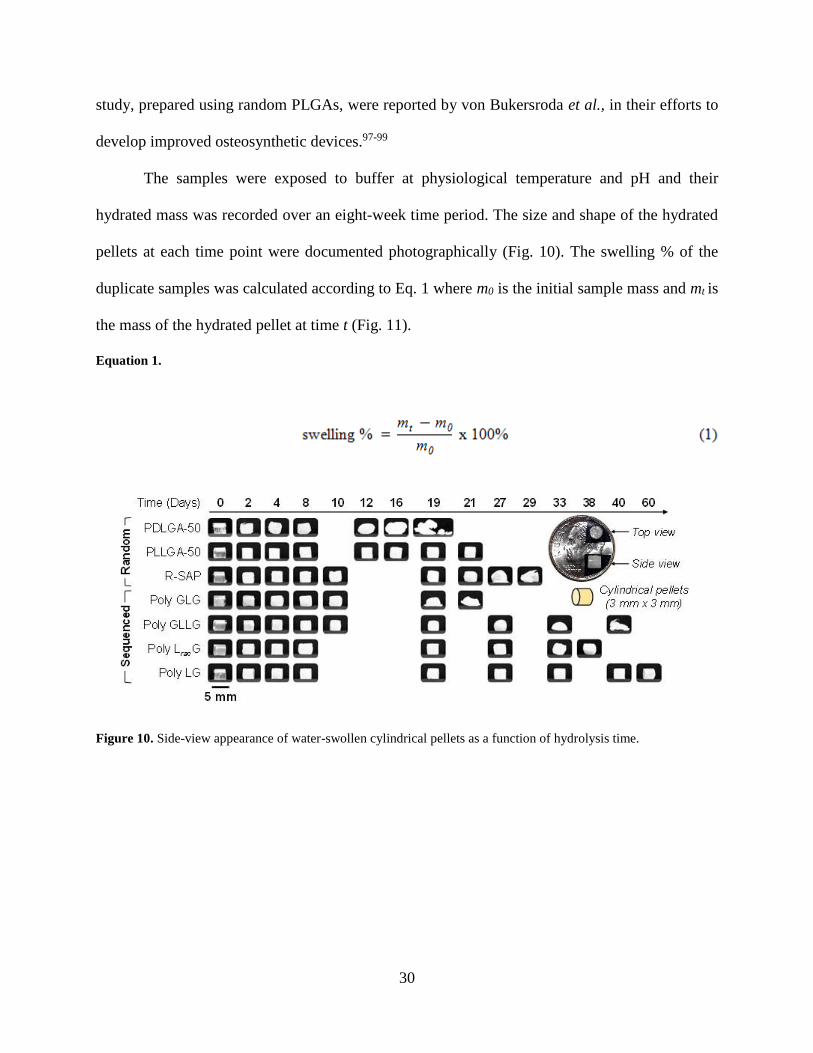
30
study, prepared using random PLGAs, were reported by von Bukersroda et al., in their efforts to
develop improved osteosynthetic devices.97-99
The samples were exposed to buffer at physiological temperature and pH and their
hydrated mass was recorded over an eight-week time period. The size and shape of the hydrated
pellets at each time point were documented photographically (Fig. 10). The swelling % of the
duplicate samples was calculated according to Eq. 1 where m0 is the initial sample mass and mt is
the mass of the hydrated pellet at time t (Fig. 11).
Equation 1.
Figure 10. Side-view appearance of water-swollen cylindrical pellets as a function of hydrolysis time.

31
0 7 14 210
1
2
3
4
5
6
7
8
9
10
Sw
ell
ing
, %
Time (Days)
0 7 14 21 28 35 42 49 560
10
20
30
40
80
100
120 PDLGA-50
PLLGA-50
R-SAP
poly GLG
poly GLLG
poly LracG
poly LG
Sw
ell
ing
, %
Time (Days)
Ra
nd
om
Se
qu
en
ce
d
Figure 11. Swelling profiles of sequenced and random PLGAs over 8 weeks (top); enlargement of the first 3-week
time period (bottom). Open symbols represent random copolymer controls and closed symbols represent sequenced
copolymers.
In examining the swelling data, it can be seen that upon immersion there was an initial
increase in swelling of ~2% for all polymers during the first two days. The pellet size and
morphology remained constant during this time period but gradually changed over the first week
depending on the sequence of the PLGA. The onset of swelling for both random PLGAs,
PDLGA-50 and PLLGA-50, occurred during the first week. Interestingly, the morphology of
PDLGA-50 changed during this time period and PLLGA-50 remained unchanged.

32
During the second week, swelling increased from 5% to 42% for PDLGA-50; significant
swelling and altered shape morphology was also observed. The stereopure random analogue
PLLGA-50 slowly increased in water content from 6% to 11% while retaining its structural
integrity. The swelling of sequenced PLGAs remained unchanged during this time period with
only R-SAP, the random PLGA analogue prepared by SAP, exhibiting slight changes in
morphology. After three weeks of immersion, the influence of sequence and stereochemistry was
more pronounced. The water content of PDLGA-50 reached its maximum of 107% and
significant sample fracturing was observed. The loss of integrity precluded any further
measurements. PLLGA-50 exhibited nominal visual swelling and had a maximum of 11% prior
to sample failure. No significant changes in swelling were observed for poly LG, poly LracG and
poly GLLG, 2%, 4% and 3%, respectively. Noticeable changes in morphology were observed in
poly GLG (15%) and R-SAP (5%), which were followed by a continual increase in swelling
resulting in rupture after 23 days for poly GLG (30%) and 27 days for R-SAP (20%). In the
time period of week four to five, the morphology of poly GLLG and poly LracG begins to
change and is accompanied by an increase in swelling, 5-10% and 4-6%, respectively, with each
sample failing at a maximum swelling of 10%. Throughout this time period, poly LG exhibited
minimal changes in swelling and morphology; at 52 days swelling was only 6%.
2.4.4 In vitro erosion of sequenced and random PLGAs
To understand the erosion behavior of sequenced and random PLGAs, mass loss experiments
were conducted in parallel to the swelling studies. Cylindrical pellets with a height of 1.5 mm
and width of 3 mm, prepared by heated compression molding were used. These studies were
performed under physiological pH and temperature and mass loss data were obtained on the

33
lyophilized pellets at selected time points over 19 weeks. The size and shape of the lyophilized
pellets were recorded photographically and are reported in (Fig. 12) and erosion profiles of
sequenced and random PLGAs are shown in (Fig. 13). The erosion is reported as % mass loss,
which was calculated using Eq. 2, where m0 is the initial sample mass and mt is the mass of the
lyophilized pellet at time t.
Equation 2.
Figure 12. Top-view appearance of eroded cylindrical pellets, after lyophilization, as a function of hydrolysis time.

34
2 3 4 5 6 7 8 9100
80
60
40
20
0
Time (Weeks)
Mass L
oss,
%
0 2 4 6 8 10 12 14 16 18 20100
80
60
40
20
0
Ma
ss
Lo
ss
, %
Time (Weeks)
PDLGA-50
PLLGA-50
R-SAP
poly GLG
poly GLLG
poly LracG
poly LG
Ra
nd
om
Se
qu
en
ce
d
Figure 13. Erosion profiles of sequenced and random PLGAs over 19 weeks (top); enlargement of weeks 2-9
(bottom). Open symbols represent random copolymer controls and closed symbols represent sequenced copolymers.
The mass loss profiles for periodic PLGAs were found to be dramatically different than
random PLGAs for a variety of sequences. All samples began with an initial period of stability.
After this initial period, the degradation proceeded at a rate that depended on L:G ratio, structural
sequence and stereochemistry. For the random PLGAs, PDLGA-50 and PLLGA-50, the onset
of erosion occurred at two weeks. The 1:1 LG ratio polymer, PDLGA-50, then lost mass rapidly
over the next three weeks before losing structural integrity. The random stereopure analogue,
PLLGA-50, retained its structural integrity after the onset of erosion for an additional two weeks

35
but lost its structural integrity at week seven, at a 62% mass loss. Interestingly, for PLLGA-50,
the erosion rate plateaued between weeks four and seven.
The sequenced PLGAs, with the exception of poly LG, and the random analogue
prepared by SAP exhibited an onset of erosion during week three. Interestingly, both poly GLG
and R-SAP lost their structural integrity at week three and had rapid stages of mass loss
throughout weeks four and five. During these time periods, poly GLG lost 39% of its mass at
week four and an additional 55% by week five. R-SAP at the same time points lost 16% and an
additional 28%. Mass loss for poly GLLG and poly LracG was more gradual. Despite having the
same onset of erosion, poly GLLG and poly LracG retained their structural integrity over weeks
four and five but failed at weeks six and seven, respectively. During the time period of weeks
three to six for poly GLLG, only 31% eroded and an additional 45% eroded after eight weeks.
For poly LracG, 49% of the sample was lost between weeks three and seven and an additional
27% after nine weeks. The erosion profile of poly LG was more linear and structural integrity
was maintained over a longer time period; no pronounced onset of erosion was evident over the
time period studied. The structural integrity of poly LG was retained for eight weeks with only a
14% mass loss. At the end of the study, poly LG had lost 78% of the sample’s initial mass.

36
2.4.5 Correlated trends in swelling and erosion
A B
PDLG
A-5
0
poly G
LG
R-S
AP
PLLG
A-5
0
poly G
LLG
poly L
racG
poly L
G
0
20
40
60
80
100
120
Ma
xim
um
sw
ell
ing
, %
PDLG
A-5
0
poly G
LG
R-S
AP
PLLG
A-5
0
poly G
LLG
poly L
racG
poly L
G
0
2
4
6
8
10
12
14
16
Ero
sio
n h
alf
-lif
e (
we
ek
s)
PDLG
A-5
0
poly G
LG
R-S
AP
PLLG
A-5
0
poly G
LLG
poly L
racG
poly L
G
0
2
4
6
8
10
12
14
16
Ero
sio
n h
alf
-lif
e (
weeks)
Sequenced
Random
5 mm
Sw
ellin
g
(hyd
rate
d)
Ero
sio
n
(lyo
ph
iliz
ed
)
PDLGA-50 poly LG
Side view
Top view
C
PDLG
A-5
0
poly G
LG
R-S
AP
PLLG
A-5
0
poly G
LLG
poly L
racG
poly L
G
0
2
4
6
8
10
12
14
16
Ero
sio
n h
alf
-lif
e (
we
ek
s) *
PDLG
A-5
0
poly G
LG
R-S
AP
PLLG
A-5
0
poly G
LLG
poly L
racG
poly L
G
0
2
4
6
8
10
12
14
16
Ero
sio
n h
alf
-lif
e (
we
ek
s)
PDLG
A-5
0
poly G
LG
R-S
AP
PLLG
A-5
0
poly G
LLG
poly L
racG
poly L
G
0
2
4
6
8
10
12
14
16
Ero
sio
n h
alf
-lif
e (
weeks)
Sequenced
Random
Figure 14. Maximum swelling % (A) and erosion half-life (B) of sequenced and random PLGAs. *Erosion half-life
is approximately 10-14 weeks. Enlarged views (C) of cylindrical constructs of PDLGA-50 and poly LG in week 2 of
degradation highlighting the dramatic sequence-based differences in swelling and erosion behavior.
When the swelling and erosion behaviors of copolymers are compared, there is a clear inverse
relationship. Those polymers that exhibited a higher degree of swelling were also observed to
erode more quickly (Fig. 14). Another important observation that can be made by examining
these trends is that both the random PDLGA-50 and poly LG are outliers amongst their
analogues. PDLGA-50 swelled by a factor of 3x more than any other sample. On the other end
of the spectrum is the alternating copolymer poly LG, which erodes 2x more slowly than any
other PLGA examined, including other sequences. The dependence of both processes on
stereochemistry can also be seen, with the racemic versions exhibiting more swelling and shorter
erosion half-lives than their stereopure analogues. Finally, it is interesting to note that poly
GLG, which would be expected based only on the ratio of L:G units to degrade the quickest, has
a half-life that is slightly longer than the random PDLGA-50.

37
Although the large and repeatable differences in behavior between sequences suggest that
the sequence is retained during the degradation process, esters are known to undergo
transesterification in the solid state under some conditions. Indeed the synthesis of random
PLGA has been reported by the thermolysis of PLA with PGA.7 To probe the possibility of
transesterification during hydrolysis in these studies, we collected 1H NMR spectra of the simple
alternating stereopure poly LG as a function of degradation (Fig. A24). As the NMR spectra for
these polymers is exquisitely sensitive to changes in sequence and stereochemistry, any changes
would be evident.55 Over 35 days, however, despite evidence of some degradation to form
oligomers, there was no observed transesterification nor epimerization of the poly LG structure
(Fig. A25).
2.4.6 Changes in molecular weight and distribution
0 7 14 21 28 35 42 49 56 631.0
1.5
2.0
2.5
3.0 PDLGA-50
PLLGA-50
R-SAP
poly GLG
poly GLLG
poly LracG
poly LG
Ð
Time (Days)
0 7 14 21 28 35 42 49 56 630.0
0.2
0.4
0.6
0.8
1.0
1.2 PDLGA-50
PLLGA-50
R-SAP
poly GLG
poly GLLG
poly LracG
poly LG
Mn
(t)/
Mn
(0)
Time (Days)
0 7 14 21 28 35 42 49 56 630.0
0.2
0.4
0.6
0.8
1.0
1.2
Mw
(t)/
Mw
(0)
Time (Days)
PDLGA-50
PLLGA-50
R-SAP
poly GLG
poly GLLG
poly LracG
poly LG
Figure 15. Weight average molecular weight (left); number average molecular weight (center); dispersity (right) of
sequenced and random PLGAs as a function of time. Open symbols represent random copolymer controls and
closed symbols represent sequenced copolymers.
The molecular weight profiles for all polymers in this study, normalized relative to the original
Mw and Mn, along with the dispersity data are plotted in Fig. 15. The molecular weight loss
profiles for random PLGAs, PDLGA-50 and PLLGA-50, decreased rapidly with time, which is
38
typical of 50:50 ratio random PLGAs.100 In contrast, R-SAP, poly GLG and poly LracG did not
exhibit significant molecular weight loss until after 7 d. Poly LG and poly GLLG retain their
initial molecular weights for 3 weeks.
Polymer chain dispersity (Ɖ) was also found to depend on monomer order and
stereochemistry. PDLGA-50, R-SAP, poly LracG and poly GLG exhibit a sharp increase in
dispersity by week 3. During this time period PLLGA-50 also increases but at a slower rate. The
dispersities of poly LG and poly GLLG remain constant over 35 d, and increase gradually over
the following 4 weeks.
2.4.7 Surface water contact angle
To determine if there were significant differences in the inherent hydrophilicity of the sequenced
and random PLGAs, the surface contact angles of selected samples, PDLGA-50, PDLGA-65
and poly LG, were measured after exposure to hydrolyzing conditions. Thick films (20-30 µm)
were submerged in PBS buffer at 23 °C and the hydrated contact angle was monitored over an 8
day time period. The samples were subsequently dried by lyophilization and the dry film contact
angles were recorded (Fig. 16).

39
Init
ial
Po
st-
dry
Po
st-
we
t
Init
ial
Po
st-
dry
Po
st-
we
t
Init
ial
Po
st-
dry
Po
st-
we
t
PDLGA-50 PDLGA-65 poly LG
50
60
70
80
90
Co
nta
ct
An
gle
()
PDLGA-50 PDLGA-65 poly LG
Figure 16. Average water contact angles from unexposed films (initial) and films exposed to physiological
conditions over 8 days measured in their hydrated (post-wet) and lyophilized (post-dry) states. Error bars represent
the standard error of the mean.
The initial water contact angle for all samples was relatively similar, 76.5 ± 0.5° and
agrees with previously reported measurements.101-102 There were no significant changes in the
hydrated film contact angles over an 8 day time period, with the average contact angles for
PDLGA-50, PDLGA-65, and poly LG being 63°, 66° and 65°, respectively (Fig. A26). The
lyophilized film water contact angles, however, do show initial differences after 1 day of
exposure to physiological pH and temperature (Fig. A27). The initial contact angle of PDLGA-
50 decreases from 77° to 63°, which then remains unchanged at around 62-63° for the remaining
8 days of exposure. In contrast, the lyophilized contact angles for PDLGA-65 and poly LG do
not change significantly after 1 day of exposure. The change in the lyophilized contact angle for
PDLGA-50 and poly LG over 8 days was minimal with the overall averages being 72° and 71°,
respectively. The differences observed between sequences in the lyophilized angles appears to
correlate with the amount of film degradation—the slower degrading samples maintain their
surface hydrophobicity longer.

40
2.5 DISCUSSION
The ultimate goal of this work and that of many researchers in bioengineering is to be able to
control the degradation of implantable/injectable polymers. While the architecture (i.e., size,
shape, porosity) of particular matrices contributes significantly to their behavior,103-104 the
chemical composition of the material from which they are made is ultimately responsible for
determining the degradation mechanism, profile, release rate of encapsulated drugs, and
mechanical properties. The most widely adopted strategy for changing polymer composition, and
thereby tuning properties, is to add new or modify the current monomers. While this approach
works well for materials that will not be employed in biomedical applications, the use of new
monomers in a biomaterial presents significant challenges as all of the degradation products must
be non-toxic and clearable.
Our approach to composition control, which avoids the introduction of new chemical
entities, is to adopt nature’s own solution to this problem: use the same monomers but change the
order. Despite the obvious nature of this idea, the synthetic challenges in making sequenced
copolymers have long inhibited the exploration of this strategy. There are only isolated, nearly
anecdotal, studies relating bulk properties to sequence outside of amino and nucleic acid
polymers.34-35, 45-46 We have focused our research on PLGA due to the ubiquity of its use and
because the poor match of PLGA properties with those required for particular applications has
been cited as the justification for the synthesis of a multitude of polymers based on alternate
monomers.104-106 It was our hypothesis, one now supported by the results herein, that sequence
control may offer an alternate approach to adjusting PLGA properties to those required for
particular applications.

41
Swelling and erosion are both intrinsically involved in degradation.84 While our data
conclusively demonstrate that both behaviors depend on sequence, the reason for the correlation
is not immediately apparent. One possible explanation, especially given the dramatic differences
in swelling, is that the properties correspond to sequence-based variations in hydrophilicity.
Although not a true measure of intrinsic hydrophilicity, the fact that the surface contact angle of
PDLGA-50, which necessarily possesses runs of L and G, is nearly the same the simple
alternating poly LG, suggests that sequence-based differences in the interaction with water are
minimal. More convincingly, we find that the water uptake in the first 3 days of the swelling
experiment was nearly the same for all samples. These results suggest that the differences seen
are not a function of the initial interaction with water but rather come about as a result of chain
degradation processes.
The molecular weight loss profile matches the trends that we reported previously 60-61 and
tracks well with the swelling and erosion behaviors. The ROP-random copolymers degrade more
quickly than either the R-SAP or sequenced copolymers. The dispersity trends are also
interesting as the dispersity increase correlates in time with the onset of significant swelling in all
of the polymers.
Stereosequence also plays a key role in degradation. Both stereopure PLLGA-50 and
poly LG retain their structural integrity over a slightly longer time period than their racemic
analogues, PDLGA-50 and poly LracG, respectively. While it is known that crystallinity plays a
role in the differences between the random copolymers,107-108 the sequenced copolymers do not
appear to crystallize to a significant extent, even during degradation.60 A fuller understanding of
this phenomenon will require further study outside the scope of the current investigation.

42
Overall, we hypothesize that the differences in hydrolysis profile, both in swelling and
erosion, are due primarily to the variation in kinetic rates of cleavage of the L-L, L-G, G-L and
G-G linkages (Fig. 17). This rate difference has long been established in the random copolymer
literature and has been used to explain, for example, the increase in L to G ratio during the
hydrolysis period.29, 107, 109-110 The observed molecular weight behavior is consistent as PDLGA-
50, which has the full spectrum of linkages, exhibited a faster drop in molecular weight as a
function of hydrolysis time than did the isomeric poly LG, which comprises only L-G and G-L
linkages. The dispersity behavior of these copolymers also correlates as rapid cleavage of G-G
linkages would be expected to result in earlier increases in polymer chain dispersity.
Random PLGA Copolymer (1:1 L:G ratio)
All L-units
Same L:G ratio
Sequenced PLGA Copolymer (1:1 L:G ratio)
Glycolic (G) Unit
Lactic (L) Unit
Fast hydrolysis Slow hydrolysis
Steady hydrolysis rate
Figure 17. Differences in the rates of hydrolysis for random and sequenced PLGA copolymers with the same L:G
ratio.

43
In the current study, the variation in cleavage rates would be expected to produce
significant differences in species population within the pellets, which we propose leads to the
observed differences in degradation profile. The rate of chain cleavage and concomitant
generation of acidic oligomers and monomers would be expected to correlate with the frequency
of G-G linkages within the chain—a larger percentage of G-G linkages should lead to higher
local concentrations of hydrolytic products within the construct. Although the higher local
concentrations of acidic species would be expected to autocatalytically enhance interior
degradation and polymer erosion, 111-113 this effect alone does not explain the swelling behavior.
In addition, we propose that osmotic pressure may play an important role in this case because the
degradation products are likely produced more rapidly than they are released.114-116 Under these
circumstances a concentration gradient could drive the osmotic uptake of water to give swelling
that correlates with the number of entrapped products.84 While swelling should eventually
facilitate clearance, thereby relieving osmotic pressure, the constructs appear to lose both
structural integrity and morphological stability before such an equilibrium is reached. This
hypothesis is consistent with the observation that pellets with identical compositions but higher
numbers of G-G linkages degrade much faster and exhibit dramatic morphological changes.

44
2.6 CONCLUSIONS
We have demonstrated that swelling and erosion, which are both key properties related to
potential applications of PLGAs, depend dramatically on the sequence of the L and G monomers.
Specifically, as the number of G-G linkages is decreased, the degree of swelling is diminished
and the erosion is slowed. This dependence on sequence allows for the tuning of the hydrolytic
profile without additives or other comonomers. Future work will focus on both improving our
understanding of the dependence of hydrolysis on sequence and on studies that test the in vivo
performance of these materials.

45
3.0 MONOMER SEQUENCE IN PLGA MICROPARTICLES: EFFECTS ON ACIDIC
MICROCLIMATES AND IN VIVO INFLAMMATORY RESPONSE
3.1 OVERVIEW
This work presented in this chapter describes the in vitro acidic microclimate pH distribution,
external morphological changes and in vivo foreign body response for sequenced and random
poly(lactic-co-glycolic acid) microparticles. This chapter has been submitted for publication in a
peer-reviewed journal and is summarized in Fig. 18: M.A. Washington, S.C. Balmert, M.V.
Fedorchak, S.R. Little, S.C. Watkins, T.Y. Meyer. “Monomer sequence in PLGA microparticles:
Effects on acidic microclimates and in vivo inflammatory response.” 2017.
Figure 18. Graphical abstract for Chapter 3 – Monomer sequence in PLGA microparticles: Effects on acidic
microclimates and in vivo inflammatory response.

46
Controlling the backbone architecture of poly(lactic-co-glycolic acid)s (PLGAs) is
demonstrated to have a strong influence on the production and release of acidic degradation by-
products in microparticle matrices. Previous efforts for controlling the internal and external
accumulation of acidity for PLGA microparticles have focused on the addition of excipients
including neutralization and anti-inflammatory agents. In this report, we utilize a sequence-
control strategy to tailor the microstructure of PLGA. The internal acidic microclimate
distributions within sequence-defined and random PLGA microparticles were monitored in vitro
using a non-invasive ratiometric two-photon microscopy (TPM) methodology. Sequence-defined
PLGAs were found to have minimal changes in pH distribution and lower amounts of
percolating acidic by-products. A parallel scanning electron microscopy study further linked
external morphological events to internal degradation-induced structural changes. The properties
of the sequenced and random copolymers characterized in vitro translated to differences in in
vivo behavior. The sequence alternating copolymer, poly LG, had lower granulomatous foreign-
body reactions compared to random racemic PLGA with a 50:50 ratio of lactic to glycolic acid.
3.2 INTRODUCTION
The favorable hydrolytic degradation profiles and biocompatibility of poly(lactic-co-glycolic
acid)s (PLGAs) have resulted in extensive research into their application as components in drug
delivery systems (DDSs).69, 117 The performance of DDSs made from PLGAs have been linked in
these studies to several characteristics including ester hydrolysis rates, diffusion, swelling,
erosion, and local pH drop.70, 114-115, 118 Although these processes can be tuned to a certain degree
by varying the L:G-ratio and molecular weight of the random copolymer, the lack of fine control
47
over the properties may contribute to the surprisingly low commercial use of PLGAs.95 Despite
thousands of literature reports on PLGA DDSs, fewer than 20 PLGA-based products have
garnered FDA and EMA approval over the past three decades.68 This lack of translation suggests
that there is a clear unmet need for alternative methods that optimize the performance of PLGA
matrices.
We have recently reported that precise control over monomer sequence can be utilized to
tune in vitro PLGA degradation behavior for various PLGA matrices. In Li et al., for example,
we describe sequence-dependent degradation behavior of microparticles, demonstrating that
thermal properties, molecular weight loss, lactic acid release, and rhodamine B release rates were
dramatically different for random PLGAs vs. sequenced PLGAs prepared with the same L:G-
ratio and molecular weights.60-61 Specifically, we found that in vitro degradation and release rates
were slower and more gradual for microparticles prepared with periodic sequences (e.g., (LG)n,
(LLG)n) relative to random analogues. More recently, in Washington et al., we demonstrated that
compression-molded implants fabricated with sequenced PLGAs exhibited minimal in vitro
changes in swelling, delayed onsets of erosion, and more gradual changes in molecular weight
and dispersity compared to random PLGAs with the same overall compositions.62 Finally, in
both of these studies, we were able to show that by varying the structural and/or stereosequence
that the degradation-related properties could be tuned. We note that there are a number of recent
reports concerning both the development of new general synthetic strategies for creating
sequenced copolymers as well as studies correlating sequence with properties.33-36, 45, 54, 119-121
Significant precedent for our strategy of controlling sequence can also be found in studies
on random poly(-hydroxy acid)s in which properties are mapped to changes in the statistical
distributions of monomers. For instance, Abe and Tabata have demonstrated that the thermal

48
properties and crystalline structures for a class of periodic aliphatic polyesters may be varied
over a wide range of temperatures based on stereosequence manipulations.122-123 Sarasua and
coworkers have further linked statistical variations in chain microstructure to various hydrolytic
degradation rates in poly(lactide-co-ε-caprolactone) matrices.74, 76-77, 79, 124-125 Finally, Albertsson
and coworkers, determined that the distribution of hydrolytically-accessible 1,5-dioxepan-2-one
linkages had a profound effect on the release rates of acidic degradation products in triblock,
multiblock, and random crosslinked caprolactone/1,5-dioxepan-2-one copolymers.126
This study adds to our previous work on sequenced PLGAs, specifically on the
characterization of how sequence affects the accumulation, distribution, and release of acidic by-
products during PLGA degradation. These by-products represent a significant challenge to using
poly(-hydroxy acid)s in applications because acid can degrade macromolecular payloads that
have been encapsulated in PLGA matrices and can lead to local inflammation when implanted in
vivo.113 Previous attempts to address this issue have typically involved the addition of
neutralizing agents and other excipients to control the internal acidic microclimate pH (μpH)127
and/or the incorporation of anti-inflammatory agents such as dextramethasone and
tripolyphosphate to minimize the impact of acidity on tissues near the injection site.128-129
Although these methods have proven effective in specific studies, the addition of external agents
necessarily introduces new factors that can affect the drug release kinetics, immune response,
and degradation profile of the PLGA matrix. Based on our reported observation that lactic acid
release rates were greatly suppressed in sequenced copolymers relative to random PLGAs,60 we
hypothesize that sequence can be used as a tool to control the acidic microclimate within a
polymer microparticle and acid-induced inflammation of DDSs. This approach is particularly

49
attractive since the potential complications that could arise from the incorporation of additives
can be avoided.
To understand how sequence affects acidity within a PLGA microparticle, we
characterized the in vitro spatial distribution of low pH regions in PLGA as a function of
sequence and stereosequence using a non-invasive ratiometric two-photon microscopy (TPM)
method. Non-invasive efforts to visualize the pH within random PLGA microparticles have been
previously reported and include electron paramagnetic resonance spectroscopy (EPR)111, 116, 130-
131 and confocal laser scanning microscopy (CLSM).113, 132-137 Although EPR methods
demonstrated that the internal pH of PLGA particles can be as low as pH = 2, CLSM studies,
conducted on particles loaded with pH-sensitive dyes, make it possible to spatially map the pH
within small particles. Using CLSM methods, Langer and Schwendeman independently reported
an internal pH range within microparticles composed of random PLGAs of 1.5 – 3.5 after 15 d
and 3.2 – 3.4 after 28 d of in vitro hydrolytic degradation, respectively. Moreover, Schwendeman
and coworkers extensively studied how L:G-ratio, molecular weight, microparticle size, and
emulsion method (W/O/W and O/O) influenced μpH kinetics and determined that L:G-ratio and
molecular weight contributed to differences in μpH distribution and kinetics. Random PLGA
with an L:G-ratio of 50:50 and low molecular weight were also found to exhibit earlier onsets of
acid accumulation, lower acidic distribution after 28 d, and notable changes in morphology.
Degradation-induced morphological changes were also observed by Langer and coworkers using
scanning electron microscopy (SEM); increasing surface pores and slight plasticization for 50:50
L:G-ratio PLGA microparticles were observed.113 We note that we have also previously utilized
CLSM to map the drug distribution a dextran-labeled Texas Red dye.138 Other strategies for
measuring the acidity of PLGA, aside from the aforementioned non-invasive methods, have been

50
reported and include indirect pH measurements of the incubation media potentiometric
measurements recorded using inserted pH probes.116, 139-141
In the current study, we focused upon the difference in pH distribution within
microparticles as a function of monomer sequence using two-photon microscopy (TPM). We and
others have demonstrated the TPM offers distinct advantages over confocal microscopy for
monitoring ratiometric probes within cells and other structures including minimization of data-
destroying photobleaching and the ability to image at greater depths.142-145 Finally, as we are also
interested in understanding whether sequence-based differences in pH distribution within
microparticles translate into differences in in vivo performance we also report herein a
comparison of the inflammatory response to implanted sequenced and random copolymer
microparticles.
3.3 MATERIALS AND METHODS
3.3.1 Materials
Poly(D,L-lactide-co-glycolide) with a copolymer ratio of 50:50 and 65:35 were purchased from
Durect Corporation (Birmingham, AL). Poly(L-lactide-co-glycolide) with a 50:50 L:G-ratio was
purchased from Changchun SinoBiomaterials Co. Ltd. (Changchun, China). The pH sensitive
fluorescent probe, LysoSensorTM Yellow/Blue DND-160 (PDMPO) (MW 366.42), was
purchased from Life Technologies (Eugene, OR, USA) as a 1 mM solution in dimethylsulfoxide
(DMSO). Polyvinyl alcohol (PVA, MW 25 kDa, 98% hydrolyzed) was from Polysciences

51
(Warrington, PA). Sequence PLGA copolymers were prepared using previously reported
methods.55
3.3.2 Characterization
Molecular weights and dispersities were acquired on a Waters GPC system (tetrahydrofuran
(THF), 0.5 mL/min) with Jordi 500 Å, 1000 Å, and 10000 Å divinylbenzene (DVB) columns and
refractive index detector (Waters), which was calibrated relative to polystyrene standards.
Thermal properties of all polymers prior to and after single-emulsion (O/W) microparticle
preparation were obtained using TA Instruments Q200 DSC. Data were collected with a heating
and cooling rate of 10 °C/min. The glass transition temperatures (Tg) for polymers as synthesized
were collected during the second heating cycle while the O/W microparticles were collected in
the first heating cycle. The glass transition temperatures are reported as the half-step Cp
extrapolated. The 1H and 13C NMR spectra were obtained in CDCl3 using a 500 MHz Bruker
Avance III spectrometer at 293 K and calibrated to the residual solvent peak at δ 7.26 ppm (1H)
and δ 77.00 ppm (13C).
3.3.3 Preparation of PLGA microparticles
PLGA microparticles containing the pH sensitive dye, LysoSensorTM Yellow/Blue DND-160
(PDMPO) were synthesized using a single-emulsion process.69, 146 Briefly, under low light
conditions, PLGA (300 mg) was dissolved in dichloromethane (4 mL) followed by the addition
of 200 μL of 1.0 mM LysoSensorTM in DMSO and the mixture was vortexed 1 min. The solution
was added dropwise through a 250 µm sieve (U.S. Standard sieve series; ASTM E-11

52
specifications; Dual MFG Co.; Chicago, IL) into a 1% w/v (aq) PVA solution stirred at 600 RPM
for 3 h at 23 °C. The resulting microspheres were centrifuged at 4 °C, 1,000 RPM, 8 min and
washed with deionized (DI) water (4x).The microspheres were briefly re-suspended in deionized
water (5 mL), flash frozen with liquid nitrogen and lyophilized for 3 d (VirTis Benchtop K
freeze dryer, Gardiner, NY; operating at 100 mTorr). For the control, unloaded microparticles,
the procedure described above was used while omitting the addition of the pH sensitive dye.
3.3.4 Fluorescent intensity ratio vs. pH standard curve
Buffers of pH 2.8 to 6.4 were prepared using 0.1 M citric acid and 0.2 M Na2HPO4 solutions. An
aliquot of LysoSensorTM Yellow/Blue DND-160 was added to the buffer solutions yielding a
concentration of 2.0 µM. A Varian Cary Eclipse Fluorescence Spectrophotometer coupled to a
personal computer with software (cary eclipse software) provided by Varian was utilized to
monitor the emission spectra of the pH probe as a function of pH. The standard dye solutions
were excited at the isosbestic point λ = 360 nm and the fluorescence spectra were recorded from
375 – 700 nm. The standard curve was established by plotting the ratio of the fluorescent
intensities at two emission wavelengths, 450 nm and 530 nm, versus the pH of that solution.
3.3.5 Microclimate pH mapping inside microparticles
PLGA microparticles (40 – 41 mg) were incubated in 2.00 mL of phosphate buffer saline (10.0
mM, pH = 7.4) at 37 °C under continuous rotation at 8 rpm (Labquake Tube Rotator, Thermo
Scientific). At specific time points, a 100 µL aliquot was deposited on a glass microscope slide

53
and imaged using a two-photon microscope system. Fresh buffer was added to maintain the
initial sample volume of 2.00 mL.
3.3.6 Two-photon microscopy image acquisition
Two-photon images of sequenced and random PLGAs were captured using an Olympus
FV1000MPE multiphoton laser scanning microscope (Olympus Corporation; Tokyo, Japan). The
TPM system was configured with a mode-locked Ti:Sapphire laser (Chameleon Vision;
Coherent; Santa Clara, CA) capable of emitting excitation wavelengths from 680-1080 nm
(excitation wavelength set to 740 nm, 5.4 % intensity) and a Olympus upright optical microscope
with a 25x, XL Plan N 1.05 N.A. water immersion objective lens (Olympus). The multiphoton
emission of the LysoSensorTM DND-160 pH probe at near neutral and acidic pH was captured
using 420 – 460 nm (detector 1; red channel; near neutral pH) and 500 – 550 nm (detector 2;
green channel; acidic pH) emission filters. FLUOVIEW Ver. 2.1c software (Olympus) was
utilized to acquire multiple XY scans (508 x 508 µm; 0.503 µm/pixel resolution; 12.5 µsec/pixel)
in 1.5 µm increments in the Z-direction. Each sample was imaged in 4 additional regions. The
whole assembly of the TPM microscope was placed on a vibration isolation table (Kinetics
Systems Inc., Boston, MA).
3.3.7 Image processing for pH distribution
TPM images were processed using Nikon-Elements AR 4.50 software package. A threshold was
applied to each channel with a 3x smoothing algorithm. The pH vs. I450nm/I530nm titration curve
was applied to the images and the corresponding pixel intensity ratio frequency vs. pH
54
histograms were constructed. The histograms were processed using OriginPro 2016 where a
lowess smoothing algorithm was applied to remove the high-frequency components.
3.3.8 Scanning electron microscopy characterization of microparticle morphology
Five samples of microparticles for each PLGA (10 mg) were incubated in 1.00 mL of phosphate
buffer saline (10.0 mM, pH = 7.4; Gibco by Life Technologies) at 37 °C under continuous
rotation at 8 rpm (Labquake Tube Rotator, Thermo Scientific). This study was run in parallel
with the two-photon study. At specific time points, week(s) 1, 2, 3, 4 and 5, the microparticles
were flash frozen with liquid nitrogen and lyophilized for 3 d prior to imaging. The structural
integrity and surface morphology of sequenced and random PLGAs during degradation were
characterized using the JSM-6510LV SEM system. The lyophilized microparticles were
sputtered with palladium under an argon atmosphere for 2 cycles of 2.5 min, 30 mA, with a
Cressington Sputter Coater 108auto (Ladd Research, Williston, VT). The images were captured
under high vacuum at an acceleration voltage of 2.5 – 5 kV with the stage titled 5°. Three images
from separate regions of the sample were captured under various magnifications of x150, x350,
and x800.
3.3.9 In vivo studies and histology
Female C57BL/6J wild-type mice were purchased from The Jackson Laboratory (Bar Harbor,
ME) and used at 8 – 12 weeks of age. All mice were maintained under specific pathogen-free
conditions at the University of Pittsburgh, and experiments were conducted with the approval of
the Institutional Animal Care and Use Committee and in accordance with NIH guidelines. Mice

55
were subcutaneously injected in the scruff with PLGA microspheres (15 mg) suspended in sterile
phosphate buffered saline. Mice were euthanized at 2 weeks and 4 weeks (n = 2 mice per group
per time point). Tissues at the injection sites were excised, flash frozen fresh, and cryosectioned.
Sections were stained with hematoxylin and eosin (H&E), and imaged using a Nikon Eclipse
E400 microscope.
3.4 RESULTS
3.4.1 PLGA copolymer and microparticle synthesis and characterization
The sequenced periodic copolymers poly LG and poly LracG were prepared as described
previously using segmer assembly polymerization (SAP) (Fig. 19A).55 It is important to note that
the synthetic method has been optimized to produce copolymers with a very high degree of
sequence fidelity.147 The naming convention for these polymers includes the description of the
exact sequence of monomers in a segmer unit wherein the L-lactic acid unit, rac-lactic acid unit,
and glycolic acid units are abbreviated as L, Lrac, and G, respectively. The purchased random
copolymers were prepared by ring-opening polymerization (ROP, Fig. 19C). PDLGA-50 is
racemic variant of the random copolymer with and L:G-ratio of 1:1 while PLLGA-50 is the
stereopure analogue. PDLGA-65 is racemic but has a 2:1 L:G-composition. The molecular
weights of sequenced PLGAs prepared by SAP and purchased random PLGA controls were
comparable, 21 – 30 kDa (Table 2, Fig. B1).
Microparticles, both with and without the inclusion of the pH-sensitive dye
LysoSensorTM Yellow/Blue DND-160, were prepared by a single-emulsion method. The Tgs for

56
all polymers were between 47 – 50 °C as synthesized but decreased by 2 – 6 °C after formulation
into microparticles (Table 2, Fig. B2). The surface morphology of the non-dye loaded
microparticle controls was characterized using scanning electron microscopy (Fig. B3). The
microparticles exhibited some dispersity with sizes ranging from 50-150 μm.
Segmer Assembly Polymerization (Sequenced PLGAs)
Ring-Opening Polymerization (Random PLGAs)
po
ly L
Gp
oly
Lra
cG
PD
LG
A-5
0P
LL
GA
-50
PD
LG
A-6
5
A
B
C
D
Figure 19. Synthetic preparation of sequenced and random PLGAs and NMR characterization (A) Synthesis of
sequenced PLGA copolymers via segmer assembly polymerization (SAP) methodology. (B) 1H NMR spectra (left)
and 13C NMR spectra (right) for the sequenced periodic PLGA copolymers. (C) Ring-opening polymerization
synthesis of the purchased random PLGAs. (D) 1H NMR spectra (left) and 13C NMR spectra (right) for the random

57
PLGA copolymers. For all polymers, the 1H NMR spectra display the methine, methylene, and methyl resonances
from left to right. 13C NMR spectra display the resonances for glycolyl, lactidyl, methine, methylene, and methyl
carbons from left to right.
Table 2. Characterization data for sequenced and random PLGAs utilized in acidic microclimate study.
Polymer Mn
a
(kDa)
Mwa
(kDa) Đa
Tgb
(°C)
Tgc
(°C) ratio L:Gd Control
Yield (%)
Dye-loaded
Yield (%)
Poly LG 21.4 32.1 1.5 50 48 50:50 47.1 57.7
Poly LracG 29.7 43.9 1.5 49 45 50:50 61.3 62.0
PDLGA-50 28.9 38.2 1.3 48 42 51:49 60.8 61.7
PLLGA-50 22.4 31.4 1.4 47 44 54:46 65.4 60.2
PDLGA-65 28.5 38.3 1.3 48 45 65:35 64.2 57.3
a Molecular weights determined using THF size exclusion chromatography relative to polystyrene standards. b Standard glass transition temperatures were measured in the second heating cycle (10 °C/min, half Cp
extrapolated). c Glass transition temperatures of microparticles after single emulsion preparation were measured in the first
heating cycle (10 °C/min, half Cp extrapolated). d Ratio of lactic (L) and glycolic (G) units was determined using 1H NMR spectroscopy.
The sequence and stereopurity of the periodic PLGA copolymers were confirmed using
1H and 13C NMR (Figs. 19B and 19D). We have shown previously through extensive studies that
the NMR spectra of sequenced PLGAs is extraordinarily sensitive to sequence with the result
that we can unambiguously assign the sequence of any polymer by comparison to authentic
samples and can determine if a particular sample is contaminated with other sequence errors.55,
147 Particularly sensitive are the chemical shifts of the diastereotopic glycolic methylene peaks
that exhibit significant differences that correlate with the relative stereochemistry of nearby lactic
units. It can be seen, for example, in Fig. 19B that there is one major pair of doublets associated
for the glycolic units of the stereopure poly LG while multiple peaks appear in that same regions
for poly LracG, corresponding to stereoisomers that have been previously shown to correlate to a
tetrad-level of resolution (e.g. iss vs. iis).9, 55 On that basis, the weak peaks visible in the glycolic

58
region of the poly LG can be attributed to a small amount (<5%) of epimerization. Similar
analyses can be made for the 13C NMR spectra, with the carbonyl resonances being the easiest to
interpret.
As we will be exploring the degradation behavior of these sequenced copolymers it is
important to note that we have previously exploited the sensitivity of these NMR spectra to
sequence to verify that sequence scrambling does not occur to a significant extent during
hydrolytic degradation.55, 62
3.4.2 LysoSensor Yellow/Blue DND-160 pH-dependent fluorescent response
LysoSensorTM Yellow/Blue DND-160 (PDMPO) was used to measure the internal pH of PLGA
microspheres. Within a working pH range of 6.4 to 2.8, the emission intensity of this molecular
probe shifts from λmax ~ 450 nm to λmax ~ 530 nm with acidifying pH (Fig. 20A). A series of
citric acid : sodium phosphate dibasic pH buffer solutions were utilized to construct a pH vs.
I450nm/I530nm standard curve used for interpretation of the TPM data (Figs. B4 and B5). Briefly,
pH buffer solutions of pH 2.83 – 6.44 with 2 μM dye concentrations were excited at the
isosbestic point λex 360 nm and their ratiometric response intensity was determined. Using a
third-order polynomial function (r2 = 0.994), the optimal pH detection range was determined to
be between pH 3.4 – 5.8 with the regions of pH 2.8 – 3.4 and pH 5.8 – 6.4 being slightly outside
the detection range. Previous reports have verified that the ratiometric emission properties are
independent of concentrations above 1 μM.133, 137 Microparticles were loaded by exposure to a 50
μM solution of the LysoSensorTM dye during single-emulsion fabrication. Quantitative loading
efficiencies were not determined in this study. Instead, the loading efficiency was qualitatively
determined by the presence of emission bands associated with the dye. We had previously

59
reported that poly LG and poly LracG exhibited a lower loading efficiency that the random
analogue 60 and the same qualitative behavior was observed for the LysoSensorTM dye in this
investigation.
Two-photon
λex = 740 nm
High pH regions (red)
Emission filter 420-460 nm
Monitor using
Two-Photon
Microscopy
Low pH regions (green)
Emission filter 500-550 nm
hydrolysis
PLGA Microparticles
loaded with
ratiometric pH probe
A
B
C
Low pHHigh pH
pH = 2.83
pH = 6.44
400 450 500 550 600 650 7000
200
400
600
800
1000
Inte
nsity (
A.U
.)
em (nm)
Scan down
Z-axis
λem 420-460 nm
λem 500-550 nm
Merged
Figure 20. Ratiometric properties of pH-sensitive dye, two-photon microscopy experimental overview, and image
acquisition parameters. (A) Chemical structure, emission profiles (λex = 360 nm), and emission window regions for
the deprotonated and protonated LysoSensorTM pH probe. (B) The low energy two-photon excitation, λex = 740 nm ≈
2x one-photon λex, penetrates deep into the interior of the microparticles providing a detailed pH map (C) Z-stack

60
image acquisition of microparticles in solution were monitored using two separate λem windows. Merged images are
displayed throughout the manuscript.
3.4.3 Internal acidity and morphology changes within sequenced and random PLGA
microparticles
The effect of monomer sequence on the evolution and distribution of acidity within PLGA
microparticles was investigated using two-photon microscopy (Fig. 20B). The pH probe,
LysoSensorTM, was loaded into 50 – 150 μm microparticles using a single-emulsion method. At
various time points over 8 weeks, internal slices of aqueous microparticle suspensions were
imaged at various depths. The ratiometric pH response was captured using a V/G multiphoton
emission filter set, translating to red (near neutral pH) and green (acidic pH) signals (Fig. 20C).
The pH distribution studies for sequenced PLGAs, was limited to 3 weeks due to low dye
loading and long-term dye leaching. The random 50:50 analogues were monitored over 2 weeks
while minimal dye leaching for PDLGA-65 allowed the pH to be monitored over 8 weeks.
Representative images of microparticles over a 2-week time period are shown in Fig. 21.
Additional data for poly LracG, poly LG, and PDLGA-65 at later time points can be found in
Fig. 22. High resolution TPM images of single microparticles displaying characteristic acidic
microclimate features are included for reference in Fig. B6.

61
Figure 21. Internal acidic microclimate distributions of sequenced and random PLGA copolymers after 1, 3, 7, 9, 11
and 14 d in vitro (brightness normalized). *Image not obtained due to laser mode-locking complications. Scale bar =
100 μm.
The internal pH of microspheres during the first two weeks of incubation was within the
detectable range of the pH probe, 2.83 < pH < 6.44. Internal pores, which appear as black holes
on the micrograph, were present in all particles but were more prevalent in the sequenced PLGAs
and PLLGA-50. Initially, all samples exhibited minimal acidity with an internal pH > 4.64. It

62
should be noted that even in the initial image of PLLGA-50 regions of apparent low pH appear
but these artifact are likely due to refracting crystals.148-150 Consistent with this assignment is the
fact that microparticle controls without the pH-sensitive dye exhibited the same features (Fig.
B7). In addition, differential scanning calorimetry thermograms contained melting transitions
spanning 75 – 125 °C (Fig. B2). After 3 d, the internal pH of PDLGA-50 slightly decreased
while the pH of all other samples remained unchanged. With increasing incubation time,
localized regions of acidity appeared in PDLGA-50 and PLLGA-50 while the pH within
PDLGA-65, poly LracG, and poly LG microparticles remained less acidic. The size of the acidic
regions within PDLGA-50 microparticles were larger compared to PLLGA-50. Interestingly,
the PDLGA-50 particles exhibited shape irregularities concomitantly with the onset of
increasing acidity at 7 d while all other samples retained their original morphology at this point
in time. After 9 d, the once localized regions of acidity within PDLGA-50 percolated throughout
the microparticles resulting in a widespread decrease in pH, pH ≈ 4.5. Similar behavior was
present in PLLGA-50 microparticles at 11 d. At this time the internal structure of PDLGA-50
had significantly changed, large apparently acid-filled pores had formed and the internal pH
became more acidic, pH < 4.5. By contrast, the frequency of acidic μ-pockets within PDLGA-
65, poly LracG, and poly LG microparticles was significantly lower. After an additional week of
incubation, PDLGA-50 lost structural integrity and had become an acid-saturated mass with a
pH << 4.5. Interesting, PLLGA-50 microparticles exhibited a similar distribution of acidity to
PDLGA-50 while maintaining structural integrity.

63
Figure 22. Two-photon microscopy images of the internal acidic microclimate distribution images within PDLGA-
65, poly LracG, and poly LG at later time points; 21, 28, 35, 49, and 59 d. ‡ Ratiometric pH probe response was no
longer discernable from background autofluorescence resulting from dye-leaching. Scale bar = 100 μm.
Between 14 and 21 d, the acidity distribution within PDLGA-65, poly LracG, and poly
LG microparticles remained relatively constant. At 21 d, the frequency of acidic μ-pockets
within poly LracG microparticles had increased, whereas poly LG accumulated acid only around
the periphery of the internal aqueous pores (Fig. 22). The presence of acidic μ-pockets within
PDLGA-65 also increased and acidic μ-channels branching form larger acid filled pores were
also observed. By 28 d, dye levels in poly LG and poly LracG microparticles had decreased to
the point that dye signal could not be distinguished from the background auto-fluorescence.
Despite the absence of dye, however, gross internal structural changes can be observed at 35 d.
At this time the prevalence of open pores within poly LracG increased resulting in microparticle
plasticization after 46 d. In contrast, poly LG microparticles retained their original internal

64
structural features until approximately 11 weeks after which the particles exhibit brittle failure to
give a powder; no prior plasticization is noted (Fig. B8). For PDLGA-65, the frequency and size
of acidic μ-pockets increased during the next 2 weeks and significant plasticization was observed
by 59 d.
3.4.4 Trends in pH distribution for sequenced and random PLGA microparticles
To visualize more clearly how the overall pH distribution evolves within samples containing a
population of particles (n = 10), pH distribution curves for PLGA microparticles were
constructed using pixel intensity ratios. The frequency of a specific pH was plotted against the
internal pH to monitor any changes in the internal pH distribution (Fig. 23). After 3 d of
incubation, the internal pH of all samples remained above pH = 4.5, with the distribution varying
based on sequence and stereochemistry. PDLGA-50 had a significantly narrower distribution,
pH = 4.5 – 5.0 compared to all other samples, pH = 4.5 – 6.0+. After 7 d, the pH shifts towards a
less acidic pH for PDLGA-50 and PLLGA-50 while all other samples remained constant. This
initial shift in pH for PDLGA-50 and PLLGA-50 was immediately followed by a decreased in
pH at 9 d, which continually shifted to a more acidic pH in the following days, 11 and 14. This
behavior was also observed in PDLGA-65 particles but the process was more gradual. The
internal pH for PDLGA-65 particles slowly shifted to a less acidic pH over the second week and
then shifted back towards a more acidic pH in the following 5 weeks. Interestingly, the original
pH distribution was maintained throughout the course of the experiment for poly LG whereas a
slight deviation was observed for poly LracG, favoring a more acidic pH.

65
Figure 23. Contour maps of the internal pH of PLGA microparticles at time points 3, 7, 9, 11, 14, 21, 28, 35, 49 and
59 days: (A1) PDLGA-50, (B1) PLLGA-50, (C1) PDLGA-65, (D1) poly LG, (E1) poly LracG and corresponding
internal pH distribution histograms (A2-E2). *Profile not obtained due to laser mode-locking complications. Data
obtained from images containing multiple microparticles.

66
3.4.5 External morphology changes in sequenced and random PLGAs
Single-emulsion PLGA microparticle controls, without encapsulated dye, were exposed to
physiological conditions over 5 weeks and imaged using SEM to investigate the effects of
monomer sequence and stereopurity on microparticle morphology. Representative images of
microparticles after 7, 14, 21, 28, and 35 d of incubation are displayed in Fig. 24. After single-
emulsion preparation, all microparticles were spherical with non-porous surfaces (Fig. B3).
During the first week of incubation, subtle changes in morphology were observed for PDLGA-
50 microparticles. The surface of PDLGA-50 was slightly textured and small pores had formed
on all PDLGA-50 microparticles. The initial morphology was maintained during this time period
for all other samples. Within 14 d of incubation, the external morphology of PDLGA-50 was
severely compromised with evidence of erosion. Large and small pore networks including small
channels were observed (Fig. 25A). No changes were observed for the remaining samples until
21 d. At this time, PDLGA-50 microparticles have lost all structural integrity and have formed
plasticized masses. The stereopure random analogue, PLLGA-50, no longer retained its
spherical shape and changes in surface texture were also observed. In the following week,
regions of swelling were observed on the surfaces of PLLGA-50 microparticles (Fig. 25C), and
small pores began to form on the surface of poly LracG microparticles. The morphology of
PDLGA-65 and poly LG remained unchanged. After 35 d of incubation, poly LracG
microparticles no longer retained their spherical shape and the frequency of small pores had
increased with some forming a circular network of pores (Fig. 25D). The regions of swelling
remained on the surface of PLLGA-50 microparticle at this time PDLGA-65 and poly LG
remained unchanged (Figs. 25B and 25E).

67
Figure 24. Scanning electron micrographs of sequenced and random PLGAs after 7, 14, 21, 28, and 35 d in vitro
under x350 magnification. *Sample no longer retained structural integrity.

68
Figure 25. Scanning electron micrographs of single particles of PDLGA-50 (t = 14 d) (A), PDLGA-65 (t = 35 d)
(B), PLLGA-50 (t = 35 d) (C), poly LracG (t = 35 d) (D), and poly LG (t = 35 d) (E) under x800 magnification. All
images were taken at 35 d with the exception of PDLGA-50, which only retained a spherical morphology up to 14 d.

69
3.4.6 Foreign body response to microparticle injections
Microparticles of the sequenced copolymer poly LG and the random PDLGA-50 were
subcutaneously injected in mice to monitor the in vivo foreign body response at 2 and 4 weeks
post-injection (Figs. 26 and B9). These polymers were chosen for comparison because they
exhibited a significant difference in acid distribution behavior and degradation profile. The size
and morphology of the single-emulsion blank microparticles were similar as confirmed by SEM
(Fig. B10). Histological analysis of subcutaneous depots of both microparticle formulations
revealed granulomatous foreign-body reactions. Macrophages and neutrophils were present at 2
weeks post-injection, with somewhat greater neutrophil infiltration in poly LG microparticle
depots. By 4 weeks, neutrophils were absent from both particle depots, and foreign-body
reactions were characterized by the presence of macrophage foam cells and multinucleated
Langhans and Touton giant cells. At this time poly LG microparticle depots had noticeably
fewer and less developed multinucleated giant cells compared to PDLGA-50. It is important to
note that in contrast PDLGA-50, which exhibited a significant decrease in the number and size
of particles present by week 4, poly LG microparticle depots had remained stable in the
subcutaneous tissue.

70
Figure 26. H&E staining of subcutaneous tissue microparticle depot injections in C57BL/6J wild-type mice, 2 and 4
weeks after injections (x25). Section 1 and 2 are representative sections of tissue from two different mice. Arrows
indicate presence of foreign body giant-cells. Scale bar = 100 μm.
3.5 DISCUSSION
The current study correlates well with our previous studies on how sequence affects degradation
in PLGAs while providing significant new insights into the reasons and consequences of those
differences. Perhaps the most fundamental finding and one that echoes our prior in vitro
sequence-based hydrolysis studies in both trends and observed degradation times, is that
sequence has a profound influence on the rate of degradation. PDLGA-50, PLLGA-50, poly
LracG, and poly LG, which all have the same 1:1 L:G-composition exhibit dramatically different
hydrolysis profiles. Indeed, random PDLGA-50 fails 8 weeks earlier than the alternating
stereopure poly LG. The alternating sequenced copolymer exhibits a time to failure that more
closely resembles that of the random PDLGA-65, which has a nearly 2:1 L:G-ratio. This

71
behavior is interesting because many prior studies have correlated degradation times with L:G-
ratio and shown that higher L-content translates into slower degradation.9, 29, 95-96, 107-108, 151-153 It
is also clear that stereochemical sequence is important; stereopure versions of both the random
and sequenced copolymer degrade more slowly than the racemic copolymers.
As we have discussed in the context of our previous studies, 60-62 the difference in
hydrolysis rates between G-G, L-G/G-L, and L-L units is one of the most significant contributors
to the range of degradation rates observed (Fig. 27). In random PLGAs, it is well-established that
G-rich blocks degrade much more quickly than L-rich blocks. As a result, random PLGAs are
rapidly cleaved into shorter chains and the acidic by-products from the cleavage can further
accelerate degradation. In contrast, poly LG has only two type of linkages, L-G and G-L, both
with intermediate and similar cleavage rates. Initial cleavage of the chains is, thus, expected to
proceed more slowly and less localization of the cleavage sites and acidic by-products is
expected.
Random PLGA (heterogeneity)
Sequenced PLGA (homogeneity)
only L-G linkages
L-L L-G G-G G-L
G-blockL-block
≈
Increasing rate of hydrolysis
Figure 27. Linkage type(s) and distribution for PDLGA-50 (top) and poly LG (bottom) with relative linkage
hydrolysis rates.

72
The microscopy images acquired in this study increase our understanding of how the
molecular level phenomena, including cleavage rates, affect the morphology, acid microclimate
distribution, and internal structure. The most prominent change observed in the microparticles as
a function of degradation is the shape-distorting plasticization of all the polymers, except poly
LG. The sequence-based differences in this behavior correlate well with molecular weight loss
and the degree of buffer infiltration. With regard to molecular weight, our prior study relating
sequence to properties has shown that the rate of molecular weight loss and the degree of
swelling and erosion for microparticles and implants prepared from these copolymers exhibits
the following trend: PDLGA-50 > PLLGA-50 > poly LracG > poly LG (PDLGA-65 was not
reported in this study but has been characterized relative to PDLGA-50 previously).62, 94-95 Also,
we have seen the plasticization reflected in the broadening and shift of the glass transition
temperatures for PDLGA-50 and poly LracG.60
Buffer infiltration is likely an important contributor to the observed differences in acid
distribution within the particles. The particles that ultimately exhibit low pH throughout the
entire particle, PDLGA-50 and PLLGA-50, are also the ones that exhibited a greater degree of
swelling during the first week of incubation in a prior study. In this study these samples were
found to exhibit an initial increase in their overall internal pH prior after 7 d prior to the onset of
degradation. This early increase in pH, which has been observed previously by Schwendeman
and coworkers,133 can be attributed to a combination of buffer solution penetration with
concomitant neutralization and/or flushing of acidic by-products. We hypothesize that, in the
current study, acid production as a result of hydrolysis then exceeds the intraparticle buffer
capacity leading to the observed delocalized acidity. Consistent with this analysis is the local
acid distribution pattern observed for PDLGA-65, which should both swell less than the random

73
50:50 PLGAs and produce acid more gradually. Poly LG represents the far end of this
continuum, with a small degree of swelling and a lack of fast cleaving G-G sequences.
The initial internal particle structure and dye-loading also differs based on sequence,
which we hypothesize may correlate with structural homogeneity of the PLGA copolymers.
Immediately after preparation, we observe that sequenced-defined poly LracG and poly LG
microparticles exhibit a higher number of internal voids than the microparticles produced from
random PLGAs. Although we did not quantify this parameter, the observation was consistent in
all micrographs and for multiple particle preparations. The second observation that the
sequenced copolymers would not load as much dye as the random copolymers was obvious in
the brightness of the initial images and in the fact that dye levels fell to below observable
concentrations for both poly LracG and poly LG before the particles had failed. In a previous
study, we had also noted that we were able to achieve a higher loading of rhodamine-B into
PDLGA-50 vs. poly LG microparticles. We suggest that these two observations may be related
to the homogeneity of the sequenced copolymers relative to the random analogues. Although we
do not observe multiple Tgs for PDLGA-50, which would indicate microphase separation, the
presence of L- and G-rich blocks must necessarily result in some degree of heterogeneity in the
bulk that will in turn generate areas that have more and less affinity for any solute. The
sequenced chains, which due to their uniformity must be characterized by a single Flory-Huggins
interaction parameter, , will likely favor self-interaction and exclude other possible solutes. In
the case of particle formation, such self-interaction can lead to the exclusion of the organic
solvent used in the preparation of the microparticles. The excluded solvent will coalesce to form
droplets, which will lead to the formation of internal voids. Similarly, the homogeneous
sequenced copolymers would be expected to exhibit a lower tendency to interact with most

74
solutes, including dyes and drugs, relative to the more heterogeneous random PLGAs. We
hypothesize that this phenomenon is responsible for the difficulties that we have experienced in
loading such solutes into poly LG. Although the complete verification of this hypothesis will
require experiments outside the scope of the current study, it is clear that encapsulation
methodologies for sequenced PLGAs should be further optimized.
Our confidence in the sequence-based differences we see using TPM is supported by the
similarity of the behavior we observed for the random copolymers to that reported by both
Schwendeman and Langer. Specifically, in both reports a shift towards higher pH values was
observed after exposure to physiological conditions. This behavior was most prominent for
random PLGA microparticles with a 50:50 L:G-ratio and less for PLGAs with higher L-content
(i.e., 85:15 and 100:0).113, 133, 154 Also, consistent between our studies and others were the
reported pH distribution ranges despite the use of different dyes and microscopic techniques.
Finally, the morphological changes in the current work were consistent with those reported by
Langer and coworkers for PDLGA-50 microparticles.113
Finally, we have observed similarities between in vitro and in vivo microparticle
degradation behaviors for sequenced and random PLGAs, which is of particular importance for
translation because not all characteristics observed in vitro carry over once the material is
implanted. First, we see that the differences in degradation time between PDLGA-50 and poly
LG are preserved in vivo. The PDLGA-50 microparticles have mostly degraded by the end of 4
weeks of implantation whereas the poly LG particles exhibit minimal changes in the same time
period. Secondly, the foreign-body response appears to be diminished for the sequenced poly
LG microparticles. In previous similar studies on random PLGAs, differences in host tissue
response have been associated with changes in microparticle surface chemistry and/or local pH

75
due to polymer degradation.155-160 The TPM studies demonstrated that acid production within the
poly LG particles is minimal in this time period, thus it seems likely that difference in FBGC
response in the current pilot study is primarily due to the variance in degradation rates. Although
further investigation will be required to ascertain the in vivo response to poly LG after longer
time periods, the current acidity studies suggest that acid release within the tissue will be more
gradual and less likely to provoke an inflammatory response.
3.6 CONCLUSIONS
Microscopic analysis, TPM and SEM, of particles prepared from both random and sequenced
PLGAs demonstrates that key in vitro and in vivo properties related to DDS performance (i.e.,
degradation rate, accumulation and percolation of acidic by-products, microparticle morphology,
and foreign body response) can be tuned using precise macromolecular design. These results are
consistent with our prior findings that the loss of molecular weight, increase in dispersity, overall
swelling, thermal transitions, and erosion during hydrolytic degradation are all a function of LG
sequence. In addition, we have confirmed that two-photon microscopy is a viable method for
non-invasive monitoring of internal pH that offers advantages relative to CLSM. Future work
will focus on improving the loading efficiencies and evaluating the stability and release of acid-
sensitive macromolecular payloads for sequence-defined PLGA matrices.

76
4.0 THE EFFECT OF MONOMER SEQUENCE ON THE RETENTION OF
MECHANICAL PROPERTIES DURING HYDROLYTIC DEGRADATION FOR
SEQUENCE-DEFINED POLY(LACTIC-CO-GLYCOLIC ACID)S
4.1 OVERVIEW
This work presented in this chapter provides new mechanistic insights pertaining to the retention
of mechanical properties for sequence-defined and random poly(lactic-co-glycolic acid)
cylindrical matrices. This chapter is being submitted for publication in a peer-reviewed journal
and is summarized in Fig. 28: M.A. Washington, Y. Xue, S. Sant, C. Liu, T.Y. Meyer. “The
effect of monomer sequence on the retention of mechanical properties during hydrolytic
degradation for sequence-defined poly(lactic-co-glycolic acid)s.” 2017.
Figure 28. Graphical abstract for Chapter 4 – The effect of monomer sequence on the retention of mechanical
properties during hydrolytic degradation for sequence-defined poly(lactic-co-glycolic acid)s.

77
Over the past four decades, biodegradable poly(lactic-co-glycolic acid)s (PLGAs) have
had minimal success in long-term load bearing orthopedic applications due to their poor
retention of mechanical properties. While alternative methods such as self-reinforcement and the
addition of synthetic fillers offer initial increases in ultimate strength and modulus, the bulk
properties of random PLGAs rapidly decrease due to random and autocatalytic hydrolysis.
Controlling monomer sequence in PLGAs has been found, however, to exert a strong influence
on a variety of bulk properties including swelling, erosion, and internal acidic microclimate. To
investigate the impact of monomer sequence on the relationship between degradation induced
microstructural changes and macroscopic bulk properties, cylindrical implants (3 mm x 3 mm)
for a set of sequenced and random PLGAs were exposed to physiological conditions over 9
weeks. Microstructural changes were monitored in vitro using differential scanning calorimetry
(DSC), gel permeation chromatography (GPC), 1H NMR spectroscopy, and powder x-ray
diffraction (PXRD) as a function of degradation. The macroscopic mechanical properties,
including compressive modulus (CM) and ultimate compressive strength (UCS) were also
determined. Overall, the sequence-defined PLGAs exhibited longer hydrolytic induction time
periods, τ, and improved retention of mechanical properties compared to random analogues with
the same L:G-composition. It is hypothesized that the differences observed are related to the
mechanism of hydrolytic cleavage, with sequence copolymers favoring a long-period of chain-
end scission prior to the onset of auto-catalytic degradation. Random copolymers, in contrast,
exhibited behaviors consistent with a random-chain cleavage mechanism which, in turn, led to a
faster onset of auto-catalytic degradation and shorter τ.

78
4.2 INTRODUCTION
Biodegradable polyesters, specifically poly(lactic acid) (PLA), poly(glycolic acid) (PGA), and
poly(lactic-co-glycolic acid) (PLGA) have been extensively utilized in various orthopedic and
soft tissue regeneration applications due to their osteo-similar mechanical properties, range of
degradation profiles, and non-toxicity.1, 28, 99, 161-162 Unlike metallic implants, biodegradable
implants do not require a removal surgery, provide adequate support for regenerating tissues, and
degrade at a rate that slowly transfers load to the healing tissues minimizing complications such
as stress shielding.98-99, 163 The initial mechanical strengths of PGA and PLA are similar to that of
cortical bone (i.e., compressive strength of 131 – 224 MPa) while PLGA is comparable to
cancellous bone (i.e., compressive strength of 5 – 10 MPa).161 The retention of mechanical
strengths are strongly influenced by the composition and microstructure of these polymers (i.e.,
L:G-ratio, crystallinity, molecular weight).2, 25, 28, 164 For PLGAs, degradation begins upon in vivo
implantation and the loss of total strength occurs within the first month. This has limited their
use to short-term low-load bearing devices such as sutures, suture anchors, staples, interference
screws, and cellular scaffolds.28, 67, 165-166 While there is considerable evidence that alternative
methods such as self-reinforcement,66, 167-168 addition of nanocomposites,169-173 polymer
blending,174-176 and introducing chemical crosslinks 177-178 address the mechanical deficiencies of
PLGA, methods which produce consistent and predictable time dependent behaviors in the
absence of additives remain to be defined.
Our approach to improving the performance of PLGA devices is to use monomer
sequence to define the hydrolysis profile, lengthening the time over which mechanical properties
are retained without creating a device whose overall degradation is not unacceptably slow. Our
rationale for this approach is based on our recent studies on how sequence affects the overall

79
degradation of various PLGA matrices. We have, for example, demonstrated that sequenced
copolymers exhibit more gradual losses of molecular weight, minimal changes in polymer chain
dispersity, lower degrees of swelling, and slower erosion than random analogues with the same
L:G ratios and molecular weights.60-62, 179 These trends hold for a variety of matrices including
microparticles (2 – 5 and 50 – 150 μm) and compression molded cylindrical implants (3 x 3 and
3 x 1.5 mm). We have also observed sequence-dependent differences in acid distribution within
microparticles, the release profile of rhodamine B, and in the in vivo inflammatory responses to
subcutaneously injected microparticle matrices.60, 179
Importantly, our past studies and the ones reported herein contribute also to a growing
body of work within the synthetic polymer community that is concerned with characterizing
structure/function relationships in sequenced copolymers.180-182 We and others are motivated not
only to address the application-related question posed above but also to develop a deeper
understanding of how sequence affects properties and behavior.33-34, 36, 45 There have been other
reports of sequence effects on bulk properties of biodegradable copolymers that are relevant to
the focus of the current study. In recent reports by both Sarasua and Albertsson and coworkers,
statistical variants of poly(ε-caprolactone-co-δ-valerolactone) and triblock copolymers of L-
lactide, but-2-ene-1,4-diyl malonate, and ε-caprolactone were found to have superior control
over a variety of bulk properties compared to random analogues.78-79, 124, 183 These studies
demonstrate the potential impact of sequence-controlled approaches for tuning the properties of
biodegradable matrices.
In the current study we are interested in exploiting high degrees of sequence control in
PLGA copolymers to expand our understanding of how degradation induced microstructural
changes affect macroscopic bulk properties for sequence-defined PLGAs. Numerous reports

80
have substantiated that random PLGAs initially undergo ester hydrolysis in sterically accessible
glycolic-acid-rich regions.29, 153, 184-185 This preferential hydrolysis leads to an exponential
decrease in molecular weight and concomitant accumulation of lactic acid oligomers. This
pattern is particularly important for the retention of mechanical properties as the lower molecular
weight species produced by ester scission events rapidly lose mechanical properties.
Furthermore, the lower degree of entanglement facilitates increased water absorption leading to
elastic modulus-decreasing plasticization. These behaviors are characteristic of biodegradable
polyesters which are known to follow a bulk erosion mechanism.25, 28, 186-187
Another phenomenon that contributes substantially to the process of degradation is
autocatalytic scission of ester bonds due to the local production and slow clearance of acid by-
products. Autocatalytic hydrolysis results in the heterogeneous degradation of bulk eroding
matrices with diffusion lengths ˃ 10 μm.187 Tomlins and coworkers determined that the rate of
degradation at the center of a specimen is almost an order of magnitude higher than at the
surface.188 This non-uniformity of degradation has been observed in a variety of PLGA matrices
and other polyesters and results in polymodal molecular weight distribution, rapid loss of thermal
properties, and increased rates of swelling due to osmotic gradient formation.184, 187, 189-190
The time scale in which random PLGAs degrade can be tuned to a certain degree through
microstructural manipulations (e.g., increasing L:G-ratio, crystallinity, and molecular weight) or
decreasing the size/shape of the biodegradable device.95, 186, 188, 191-192 These strategies aim to
slow the rate of degradation of PLGA as well as limit the initial diffusion of water into the
matrix. These factors are particularly important as initial water absorption and degradation
induced swelling has been reported to play a decisive role both the mass transport mechanisms of

81
various small molecules (e.g., drugs, water, ions, and degradation products) and retention of
various physicochemical properties (i.e., thermal, mechanical, and morphological).70, 90, 193
In the current study we utilize compression molded cylindrical implants (3 mm x 3 mm)
to evaluate how precise control over monomer sequence effects the relationship between
microstructural changes and the retention of macroscopic bulk properties for PLGAs. First, the
macroscopic bulk mechanical properties (i.e., compressive modulus and ultimate compressive
strength) of wet cylindrical matrices exposed to physiological conditions will be discussed. Then,
changes in microstructural composition monitored by differential scanning calorimetry (DSC),
gel permeation chromatography (GPC), proton nuclear magnetic resonance spectroscopy (1H-
NMR), and powder x-ray diffraction (PXRD) will be compared. Finally, the underlying
molecular mechanism of degradation for sequence-defined PLGAs compared to that of random
PLGA analogues will be discussed.
4.3 MATERIALS AND METHODS
4.3.1 Materials
Poly(D,L-lactide-co-glycolide), acid terminated, with a 50:50 and 65:35 ratio of lactic (L) and
glycolic (G) acid derived units were purchased from Durect corporation (Birmingham, AL) as a
pelletized solids. Prior to fabrication, the polymers were dissolved in methylene chloride
(CH2Cl2), precipitated in methanol (MeOH), and dried in vacuo yielding off-white amorphous
solids. The stereopure random PLGA, poly(L-lactide-co-glycolide), acid terminated, with a 50:50
ratio of L:G-derived units was obtained from Changchun SinoBiomaterials Co. Ltd. (Changchun,

82
China) as a white fibrous solid and was used as provided. Sequenced PLGA copolymers were
prepared using previously reported synthetic methods.55 All sequenced PLGAs were isolated as
either white amorphous solids or white fibrous solids. Phosphate buffered saline (PBS; pH = 7.4;
10 mM; certified nuclease free) was purchased from Molecular Biologicals International, Inc.
(Irvine, CA).
4.3.2 1H and 13C NMR spectroscopy
1H and 13C NMR spectra were obtained in CDCl3 using a Bruker Avance III spectrometer (500
MHz) at 293 K. All chemical shifts were reported in ppm (δ) and referenced to the chemical
shifts of the residual solvent resonances at δ 7.26 ppm (1H) and δ 77.00 ppm (13C).
4.3.3 Differential scanning calorimetry
DSC analysis was performed using a TA Instruments Q200 calorimeter using a scan range of -10
– 200 °C at a rate of 10 °C/min under a nitrogen atmosphere with a flow rate of 20.0 mL/min.
Glass transition temperatures (Tg) were calculated as the half Cp extrapolated.
4.3.4 Gel permeation chromatography
Molecular weights and dispersities were acquired using a Waters 717 plus autosampler system
(THF, 1 mL/min, 40 °C) equipped with a Waters 2412 refractive index (RI) detector and two
styrene-divinylbenzene columns (porosity = 1000 and 100000 Å; Polymer Standard Services).

83
The RI detector was calibrated using a 9-point calibration based on polystyrene standards
(ReadyCal Kit, Polymer Standard Services).
4.3.5 Fabrication of PLGA cylindrical constructs
PLGA cylinders were prepared using heated compression molding in a custom 12 port stainless
steel press. Raw polymer (42 – 45 mg) was added to each port of the press which was heated to
20 – 30 °C above the Tg. The samples were compressed for 40 min with a 7,000 lb load using a
Carver press (Hydraulic unit model #3912; Wabash, IN) which was heated to 90 – 100 °C. After
compression the press was cooled under load to ~34 – 40 °C. The resulting pellets were
translucent or opaque depending on the identity of the polymer. The height and width of the
specimens were measured using digital calipers with a capability of measuring +/- 0.01 mm.
Cylinder masses were recorded using an analytical balance with a 1.0 x 10⁻⁴ g uncertainty.
4.3.6 Compression testing methodology
Samples were exposed to physiological conditions (PBS, pH = 7.4, 37 °C, 50 RPM) using a
shaker incubator (Lab-Line Orbit Incubator-shaker) over a 9 week time period. After each time
point degraded samples (n = 3) were removed from the buffer solution and immediately
subjected to uniaxial compression testing. Wet PLGA cylinders were tested at ambient
temperature (23 ± 2 °C) and relative humidity (45 ± 5 %) using an MTESTQuattro universal
tester (ADMET, Norwood, MA) equipped with a 1 kN load cell operated at a crosshead speed of
0.1 mm/min with a sampling rate of 1 sample/second. The load was applied to the specimen until
the yield point was reached or to 45 – 50 % its original thickness if no yield point was observed.
84
The compressive modulus (CM) and ultimate compressive strength (UCS) were determined as
the initial slope (5 – 15 % strain) and the maximum stress at the yield point, respectively. In the
absence of a yield point the maximum stress was calculated using the stress at 10 % deformation.
All values are reported as the average ± standard error of mean.
4.3.7 In vitro thermal properties and molecular weight changes
The changes in thermal properties and molecular weight distribution during degradation were
monitored using differential scanning calorimetry (DSC) and gel permeation chromatograph
(GPC). PLGA cylinders were removed from the buffer every week for 9 weeks, rinsed 3x with
deionized water, flash frozen with liquid nitrogen and lyophilized for 3 d (VirTis Benchtop K
freeze dryer, Gardiner, NY; operating at 100 mTorr) prior to testing.
4.3.8 Powder x-ray diffraction
Samples which formed powders during degradation were loaded into quartz capillary tubes (φ =
1.0 mm) prior to goniometer head mounting. The crystallinity of the PLGA powders were
evaluated at room temperature with a Bruker X8 Prospector Ultra diffractometer equipped with
an APEX II CCD detector and an IμS microfocus Cu Kα source; 45 kV and 0.65 mA (λ =
1.54178 Å). The diffractograms were recorded at a detector distance of 15 cm. PXRD patterns
were acquired using the APEX II software package using the PILOT plug-in and were processed
using Match! phase identification software to obtain intensity versus d-spacing (Å) plots.

85
4.4 RESULTS
4.4.1 Naming conventions and characterization of PLGA copolymers
The sequence-defined PLGA copolymers utilized in this study were prepared using segmer
assembly polymerization (SAP, Fig. 29 & C1). Using this method, discrete monodisperse
sequenced oligomers termed “segmers” are polymerized using condensation conditions which
preclude detrimental sequence-scrambling transesterification side-reactions.55 It is important to
note that the synthetic method has been optimized to produce copolymers with a very high
degree of sequence fidelity.147 PLGA copolymers synthesized using SAP are named based on
their input segmer, C-side to O-side, where the L-lactic unit, racemic lactic unit, and glycolic unit
are abbreviated as L, Lrac, and G, respectively. As such, a segmer consisting of a racemic lactic
and glycolic acid-derived unit, would be termed LracG and the periodic copolymer would be
named poly LracG. These copolymers are termed “periodic” or “sequence-defined” as they
consist of a nearly perfect repetition of the input segmer. The sequence and stereopurity of all
sequence-defined copolymers was confirmed via 1H and 13C NMR (Fig C2 – C15). The
purchased random copolymers, PDLGA-50, PLLGA-50 and PDLGA-65 were prepared via
ring-opening polymerization (ROP, Fig 29) whose names are derived from their input L:G-ratio
and respective lactide stereochemistry. Using this convention, the PDLGA-50 and PLLGA-50
copolymers are the racemic and stereopure versions of a random PLGA with a 50:50 L:G-ratio
and PDLGA-65 is the racemic random PLGA derivative with a 65:35 L:G-ratio. The molecular
weights of sequence-defined PLGAs and purchased random PLGA controls were comparable, 17
– 30 kDa (Table 3). All PLGAs were amorphous with Tgs ranging from 46 – 57 °C after heated
compression molding (Table 3).

86
Figure 29. Segmer assembly polymerization (SAP) methodology for synthesizing sequenced-defined PLGAs, poly
LG and poly LracG, in addition to the ring-opening polymerization (ROP) of random PLGAs.

87
Table 3. PLGA characterization data for sequence-defined and random PLGA analogues.
Polymer Mna (kDa) Mw
a (kDa) Đa Tg (°C)b ratio L:Gc
Poly LG 22.7 32.1 1.4 48 50:50
Poly LracG 30.2 44.8 1.5 50 50:50
Poly GLLG 16.8 24.6 1.4 48 50:50
Poly LLG 28.9 41.0 1.4 57 66:34
PDLGA-50 21.6 29.5 1.4 46 51:49
PLLGA-50 19.3 29.3 1.5 48 54:46
PDLGA-65 28.2 42.6 1.5 47 65:35
a Determined by size exclusion chromatography in THF relative to polystyrene
standards. b Obtained in the first heating cycle at 10 °C/min after heated compression molding. c Results based on 1H NMR spectroscopy and presented as the ratio of the lactic (L)
and glycolic (G) units.
4.4.2 Mechanical properties of sequenced and random PLGA cylindrical constructs
Degradation induced changes in mechanical properties for a set of four sequenced PLGAs and
three random analogue PLGAs were measured using a uniaxial compression testing method over
a 9-week time period in vitro. The height and width of the cylindrical test samples prepared via
heated compression molding were 3.31 ± 0.02 mm and 3.34 ± 0.01 mm, respectively, with an
average mass of 34.3 ± 0.2 mg (n = 380). Mechanical properties, compressive modulus (CM)
and ultimate compressive strength (UCS), were measured on the wet cylinders (3 samples per
time point). The CM and UCS as a function of time are reported in Fig. 30 as the average ±
standard error of mean. Representative stress-strain curves for all PLGAs are included in Fig.
C16.

88
0 7 14 21 28 35 42 49 56 63 70
0
20
40
60
80
100poly LLG
poly LG
poly GLLG
poly LracG
PDLGA-65
PLLGA-50
PDLGA-50
UC
S (
MP
a)
Time (Days)
0 7 14 21 28 35 42 49 56 63 70
0
50
100
150
200
250
300poly LLG
poly LG
poly GLLG
poly LracG
PDLGA-65
PLLGA-50
PDLGA-50C
om
pre
ss
ive
Mo
du
lus
(M
Pa
)
Time (Days)
A
B
Figure 30. Compressive modulus (CM) (A) and ultimate compressive strength (UCS) (B) versus degradation time
for sequenced and random PLGA copolymers. Solid (sequenced PLGAs) and dotted (random PLGAs) lines were
fitted using a 1st order binomial smoothing algorithm and error bars represent ± standard error of mean (n = 3).
The initial CM and UCS for all PLGAs were similar, 250 ± 10 MPa and 68 ± 14 MPa,
respectively. However, during the course of the experiment, sequenced PLGAs retained their
mechanical properties over longer time periods compared to their random analogs. The retention

89
of mechanical properties for sequence-defined PLGAs ranged from 3 – 9 weeks compared to 1 –
2 weeks for all random PLGAs. Initial decreases in CM and UCS were observed after 2 d of
incubation for all PLGAs, with the exception of poly LLG. At this time, the CM and UCS of the
random PLGAs decreased by 66 ± 12 MPa and 47 ± 14 MPa, respectively. Comparatively, the
CM and UCS for sequenced PLGAs decreased by 30 ± 4 MPa and 19 ± 8 MPa, respectively.
Throughout the first week of degradation both CM and UCS for the 50:50 L:G-ratio random
PLGAs, PDLGA-50 and PLLGA-50, consistently decreased to 90 % and 95 % of their initial
values by 4 d, respectively. The mechanical properties for PDLGA-65 gradually decreased from
199 – 158 MPa (CM) and 34 – 22 MPa (UCS) prior to failure at 11 d in contrast to the 50:50
L:G-ratio random PLGAs. All sequence-defined PLGAs showed insignificant changes in
mechanical properties during this time period (i.e., 2 – 14 d) with an average CM and UCS of
214 ± 13 MPa and 39 ± 6 MPa.
Sequenced based changes in mechanical properties were observed after 21 d in vitro. At
21 d, a rapid decrease in mechanical properties for poly LracG was observed and correlated to
CM and UCS losses of 175 MPa and 31 MPa, respectively. In contrast, the mechanical properties
for poly LG and poly GLLG were retained for 5 weeks prior to gradually decreasing over the
subsequent 3 weeks. More significant changes in CM and UCS were observed for poly GLLG
than poly LG during this time. It is important to note that the failure mechanism of poly LG
shifted from a ductile mechanism to a brittle failure mechanism after 35 d in vitro (Fig. C17).
This behavior was not observed for any additional PLGAs; however, PLLGA-50 and poly LracG
did form powders after 35 d which were similar to that of poly LG after 63 d. At 42 d, the CM
and UCS for poly GLLG decreased to 70 % and 79 % of their initial values whereas poly LG

90
only decreased by 31 % and 61 %. No significant changes in CM or UCS were observed for poly
LLG over the 9 week experimental time period, 245 ± 2 MPa and 62 ± 2 MPa, respectively.
4.4.3 Thermal properties for sequence-defined and random PLGAs as a function of
degradation
To understand the relationship between the thermal properties of PLGAs and their degradation,
additional differential scanning calorimetry (DSC) analysis was performed on sequence-defined
and random PLGA analogues over a 9 week time period after being exposed to physiological
conditions. DSC thermograms for lyophilized samples over the course of 9 weeks of degradation
are reported in Fig. 31, where the first heating cycles are displayed to reflect the in situ thermal
properties of the cylinders after hydrolysis.

91
Figure 31. Differential scanning calorimetry thermograms of random (A) and sequenced (B) PLGAs as a function
of degradation time. *Crystallinity was analyzed using x-ray diffraction.
A
020
40
60
80
100
120
140
160
180
200
Te
mp
era
ture
(oC
)
Heat Flow (Endotherm Up)
PD
LG
A-5
0
0 7
14
21
28
35
Time (days)
020
40
60
80
100
120
140
160
180
200
Te
mp
era
ture
(oC
)Heat Flow (Endotherm Up)
PL
LG
A-5
0
0 7
14
21
28
35
42
49
Time (days)
020
40
60
80
100
120
140
160
180
200
Te
mp
era
ture
(oC
)
Heat Flow (Endotherm Up)
PD
LG
A-6
5
0 7
14
21
28
35
42
Time (days)
020
40
60
80
100
120
140
160
180
200
Te
mp
era
ture
(oC
)
Heat Flow (Endotherm Up)
po
ly L
LG
0 7
14
21
28
35
42
49
56
63
Time (days)
020
40
60
80
100
120
140
160
180
200
Te
mp
era
ture
(oC
)
Heat Flow (Endotherm Up)
po
ly G
LL
G
0 7
14
21
28
35
42
49
56
63
Time (days)
020
40
60
80
100
120
140
160
180
200
Te
mp
era
ture
(oC
)
Heat Flow (Endotherm Up)
po
ly L
G
0 7
14
21
28
35
42
49
56
63
Time (days)
020
40
60
80
100
120
140
160
180
200
Te
mp
era
ture
(oC
)
Heat Flow (Endotherm Up)
po
ly L
racG
0 7
14
21
28
35
42
49
Time (days)
B
* **
* *** **

92
The initial thermograms for all PLGAs displayed a single phase transition, Tg ranging
from 46 – 58 °C. Dramatic differences in thermal property retention can be seen in the
comparison of the DSC traces for random PLGAs, Fig. 31A, and sequenced PLGAs, Fig. 31B.
Within the first week of incubation 50:50 L:G-ratio random PLGAs no longer retained their
virgin thermal properties. At this point the Tgs approached 37 °C and additional melting
transitions appeared at ~ 70 °C for PLLGA-50. Sequenced PLGAs retained their original
amorphous thermal properties with the exception of poly LLG which exhibited semi-crystalline
behavior with a Tm of ~ 110 °C. In the subsequent weeks, degradation induced changes in
thermal properties were most prominent for random PLGAs. The Tgs of these samples rapidly
decreased below physiological temperature by 21 d and high temperature melting transitions
(130 – 170 °C) evolved in the racemic random PLGAs. During this time period, no changes in
thermal properties were observed for all sequence-defined PLGAs. However, the Tg for poly
LracG drastically decreased and broad melting transitions were observed from 70 – 130 °C at 21
d. It is important to note that the Tg for poly LracG was difficult to identify at this time due to the
presence of broad melting transitions which may have overlapped with a Tg. Similar broad
melting transitions were also present for poly LG after 35 d, however, a clean but slightly shifted
Tg remained. After 35 d, all random racemic PLGAs exhibited semi-crystalline behaviors with
Tgs < 10 °C and Tms spanning 115 – 175 °C in contrast to the random stereopure PLGA,
PLLGA-50, which was crystalline with broad Tms ranging from 50 – 125 °C. Sequenced
stereopure PLGAs retained their original thermal properties over this time period (i.e., 0 – 35 d).
At 7 weeks, the glass transition temperatures for poly LG and poly GLLG began to decrease
and differences in thermal behaviors between these samples were observed. Poly LG appeared
semi-crystalline with a Tg of 48 °C and Tms of 77 and 97 °C whereas poly GLLG was

93
amorphous with a Tg of 48 °C. In the subsequent weeks the degree of enthalpic relaxation
decreased for these copolymers, exemplified by a Tg which no longer appeared as a peak. During
week 7, the Tg for poly GLLG slowly shifted to 28 °C whereas the Tg for poly LG was ~ 40 °C.
A clear Tg was no longer present for poly LG during weeks 8 – 9; however, large Tms were
observed. Over the course of 9 weeks, poly LLG remained semi-crystalline with a Tg of 60 °C
and Tm of 102 °C.
4.4.4 Molecular weight distributions for sequence-defined and random PLGAs as a
function of degradation
Trends in degradation were further characterized using gel permeation chromatography (GPC).
Molecular weight profiles for sequence-defined and random PLGAs over the course of 9 weeks
of degradation are shown in Fig. 32.

94
Figure 32. Gel permeation chromatography chromatograms of random (A) and sequenced (B) PLGAs as a function
of degradation time.
810
12
14
16
18
20
22
0.0
0.2
0.4
0.6
0.8
1.0
1.2
Normalized Intensity
Elu
tio
n T
ime (
min
)
0 d
7 d
14 d
21 d
28 d
35 d
PD
LG
A-5
0
810
12
14
16
18
20
22
0.0
0.2
0.4
0.6
0.8
1.0
1.2
Normalized Intensity
Elu
tio
n T
ime (
min
)
0 d
7 d
14 d
21 d
28 d
35 d
42 d
PD
LG
A-6
5
810
12
14
16
18
20
22
0.0
0.2
0.4
0.6
0.8
1.0
1.2
Normalized Intensity
Elu
tio
n T
ime (
min
)
0 d
7 d
14 d
21 d
28 d
35 d
42 d
49 d
PL
LG
A-5
0
B
A
810
12
14
16
18
20
22
0.0
0.2
0.4
0.6
0.8
1.0
1.2
Normalized Intensity
Elu
tio
n T
ime (
min
)
0 d
7 d
14 d
21 d
28 d
35 d
42 d
49 d
56 d
63 d
po
ly G
LL
G
810
12
14
16
18
20
22
0.0
0.2
0.4
0.6
0.8
1.0
1.2
Normalized Intensity
Elu
tio
n T
ime (
min
)
0 d
7 d
14 d
21 d
28 d
35 d
42 d
49 d
56 d
po
ly L
racG
810
12
14
16
18
20
22
0.0
0.2
0.4
0.6
0.8
1.0
1.2
Normalized Intensity
Elu
tio
n T
ime
(m
in)
0 d
7 d
14 d
21 d
28 d
35 d
42 d
49 d
56 d
63 d
po
ly L
LG
810
12
14
16
18
20
22
0.0
0.2
0.4
0.6
0.8
1.0
1.2
Normalized Intensity
Elu
tio
n T
ime (
min
)
0 d
7 d
14 d
21 d
28 d
35 d
42 d
49 d
56 d
63 d
po
ly L
G

95
Initial molecular weights for all PLGAs were similar. Significant reductions in molecular weight
and dispersity were observed over shorter time periods for all random PLGAs. The molecular
weights for random PLGAs consistently decreased in an exponential fashion while dispersity
concomitantly increased throughout 0 – 28 d. The molecular weight profiles for random PLGAs
during this time period shifted from a monomodal to a slightly polymodal distribution. The
periodic sequenced PLGAs, with the exception of poly LracG, preserved their initial molecular
weight profiles during this time period. A drastic decrease in molecular weight and increase in
dispersity was observed at 21 d for poly LracG, while maintaining a monomodal distribution.
After 35 d, the molecular weights of random PLGAs plateaued in low molecular regions and
dispersity subsequently decreased. Interestingly, higher molecular weight oligomers, ≈ 10 % of
the original molecular weight remained for PLLGA-50, whereas the random racemic PLGAs
were ≈ 4 % of Mn(0). Similar behaviors were observed for poly LracG at later time points. The
molecular weight profiles for stereopure sequenced defined PLGAs slightly decreased over 35 d
of incubation while retaining their original dispersities. Significant shifts in molecular weight for
poly GLLG and poly LG occurred during week 6 and week 7, respectively. Minimal changes in
dispersity were observed during these time points. At 63 d the molecular weight profiles for poly
GLLG and poly LG shifted to a polymodal distribution. No significant changes in molecular
weight or dispersity were recorded for poly LLG; however, unique peaks corresponding to high
molecular weight aggregates were present in the GPC traces for this sample throughout the
hydrolytic time period.

96
4.4.5 Characterization of hydrolyzed PLGAs using 1H-NMR
The composition of sequence-defined and random PLGA copolymers as a function of
degradation were characterized using proton nuclear magnetic resonance spectroscopy over a 9
week time period. 1H-NMR spectra displaying the chemical shift regions of δ 5.6 – 3.4 ppm and
δ 1.8 – 1.3 ppm for all PLGAs as a function of time are included in Figs. C18 – C31. These
chemical shift regions contain resonances associated with the methine, methylene, and methyl
groups of PLGA. Additional end-group associated resonances appear over the course of
degradation in the region of δ 4.5 – 4.2 ppm. An example data set containing only the methine
and methylene resonances for PDLGA-50 and poly LG is included in Fig. 33.

97
0 d
7 d
14 d
21 d
28 d
35 d
42 d
49 d
56 d
63 d
A B
Methine proton resonances
(δ 5.3 – 5.1)
Methylene proton resonances
(δ 4.9 – 4.6)
End-groups of degradation products
(δ 4.5 – 4.2)
Figure 33. 1H NMR comparison in the region of δ 5.4 – 4.1 ppm for PDLGA-50 (A) and poly LG (B) over the
course of 63 d in vitro hydrolysis.
In examining the 1H NMR spectra, it can be seen that the microstructural composition of
random PLGAs rapidly changes over the course of degradation compared that of sequence-
defined samples. Significant changes in L:G-ratio and the production of hydrolytically generated
end-groups occurred more readily for random PLGAs. The L:G-ratios for random PLGAs
gradually increased over 42 d exemplified by the prevalence of L-methine resonances (δ 5.3 –
5.1 ppm) and concomitant decreases in G-methylene resonances (δ 4.9 – 4.5 ppm). The rate at
which this transition occurred followed the trend of: PDLGA-50 > PLLGA-50 > PDLGA-65.

98
After 42 d, the composition of PLLGA-50 was predominately L-units, which remained
unchanged over the subsequent 2 weeks. Sufficient sample quantities for 1H NMR spectrum
acquisition was no longer present for the random racemic PLGAs during this time period. In
contrast to the random PLGAs, the L:G-ratio for sequence-defined PLGAs remained unchanged
over the course of degradation.
The 1H NMR spectra for random PLGAs were also observed to contain larger quantities
of hydrolytically generated end-groups resonances compared to those of sequence-defined
PLGAs. These resonances appeared during the first week of hydrolysis for all random PLGAs at
δ 4.5 – 4.2 ppm. Throughout the first 4 weeks of degradation, end-group associated resonances
gradually increased prior to decreasing in the subsequent weeks. The frequency of end-group
associated resonances was greatest for random racemic PLGAs, PDLGA-50 and PDLGA-65,
compared to the random stereopure PLGA, PLLGA-50. End-group associated resonances were
not observed in the 1H NMR spectra for sequence-defined PLGAs until week 5. At this time,
end-group resonances slowly evolved for poly LracG and poly GLLG in contrast to poly LG
and poly LLG, which remained unchanged. At 56 and 63 d, changes in the 1H NMR spectra for
poly LracG, poly GLLG, and poly LG were observed. No changes were observed for poly LLG
throughout the course of the experiment.
4.4.6 Degradation induced crystallinity characterized using powder x-ray diffraction
PXRD diffractograms showing the calculated d-spacing (Å) for PLLGA-50, poly LracG, and
poly LG are shown in Fig. 34. It is therefore confirmed that PLLGA-50 and poly LracG
maintain their respective semi-crystalline structures over the period of 35 – 49 d. In comparison,
poly LG underwent phase changes from week 7 to week 9, indicated by emergence and

99
disappearance of peaks on the diffractograms. This observation implies that progressive
degradation of poly LG can lead to re-organization of molecular packing patterns. It is
noteworthy to mention that additional peaks corresponding to crystallized salt from the
phosphate buffer are occasionally observed in the diffractograms.
2 3 4 5 6 7 8
Inte
ns
ity (
A.U
.)
2 3 4 5 6 7 8
Inte
ns
ity (
A.U
.) 35 d
42 d
49 d
Phosphate
Buffer
PLLGA-50
35 d
42 d
49 d
Phosphate
Buffer
poly LracG
2 3 4 5 6 7 8
Inte
ns
ity (
A.U
.)
d-Spacing (Å)
49 d
56 d
63 d
Phosphate
Buffer
poly LG
d-Spacing (Å)
Figure 34. Powder x-ray diffraction diffractograms of PLLGA-50, poly LracG, and poly LG at various time points
during the latter stages of degradation.

100
4.5 DISCUSSION
The dependence of the degradation properties of PLGAs on sequence is unmistakable and the
data in this study correlate well with our prior studies. In particular, we found that PLGAs with
identical L:G-ratios but different monomer arrangements exhibited dramatically different
hydrolytic degradation profiles. The sequenced copolymers lost molecular weight more
gradually and retained morphology and bulk mechanical properties for a longer period of time
relative to their random analogues. In addition, we observed differences in behavior between
sequenced copolymers with differing monomer arrangements and stereochemistry. Sequenced-
defined PLGAs which possessed no fast-hydrolyzing G-G linkages (i.e., poly LLG and poly
LG) were found to degrade more gradually than those in which G-G connections were present,
(e.g., poly GLLG). In addition, stereopure sequenced-defined PLGAs retained their properties
over longer time periods compared to racemic analogues (i.e., poly LG vs. poly LracG). These
results are consistent with our previously published results of similarly sized cylindrical implants
and smaller microparticle matrices.60-62, 179
It is important to note that while the thermal and mechanical properties of these polymers
differ significantly as a function of degradation, the initial values of these properties were
relatively independent of microstructural composition. The fundamental interchain interactions
that control free volume do not appear to depend significantly on the order of the monomers
within the chain. Immediately after fabrication, the samples are amorphous and the Tgs of
samples with the same L:G ratio and molecular weight are similar. Although most samples
develop some crystallinity later in the degradation, the molecular weight profiles at these time
points suggest that the crystals comprise primarily oligomers with Mn(t) ≤ 0.10 Mn(0). The

101
stability and composition of these crystalline oligomers were observed to depend on sequence
and stereochemistry as illustrated by the DSC thermograms and 1H-NMR spectra. Sequence-
defined PLGA oligomers retained their original repeat unit sequence with minimal sequence
scrambling throughout the degradation period whereas the oligomers produced from random
PLGAs shifted composition such that at later time points the samples comprised primarily L-
units. In addition, sequenced and random stereopure PLGAs were observed to persist over longer
time periods as higher molecular weight oligomers compared to their racemic analogues.
Moreover, in the latter points of degradation, the failure mode of racemic PLGAs was primarily
ductile whereas stereopure PLGAs has minimal plastic deformation which was accompanied by
brittle fracture.
In order to understand the origin of the sequence-based differences in behavior it is useful
to consider the relationship of the various properties as a function of degradation time. Based on
the data reported herein, our previously reported findings,60-62, 179 and poly(-hydroxy acid)
degradation studies reported by others,28, 84, 94-95, 99, 184-185, 188, 191-192, 194 the properties of solid
matrices can be seen to follow the general multi-phase trend pictured in Fig. 35. Here, Phase I of
degradation involves the diffusion of water into the construct while molecular weight and Tg are
maintained; this induction period, designated defines, in many aspects, the time periods
involved for later changes. In the second phase, molecular weight decreases due to hydrolysis in
a linear fashion prior to transitioning into an exponential decrease due to the
aggregation/crystallization of lower molecular weight components. During Phase III, sufficient
polymer chain ends and oligomers have been produced to auto-catalytically enhance degradation,
molecular entanglement reaches a critical minimum, and water diffusion increases due to the
formation of osmotic gradients. Data from the current study and prior studies demonstrate these

102
changes.34, 62, 179 In particular, we and others have noted previously that swelling occurs only
after a significant loss of molecular weight. In the current study, moreover, we observed a
correlation between the onset of swelling and the loss of mechanical properties. The initiation of
Phase IV occurs only after mechanical properties have reached a minimum, swelling has reached
a maximum, and chains have become small enough to become solubilized in water. This multi-
phase degradation profile has been observed for biodegradable polyesters.186, 194-195
Figure 35. Multi-phase degradation behavior of PLGAs, where Δ1 and Δ2 represent differences in property retention
times, depend on the microstructural composition of the copolymer, and are not equivalent.
Importantly, the difference in behavior between sequence-defined PLGAs appears to be
in the length of the hydrolytic induction time period, . During this period, small reductions in all
properties are observed. Once molecular weight begins to decrease (and the rate of the drop does
also depend on sequence although not as strongly), other molecular-weight dependent properties
change rapidly (i.e., thermal, mechanical, morphological). We therefore propose that sequenced-

103
based differences in are largely responsible for the variations in mechanical property retention
for these PLGAs.
We hypothesize that the difference in the observed ’s correlates with the molecular
mechanism of chain scission and further that the dominant mechanism varies with sequence. In
the current study we observe that poly LG, poly GLLG, and poly LLG exhibit similar
degradation patterns. These samples retain their mechanical properties over longer time periods,
gradually lose molecular weight while maintaining their initial dispersity, have slight changes in
Tg over time prior to plasticizing or crystallizing, and have minimal changes in their 1H-NMR
spectra. These behaviors are consistent with a chain-end scission mechanism, which due to the
relatively slow accumulation of acid, does not become auto-catalytic for a period of time
depending on composition (Fig. 36). It has been established that PLA degrades according to this
profile as reported by Bikiaris and coworkers.196 In addition, Gleadeall and Antheunis have
shown by modeling that chain-end scission would be expected to give the molecular weight loss
patterns similar to those observed for our sequence-defined PLGAs and more generally for many
homopolyesters.194, 197-199 In contrast, the more heterogeneous random copolymers PLLGA-50,
PDLGA-50, and PDLGA-65 exhibit a degradation pattern that is more consistent with random
chain scission mechanisms. Specifically, all show a rapid production of end-group associated
resonances, a decrease in G-related 1H-NMR signals, rapid loss of molecular weight, and
increases in dispersity.

104
Random PLGA Sequenced PLGA
T1
T2
T5
T3
T4
T6
T7
Au
toc
ata
lyti
cN
on
ca
taly
tic
Time
τ
T1'
T2'
T5'
T3'
T4'
T6'
T7'E
nd
sc
iss
ion
Au
toc
ata
lyti
c
Time
τ'
Figure 36. Degradation scheme for random and sequenced PLGA copolymers as a function of hydrolysis time
where time T ≠ T' and τ ≠ τ'
, as these parameters depend on the microstructural composition of the copolymer.
Colors correspond to specific hydrolysis mechanisms (i.e., noncatalytic (yellow), autocatalytic (green), and end-
scission (red)). Oligomeric crystallization is represented in T7 and T7'.
The molecular mechanism contribution to the degradation profile may also be
synergistically enhanced by differences in intermolecular packing between the more and less
regular polymers and variations in chain-end occupancy volumes.84 This enhancement could
explain, in part, why poly LracG degrades more rapidly than the stereopure analogue. Although
not clearly reflected in the Tgs (48 °C, poly LG vs. 50 °C, poly LracG as prepared without
significant annealing) it seems likely that the stereopure analog would pack more uniformly and
inhibit to some degree random chain scission. Based on this reasoning, all sequened copolymers
may, in general, be expected to favor chain-end scission. With our current data, we cannot,
however, determine to what degree differences in chain packing contribute to the observed
degradation pattern.

105
4.6 CONCLUSIONS
This study provides valuable insight into the influence of microstructural chain scission events
and macroscopic bulk properties for sequenced PLGAs. The experimental results presented in
this study correlate well with our previously reported findings regarding the swelling, erosion,
and degradation behaviors of sequence-defined and random PLGA matrices. It was shown that
sequence-defined PLGAs retain their mechanical properties over significantly longer induction
time periods compared to random PLGAs with that same L:G-ratio. We have identified that the
molecular mechanism of degradation for sequence-defined PLGAs primarily proceeds through
end-scission events which strongly influences the retention of macroscopic bulk properties. This
mechanism differs from conventionally used random PLGAs which degrade through non- and
auto-catalytic hydrolysis. These experimental observations support previously published
computation models and in vitro PLGA degradation studies. Future work will focus on
developing a deeper understanding of the in vivo performance of sequence-defined PLGAs as
craniomaxillofacial fixation devices.

106
5.0 PROSPECTUS
Using sequence-defined PLGAs, Li and Washington both observed low and inconsistent loading
efficiencies of various target molecules using W/O/W and O/W emulsion methods. These
encapsulation methodologies have been optimized for random PLGAs. There is considerable
evidence to support the conclusion that sequence-defined PLGAs favor more uniform packing
and have smaller chain occupancy volumes compared to random PLGAs. Therefore, future work
will focus on developing optimized conditions for drug encapsulation. We are particularly
interested in investigating the effects of molecular weight, polymer concentration, preparation
temperature, and solvent evaporation time which all have been previously reported to influence
the internal morphology, glass transition temperatures, drug distribution, and release profiles for
PLGA microparticles.200 Additional methods for improved drug loading have also been reported
by Smith, Schwendeman, Elaissari and coworkers.201-204
Increasing the loading efficiencies for sequence-defined PLGA microparticle matrices is
of particular interest as Li et al. observed slower and more gradual rhodamine B release rates
from sequence-defined PLGA microparticles. Optimization would allow us to investigate the in
vivo release of a target molecule that would benefit from a controlled gradual release profile. We
hypothesize that sequence-defined PLGAs would efficiently deliver daunorubicin, an antibiotic
drug for treatment of proliferative vitreoretinopathy, a complication resulting from retinal
detachment. In this application, repeat ocular proliferation is not desired, therefore the release of

107
daunorubicin must be gradual and controlled within the therapeutic treatment window. In
addition, the release and accumulation of acidic by-products from sequence-defined PLGA
microparticles occurs at a significantly slower rate compared to random PLGAs. This is
particularly advantageous as changes in the pH of the vitreous are known to be detrimental to
intraocular tissues.205-206
We are also interested in exploring the interactions between sequence-defined PLGAs
and large macromolecules such as peptides and proteins. We hypothesize that polymer-protein
sequence affinities may enhance the loading efficiencies and offer a more controlled delivery of
valuable macromolecular payloads. Applications which would benefit from the high-loading and
controlled delivery of peptides and proteins include the treatment of cancer, endometriosis, and
diabetes. To test this hypothesis we will utilize an anti-angiogenic protein which is utilized for
the treatment of lung cancer, endostar.207 Currently, a therapeutic effect of this protein is only
achieved after multiple high dose injections.208 Using computational modeling, we will screen
various PLGA sequences to identify viable candidates, which have high copolymer-endostar
affinities. In a pilot in vitro study we will determine the loading efficiencies, monitor the release
of endostar from various sequence-defined PLGA microparticle matrices, and evaluate the
conformational stability of endostar upon release. As endostar is a recombinant human
endostatin with a nine-amino acid tag (i.e., MGGSHHHHH), we are also interested in exploring
the effects of end-capping sequence-defined PLGAs with a MGGSHHHHH depsipeptide
derivative to enhance polymer-endostar interactions, prolong microparticle degradation rates,
and promote a more gradual release profile.

108
APPENDIX A
Supporting Information for Chapter 2
Figure A1. Synthesis of orthogonally protected lactic and glycolic acid building blocks, tert-butyldiphenylsilyl
protected alcohols (A) and benzyl protected carboxylic acids (B), and segmer assembly methodology of simple (C)
and complex (D) sequenced poly(lactic-co-glycolic acid)s.

109
7 8 9 10 11 12 13 140
20
40
60
80
100 PDLGA-50
PDLGA-65
PLLGA-50
R-SAP
poly GLG
poly GLLG
poly LracG
poly LG
No
rmali
zed
In
ten
sit
y
Retention Time (min)
Figure A2. Gel permeation chromatography (GPC) chromatograms of sequenced and random PLGAs acquired
using a THF mobile phase, calibrated relative to polystyrene standards.

110
0 25 50 75 100 125 150 175 200
0
2
4
6
8 PDLGA-50
PDLGA-65
PLLGA-50
R-SAP
Poly GLG
Poly GLLG
Poly LracG
Poly LG
Heat
Flo
w (
en
do
the
rm d
ow
n)
Temperature (C)
Figure A3. Differential scanning calorimetry (DSC) thermograms of sequenced and random PLGAs acquired from
the second heating cycle at a rate of 10 °C/min.

111
Figure A4. 1H NMR (500 MHz, δ 9.0 – 0.0 ppm) of 50:50 poly(D,L-lactide-co-glycolide) (PDLGA-50)
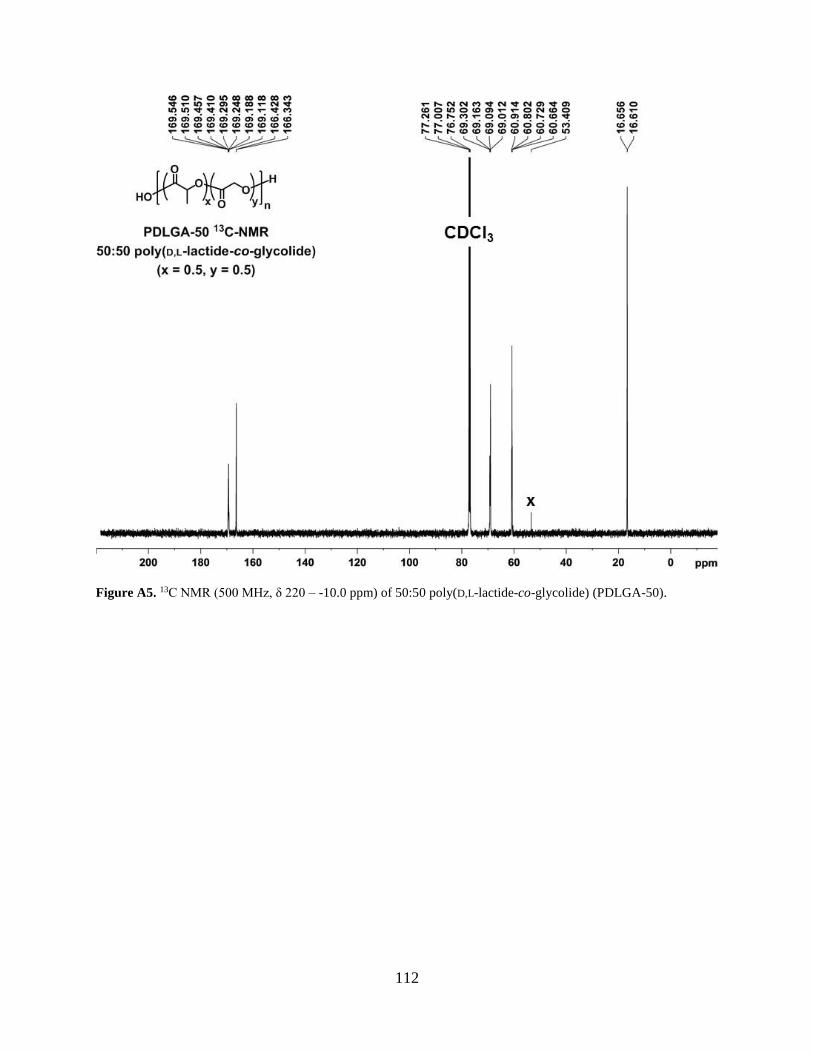
112
Figure A5. 13C NMR (500 MHz, δ 220 – -10.0 ppm) of 50:50 poly(D,L-lactide-co-glycolide) (PDLGA-50).

113
Figure A6. 1H NMR (500 MHz, δ 9.0 – 0.0 ppm) of 65:35 poly(D,L-lactide-co-glycolide) (PDLGA-65).

114
Figure A7. 13C NMR (500 MHz, δ 220 – -10.0 ppm) of 65:35 poly(D,L-lactide-co-glycolide) (PDLGA-65).

115
Figure A8. 1H NMR (500 MHz, δ 9.0 – 0.0 ppm) of 50:50 poly(L-lactide-co-glycolide) (PLLGA-50).

116
Figure A9. 13C NMR (500 MHz, δ 220 – -10.0 ppm) of 50:50 poly(L-lactide-co-glycolide) (PLLGA-50).

117
Figure A10. 1H NMR (500 MHz, δ 9.0 – 0.0 ppm) of poly LG.

118
Figure A11. 13C NMR (500 MHz, δ 220 – -10.0 ppm) of poly LG.

119
Figure A12. 1H NMR (500 MHz, δ 9.0 – 0.0 ppm) of poly LracG.

120
Figure A13. 1C NMR (500 MHz, δ 220 – -10.0 ppm) of poly LracG.

121
Figure A14. 1H NMR (500 MHz, δ 9.0 – 0.0 ppm) of poly GLG.
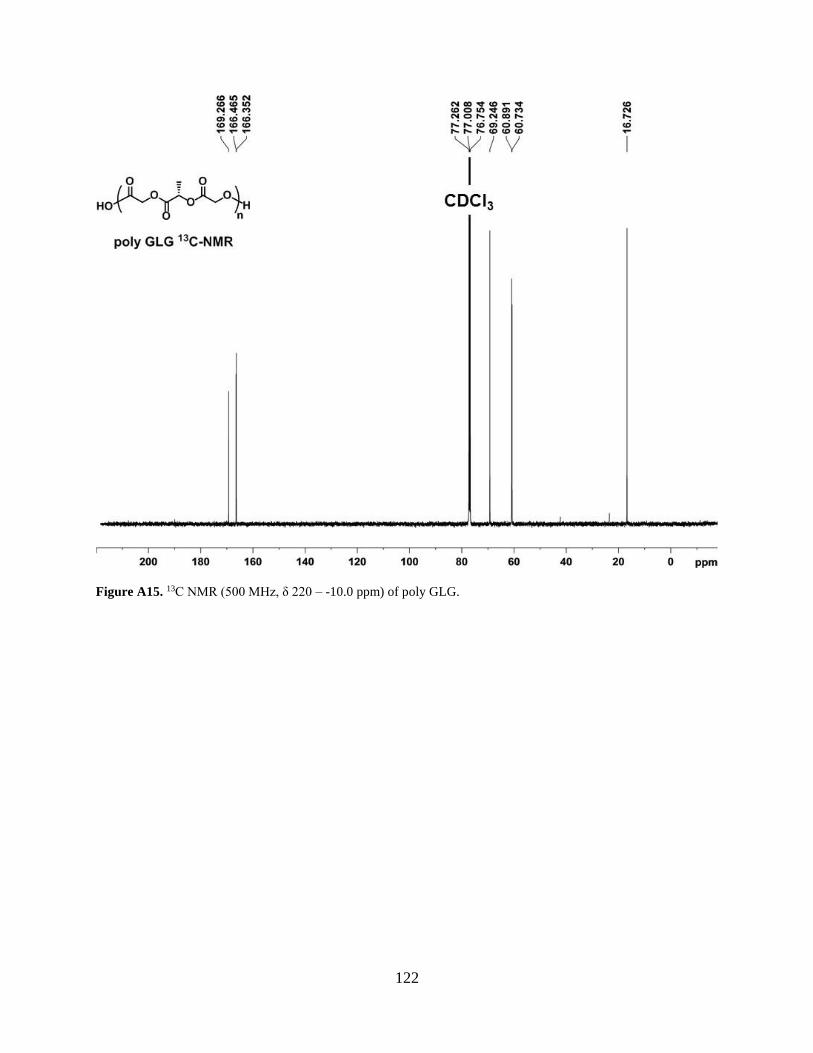
122
Figure A15. 13C NMR (500 MHz, δ 220 – -10.0 ppm) of poly GLG.

123
Figure A16. 1H NMR (500 MHz, δ 9.0 – 0.0 ppm) of poly LLG.

124
Figure A17. 13C NMR (500 MHz, δ 220 – -10.0 ppm) of poly LLG.

125
Figure A18. 1H NMR (500 MHz, δ 9.0 – 0.0 ppm) of poly GLLG.

126
Figure A19. 13C NMR (500 MHz, δ 220 – -10.0 ppm) of poly GLLG.

127
Figure A20. 1H NMR (500 MHz, δ 9.0 – 0.0 ppm) of R-SAP.

128
Figure A21. 13C NMR (500 MHz, δ 220 – -10.0 ppm) of R-SAP.
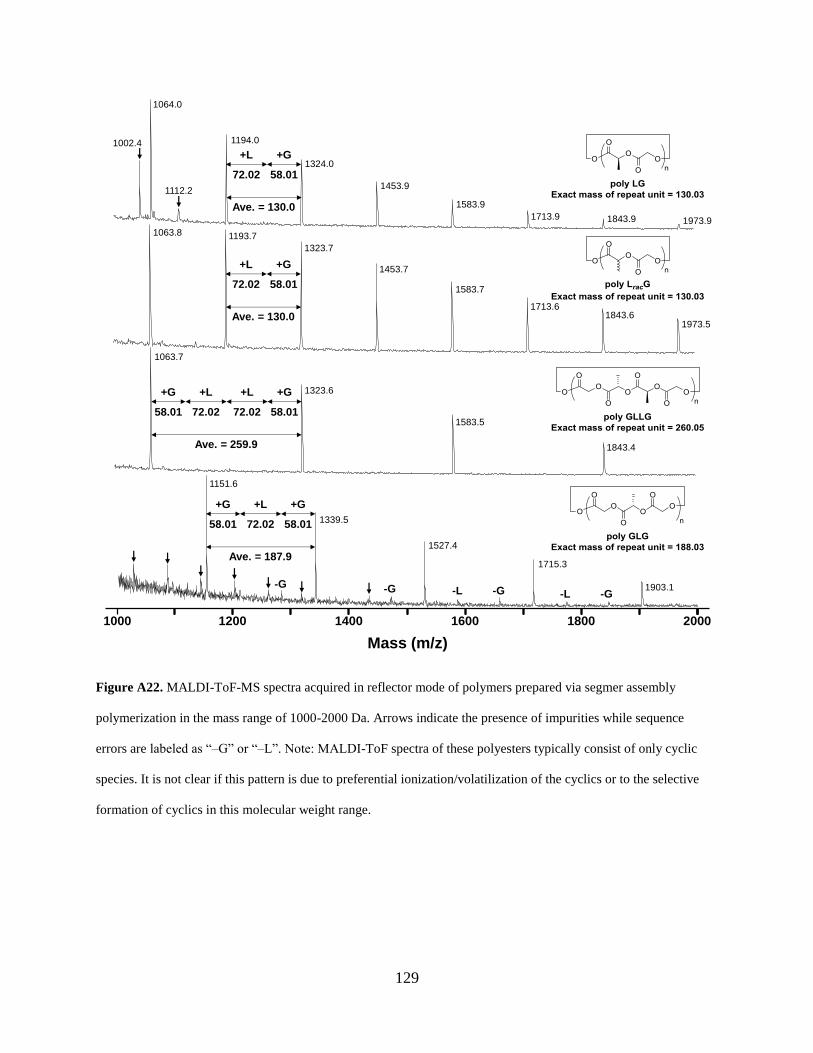
129
1000 1200 1400 1600 1800 2000
Mass (m/z)
1151.6
1339.5
1527.4
1715.3
1903.1
1063.8
1453.7
1583.7
1713.61843.6
1973.5
1193.7
1063.7
1323.6
1583.5
1843.4
1064.0
1194.0
1453.9
1583.9
1713.9 1843.9
1002.4
1112.2
1973.9
1323.7
1324.0
Ave. = 187.9
+L +G+G
72.02 58.0158.01
Ave. = 259.9
+L
72.02
+G
58.01
+L
72.02
+G
58.01
Ave. = 130.0
+L
72.02
+G
58.01
Ave. = 130.0
+L
72.02
+G
58.01
-L -G -L -G-G-G
Figure A22. MALDI-ToF-MS spectra acquired in reflector mode of polymers prepared via segmer assembly
polymerization in the mass range of 1000-2000 Da. Arrows indicate the presence of impurities while sequence
errors are labeled as “–G” or “–L”. Note: MALDI-ToF spectra of these polyesters typically consist of only cyclic
species. It is not clear if this pattern is due to preferential ionization/volatilization of the cyclics or to the selective
formation of cyclics in this molecular weight range.

130
*Mixed LG/GL
Sequences*Mixed GG
Sequences
Sequenced Standards
poly LRLRGLLG
poly LLLLG
poly GLLG
poly LG
poly LracG
poly GGLLLG
Figure A23. 13C NMR spectral (500 MHz) comparison of R-SAP with several sequenced copolymer standards
demonstrating the complexity of glycolyl carbonyl peak assignments. *Chemical shifts of conventional dimeric
sequence assignments from PLGAs synthesized via ring-opening polymerization of lactide and glycolide.

131
35 days
28 days
21 days
14 days
7 days
0 days
Figure A24. 1H NMR spectra overlay (δ 4.3-5.6 ppm) of poly LG. The small amount of epimerization present in the
0 day sample (δ ~4.7, 4.8 ppm) does not increase with degradation time and no addition resonances appear.
Transesterification would be expected to introduce new peaks.

132
poly LLG
poly LG
poly GLG
Day 35
Control 1
Control 2
Figure A25. 1H NMR spectra overlay (δ 4.3-5.6 ppm) of poly LG at day 35. The day 35 poly LG sample is
compared with spectra of poly GLG and poly LLG to illustrate the chemical shifts that would be expected if the
sample was contaminated by transesterification-generated GG and LL units.

133
1 2 3 4 5 6 7 840
50
60
70
80
90
Co
nta
ct
An
gle
()
Time (days)
PDLGA-50
PDLGA-65
poly LG
Figure A26. Surface water contact angles of films exposed to physiological conditions over 8 days measured in
their hydrated (post-wet) state. The error bars represent ± standard error of the mean (n=5). Note: this study was
only performed on PDLGA-50 and poly LG because these polymers exhibited the largest differences in swelling and
erosion behavior. As their surface contact angles under these conditions were nearly the same, other sequences were
not explored. Further evidence for the lack of sensitivity of this measurement to sequence can be found in the
comparison of PDLGA-50 with PDLGA-65. Despite the presence of significantly more hydrophobic L units, the
contact angle behavior cannot be differentiated from PDLGA-50.

134
0 1 2 3 4 5 6 7 840
50
60
70
80
90
Co
nta
ct
An
gle
()
Time (days)
PDLGA-50
PDLGA-65
poly LG
Figure A27. Surface water contact angles of films exposed to physiological conditions over 8 days measured in
their lyophilized (post-dry) state. The error bars represent ± standard error of the mean (n=5). Note: this study was
only performed on PDLGA-50 and poly LG because these polymers exhibited the largest differences in swelling and
erosion behavior. As their surface contact angles under these conditions were nearly the same, other sequences were
not explored. Further evidence for the lack of sensitivity of this measurement to sequence can be found in the
comparison of PDLGA-50 with PDLGA-65. Despite the presence of significantly more hydrophobic L units, the
contact angle behavior cannot be differentiated from PDLGA-50.

135
APPENDIX B
Supporting Information for Chapter 3
6 8 10 12 14
0
20
40
60
80
100
No
rmali
zed
In
ten
sit
y
Retention Time (min)
poly LG
poly LracG
PDLGA-65
PLLGA-50
PDLGA-50
Figure B1. Gel permeation chromatography (GPC) chromatograms of sequenced and random PLGA copolymers.

136
50 100 1500
6
12
18H
eat
Flo
w (
en
do
therm
up
)
Temperature (oC)
50 100 150
Temperature (oC)
1st Heating Cycle 2nd Heating Cycle
poly LG
poly LracG
PDLGA-65
PLLGA-50
PDLGA-50
Figure B2. Differential scanning calorimetry (DSC) thermograms of PLGAs. The standard glass transition
temperatures of all polymers were measured in the second heating cycle (right). Thermal data for non-loaded (left,
solid lines) and LysoSensorTM loaded (left, dotted lines) PLGA microparticles prepared by a single-emulsion
(O/W) methodology were determined during the first heating cycle.

137
Figure B3. Scanning electron microscopy images (x80) of control (non-loaded) and LysoSensorTM loaded PLGA
microparticle prepared via a single-emulsion (O/W) fabrication method.

138
400 450 500 550 600 650 7000
200
400
600
800
1000 pH 2.83
pH 3.42
pH 4.04
pH 4.60
pH 5.21
pH 5.82
pH 6.44
pH 7.04
Inte
ns
ity
(a
.u.)
em (nm)
Figure B4. Fluorescence spectra overlay of LysoSensorTM pH probe in various 0.1 M citric acid and 0.2 M
Na2HPO4 buffer solutions (pH = 2.83 – 7.04).
2 3 4 5 6 7 80.0
0.2
0.4
0.6
0.8
1.0
1.2
I 45
0n
m/I
53
0n
m
pH
Figure B5. The pH sensitivity of LysoSensorTM Yellow/Blue DND-160 (PDMPO) at concentration 2 µM. The
third-order polynomial curve fitting data was y = -0.0449 x3 + 0.6305 x2 - 2.56295 x + 3.36182, where y = I450
nm/I530 nm and x = pH, r2 = 0.994.

139
Figure B6. Evolution of characteristic acidic microclimate features monitored using two-photon microscopy.
Displayed images are representative of the population at specific time intervals (top right; days). *Data was unable
to be acquired due to dye-loss.

140
Figure B7. Two-photon microscopy images of hydrated microparticles without encapsulated dye. Images were
acquired using λex = 740 nm, 5.40 % intensity. Minimal to no fluorescent interference was detected using the
previously described image acquisition settings. Various threshold settings were applied for each polymer: PDLGA-
50 (Red (15-255), Green (10-255)), PDLGA-65 (Red (35-255), Green (20-255)), PLLGA-50 (Red (25-255), Green
(15-255)), poly LG (Red (80-255), Green (50-255)), poly LracG (Red (75-255), Green (55-255)).

141
Figure B8. Non-ratiometric two-photon microscopy images illustrating the failure morphologies of sequenced and
random PLGAs at specific time points.
Figure 9. Additional week 4 H&E staining images of subcutaneous tissue microparticle depot injections from two
different C57BL/6J wild-type mice (x25). Arrows indicate presence of foreign body giant-cells. Scale bar = 100 μm.

142
Figure B10. Scanning electron microscopy images (x550) of single-emulsion PDLGA-50 and poly LG
microparticles. These samples were injected subcutaneously to evaluate in vivo inflammatory response.

143
APPENDIX C
Supporting Information for Chapter 4
Figure C1. Synthesis of orthogonally protected lactic and glycolic acid building blocks, tert-butyldiphenylsilyl
protected alcohols (A) and benzyl protected carboxylic acids (B), and segmer assembly polymerization methodology
for sequenced poly(lactic-co-glycolic acid)s; poly LG (C), poly LracG (D), poly GLLG (E), poly LLG (F).

144
Figure C2. 1H NMR (500 MHz, δ 9.0 – 0.0 ppm) of 50:50 poly(D,L-lactide-co-glycolide) (PDLGA-50)

145
Figure C3. 13C NMR (500 MHz, δ 220 – -10.0 ppm) of 50:50 poly(D,L-lactide-co-glycolide) (PDLGA-50).

146
Figure C4. 1H NMR (500 MHz, δ 9.0 – 0.0 ppm) of 65:35 poly(D,L-lactide-co-glycolide) (PDLGA-65).

147
Figure C5. 13C NMR (500 MHz, δ 220 – -10.0 ppm) of 65:35 poly(D,L-lactide-co-glycolide) (PDLGA-65).
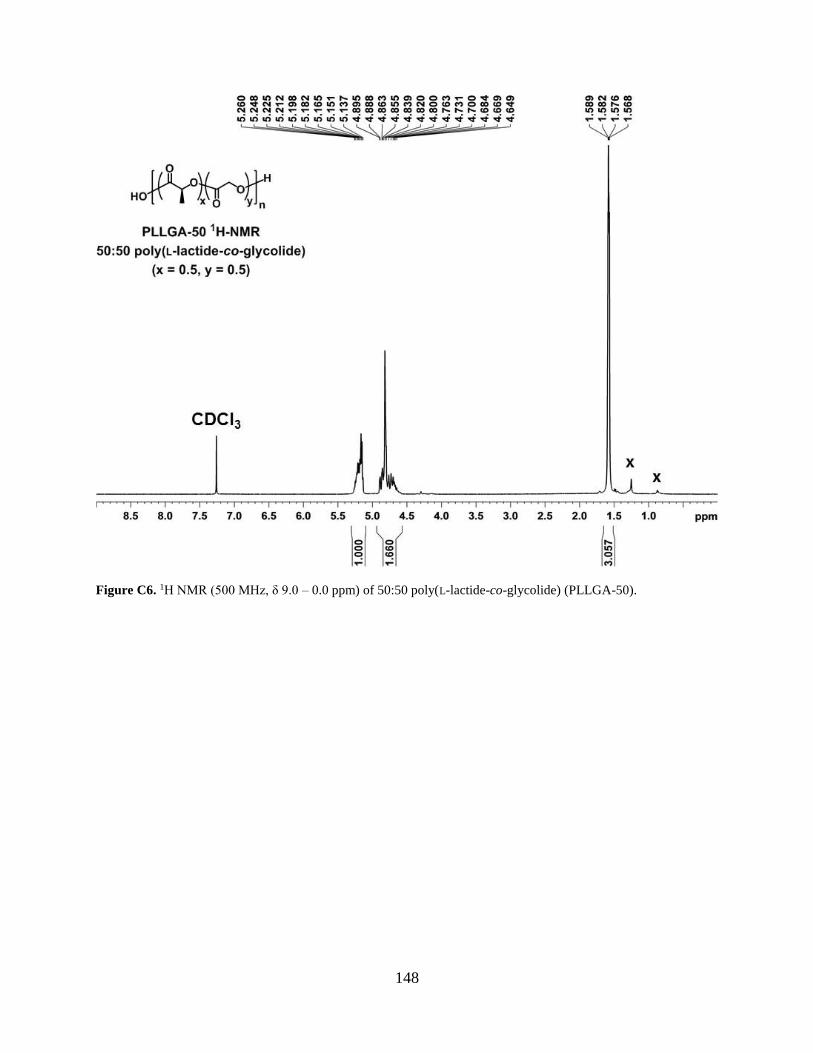
148
Figure C6. 1H NMR (500 MHz, δ 9.0 – 0.0 ppm) of 50:50 poly(L-lactide-co-glycolide) (PLLGA-50).

149
Figure C7. 13C NMR (500 MHz, δ 220 – -10.0 ppm) of 50:50 poly(L-lactide-co-glycolide) (PLLGA-50).

150
Figure C8. 1H NMR (500 MHz, δ 9.0 – 0.0 ppm) of poly LG.

151
Figure C9. 13C NMR (500 MHz, δ 220 – -10.0 ppm) of poly LG.

152
Figure C10. 1H NMR (500 MHz, δ 9.0 – 0.0 ppm) of poly LracG.

153
Figure C11. 1C NMR (500 MHz, δ 220 – -10.0 ppm) of poly LracG.

154
Figure C12. 1H NMR (500 MHz, δ 9.0 – 0.0 ppm) of poly LLG.

155
Figure C13. 13C NMR (500 MHz, δ 220 – -10.0 ppm) of poly LLG.
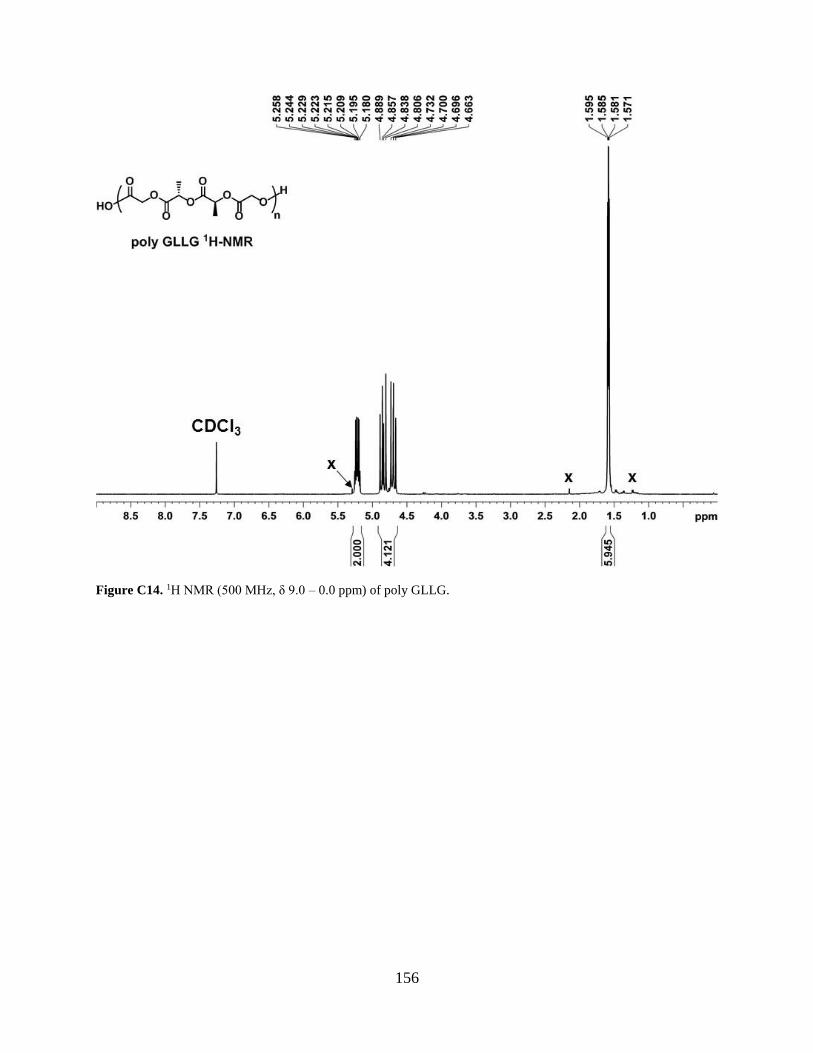
156
Figure C14. 1H NMR (500 MHz, δ 9.0 – 0.0 ppm) of poly GLLG.

157
Figure C15. 13C NMR (500 MHz, δ 220 – -10.0 ppm) of poly GLLG.

158
0.0 0.1 0.2 0.3 0.4 0.50
20
40
60
80
100
Strain (mm/mm)
poly LG
poly LracG
poly GLLG
poly LLG
PDLGA-50
PLLGA-50
PDLGA-65
Str
ess
(M
Pa)
Figure C16. Representative stress-strain curves for sequenced and random PLGAs acquired during compression at a
rate of 0.1 mm/min.

159
0.00 0.05 0.10 0.15 0.20 0.25 0.300
5
10
15
20
25
30S
tre
ss
(M
Pa
)
Strain (mm/mm)
poly LG
poly GLLG
Figure C17. Representative failure mechanism stress-strain curves for poly LG (brittle failure) and poly GLLG
(ductile failure) after 35 d in vitro acquired during compression at a rate of 0.1 mm/min.

160
Figure C18. 1H-NMR (500 MHz, CDCl3, δ 5.6 – 3.4 ppm) overlay of poly LG over the course of 63 days in vitro.
The regions displayed correlate to the methine (δ 5.3 – 5.2 ppm) and methylene (δ 4.9 – 4.6 ppm) proton resonances.
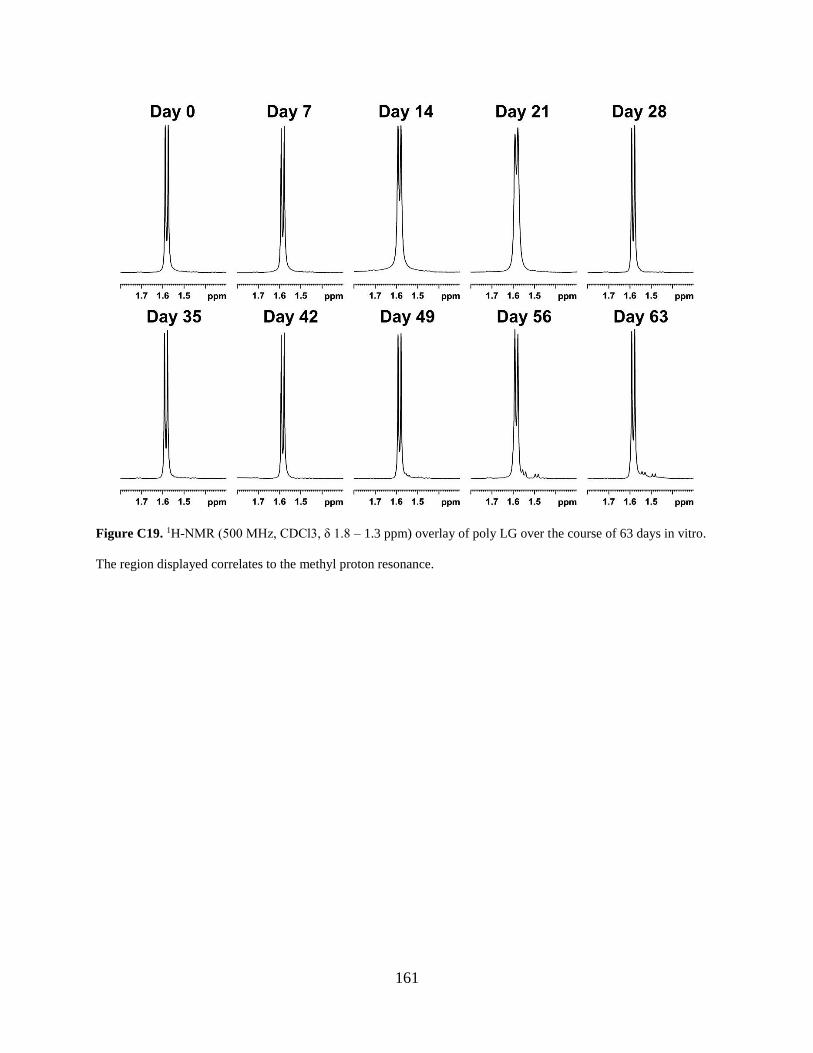
161
Figure C19. 1H-NMR (500 MHz, CDCl3, δ 1.8 – 1.3 ppm) overlay of poly LG over the course of 63 days in vitro.
The region displayed correlates to the methyl proton resonance.

162
Figure C20. 1H-NMR (500 MHz, CDCl3, δ 5.6 – 3.4 ppm) overlay of poly LracG over the course of 63 days in vitro.
The regions displayed correlate to the methine (δ 5.3 – 5.1 ppm) and methylene (δ 4.9 – 4.6 ppm) proton resonances.
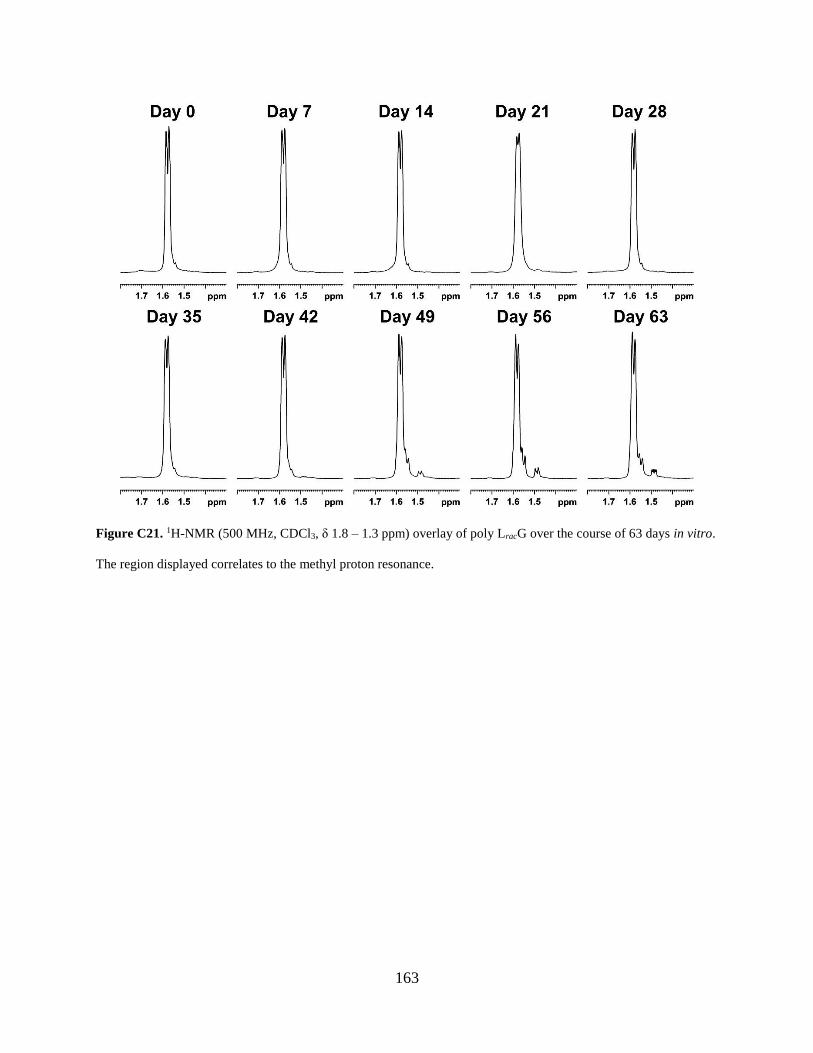
163
Figure C21. 1H-NMR (500 MHz, CDCl3, δ 1.8 – 1.3 ppm) overlay of poly LracG over the course of 63 days in vitro.
The region displayed correlates to the methyl proton resonance.
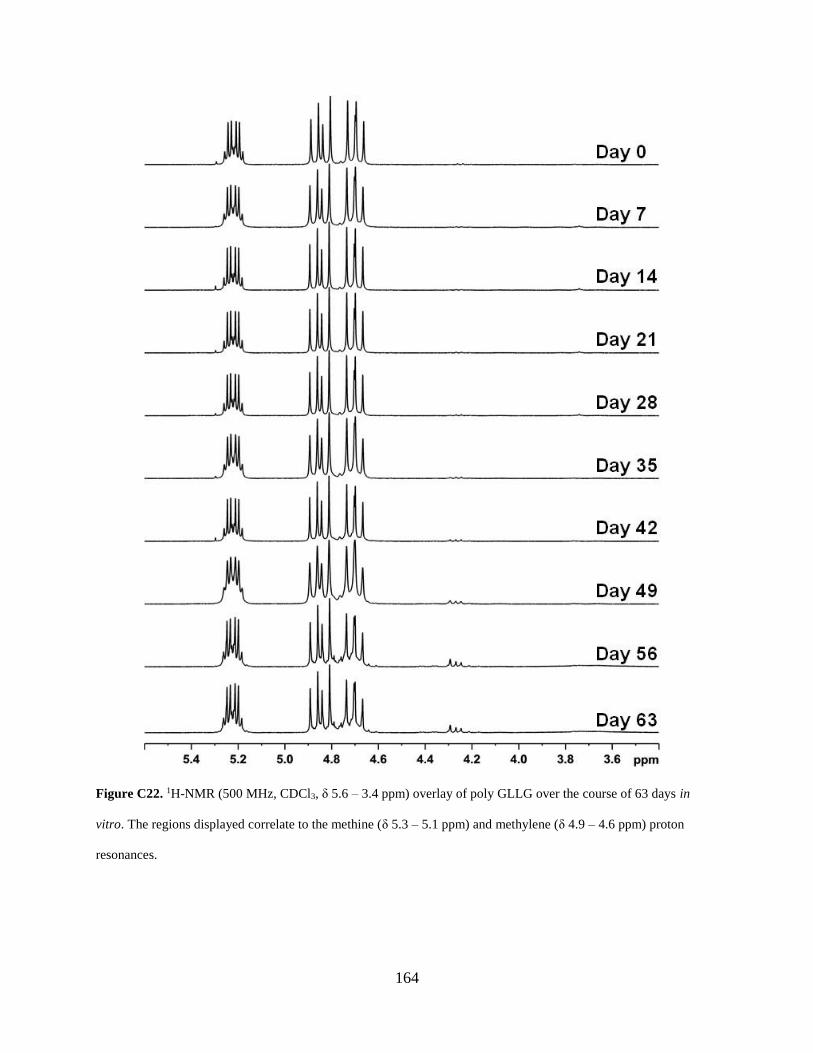
164
Figure C22. 1H-NMR (500 MHz, CDCl3, δ 5.6 – 3.4 ppm) overlay of poly GLLG over the course of 63 days in
vitro. The regions displayed correlate to the methine (δ 5.3 – 5.1 ppm) and methylene (δ 4.9 – 4.6 ppm) proton
resonances.

165
Figure C23. 1H-NMR (500 MHz, CDCl3, δ 1.8 – 1.3 ppm) overlay of poly GLLG over the course of 63 days in
vitro. The region displayed correlates to the methyl proton resonance.

166
Figure C24. 1H-NMR (500 MHz, CDCl3, δ 5.6 – 3.4 ppm) overlay of poly LLG over the course of 63 days in vitro.
The regions displayed correlate to the methine (δ 5.3 – 5.1 ppm) and methylene (δ 4.9 – 4.6 ppm) proton resonances.

167
Figure C25. 1H-NMR (500 MHz, CDCl3, δ 1.8 – 1.3 ppm) overlay of poly LLG over the course of 63 days in vitro.
The region displayed correlates to the methyl proton resonance.

168
Figure C26. 1H-NMR (500 MHz, CDCl3, δ 5.6 – 3.4 ppm) overlay of 50:50 poly(D,L-lactide-co-glycolide)
(PDLGA-50) over the course of 42 days in vitro. The regions displayed correlate to the methine (δ 5.3 – 5.1 ppm)
and methylene (δ 4.9 – 4.5 ppm) proton resonances.

169
Figure C27. 1H-NMR (500 MHz, CDCl3, δ 1.8 – 1.3 ppm) overlay of 50:50 poly(D,L-lactide-co-glycolide)
(PDLGA-50) over the course of 42 days in vitro. The region displayed correlates to the methyl proton resonance.

170
Figure C28. 1H-NMR (500 MHz, CDCl3, δ 5.6 – 3.4 ppm) overlay of 50:50 poly(L-lactide-co-glycolide) (PLLGA-
50) over the course of 56 days in vitro. The regions displayed correlate to the methine (δ 5.3 – 5.1 ppm) and
methylene (δ 4.9 – 4.5 ppm) proton resonances.

171
Figure C29. 1H-NMR (500 MHz, CDCl3, δ 1.8 – 1.3 ppm) overlay of 50:50 poly(L-lactide-co-glycolide) (PLLGA-
50) over the course of 56 days in vitro. The region displayed correlates to the methyl proton resonance.

172
Figure C30. 1H-NMR (500 MHz, CDCl3, δ 5.6 – 3.4 ppm) overlay of 65:35 poly(D,L-lactide-co-glycolide)
(PDLGA-65) over the course of 42 days in vitro. The regions displayed correlate to the methine (δ 5.3 – 5.1 ppm)
and methylene (δ 4.9 – 4.5 ppm) proton resonances.

173
Figure C31. 1H-NMR (500 MHz, CDCl3, δ 1.8 – 1.3 ppm) overlay of 65:35 poly(D,L-lactide-co-glycolide)
(PDLGA-65) over the course of 42 days in vitro. The region displayed correlates to the methyl proton resonance.

174
BIBLIOGRAPHY
(1) Ulery, B. D.; Nair, L. S.; Laurencin, C. T., Biomedical Applications of Biodegradable
Polymers. Journal of polymer science. Part B, Polymer physics 2011, 49 (12), 832-864.
(2) Gentile, P.; Chiono, V.; Carmagnola, I.; Hatton, P. V., An Overview of Poly(lactic-co-
glycolic) Acid (PLGA)-Based Biomaterials for Bone Tissue Engineering. International Journal
of Molecular Sciences 2014, 15 (3), 3640-3659.
(3) Singh, G.; Kaur, T.; Kaur, R.; Kaur, A., Recent biomedical applications and patents on
biodegradable polymer-PLGA. International Journal of Pharmacology and Pharmaceutical
Sciences 2014, 1 (2), 30-42.
(4) Dechy-Cabaret, O.; Martin-Vaca, B.; Bourissou, D., Controlled Ring-Opening
Polymerization of Lactide and Glycolide. Chemical Reviews 2004, 104 (12), 6147-6176.
(5) Pounder, R. J.; Dove, A. P., Towards poly(ester) nanoparticles: recent advances in the
synthesis of functional poly(ester)s by ring-opening polymerization. Polymer Chemistry 2010, 1
(3), 260-271.
(6) Ajioka, M.; Suizu, H.; Higuchi, C.; Kashima, T., Aliphatic polyesters and their copolymers
synthesized through direct condensation polymerization. Polymer Degradation and Stability
1998, 59 (1–3), 137-143.
(7) Gao, Q.; Lan, P.; Shao, H.; Hu, X., Direct Synthesis with Melt Polycondensation and
Microstructure Analysis of Poly(L-lactic acid-co-glycolic acid). Polymer Journal 2002, 34 (11),
786-793.
(8) Kasperczyk, J., Copolymerization of glycolide and ϵ-caprolactone, 1. Analysis of the
copolymer microstructure by means of 1H and 13C NMR spectroscopy. Macromolecular
Chemistry and Physics 1999, 200 (4), 903-910.
(9) Kasperczyk, J., Microstructural analysis of poly[(L,L-lactide)-co-(glycolide)] by 1H and 13C
NMR spectroscopy. Polymer 1996, 37 (2), 201-203.
(10) Stanford, M. J.; Dove, A. P., Stereocontrolled ring-opening polymerisation of lactide.
Chemical Society Reviews 2010, 39 (2), 486-494.
(11) Van Wouwe, P.; Dusselier, M.; Vanleeuw, E.; Sels, B., Lactide Synthesis and Chirality
Control for Polylactic acid Production. ChemSusChem 2016, 9 (9), 907-921.
(12) Stridsberg, K. M.; Ryner, M.; Albertsson, A. C., Controlled ring-opening polymerization:
Polymers with designed macromolecular architecture. In Degradable Aliphatic Polyesters,
Albertsson, A. C., Ed. Springer-Verlag Berlin: Berlin, 2002; Vol. 157, pp 41-65.
(13) Guillaume, S. M.; Kirillov, E.; Sarazin, Y.; Carpentier, J. F., Beyond Stereoselectivity,
Switchable Catalysis: Some of the Last Frontier Challenges in Ring-Opening Polymerization of
Cyclic Esters. Chemistry-a European Journal 2015, 21 (22), 7988-8003.

175
(14) Ovitt, T. M.; Coates, G. W., Stereochemistry of Lactide Polymerization with Chiral
Catalysts: New Opportunities for Stereocontrol Using Polymer Exchange Mechanisms. Journal
of the American Chemical Society 2002, 124 (7), 1316-1326.
(15) Sun, Y. Y.; Xiong, J.; Dai, Z. R.; Pan, X. B.; Tang, N.; Wu, J. C., Stereoselective Alkali-
Metal Catalysts for Highly Isotactic Poly(rac-lactide) Synthesis. Inorganic Chemistry 2016, 55
(1), 136-143.
(16) Ovitt, T. M.; Coates, G. W., Stereoselective ring-opening polymerization of rac-lactide with
a single-site, racemic aluminum alkoxide catalyst: Synthesis of stereoblock poly(lactic acid).
Journal of Polymer Science Part a-Polymer Chemistry 2000, 38, 4686-4692.
(17) Ovitt, T. M.; Coates, G. W., Stereoselective ring-opening polymerization of meso-lactide:
Synthesis of syndiotactic poly(lactic acid). Journal of the American Chemical Society 1999, 121
(16), 4072-4073.
(18) Cheng, M.; Attygalle, A. B.; Lobkovsky, E. B.; Coates, G. W., Single-site catalysts for
ring-opening polymerization: Synthesis of heterotactic poly(lactic acid) from rac-lactide. Journal
of the American Chemical Society 1999, 121 (49), 11583-11584.
(19) Spassky, N.; Wisniewski, M.; Pluta, C.; LeBorgne, A., Highly stereoelective
polymerization of rac-(D,L)-lactide with a chiral Schiff's base/aluminium alkoxide initiator.
Macromolecular Chemistry and Physics 1996, 197 (9), 2627-2637.
(20) von Schenck, H.; Ryner, M.; Albertsson, A. C.; Svensson, M., Ring-Opening
Polymerization of Lactones and Lactides with Sn(IV) and Al(III) Initiators. Macromolecules
2002, 35 (5), 1556-1562.
(21) Dong, C.-M.; Qiu, K.-Y.; Gu, Z.-W.; Feng, X.-D., Synthesis of poly(D,L-lactic acid-alt-
glycolic acid) from D,L-3-methylglycolide. Journal of Polymer Science Part A: Polymer
Chemistry 2000, 38 (23), 4179-4184.
(22) Auras, R., Poly(lactic acid) : synthesis, structures, properties, processing, and applications.
Wiley: Hoboken, N.J., 2010; p xxiii, 499 p.
(23) Gilding, D. K.; Reed, A. M., Biodegradable polymers for use in surgery—
polyglycolic/poly(lactic acid) homo- and copolymers: 1. Polymer 1979, 20 (12), 1459-1464.
(24) Leenslag, J. W.; Pennings, A. J.; Bos, R. R. M.; Rozema, F. R.; Boering, G., Resorbable
materials of poly(l-lactide). VI. Plates and screws for internal fracture fixation. Biomaterials
1987, 8 (1), 70-73.
(25) Gunatillake, P. A.; Adhikari, R., Biodegradable synthetic polymers for tissue engineering.
European Cells and Materials 2003, 5, 1-16; discussion 16.
(26) Razak, S.; Sharif, N.; Rahman, W., Biodegradable polymers and their bone applications: a
review. Internation Journal of Basic & Applied Sciences 2012, 12, 31-49.
(27) Gentile, P.; Chiono, V.; Carmagnola, I.; Hatton, P. V., An overview of poly(lactic-co-
glycolic) acid (PLGA)-based biomaterials for bone tissue engineering. International Journal of
Molecular Sciences 2014, 15 (3), 3640-59.
(28) Middleton, J. C.; Tipton, A. J., Synthetic biodegradable polymers as orthopedic devices.
Biomaterials 2000, 21 (23), 2335-2346.
(29) Park, T. G., Degradation of poly(lactic-co-glycolic acid) microspheres - Effect of
copolymer composition Biomaterials 1995, 16 (15), 1123-1130.
(30) Alexis, F., Factors affecting the degradation and drug-release mechanism of poly(lactic
acid) and poly[(lactic acid)-co-(glycolic acid)]. Polymer International 2005, 54 (1), 36-46.
(31) Vert, M., Degradation of polymeric systems aimed at temporary therapeutic applications:
Structure-related complications. In e-Polymers, 2005; Vol. 5, p 70.

176
(32) Watson, J. D.; Crick, F. H., Molecular structure of nucleic acids; a structure for
deoxyribose nucleic acid. Nature 1953, 171 (4356), 737-8.
(33) Lutz, J. F.; Lehn, J. M.; Meijer, E. W.; Matyjaszewski, K., From precision polymers to
complex materials and systems. Nature Reviews Materials 2016, 1 (5), 1-14.
(34) Lutz, J. F.; Ouchi, M.; Sawamoto, M.; Meyer, T. Y., Sequence-Controlled Polymers:
Synthesis, Self-Assembly, and Properties. American Chemical Society: 2014; Vol. 1170, p 408.
(35) Lutz, J. F.; Ouchi, M.; Liu, D. R.; Sawamoto, M., Sequence-Controlled Polymers. Science
2013, 341 (6146).
(36) Cole, J. P.; Hanlon, A. M.; Rodriguez, K. J.; Berda, E. B., Protein-Like Structure and
Activity in Synthetic Polymers. Journal of Polymer Science Part A - Polymer Chemistry 2017,
55 (2), 191-206.
(37) Matyjaszewski, K.; Xia, J., Atom Transfer Radical Polymerization. Chemical Reviews
2001, 101 (9), 2921-2990.
(38) Moad, G.; Rizzardo, E.; Thang, S. H., Radical addition–fragmentation chemistry in
polymer synthesis. Polymer 2008, 49 (5), 1079-1131.
(39) Hawker, C. J.; Bosman, A. W.; Harth, E., New Polymer Synthesis by Nitroxide Mediated
Living Radical Polymerizations. Chemical Reviews 2001, 101 (12), 3661-3688.
(40) Bielawski, C. W.; Grubbs, R. H., Living ring-opening metathesis polymerization. Progress
in Polymer Science 2007, 32 (1), 1-29.
(41) Hibi, Y.; Ouchi, M.; Sawamoto, M., A strategy for sequence control in vinyl polymers via
iterative controlled radical cyclization. Nature Communications 2016, 7, 11064.
(42) Matyjaszewski, K., Architecturally Complex Polymers with Controlled Heterogeneity.
Science 2011, 333 (6046), 1104-1105.
(43) Matyjaszewski, K., Atom Transfer Radical Polymerization (ATRP): Current Status and
Future Perspectives. Macromolecules 2012, 45 (10), 4015-4039.
(44) Gody, G.; Zetterlund, P. B.; Perrier, S.; Harrisson, S., The limits of precision monomer
placement in chain growth polymerization. Nature Communications 2016, 7, 10514.
(45) Badi, N.; Chan-Seng, D.; Lutz, J. F., Microstructure Control: An Underestimated Parameter
in Recent Polymer Design. Macromolecular Chemistry and Physics 2013, 214 (2), 135-142.
(46) Badi, N.; Lutz, J.-F., Sequence control in polymer synthesis. Chemical Society Reviews
2009, 38 (12), 3383-3390.
(47) Tsarevsky, N. V.; Sumerlin, B. S.; Matyjaszewski, K., Step-Growth “Click” Coupling of
Telechelic Polymers Prepared by Atom Transfer Radical Polymerization. Macromolecules 2005,
38 (9), 3558-3561.
(48) Porel, M.; Alabi, C. A., Sequence-Defined Polymers via Orthogonal Allyl Acrylamide
Building Blocks. Journal of the American Chemical Society 2014, 136 (38), 13162-13165.
(49) Deng, X.-X.; Li, L.; Li, Z.-L.; Lv, A.; Du, F.-S.; Li, Z.-C., Sequence Regulated Poly(ester-
amide)s Based on Passerini Reaction. Acs Macro Letters 2012, 1 (11), 1300-1303.
(50) Stayshich, R. M.; Meyer, T. Y., Preparation and microstructural analysis of poly(lactic-alt-
glycolic acid). Journal of Polymer Science Part a-Polymer Chemistry 2008, 46 (14), 4704-4711.
(51) Al Ouahabi, A.; Charles, L.; Lutz, J. F., Synthesis of Non-Natural Sequence-Encoded
Polymers Using Phosphoramidite Chemistry. Journal of the American Chemical Society 2015,
137 (16), 5629-5635.
(52) Roy, R. K.; Meszynska, A.; Laure, C.; Charles, L.; Verchin, C.; Lutz, J. F., Design and
synthesis of digitally encoded polymers that can be decoded and erased. Nature Communications
2015, 6, 8.

177
(53) Laure, C.; Karamessini, D.; Milenkovic, O.; Charles, L.; Lutz, J. F., Coding in 2D: Using
Intentional Dispersity to Enhance the Information Capacity of Sequence-Coded Polymer
Barcodes. Angewandte Chemie-International Edition 2016, 55 (36), 10722-10725.
(54) Hartmann, L.; Börner, H. G., Precision Polymers: Monodisperse, Monomer-Sequence-
Defined Segments to Target Future Demands of Polymers in Medicine. Advanced Materials
2009, 21 (32-33), 3425-3431.
(55) Stayshich, R. M.; Meyer, T. Y., New Insights into Poly(lactic-co-glycolic acid)
Microstructure: Using Repeating Sequence Copolymers To Decipher Complex NMR and
Thermal Behavior. Journal of the American Chemical Society 2010, 132 (31), 10920-10934.
(56) Swanson, J. P.; Martinez, M. R.; Cruz, M. A.; Mankoci, S. G.; Costanzo, P. J.; Joy, A., A
coacervate-forming biodegradable polyester with elevated LCST based on bis-(2-methoxyethyl)
amine. Polymer Chemistry 2016, 7 (28), 4693-4702.
(57) Gokhale, S.; Xu, Y.; Joy, A., A Library of Multifunctional Polyesters with "Peptide-Like"
Pendant Functional Groups. Biomacromolecules 2013, 14 (8), 2489-2493.
(58) Weiss, R. M.; Jones, E. M.; Shafer, D. E.; Stayshich, R. M.; Meyer, T. Y., Synthesis of
Repeating Sequence Copolymers of Lactic, Glycolic, and Caprolactic Acids. Journal of Polymer
Science Part a-Polymer Chemistry 2011, 49 (8), 1847-1855.
(59) Stayshich, R. M.; Weiss, R. M.; Li, J.; Meyer, T. Y., Periodic Incorporation of Pendant
Hydroxyl Groups in Repeating Sequence PLGA Copolymers. Macromolecular Rapid
Communications 2011, 32 (2), 220-225.
(60) Li, J.; Rothstein, S. N.; Little, S. R.; Edenborn, H. M.; Meyer, T. Y., The Effect of
Monomer Order on the Hydrolysis of Biodegradable Poly(lactic-co-glycolic acid) Repeating
Sequence Copolymers. Journal of the American Chemical Society 2012, 134 (39), 16352-16359.
(61) Li, J.; Stayshich, R. M.; Meyer, T. Y., Exploiting Sequence To Control the Hydrolysis
Behavior of Biodegradable PLGA Copolymers. Journal of the American Chemical Society 2011,
133 (18), 6910-6913.
(62) Washington, M. A.; Swiner, D. J.; Bell, K. R.; Fedorchak, M. V.; Little, S. R.; Meyer, T.
Y., The impact of monomer sequence and stereochemistry on the swelling and erosion of
biodegradable poly(lactic-co-glycolic acid) matrices. Biomaterials 2017, 117, 66-76.
(63) Mu, L.; Feng, S. S., A Novel Controlled Release Formulation for the Anticancer Drug
Paclitaxel (Taxol®): PLGA Nanoparticles Containing Vitamin E TPGS. Journal of Controlled
Release 2003, 86 (1), 33-48.
(64) Fonseca, C.; Simões, S.; Gaspar, R., Paclitaxel-loaded PLGA Nanoparticles: Preparation,
Physicochemical Characterization and in vitro Anti-tumoral Activity. Journal of Controlled
Release 2002, 83 (2), 273-286.
(65) Derakhshandeh, K.; Erfan, M.; Dadashzadeh, S., Encapsulation of 9-nitrocamptothecin, A
Novel Anticancer Drug, in Biodegradable Nanoparticles: Factorial Design, Characterization and
Release Kinetics. European Journal of Pharmaceutics and Biopharmaceutics 2007, 66 (1), 34-
41.
(66) Tiainen, J.; Soini, Y.; Törmälä, P.; Waris, T.; Ashammakhi, N., Self-Reinforced
Polylactide/Polyglycolide 80/20 Screws Take More than 1½ Years to Resorb in Rabbit Cranial
Bone. Journal of Biomedical Materials Research Part B: Applied Biomaterials 2004, 70B (1),
49-55.
(67) Pan, Z.; Ding, J. D., Poly(lactide-co-glycolide) Porous Scaffolds for Tissue Engineering
and Regenerative Medicine. Interface Focus 2012, 2 (3), 366-377.

178
(68) Wang, Y.; Wen, Q.; Choi, S. H., FDA's Regulatory Science Program for Generic
PLA/PLGA-Based Drug Products. American Pharmaceutical Review 2016.
(69) Makadia, H. K.; Siegel, S. J., Poly(lactic-co-glycolic acid) (PLGA) as Biodegradable
Controlled Drug Delivery Carrier. Polymers 2011, 3 (3), 1377-1397.
(70) Rothstein, S. N.; Little, S. R., A "Tool Box" for Rational Design of Degradable Controlled
Release Formulations. Journal of Materials Chemistry 2011, 21 (1), 29-39.
(71) Norris, B. N.; Zhang, S.; Campbell, C. M.; Auletta, J. T.; Calvo-Marzal, P.; Hutchison, G.
R.; Meyer, T. Y., Sequence Matters: Modulating Electronic and Optical Properties of Conjugated
Oligomers via Tailored Sequence. Macromolecules 2013, 46 (4), 1384-1392.
(72) Weiss, R. M.; Short, A. L.; Meyer, T. Y., Sequence-Controlled Copolymers Prepared via
Entropy-Driven Ring-Opening Metathesis Polymerization. Acs Macro Letters 2015, 4 (9), 1039-
1043.
(73) Zhang, S.; Hutchison, G. R.; Meyer, T. Y., Sequence Effects in Conjugated Donor–
Acceptor Trimers and Polymers. Macromolecular Rapid Communications 2016, 882-887.
(74) Fernández, J.; Etxeberria, A.; Sarasua, J. R., Synthesis, structure and properties of poly(L-
lactide-co-epsilon-caprolactone) statistical copolymers. Journal of the Mechanical Behavior of
Biomedical Materials 2012, 9, 100-112.
(75) Fernández, J.; Etxeberria, A.; Sarasua, J. R., In vitro degradation studies and mechanical
behavior of poly(epsilon-caprolactone-co-delta-valerolactone) and poly(epsilon-caprolactone-co-
L-lactide) with random and semi-alternating chain microstructures. European Polymer Journal
2015, 71, 585-595.
(76) Fernández, J.; Etxeberria, A.; Sarasua, J. R., Effects of repeat unit sequence distribution and
residual catalyst on thermal degradation of poly(L-lactide/epsilon-caprolactone) statistical
copolymers. Polymer Degradation and Stability 2013, 98 (7), 1293-1299.
(77) Fernández, J.; Etxeberria, A.; Ugartemendia, J. M.; Petisco, S.; Sarasua, J. R., Effects of
chain microstructures on mechanical behavior and aging of a poly(L-lactide-co-epsilon-
caprolactone) biomedical thermoplastic-elastomer. Journal of the Mechanical Behavior of
Biomedical Materials 2012, 12, 29-38.
(78) Fernández, J.; Larrañaga, A.; Etxeberria, A.; Sarasua, J. R., Tensile behavior and dynamic
mechanical analysis of novel poly(lactide/delta-valerolactone) statistical copolymers. Journal of
the Mechanical Behavior of Biomedical Materials 2014, 35, 39-50.
(79) Fernández, J.; Larrañaga, A.; Etxeberría, A.; Sarasua, J. R., Effects of chain microstructures
and derived crystallization capability on hydrolytic degradation of poly(l-lactide/epsilon-
caprolactone) copolymers. Polymer Degradation and Stability 2013, 98 (2), 481-489.
(80) Sun, S.; Li, J.; Li, X.; Lan, B.; Zhou, S.; Meng, Y.; Cheng, L., Episcleral drug film for
better-targeted ocular drug delivery and controlled release using multilayered poly-ε-
caprolactone (PCL). Acta Biomaterialia 2016, 37, 143-154.
(81) Costa, E. F.; Barros, N. M.; Coppini, L. P.; Neves, R. L.; Carmona, A. K.; Penha, F. M.;
Rodrigues, E. B.; Dib, E.; Magalhaes, O., Jr.; Moraes-Filho, M. N.; Lima Filho, A. A.; Maia, M.;
Farah, M. E., Effects of light exposure, pH, osmolarity, and solvent on the retinal pigment
epithelial toxicity of vital dyes. Am J Ophthalmol 2013, 155 (4), 705-12, 712.e1.
(82) Rahman, C. V.; Ben-David, D.; Dhillon, A.; Kuhn, G.; Gould, T. W.; Muller, R.; Rose, F.
R.; Shakesheff, K. M.; Livne, E., Controlled release of BMP-2 from a sintered polymer scaffold
enhances bone repair in a mouse calvarial defect model. J Tissue Eng Regen Med 2014, 8 (1),
59-66.
179
(83) Anderson, J. M.; Shive, M. S., Biodegradation and biocompatibility of PLA and PLGA
microspheres. Advanced Drug Delivery Reviews 1997, 28 (1), 5-24.
(84) von Burkersroda, F.; Schedl, L.; Gopferich, A., Why degradable polymers undergo surface
erosion or bulk erosion. Biomaterials 2002, 23 (21), 4221-4231.
(85) Gopferich, A., Mechanisms of polymer degradation and erosion. Biomaterials 1996, 17 (2),
103-114.
(86) Gopferich, A., Polymer bulk erosion. Macromolecules 1997, 30 (9), 2598-2604.
(87) Gopferich, A., Erosion of composite polymer matrices. Biomaterials 1997, 18 (5), 397-403.
(88) Gopferich, A., Polymer degradation and erosion: Mechanisms and applications. European
Journal of Pharmaceutics and Biopharmaceutics 1996, 42 (1), 1-11.
(89) Gopferich, A.; Tessmar, J., Polyanhydride degradation and erosion. Advanced Drug
Delivery Reviews 2002, 54 (7), 911-931.
(90) Gasmi, H.; Danede, F.; Siepmann, J.; Siepmann, F., Does PLGA microparticle swelling
control drug release? New insight based on single particle swelling studies. Journal of
Controlled Release 2015, 213, 120-127.
(91) Takizawa, K.; Nulwala, H.; Hu, J.; Yoshinaga, K.; Hawker, C. J., Molecularly defined (L)-
lactic acid oligomers and polymers: Synthesis and characterization. Journal of Polymer Science
Part A: Polymer Chemistry 2008, 46 (18), 5977-5990.
(92) Qian, H.; Wohl, A. R.; Crow, J. T.; Macosko, C. W.; Hoye, T. R., A Strategy for Control of
“Random” Copolymerization of Lactide and Glycolide: Application to Synthesis of PEG-b-
PLGA Block Polymers Having Narrow Dispersity. Macromolecules 2011, 44 (18), 7132-7140.
(93) Kreiser-Saunders, I.; Kricheldorf, H. R., Polylactones, 39. Zn lactate-catalyzed
copolymerization of L-lactide with glycolide or ε-caprolactone. Macromolecular Chemistry and
Physics 1998, 199 (6), 1081-1087.
(94) Vey, E.; Rodger, C.; Booth, J.; Claybourn, M.; Miller, A. F.; Saiani, A., Degradation
kinetics of poly(lactic-co-glycolic) acid block copolymer cast films in phosphate buffer solution
as revealed by infrared and Raman spectroscopies. Polymer Degradation and Stability 2011, 96
(10), 1882-1889.
(95) Vey, E.; Rodger, C.; Meehan, L.; Booth, J.; Claybourn, M.; Miller, A. F.; Saiani, A., The
impact of chemical composition on the degradation kinetics of poly(lactic-co-glycolic) acid
copolymers cast films in phosphate buffer solution. Polymer Degradation and Stability 2012, 97
(3), 358-365.
(96) Keles, H.; Naylor, A.; Clegg, F.; Sammon, C., Investigation of factors influencing the
hydrolytic degradation of single PLGA microparticles. Polymer Degradation and Stability 2015,
119, 228-241.
(97) Eglin, D.; Alini, M., Degradable polymeric materials for osteosynthesis: Tutorial. European
Cells & Materials 2008, 16, 80-91.
(98) Ciccone II, W. J.; Motz, C.; Bentley, C.; Tasto, J. P., Bioabsorbable implants in
orthopaedics: new developments and clinical applications. The Journal of the American Academy
of Orthopaedic Surgeons 2001, 9 (5), 280-8.
(99) Athanasiou, K. A.; Agrawal, C. M.; Barber, F. A.; Burkhart, S. S., Orthopaedic applications
for PLA-PGA biodegradable polymers. Arthroscopy 1998, 14 (7), 726-737.
(100) Siepmann, J.; Elkharraz, K.; Siepmann, F.; Klose, D., How Autocatalysis Accelerates
Drug Release from PLGA-Based Microparticles: A Quantitative Treatment. Biomacromolecules
2005, 6 (4), 2312-2319.

180
(101) Liu, Y.; Yin, Y.; Wang, L.; Zhang, W.; Chen, X.; Yang, X.; Xu, J.; Ma, G., Surface
hydrophobicity of microparticles modulates adjuvanticity. Journal of Materials Chemistry B
2013, 1 (32), 3888-3896.
(102) Mei, F. F.; Peng, Y.; Lu, S. T.; Sun, F.; Zhang, Y.; Ge, C.; Zhang, Y.; Gu, H. L.; Wang,
Y. D.; Zhao, X. W.; Wang, G. Y., Synthesis and Characterization of Biodegradable Poly(lactic-
co-glycolic acid). Journal of Macromolecular Science Part B-Physics 2015, 54 (5), 562-570.
(103) Fredenberg, S.; Wahlgren, M.; Reslow, M.; Axelsson, A., The mechanisms of drug release
in poly(lactic-co-glycolic acid)-based drug delivery systems-A review. International Journal of
Pharmaceutics 2011, 415 (1-2), 34-52.
(104) Kamaly, N.; Yameen, B.; Wu, J.; Farokhzad, O. C., Degradable Controlled-Release
Polymers and Polymeric Nanoparticles: Mechanisms of Controlling Drug Release. Chemical
Reviews 2016, 116 (4), 2602-2663.
(105) Seyednejad, H.; Ghassemi, A. H.; van Nostrum, C. F.; Vermonden, T.; Hennink, W. E.,
Functional aliphatic polyesters for biomedical and pharmaceutical applications. Journal of
Controlled Release 2011, 152 (1), 168-176.
(106) Xu, X. J.; Sy, J. C.; Shastri, V. P., Towards developing surface eroding poly(alpha-
hydroxy acids). Biomaterials 2006, 27 (15), 3021-3030.
(107) Li, S. M.; Garreau, H.; Vert, M., Structure-property relationships in the case of the
degradation of massive poly(α-hydroxy acids) in aqueous media. Journal of Materials Science:
Materials in Medicine 1990, 1 (3), 131-139.
(108) Saha, S. K.; Tsuji, H., Hydrolytic Degradation of Amorphous Films of L-Lactide
Copolymers with Glycolide and D-Lactide. Macromolecular Materials and Engineering 2006,
291 (4), 357-368.
(109) López-Santos, C.; Terriza, A.; Portolés, J.; Yubero, F.; González-Elipe, A. R.,
Physiological Degradation Mechanisms of PLGA Membrane Films under Oxygen Plasma
Treatment. The Journal of Physical Chemistry C 2015, 119 (35), 20446-20452.
(110) Miller, R. A.; Brady, J. M.; Cutright, D. E., Degradation rates of oral resorbable implants
(polylactates and polyglycolates): Rate modification with changes in PLA/PGA copolymer
ratios. Journal of Biomedical Materials Research 1977, 11 (5), 711-719.
(111) Schadlich, A.; Kempe, S.; Mader, K., Non-invasive in vivo characterization of
microclimate pH inside in situ forming PLGA implants using multispectral fluorescence
imaging. Journal of Controlled Release 2014, 179, 52-62.
(112) Zolnik, B. S.; Burgess, D. J., Effect of acidic pH on PLGA microsphere degradation and
release. Journal of Controlled Release 2007, 122 (3), 338-344.
(113) Fu, K.; Pack, D. W.; Klibanov, A. M.; Langer, R., Visual evidence of acidic environment
within degrading poly(lactic-co-glycolic acid) (PLGA) microspheres. Pharmaceutical Research
2000, 17 (1), 100-106.
(114) Rothstein, S. N.; Federspiel, W. J.; Little, S. R., A simple model framework for the
prediction of controlled release from bulk eroding polymer matrices. Journal of Materials
Chemistry 2008, 18 (16), 1873-1880.
(115) Rothstein, S. N.; Federspiel, W. J.; Little, S. R., A unified mathematical model for the
prediction of controlled release from surface and bulk eroding polymer matrices. Biomaterials
2009, 30 (8), 1657-1664.
(116) Brunner, A.; Mader, K.; Gopferich, A., pH and osmotic pressure inside biodegradable
microspheres during erosion. Pharmaceutical Research 1999, 16 (6), 847-853.

181
(117) Danhier, F.; Ansorena, E.; Silva, J. M.; Coco, R.; Le Breton, A.; Preat, V., PLGA-based
nanoparticles: an overview of biomedical applications. Journal of Controlled Release 2012, 161
(2), 505-522.
(118) Dragan, U.; Magdalena, S., Poly(lactide-co-glycolide)-based Micro and Nanoparticles for
the Controlled Drug Delivery of Vitamins. Current Nanoscience 2009, 5 (1), 1-14.
(119) Knight, A. S.; Zhou, E. Y.; Francis, M. B.; Zuckermann, R. N., Sequence Programmable
Peptoid Polymers for Diverse Materials Applications. Advanced Materials 2015, 27 (38), 5665-
5691.
(120) Qu, C. K.; He, J. P., Recent developments in the synthesis of sequence controlled
polymers. Science China-Chemistry 2015, 58 (11), 1651-1662.
(121) Schulz, M. D.; Wagener, K. B., Precision Polymers through ADMET Polymerization.
Macromolecular Chemistry and Physics 2014, 215 (20), 1936-1945.
(122) Tabata, Y.; Abe, H., Synthesis and Properties of Alternating Copolymers of 3-
Hydroxybutyrate and Lactate Units with Different Stereocompositions. Macromolecules 2014,
47 (21), 7354-7361.
(123) Tabata, Y.; Abe, H., Effects of composition and sequential structure on thermal properties
for copolymer of 3-hydroxybutyrate and lactate units. Polymer Degradation and Stability 2013,
98 (9), 1796-1803.
(124) Fernández, J.; Larrañaga, A.; Etxeberria, A.; Wang, W.; Sarasua, J. R., A new generation
of poly(lactide/epsilon-caprolactone) polymeric biomaterials for application in the medical field.
Journal of Biomedical Materials Research Part A 2014, 102 (10), 3573-3584.
(125) Fernandez, J.; Meaurio, E.; Chaos, A.; Etxeberria, A.; Alonso-Varona, A.; Sarasua, J. R.,
Synthesis and characterization of poly (L-lactide/epsilon-caprolactone) statistical copolymers
with well resolved chain microstructures. Polymer 2013, 54 (11), 2621-2631.
(126) Hakkarainen, M.; Höglund, A.; Odelius, K.; Albertsson, A. C., Tuning the Release Rate of
Acidic Degradation Products through Macromolecular Design of Caprolactone-Based
Copolymers. Journal of the American Chemical Society 2007, 129 (19), 6308-6312.
(127) van de Weert, M.; Hennink, W. E.; Jiskoot, W., Protein Instability in Poly(lactic-co-
glycolic acid) Microparticles. Pharmaceutical Research 2000, 17 (10), 1159-1167.
(128) Xie, S.; Zhu, Q.; Wang, B.; Gu, H.; Liu, W.; Cui, L.; Cen, L.; Cao, Y., Incorporation of
tripolyphosphate nanoparticles into fibrous poly(lactide-co-glycolide) scaffolds for tissue
engineering. Biomaterials 2010, 31 (19), 5100-5109.
(129) Gu, B.; Wang, Y.; Burgess, D. J., In vitro and in vivo performance of dexamethasone
loaded PLGA microspheres prepared using polymer blends. International Journal of
Pharmaceutics 2015, 496 (2), 534-540.
(130) Eisenächer, F.; Schädlich, A.; Mäder, K., Monitoring of internal pH gradients within
multi-layer tablets by optical methods and EPR imaging. International Journal of Pharmaceutics
2011, 417 (1–2), 204-215.
(131) Mäder, K.; Gallez, B.; Liu, K. J.; Swartz, H. M., Non-invasive in vivo characterization of
release processes in biodegradable polymers by low-frequency electron paramagnetic resonance
spectroscopy. Biomaterials 1996, 17 (4), 457-461.
(132) Liu, Y.; Schwendeman, S. P., Mapping Microclimate pH Distribution inside Protein-
Encapsulated PLGA Microspheres Using Confocal Laser Scanning Microscopy. Molecular
Pharmaceutics 2012, 9 (5), 1342-1350.

182
(133) Ding, A. G.; Schwendeman, S. P., Acidic Microclimate pH Distribution in PLGA
Microspheres Monitored by Confocal Laser Scanning Microscopy. Pharmaceutical Research
2008, 25 (9), 2041-2052.
(134) Li, L.; Schwendeman, S. P., Mapping neutral microclimate pH in PLGA microspheres.
Journal of Controlled Release 2005, 101 (1-3), 163-173.
(135) Kang, J. C.; Schwendeman, S. P., Determination of diffusion coefficient of a small
hydrophobic probe in poly(lactide-co-glycolide) microparticles by laser scanning confocal
microscopy. Macromolecules 2003, 36 (4), 1324-1330.
(136) Shenderova, A.; Burke, T. G.; Schwendeman, S. P., Evidence for an acidic microclimate
in PLGA microspheres. Proceedings of the Controlled Release Society 1998, (25), 265-266.
(137) Liu, Y.; Ghassemi, A. H.; Hennink, W. E.; Schwendeman, S. P., The microclimate pH in
poly(d,l-lactide-co-hydroxymethyl glycolide) microspheres during biodegradation. Biomaterials
2012, 33 (30), 7584-7593.
(138) Rothstein, S. N.; Huber, K. D.; Sluis-Cremer, N.; Little, S. R., In Vitro Characterization of
a Sustained-Release Formulation for Enfuvirtide. Antimicrobial Agents and Chemotherapy 2014,
58 (3), 1797-1799.
(139) Heidemann, W.; Jeschkeit-Schubbert, S.; Ruffieux, K.; Fischer, J. H.; Jung, H.; Krueger,
G.; Wintermantel, E.; Gerlach, K. L., pH-stabilization of predegraded PDLLA by an admixture
of water-soluble sodiumhydrogenphosphate—results of an in vitro- and in vivo-study.
Biomaterials 2002, 23 (17), 3567-3574.
(140) Shenderova, A.; Ding, A. G.; Schwendeman, S. P., Potentiometric method for
determination of microclimate pH in poly(lactic-co-glycolic acid) films. Macromolecules 2004,
37 (26), 10052-10058.
(141) Ding, A. G.; Shenderova, A.; Schwendeman, S. P., Prediction of microclimate pH in
poly(lactic-co-glycolic acid) films. Journal of the American Chemical Society 2006, 128 (16),
5384-5390.
(142) Bennewitz, M. F.; Watkins, S. C.; Sundd, P., Quantitative intravital two-photon excitation
microscopy reveals absence of pulmonary vaso-occlusion in unchallenged Sickle Cell Disease
mice. Intravital 2014, 3 (2), e29748.
(143) Watkins, S. C., St. Croix, Claudette Current Protocols Select: Methods and Applications
in Microscopy and Imaging. 1 ed.; John Wiley & Sons, Inc.: Hoboken, New Jersey, 2013.
(144) Denk, W.; Strickler, J. H.; Webb, W. W., Two-photon laser scanning fluorescence
microscopy. Science 1990, 248, 73+.
(145) Park, H. J.; Lim, C. S.; Kim, E. S.; Han, J. H.; Lee, T. H.; Chun, H. J.; Cho, B. R.,
Measurement of pH Values in Human Tissues by Two-Photon Microscopy. Angewandte
Chemie-International Edition 2012, 51 (11), 2673-2676.
(146) Jhunjhunwala, S.; Raimondi, G.; Thomson, A. W.; Little, S. R., Delivery of rapamycin to
dendritic cells using degradable microparticles. Journal of Controlled Release 2009, 133 (3),
191-197.
(147) Weiss, R. M.; Li, J.; Liu, H. H.; Washington, M. A.; Giesen, J. A.; Grayson, S. M.; Meyer,
T. Y., Determining Sequence Fidelity in Repeating Sequence Poly(lactic-co-glycolic acid)s.
Macromolecules 2017, 550-560.
(148) Lee, J. H.; Lee, S.; Gho, Y. S.; Song, I. S.; Tchah, H.; Kim, M. J.; Kim, K. H.,
Comparison of confocal microscopy and two-photon microscopy in mouse cornea in vivo.
Experimental Eye Research 2015, 132, 101-108.

183
(149) Wanapun, D.; Kestur, U. S.; Kissick, D. J.; Simpson, G. J.; Taylor, L. S., Selective
Detection and Quantitation of Organic Molecule Crystallization by Second Harmonic Generation
Microscopy. Analytical Chemistry 2010, 82 (13), 5425-5432.
(150) Wampler, R. D.; Kissick, D. J.; Dehen, C. J.; Gualtieri, E. J.; Grey, J. L.; Wang, H.;
Thompson, D. H.; Cheng, J.; Simpson, G. J., Selective Detection of Protein Crystals by Second
Harmonic Microscopy. Journal of the American Chemical Society 2008, 130 (43), 14076-14077.
(151) Lyu, S.; Untereker, D., Degradability of Polymers for Implantable Biomedical Devices.
International Journal of Molecular Sciences 2009, 10 (9), 4033-4065.
(152) Vert, M.; Li, S.; Garreau, H.; Mauduit, J.; Boustta, M.; Schwach, G.; Engel, R.; Coudane,
J., Complexity of the hydrolytic degradation of aliphatic polyesters. Die Angewandte
Makromolekulare Chemie 1997, 247 (1), 239-253.
(153) Engineer, C.; Parikh, J.; Raval, A., Effect of copolymer ratio on hydrolytic degradation of
poly(lactide-co-glycolide) from drug eluting coronary stents. Chemical Engineering Research &
Design 2011, 89 (3A), 328-334.
(154) Shenderova, A.; Burke, T. G.; Schwendeman, S. P., The acidic microclimate in
poly(lactide-co-glycolide) microspheres stabilizes camptothecins. Pharmaceutical Research
1999, 16 (2), 241-248.
(155) Anderson, J. M.; Rodriguez, A.; Chang, D. T., Foreign body reaction to biomaterials.
Seminars in immunology 2008, 20 (2), 86-100.
(156) Anderson, J. M.; Shive, M. S., Biodegradation and biocompatibility of PLA and PLGA
microspheres. Advanced Drug Delivery Reviews 2012, 64, 72-82.
(157) Athanasiou, K. A.; Niederauer, G. G.; Agrawal, C. M., Sterilization, toxicity,
biocompatibility and clinical applications of polylactic acid/ polyglycolic acid copolymers.
Biomaterials 1996, 17 (2), 93-102.
(158) Zandstra, J.; Hiemstra, C.; Petersen, A. H.; Zuidema, J.; van Beuge, M. M.; Rodriguez, S.;
Lathuile, A. A.; Veldhuis, G. J.; Steendam, R.; Bank, R. A.; Popa, E. R., Microsphere size
influences the foreign body reaction. European Cells & Materials 2014, 28, 335-347.
(159) Hickey, T.; Kreutzer, D.; Burgess, D. J.; Moussy, F., In vivo evaluation of a
dexamethasone/PLGA microsphere system designed to suppress the inflammatory tissue
response to implantable medical devices. Journal of Biomedical Materials Research 2002, 61
(2), 180-187.
(160) Anderson, J. M.; Lanza, R.; Thomson, J. A.; Nerem, R. M., Biocompatibility and
Bioresponse to Biomaterials. In Principles of Regenerative Medicine, Academic Press: San
Diego, 2008; pp 704-723.
(161) Sheikh, Z.; Najeeb, S.; Khurshid, Z.; Verma, V.; Rashid, H.; Glogauer, M., Biodegradable
Materials for Bone Repair and Tissue Engineering Applications. Materials 2015, 8 (9), 5273.
(162) Athanasiou, K. A.; Zhu, C.; Lanctot, D. R.; Agrawal, C. M.; Wang, X., Fundamentals of
biomechanics in tissue engineering of bone. Tissue Engineering 2000, 6 (4), 361-81.
(163) Waris, E.; Ashammakhi, N.; Kaarela, O.; Raatikainen, T.; Vasenius, J., Use of
Bioabsorbable Osteofixation Devices in the Hand. Journal of Hand Surgery (British and
European Volume) 2004, 29 (6), 590-598.
(164) Södergård, A.; Stolt, M., Properties of lactic acid based polymers and their correlation
with composition. Progress in Polymer Science 2002, 27 (6), 1123-1163.
(165) Agrawal, C. M.; Ray, R. B., Biodegradable polymeric scaffolds for musculoskeletal tissue
engineering. Journal of Biomedical Materials Research 2001, 55 (2), 141-150.

184
(166) Stähelin, A. C.; Weiler, A.; Rüfenacht, H.; Hoffmann, R.; Geissmann, A.; Feinstein, R.,
Clinical degradation and biocompatibility of different bioabsorbable interference screws: A
report of six cases. Arthroscopy: The Journal of Arthroscopic & Related Surgery 1997, 13 (2),
238-244.
(167) Tiainen, J.; Veiranto, M.; Suokas, E.; Törmälä, P.; Waris, T.; Ninkovic, M.; Ashammakhi,
N., Bioabsorbable Ciprofloxacin-Containing and Plain Self-Reinforced Polylactide-
Polyglycolide 80/20 Screws: Pullout Strength Properties in Human Cadaver Parietal Bones.
Journal of Craniofacial Surgery 2002, 13 (3), 427-433.
(168) Törmälä, P., Biodegradable self-reinforced composite materials; Manufacturing structure
and mechanical properties. Clinical Materials 1992, 10 (1-2), 29-34.
(169) Liu, H.; Webster, T. J., Mechanical properties of dispersed ceramic nanoparticles in
polymer composites for orthopedic applications. International Journal of Nanomedicine 2010, 5,
299-313.
(170) Park, J. J.; Yu, E. J.; Lee, W.; Ha, C., Mechanical properties and degradation studies of
poly(D,L-lactide-co-glycolide) 50:50/graphene oxide nanocomposite films. Polymers for
Advanced Technologies 2014, 25 (1), 48-54.
(171) Armentano, I.; Dottori, M.; Fortunati, E.; Mattioli, S.; Kenny, J. M., Biodegradable
polymer matrix nanocomposites for tissue engineering: A review. Polymer Degradation and
Stability 2010, 95 (11), 2126-2146.
(172) Virlan, M. J. R.; Miricescu, D.; Totan, A.; Greabu, M.; Tanase, C.; Sabliov, C. M.;
Caruntu, C.; Calenic, B., Current Uses of Poly(lactic-co-glycolic acid) in the Dental Field: A
Comprehensive Review. Journal of Chemistry 2015, 2015, 12.
(173) Scholz, M. S.; Blanchfield, J. P.; Bloom, L. D.; Coburn, B. H.; Elkington, M.; Fuller, J.
D.; Gilbert, M. E.; Muflahi, S. A.; Pernice, M. F.; Rae, S. I.; Trevarthen, J. A.; White, S. C.;
Weaver, P. M.; Bond, I. P., The use of composite materials in modern orthopaedic medicine and
prosthetic devices: A review. Composites Science and Technology 2011, 71 (16), 1791-1803.
(174) Zhu, G. Q.; Wang, F. G.; Gao, Q. C.; Liu, Y. Y., Physicochemical Properties of
Poly(lactic acid-co-glycolic acid) Film Modified via Blending with Poly(butyl acrylate-co-
methyl methacrylate). Polimeros-Ciencia E Tecnologia 2013, 23 (5), 619-623.
(175) Zhu, G. Q.; Wang, F. G.; Tan, H. S.; Gao, Q. C.; Liu, Y. Y., Properties of poly(lactic acid-
co-glycolic acid) film modified by blending with polyurethane. Chemical Papers 2014, 68 (2),
246-252.
(176) McDonald, P. F.; Geever, L. M.; Lyons, J. G.; Higginbotham, C. L., Physical and
Mechanical Properties of Blends Based on Poly (dl-lactide), Poly (l-lactide-glycolide) and Poly
(epsilon-caprolactone). Polymer-Plastics Technology and Engineering 2010, 49 (7), 678-687.
(177) Hasirci, V.; Litman, A. E.; Trantolo, D. J.; Gresser, J. D.; Wise, D. L.; Margolis, H. C.,
PLGA bone plates reinforced with crosslinked PPF. Journal of Materials Science: Materials in
Medicine 2002, 13 (2), 159-167.
(178) Phong, L.; Han, E. S. C.; Xiong, S.; Pan, J.; Loo, S. C. J., Properties and hydrolysis of
PLGA and PLLA cross-linked with electron beam radiation. Polymer Degradation and Stability
2010, 95 (5), 771-777.
(179) Washington, M. A.; Balmert, S. C.; Fedorchak, M. V.; Little, S. R.; Watkins, S. C.;
Meyer, T. Y., Monomer sequence in PLGA microparticles: Effects on acidic microclimates and
in vivo inflammatory response. Submitted for publication 2017.

185
(180) Middleton, L. R.; Trigg, E. B.; Schwartz, E.; Opper, K. L.; Baughman, T. W.; Wagener,
K. B.; Winey, K. I., Role of Periodicity and Acid Chemistry on the Morphological Evolution and
Strength in Precise Polyethylenes. Macromolecules 2016, 49 (21), 8209-8218.
(181) Rana, D.; Mounach, H.; Halary, J. L.; Monnerie, L., Differences in mechanical behavior
between alternating and random styrene-methyl methacrylate copolymers. Journal of Materials
Science 2005, 40 (4), 943-953.
(182) Versteegen, R. M.; Kleppinger, R.; Sijbesma, R. P.; Meijer, E. W., Properties and
morphology of segmented copoly(ether urea)s with uniform hard segments. Macromolecules
2006, 39 (2), 772-783.
(183) Målberg, S.; Höglund, A.; Albertsson, A. C., Macromolecular Design of Aliphatic
Polyesters with Maintained Mechanical Properties and a Rapid, Customized Degradation Profile.
Biomacromolecules 2011, 12 (6), 2382-2388.
(184) Li, S. M.; Garreau, H.; Vert, M., Structure property relationships in the case of the
degradation of massive aliphatic poly-(alpha-hydroxy acids) in aqueous-media. .2. Degradation
of lactide-glycolide copolymers - PLA37.5GA25 and PLA75GA25. Journal of Materials
Science-Materials in Medicine 1990, 1 (3), 131-139.
(185) Vey, E.; Roger, C.; Meehan, L.; Booth, J.; Claybourn, M.; Miller, A. F.; Saiani, A.,
Degradation mechanism of poly(lactic-co-glycolic) acid block copolymer cast films in phosphate
buffer solution. Polymer Degradation and Stability 2008, 93 (10), 1869-1876.
(186) Pietrzak, W. S.; Sarver, D. R.; Verstynen, M. L., Bioabsorbable polymer science for the
practicing surgeon. J Craniofac Surg 1997, 8 (2), 87-91.
(187) Lu, L.; Garcia, C. A.; Mikos, A. G., In vitro degradation of thin poly(DL-lactic-co-
glycolic acid) films. Journal of Biomedical Materials Research 1999, 46 (2), 236-244.
(188) Maxwell, A. S.; Tomlins, P. E., New approaches to mapping through-thickness variations
in the degradation in poly (lactide-co-glycolide). Polymer Degradation and Stability 2011, 96
(5), 1015-1021.
(189) Li, S. M.; Garreau, H.; Vert, M., Structure property relationships in the case of the
degradation of massive aliphatic poly-(alpha-hydroxy acids) in aqueous-media. 1.poly(D,L-lactic
acid). Journal of Materials Science-Materials in Medicine 1990, 1 (3), 123-130.
(190) Li, S. M.; Garreau, H.; Vert, M., Structure property relationships in the case of the
degradation of massive aliphatic poly-(alpha-hydroxy acids) in aqueous-media. 3. Indluence of
the morphology of poly(L-lactic acid). Journal of Materials Science-Materials in Medicine 1990,
1 (4), 198-206.
(191) Shirazi, R. N.; Aldabbagh, F.; Erxleben, A.; Rochev, Y.; McHugh, P., Nanomechanical
properties of poly(lactic-co-glycolic) acid film during degradation. Acta Biomaterialia 2014, 10
(11), 4695-4703.
(192) Shirazi, R. N.; Aldabbagh, F.; Ronan, W.; Erxleben, A.; Rochev, Y.; McHugh, P., Effects
of material thickness and processing method on poly(lactic-co-glycolic acid) degradation and
mechanical performance. Journal of Materials Science-Materials in Medicine 2016, 27 (10), 12.
(193) Félix Lanao, R. P.; Jonker, A. M.; Wolke, J. G. C.; Jansen, J. A.; van Hest, J. C. M.;
Leeuwenburgh, S. C. G., Physicochemical Properties and Applications of Poly(lactic-co-glycolic
acid) for Use in Bone Regeneration. Tissue Engineering. Part B, Reviews 2013, 19 (4), 380-390.
(194) Lyu; Schley, J.; Loy, B.; Lind, D.; Hobot, C.; Sparer, R.; Untereker, D., Kinetics and
Time−Temperature Equivalence of Polymer Degradation. Biomacromolecules 2007, 8 (7), 2301-
2310.

186
(195) Hakkarainen, M.; Albertsson, A.-C.; Karlsson, S., Weight losses and molecular weight
changes correlated with the evolution of hydroxyacids in simulated in vivo degradation of homo-
and copolymers of PLA and PGA. Polymer Degradation and Stability 1996, 52 (3), 283-291.
(196) Beslikas, T.; Gigis, I.; Goulios, V.; Christoforides, J.; Papageorgiou, G. Z.; Bikiaris, D. N.,
Crystallization study and comparative in vitro-in vivo hydrolysis of PLA reinforcement ligament.
Int J Mol Sci 2011, 12 (10), 6597-618.
(197) Pitt, C. G.; Zhong-wei, G., Modification of the rates of chain cleavage of poly(ϵ-
caprolactone) and related polyesters in the solid state. Journal of Controlled Release 1987, 4 (4),
283-292.
(198) Pitt, C. G.; Chasalow, F. I.; Hibionada, Y. M.; Klimas, D. M.; Schindler, A., Aliphatic
polyesters. I. The degradation of poly(ϵ-caprolactone) in vivo. Journal of Applied Polymer
Science 1981, 26 (11), 3779-3787.
(199) Gleadall, A.; Pan, J. Z.; Kruft, M. A.; Kellomaki, M., Degradation mechanisms of
bioresorbable polyesters. Part 1. Effects of random scission, end scission and autocatalysis. Acta
Biomaterialia 2014, 10 (5), 2223-2232.
(200) Vay, K.; Friess, W.; Scheler, S., A detailed view of microparticle formation by in-process
monitoring of the glass transition temperature. European Journal of Pharmaceutics and
Biopharmaceutics 2012, 81 (2), 399-408.
(201) Han, F. Y.; Thurecht, K. J.; Whittaker, A. K.; Smith, M. T., Bioerodable PLGA-Based
Microparticles for Producing Sustained-Release Drug Formulations and Strategies for Improving
Drug Loading. Frontiers in Pharmacology 2016, 7, 185.
(202) Wang, J.; Schwendeman, S. P., Mechanisms of solvent evaporation encapsulation
processes: Prediction of solvent evaporation rate. Journal of Pharmaceutical Sciences 1999, 88
(10), 1090-1099.
(203) Wischke, C.; Schwendeman, S. P., Principles of encapsulating hydrophobic drugs in
PLA/PLGA microparticles. International Journal of Pharmaceutics 2008, 364 (2), 298-327.
(204) Iqbal, M.; Zafar, N.; Fessi, H.; Elaissari, A., Double emulsion solvent evaporation
techniques used for drug encapsulation. International Journal of Pharmaceutics 2015, 496 (2),
173-190.
(205) Herrero-Vanrell, R.; Bravo-Osuna, I.; Andrés-Guerrero, V.; Vicario-de-la-Torre, M.;
Molina-Martínez, I. T., The potential of using biodegradable microspheres in retinal diseases and
other intraocular pathologies. Progress in Retinal and Eye Research 2014, 42, 27-43.
(206) Nan, K.; Ma, F.; Hou, H.; Freeman, W. R.; Sailor, M. J.; Cheng, L., Porous silicon oxide–
PLGA composite microspheres for sustained ocular delivery of daunorubicin. Acta Biomaterialia
2014, 10 (8), 3505-3512.
(207) Ling, Y.; Yang, Y.; Lu, N.; You, Q.-d.; Wang, S.; Gao, Y.; Chen, Y.; Guo, Q.-L.,
Endostar, a novel recombinant human endostatin, exerts antiangiogenic effect via blocking
VEGF-induced tyrosine phosphorylation of KDR/Flk-1 of endothelial cells. Biochemical and
Biophysical Research Communications 2007, 361 (1), 79-84.
(208) Chen, W.; Hu, S., Suitable carriers for encapsulation and distribution of endostar:
comparison of endostar-loaded particulate carriers. International Journal of Nanomedicine 2011,
6, 1535-1541.