the impact of lean methods and tools on the operational
TRANSCRIPT
The impact of lean methods and tools on the operational
performance of manufacturing organisations
1st Author
Mr. Ioannis Belekoukias
Warwick Manufacturing Group, The University of Warwick
International Manufacturing Centre, University of Warwick
Coventry, UK, CV4 7AL
2nd
and Corresponding Author
Dr. Jose Arturo Garza-Reyes*
Centre for Supply Chain Improvement
The University of Derby
Kedleston Road Campus, Derby, UK, DE22 1 GB
E-mail: [email protected]
Tel. +44(0)1332593281
3rd
Author
Dr. Vikas Kumar
Bristol Business School
University of West of England Coldharbour Ln, Bristol, UK, BS16 1QY
E-mail: [email protected]
* Corresponding Author
The impact of lean methods and tools on the operational
performance of manufacturing organisations
Author 1 Affiliation
Author 2 Affiliation
Author 3 Affiliation
Author 4 Affiliation
Abstract
Evidence suggests that lean methods and tools have helped manufacturing
organisations to improve their operations and processes. However, the real effect
of these methods and tools on contemporary measures of operational
performance, i.e., cost, speed, dependability, quality and flexibility is still unclear.
This paper investigates the impact of five essential lean methods, i.e., JIT,
autonomation, kaizen, TPM, and VSM on these measures. A linear regression
analysis modelled the correlation and impact of these lean practices on the
operational performance of 140 manufacturing organisations around the world. In
addition, structural equation modelling (SEM) was used to cross verify the
findings of the regression and correlation analyses. The results indicate that JIT
and automation have the strongest significance on operational performance while
kaizen, TPM, and VSM seem to have a lesser, or even negative, effect on it. This
paper provides further evidence regarding the effects that lean practices have on
the performance of organisations and thus the research offers companies, and
their managers, a better understanding of the relationship between the lean
strategy and the performance of their operations.
Keywords: autonomation, JIT, kaizen, lean methods, measures of operational
performance, SEM, TPM, VSM.
1. Introduction
With the contemporary market being more and more competitive worldwide, manufacturing
organisations are under immense pressure to pursue operational excellence and improve their
performance in order to reduce their costs and provide products of higher quality in shorter
lead times. Lean manufacturing principles and techniques have been widely used by
manufacturing organisations to achieve these and gain a competitive advantage over their
rivals (Garza-Reyes et al., 2012). Lean manufacturing is a management approach to

manufacturing that strives to make organisations more competitive in the market by
increasing efficiency and decreasing costs through the elimination of non-value added steps
and inefficiencies in the process (Sohal and Egglestone, 1994; Garza-Reyes et al., 2012).
Various methods and tools that aim to improve the operational performance of
organisations are comprised under the lean strategy’s umbrella (Bhasin, 2012). In particular,
Rocha-Lona et al. (2013) consider Just-in-Time (JIT), total productive maintenance (TPM),
autonomation, value stream mapping (VSM), and kaizen/continuous improvement (CI) as the
most essential methods of the lean approach. JIT is a method which states that an
organisation should produce the right item at the right time (Womack and Jones, 2003); this
helps in reducing inventories, space utilisation and possible wastes. The most commonly
associated tools of JIT are one piece flow, pull system, takt time, cell manufacturing, levelled
production, kanban, visual control, multifunctional employees, and JIT purchasing (Rocha-
Lona et al. 2013; Kumar, 2010; McLachlin, 1997). In the case of TPM, it is a lean
manufacturing method that contributes to the optimisation of predictive, preventive and
corrective maintenance activities in order to achieve the maximum level of efficiency and
profit from production equipment (Brah and Chong, 2004). To achieve this, TPM relies on
tools such as overall equipment effectiveness (OEE), single minute exchange of die (SMED),
5S, autonomous maintenance, quality maintenance, initial control before starting production,
and a safety and hygiene environment (Rocha-Lona et al., 2013; Brah and Chong, 2004).
Autonomation, also known as jidoka, is a lean method that targets the reduction of quality
defects with the use of tools that include mistake proofing devises (i.e. poka-yokes), visual
control systems (i.e. andons) and a full working system (Shingo, 1986). In the case of VSM,
it is a lean manufacturing method that visually identifies and measures waste resulting from
the inefficiencies, unreliability and/or incapability of information, time, money, space,
people, machines, material and tools during the transformation process of a product
(Pavnaskar et al., 2003). Rocha-Lona et al. (2013) considers the current and future value
stream maps and flow diagrams as the most commonly used tools employed during a VSM
analysis. Finally, kaizen, or CI, is one of the most important processes in a lean organisation.
The focus of kaizen is on the elimination of waste through the continuous and incremental
improvement of processes. Once embedded as part of an organisation’s culture, kaizen acts as
a platform for the sustainment of lean initiatives (Imai, 2012). Rocha-Lona et al. (2013),
Bhuiyan and Baghel (2005) and Lyu (1996) suggest 5S, brainstorming, continuous flow,
kanbans, data check sheet, five whys, run charts, Pareto chart, VSM, Gantt chart, mistake
proofing and process maps as those tools that most commonly contribute to the kaizen
strategy. Table 1 presents a summary of the most essential methods of lean manufacturing
and the tools comprised under their umbrella.
Insert Table 1 in here
Several decades have passed since the initial conception of lean manufacturing. Since
then, evidence has suggested it as an effective approach to improve the performance of
organisations (Forrester et al., 2010). For this reason, a broad portfolio of academic research
(see Section 2) has been dedicated to investigate the impact of its methods and tools on
various measures of performance. However, due the nature of the research conducted, the
overall effect of lean methods and tools on operational performance may still be considered
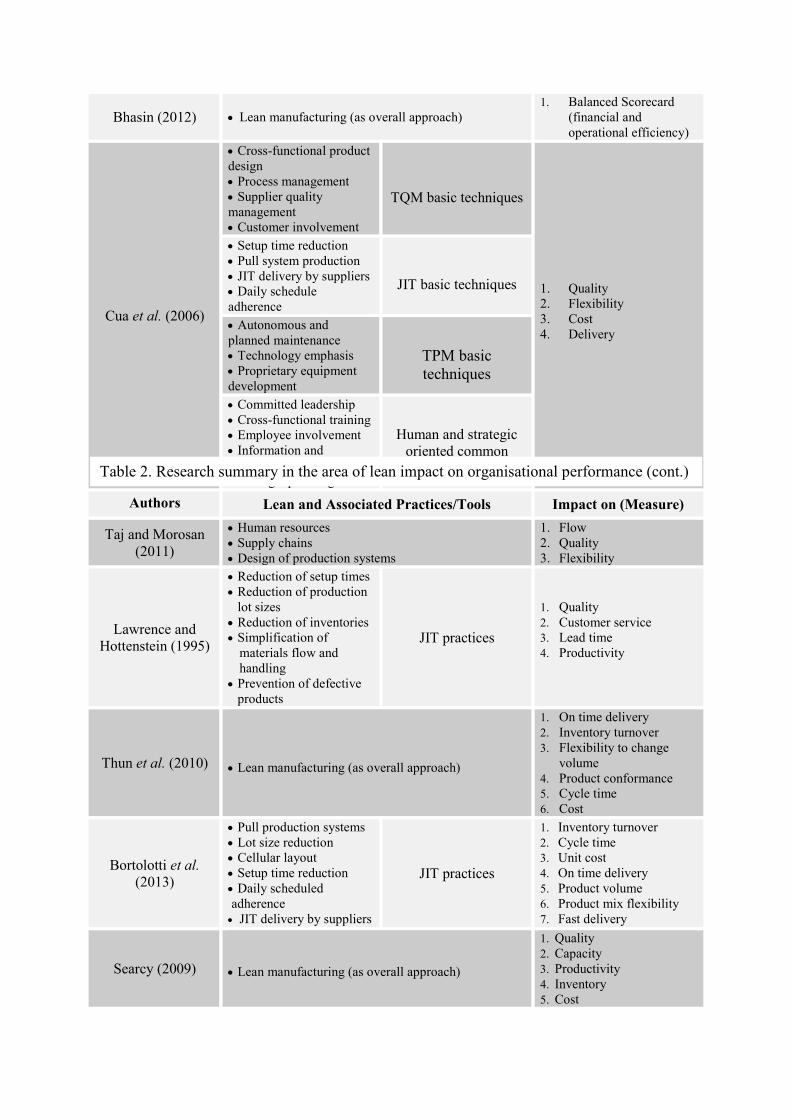
unclear. For example, the research discussed in Section 2 and summarised in Table 2 has
been mainly focused on very specific lean methods and tools; that is, it has not included all
the essential components (i.e. JIT, TPM, autonomation, VSM and kaizen/CI) strongly
associated to the lean approach nowadays. Similarly, the measures of performance selected to
investigate the effects of lean practices vary considerably from some researches to others.
Thus, to complement these studies and support the body of knowledge on the effects that lean
manufacturing has on the performance of organisations, this paper investigates the impact of
the main methods and tools of lean manufacturing on what Ahmad and Schroeder (2003),
Slack et al. (2013) and Hill (1989) consider the most important contemporary measures of
operational performance, i.e., cost, speed, dependability, quality, and flexibility.
2. Lean manufacturing and its impact on performance
When measuring the impact of lean practices, different authors have tried to connect and reflect
the combined effect of these practices into one indicator (Bayou and Korvin, 2008), now
popularly known as “leanness”. In this context, Bayou and de Korvin (2008) developed a
model that measures the level of leanness using lean attributes such as JIT, quality control,
and kaizen. Bayou and de Korvin (2008) used this model to compare the level of leanness of
General Motors and Ford using Honda as a benchmark company. From the financial
statements of these companies, they concluded that Ford was 17 percent leaner than General
Motors. Soriano-Meier and Forrester (2002) developed a model with nine variables to
measure the degree of leanness of manufacturing organisations. The model has been used to
measure the degree of leanness of the UK ceramic sector (Soriano-Meier and Forrester, 2002)
and the agricultural machining sector of Brazil (Forrester et al., 2010). Anvari et al. (2013)
examined the impact of specific influences on the leanness of a manufacturing system. They
found that the most crucial components to leanness are defects, cost, lead time, and value.
Moreover, in their study Anvari et al. (2013) developed a method to evaluate the impact of
specific lean attributes on leanness. Wan and Chen (2008) proposed a measure to evaluate the
overall leanness level of an organisation having a self-contained benchmark. In their model,
Wan and Chen (2008) considered cost, value, and time in order to evaluate leanness. Finally,
Vinodh and Vimal (2012) developed a model that measures the level of leanness based on
thirty criteria and by using a fuzzy logic approach.
However, although the level of leanness is related to the performance of an organisation,
various authors have investigated the impact of lean manufacturing practices not based on an
overall and combined indicator but on certain individual measures. Table 2 presents a
summary of this research. In reference to Table 2, Rahman et al. (2010) developed a model in
order to measure the impact that the implementation of lean practices has on the operational
performance of Thai manufacturing organisations. They found that all the three constructs
studied (i.e. JIT, waste minimisation and flow management) have a significant impact on
their operational performance. However, JIT has a higher importance for large companies
compared to SMEs, whereas waste minimisation affects more SMEs compared to large
organisations. Shah and Ward (2007) developed a method to measure lean production and
provided a framework which identified its most important dimensions (see Table 2). In a
different study, Shah and Ward (2003) examined the effect on operational performance of the
lean practices and contextual factors presented in Table 2. Shah and Ward (2003) found that
JIT, Total Quality Management (TQM), TPM, and Human Resource Management (HRM) are
positively related to operational performance. However, these only represented 23 percent of
the effect related to the overall operational performance. Moreover, they identified that there
is no effect of unionisation on operational performance. In terms of the size and age of the
plant, it was found that it is not always advantageous that large size will lead to higher
operational performance and that in many cases, large size has a negative impact on the
operational performance when the effects of JIT, TQM, TPM, and HRM are taken into
consideration. Bhasin (2012) adopted a Balanced Scorecard to measure the financial and

operational efficiency levels of an organisation during the implementation of lean. His study
found that large organisations that implemented lean manufacturing achieved higher
improvements in their performance compared to SMEs. Cua et al. (2006) suggested that there
are important variations in manufacturing performance, which are related to the level of
adoption of the lean techniques, practices, and other coherent factors they studied and
categorised (see Table 2). In summary, Cua et al. (2006) found that JIT, TPM, and TQM
positively and significantly affect quality, cost, flexibility, and delivery.
Insert Table 2 in here
In another study, Taj and Morosan (2011) examined the impact that lean operations have
on the performance of Chinese manufacturing companies. Specifically, they studied the
effect that the lean operation practices presented in Table 2 had on the operational
performance measures of flow, quality and flexibility. They found that supply chains, human
resources, and design of production systems have remarkable positive effects on the
flexibility and flow measures while quality is only related to the design of the production
system. The relationship between some JIT activities and performance was studied by
Lawrence and Hottenstein (1995) (see Table 2). In contrast to the findings of Sakakibara et
al. (1997), Lawrence and Hottenstein (1995) concluded that JIT is related to superior
performance. Thun et al. (2010) found that the higher the degree of implementation of lean
manufacturing practices, the better the performance is. Bortolotti et al. (2013) studied the
effect that demand variability and product customisation have on JIT practices and how this
further impacts operational performance; they used the practices and measures shown in
Table 2. Demand variability and product customisation are two characteristics that are
related to manufacturing repetitiveness and the degree of repetitiveness can negatively affect
the effect of JIT on performance. Bortolotti et al. (2013) found that JIT has a positive effect
on operational performance, which is not affected from the level of product customisation
and that demand variability has a significant impact on organisational performance, in terms
of responsiveness and efficiency. Searcy (2009) developed a lean performance score and
measured lean performance taking into account the five elements presented in Table 2.
Searcy (2009) considered the measurement of the lean transformation as a key element for
its success.
Furthermore, Fullerton and Wempe (2009) developed a model where they show the
connection of non-financial measures to lean practices and the combined effect that these
have on the financial performance of an organisation. Fullerton and Wempe (2009) found that
non-financial manufacturing performance measures mediate the relation between the
financial performance and lean manufacturing practices. They also found that the lean
practices they tested (see Table 2) had varied and direct effects on profitability. Hallgren and
Olhager (2009) studied lean and agile manufacturing and evaluated them according to the
impact that they have on specific indicators that measure the operational performance of an
organisation (see Table 2). They found that the most significant differences between the lean
and agile manufacturing concepts were that lean affects at a large scale cost performance
while agile manufacturing has a significant impact on volume and product mix flexibility,
which lean does not. Behrouzi and Wong (2011) developed a measurement model using
fuzzy membership values, and the lean practices and measures shown in Table 2. Behrouzi
and Wong (2011) suggested that based on the value of a performance’s score; managers
could obtain an overview of the effectiveness of the manufacturing strategies. Rivera and
Chen (2007) proposed the use of cost-time profile, which is a tool that evaluates the
cumulative cost in the production of a product as time passes, in order to evaluate the impact
that lean tools have on the cost-time investment of a product. In this way, they highlighted the
economic impact that the reduction of waiting time, durations of activities, reduction of
material, and JIT materials have as a result of the application of lean manufacturing tools.
Dora et al. (2013) examined the application of lean manufacturing and its impact on
operational performance measures, shown in Table 2, in some SMEs of the food processing
industry. Dora et al. (2013) found that productivity and quality showed the highest
improvement due to the implementation of lean. In addition, the analysis revealed significant
differences, in the improvement of the operational measures studied, among the countries
where lean was implemented.
Hofer et al. (2012) investigated the impact that lean production has on the financial
performance of an organisation and the mediating role of inventory leanness on proving the
economic benefits associated with the deployment of a lean strategy. Moreover, they
examined the effect of internal and external lean practices on performance and whether the
effect is greater if they are implemented concurrently. For this purpose they classified lean
practices as internal and external, as presented in Table 2. Hofer et al. (2012) found that
inventory plays a significant role in the relationship between financial performance and lean
production. Furthermore, they found that external lean practices do not have a significant
direct effect on financial performance, but that external lean practices affect the inventory
leanness. Karim and Arif-Uz-Zaman (2013) developed a method which evaluates the
performance of lean manufacturing using continuous performance measurement. They found
that the method they proposed contributed to the selection of the most appropriate lean tools
and the identification of relevant performance indicators. Moreover, they concluded that the
continuous performance measurement matrices are effective methods for the continuous
evaluation of lean manufacturing performance. Finally, Sakakibara et al. (1997) investigated
the effect of JIT and its infrastructure on operational performance and the competitive
advantage. They used in their survey the six JIT practices and measures of performance
shown in Table 2. Sakakibara et al. (1997) found that the effect of JIT practices on the
operational performance of an organisation was not significant. However, the results showed
the significant connection between infrastructure and JIT practices, and the combined
approach of JIT management and infrastructure practice and impact that this connection have
on operational performance. Furthermore, they found that infrastructure could explain the
level of operational performance and that competitive advantage was strongly related to the
operational performance.
Unlike these studies, the research presented in this paper investigates the effect of JIT,
TPM, autonomation, VSM and kaizen/CI, which are considered cornerstones of the lean
strategy on the most important measures of operational performance, i.e., cost, speed,
dependability, quality and flexibility. Thus, this study aims at not only complementing the
previous research in this area but also expanding its reach and scope.
3. Research methodology
To evaluate the effect of lean manufacturing on operational performance, the relationship
between the measures studied (i.e. dependent variable - Yi) was established as an
accumulation of a number of explanatory independent variables (i.e. lean methods - Xn),
where each of them had its own role and effect on the dependent variable. Such relationship
is represented by the following regression model and the variables presented in Table 3.
Yi = β0 + β1X1i + β2X2i + β3X3i + β4X4i + β5X5i + еi (1)

Insert Table 3 in here
The data collection for the regression model was carried out through a survey
questionnaire designed by using the SNAP computer software (Saunders et al., 2009). The
questionnaire consisted of two main sections. Section 1 comprised a set of general questions
related to the organisation’s size, location and industrial sector where the respondent
company competed as well as the respondent’s position. In the case of section 2, it was
focused on investigating whether the participating companies had experienced, based on the
perception of the respondent, some degree of improvement in relation to the measures of
operational performance studied after the implementation of the lean methods considered
within this investigation. Initially, the respondents were asked which of the tools (see Table
1), for every one of the five lean methods studied, their organisations had implemented. For
example, if a company had implemented four out of the nine tools that comprised JIT, then
the extent of implementation of JIT (X1) was considered to be .444. This helped to measure
the extent of implementation for every lean method (Xn). Subsequently, the respondents were
asked to estimate the percentage of improvement achieved for every operational indicator
(i.e. cost, speed, dependability, quality and flexibility - Yi). This was measured by using a
Likert scale from 0 percent to 100 percent, with increments of 5 percent (i.e. 0, 5, 10, 15, etc.)
for every one of the measures studied. See Figure 1 for an example of some of the key
questions included in the questionnaire survey. Six different regressions, one for every
dependable variable Yi (i.e. quality-Y1 or speed-Y2 or dependability-Y3 or flexibility-Y4 or
cost-Y5) plus one for overall operational performance (Y0) were run as indicated in Table 3.
In order to reduce the degree of subjectivity of the study, the survey targeted respondents that
included quality directors/managers, lean six sigma black belts, or executives that had
knowledge on the subject. This type of respondents was considered to have a deeper and
more accurate understanding of the company’s performance before and after the
implementation of lean. In addition, the respondents were initially briefed about the Likert
scale, and some other aspects of the questionnaire that included the definition of the lean
concepts, methods and tools included, in order to obtain more uniform and less subjective
answers. The questionnaires were anonymous in order to protect the respondent’s own
personal privacy, integrity and interests. This strategy helped to avoid/minimise any possible
biased answer as suggested by Robson (2002) and Saunders et al. (2009). In terms of the time
that it had taken the surveyed organisations to reach and/or sustain the improvements
achieved, this was not considered within this study due to the complexity of adding an extra
variable (i.e. time) to the analysis. The inclusion of this “extra-variable” can be considered as
part of the agenda for further research proposed from this work. Before being distributed, the
questionnaire was validated through a small pilot study (Robson, 2002) that consisted in
distributing the questionnaire to four experts. The objective of this was to eliminate irrelevant
and ambiguous questions, receive feedback on the questionnaire’s logic, add extra relevant
questions if necessary, and check its language and presentation.
Insert Figure 1 in here
The questionnaires were randomly distributed via e-mail to 710 organisations that were
perceived, after reviewing their official websites, annual reports and press releases, as having
implemented lean. The companies were identified from data bases such as Amadeus,
Marketline and LinkedIn. When contacted, the respondents were initially asked whether their
organisations had embarked in the implementation of lean and whether they considered it as
the main operations improvement strategy employed by their companies. If the answer was
“no” to any of these two questions, then the organisation was not considered suitable for the
study. On the other hand, if the answer was “yes” to both of these questions, then the
questionnaire was administrated to the respondent. Out of the 710 questionnaires that were
sent, 141 answers were received, but 1 was eliminated for being incomplete. Thus, the sample
available for analysis was 140 responses, which corresponded to a response rate of 20
percent. Although the response rate did not reach the range of between 30 to 35 percent
perceived by Cohen et al. (2007) and Watt et al. (2002) as acceptable, based on comparable
sample sizes used on similar researches (i.e. Thun et al., 2010; Rahman et al., 2010; Bhasin,
2012), this response rate was still considered acceptable to carry out a reliable analysis and
drawn conclusions to complement the studies discussed in Section 2.
The computation of the linear regression and correlation analyses was carried out using
the advanced statistical software EViews and SPSS. In the case of the structural equation
modelling (SEM) analysis, it was conducted using the AMOS software. The regressions and
correlation analyses were performed to understand the impact of lean methods on operational
performance. To understand the causality, explore the interrelationship among the variables,
and verify the findings of the regressions, structural equation modelling (SEM) analysis was
also used as a methodological tool. Path analysis is a special case of structural equation
modelling (SEM), which is one of the emerging methodologies in operations management
(Kumar et al., 2008; Shah and Goldstein, 2006). The multi-iterated modelling approach of
SEM allows a detailed understanding of particular variables in terms of key influencing
factors (Kumar et al. 2011). It is used to find the causal relationship among the variables. It
allows examination of a set of relationships between one or more independent variables and
one or more dependent variables, and estimates the relative importance of the alternative
paths of influence (Kline, 1998; Kumar et al., 2008). In practice, it is a straightforward
extension of multiple regressions, aimed at providing estimates of the magnitude of
hypothesised causal connections between sets of variables. In this research Path Analysis is
used to depict the inter-relationships between the variables and, most importantly, to show
the impact of lean methods on operational performance. Path Analysis therefore will explore
the causality among the measured constructs. Moreover, it will provide justification for the
earlier findings of the correlation and regression analysis methods.
4. Results
The first section of the survey provided a profile’s overview of the responding
organisations and individual respondents. In this case, 78 percent of the respondents worked
for large organisations, 13 percent for medium size, and 9 percent for small companies. 46
percent of the respondent organisations were located in Europe, 33 percent in North America,
11 percent in Asia, 6 percent in Africa, and 3 and 1 percent in South America and Australia
respectively. The respondent organisations competed in various manufacturing sectors that
included machinery, primary metals, chemical, wood products, transportation equipment,
furniture and related products, among others. In terms of the individual respondents, 48
percent were executives that had knowledge on the subject, 33 percent quality
directors/managers and 19 lean six sigma green belts. The study results showed that all of the
140 organisations surveyed had implemented all of the lean methods (i.e. JIT, TPM,
Automation, VSM and Kaizen) studied, although the extent of implementation was different
for all of them as not all of the companies had implemented all of the lean tools (see Table 1).

To analyse the survey data, a correlation analysis was firstly performed (Table 4). This
showed that most of the lean methods were correlated with the operational performance
measures studied, except VSM, which did not show any significant correlation. Some of the
correlations between few variables are high indicating that multicollinearity may be an issue
however, referring to literature such as Sheeran and Orbell (1999) and Grewal et al. (2004)
multicollinearity only causes problem when it is extremely high (over 80%). Since
correlations reported in the paper for five lean methods do not exceed more than 0.6,
indicating that multicollinearity is not a problem for the current data. These papers also report
that multicollinearity can be an issue if correlation is between 0.6 and 0.8, R2 values are low,
and sample size is small. Therefore R2 values for the highly correlated variables (JIT and
TPM; JIT and AUTO) were calculated. To further verify, we estimated the R2
for JIT, TPM,
and AUTO and the R2 value was found to be 0.6. These findings suggest that in our case
though correlations are high they do not pose any significant issue. To further explore the
findings, a regression analysis was also conducted; a summary of the regressions outcome is
presented in Figure 2. Table 5 illustrates the results of the regression analysis and the impact
of the lean methods studied on the five performance measures as well as overall operational
performance. The ratio of the factor loadings or coefficients with their standard errors (i.e.
“Std Error” column) is expressed by their t-values. The variables with a t-value greater than 2
can be considered statistically significant if their p values (i.e. corresponding value in the
“Prob.” column) are equal or less than 0.05, whereas if their t-values are greater than 2.576
then they are statistically significant if their p≤0.01 (Koufteros, 1999). For this study,
variables with p≤0.1, which means a level of confidence of 90 percent, were considered
statistically significant. The SEM analysis was performed using AMOS 19.0 and total
number of iterations used was 10. Table 6 shows the normal (NFI), relative (RFI),
incremental (IFI) and comparative (CFI) fitness indices as well as the root mean square error
of approximation (RMSEA) and chi-square for the “best fit” SEM models tested to
investigate the lean methods and their impact on the performance measures studied.
Insert Table 4 in here
Insert Figure 2 in here
Insert Table 5 in here
Insert Table 6 in here
For Quality, both correlations and regression analysis show (see Figure 2 and Table 4) that
JIT has the highest impact on the performance of this measure while autonomation and
kaizen, as expected, seem to also contribute to its improvement at 90 percent level of
confidence. VSM appear to have a negative impact on the quality measure. The correlation
analysis indicates that TPM affects quality, though the regression findings do not support this
notion. To further verify this, SEM analysis was performed (Figure 3) and the analysis
supported the findings of regressions as no links between TPM and quality was evident. The
outcome of the SEM analysis also supported the other findings of the regression. For Speed,
the correlation analysis showed that except for VSM, all other lean methods were correlated
to this performance measure. Similar to quality, the results of the regression analysis found
that JIT has the strongest significance on this measure, followed by autonomation and kaizen.
Once more, VSM had a negative effect on speed while the effect of TPM was not found
significant. Thereafter, SEM analysis was performed (Figure 4) and the outcome cross

verified the findings of the regressions as it showed that TPM was not linked to speed
whereas VSM negatively affected it.
When focusing on Dependability, the correlations showed that similar to speed,
dependability was also correlated to all the lean methods except VSM. The regression
analyses revealed that JIT has the strongest effect on this performance parameter. Although
with a lesser effect, autonomation also has some inference on dependability while kaizen,
TPM, and VSM do not affect the dependability measure as the coefficients were not
significant. To verify this, SEM analysis (Figure 5) was run and the outcome verified the
findings of the regressions. Interestingly, SEM also showed that kaizen do impact
dependability but to a lesser extent than JIT and autonomation. SEM also shows that VSM
negatively affects dependability similar to speed. In relation to Flexibility, the correlation
analysis results were similar to speed and dependability. The regression results show that out
of all the five measures of performance considered in the analysis, dependability is the most
positively affected by JIT, see Figure 2. It also shows that TPM, automation, and kaizen do
not affect flexibility while VSM has a negative effect on it. Best fit SEM model (Figure 6)
verified the negative effect of VSM but it also showed that TPM is the second important
method after JIT to affect flexibility, which contradicted the findings of regressions but
supported the findings of correlations. SEM also found that kaizen does affect flexibility
though to a lesser extent.
Finally, correlations for Cost showed that except for VSM and kaizen, other lean methods
were significantly correlated. Further regressions show that JIT has the greatest impact on the
reduction of cost, followed by autonomation. SEM (Figure 7) verified the outcome of the
regressions and also showed that in this case too, TPM was not linked to cost and VSM
shares a negative relationship with cost. Figure 2 also presents the results from the linear
regression which examine the impact that the lean methods have on the overall operational
performance. This was calculated as the average of the five performance measures that were
examined in the previous regressions. It is evident that apart from TPM, all the other methods
have a statistically significant impact on the overall operational performance. Table 4
illustrates the results of the regression analyses and the impact of the lean methods studied on
the five measures considered and overall operational performance.
Insert Figure 3 in here
Insert Figure 4 in here
Insert Figure 5 in here
Insert Figure 6 in here
Insert Figure 7 in here
5. Discussion of results
Quality measure
Lean manufacturing emphasises the reduction of quality defects through autonomation. The
main objective of autonomation is to detect any abnormalities, prevent quality defects and
thus improve quality (Liker and Meier, 2006; Shingo, 1981). This may suggest autonomation
as the strongest contributor to the quality measure. However, the results of this study
contradict this “natural perception” and although it found that automation has a significant

effect on quality, JIT has the strongest effect on this measure. This corroborates the results of
a previous study by Cua et al. (2006), which found that JIT has a significant and positive
effect on quality. JIT’s main objective is to reduce inventory through the application of one
piece flow, pull system, takt time, cell manufacturing, levelled production, kanban, visual
control, multifunctional employees, and JIT purchasing. The improvement of quality through
the reduction of inventory can be explained as a mean of exposing problems (Flynn et al.
1995), which forces organisations to tackle and eliminate such problems from their root
cause.
The results of this study revealed that TPM does not have an impact on quality. However,
Cua et al. (2006) found that TPM is related to quality at a significant level, but not as strong
as JIT. TPM aims to reduce machine changeovers and breakdowns. Nakajima (1988)
suggests that these actions will contribute to the reduction of quality defects as machines will
run at an optimum level. A possible explanation about the lack of impact of TPM on quality
found in this study is an ineffective implementation of TPM. Bashin and Burcher (2006)
stated that only 10 percent or less organisations manage to implement TPM successfully.
Similarly to this study, Ghosh (2013) found that TPM has a negative impact on productivity
and manufacturing lead time. This may indicate that in order for TPM to positively affect
quality, a more strategic level to the approach must be taken, as opposed to the traditional
operational approach where only people from the shop-floor is involved in its application and
management. According to this study, kaizen contributes to the improvement of quality at a
moderate level compared to JIT and autonomation. It is known that kaizen contributes to the
support and sustainment of lean improvement initiatives (Imai, 2012; Rocha-Lona et al.,
2013). Thus it is expected to have some positive impact on quality, which is confirmed by
this study’s results.
The coefficient value of VSM in the regression appears to be negative and statistically
significant for all the measures studied (including quality), which was also verified by the
SEM analysis. In other words, the results of this study indicate that the application of VSM
has negative effects not only on quality but also on speed, flexibility, cost, and the overall
performance of an organisation. Various studies have highlighted the positive effects of VSM
in different operational areas (Seth and Gupta, 2005; Abdulmalek and Rajgopal, 2007; Sahoo
et al., 2008; Singh and Sharma, 2009; Chen et al., 2010). Our study, however, contradicts
their findings. VSM is typically the initial step in the implementation of lean manufacturing
(Rivera and Chen, 2007). Thus, if a VSM analysis is incorrectly performed and therefore not
accurate, then the information obtained regarding the processes and their waste may lead to
the wrong selection of priorities and implementation of lean methods and tools, which would
obviously undermine the management and sustainment of the whole lean strategy. In the case
of the companies studied, this may be a reason as to why their VSM approach had a negative
effect on most of the measures of performance considered in this study. Furthermore, VSM
can be considered a method applied at a more specific operational level than JIT,
autonomation and kaizen. For example, VSM is a technical tool that examines the physical
system, processes and interconnections but does not involve the socio-technical (i.e.
teamwork for motivation, coordination and problem solving) aspect of the system and its long
term benefits. This may make the benefits of VSM more difficult to appreciate and recognise
by top management. Based on our practical experience, the authors are convinced of the
value and effectiveness of the VSM method. However, since the results of the study
contradict this experience and the results of other researches, a suggestion to performed
further studies in relation to this aspect is recommended as part of a future research agenda.
Speed measure

It is evident that the impact of JIT on speed is higher compared to the rest of the lean
manufacturing methods studied, see Figures 1 and 3. Furthermore, its impact is greater on
speed compared to the impact that it has on quality. This is expected as the parameters that
measure speed are normally related to lead time, cycle time and on time delivery, which are
reduced when JIT is effectively implemented. Many studies support the positive and
significant impact of JIT on lead and cycle time reduction and on time delivery (Womack et
al., 1990; Womack and Jones, 2003; Ward and Zhou, 2006; Cua et al., 2006). Autonomation,
as it occurs from the results of the regression analysis, has a significant positive impact on
speed. The prevention of the defects and the reduction of the percentage of scrap and rework
that is achieved in a large scale by the implementation of autonomation tools contribute to the
increase in speed and specifically, to the reduction of order lead time. Kaizen affects in a
positive way the performance measure of speed, but its impact is lower compared to the impact of
JIT and autonomation. This may be considered logical, as the main purpose of kaizen is to
support and sustain the improvement in performance that is achieved as a result of the
implementation of other lean manufacturing practices (Liker, 2004). In reference to TPM and
VSM, the results of the regression analysis on the measures studied are the same as for the quality
measure, with the possible reasons for this being the same.
Dependability measure
In the case of dependability, it was found that JIT is the lean manufacturing method that has
the strongest effect. There are two main parameters that represent the measure of
dependability. These are on time delivery and level of inventory. Cua et al. (2006) found a
significant impact of JIT on the measure of on time delivery. Daugherty and Spencer (1990)
argue that one of the characteristics of JIT that helps organisations to improve dependability
is it emphasises on the close proximity of suppliers. The delivery of products on time, and
speed of delivery (i.e. speed measure), is also affected by quality defects that occur during the
production as they require to be reworked before they are delivered to the customer. Thus,
rework consumes valuable time and delays further the delivery of the finished goods. As a
result, since autonomation contributes to the reduction of quality defects, it also positively
affects the delivery time due to the products that need rework are less and thus can be
delivered to the customer faster. On the other hand, according to the results of the regression
analysis, VSM, TPM and kaizen do not affect dependability. In this context, their p values
exceeded 0.1, see Figure 2, which means that they are not statistically significant. Due to
their own nature, the effective implementation of TPM and kaizen may be assumed to help
reducing machine breakdowns, quality defects, improve efficiency, etc. and thus to help
improving the dependability measure. However, although these approaches may in theory aid
an organisation to achieve these improvements, their effective implementation, management
and sustainment will also play a critical role. This may have acted as a barrier for the studied
organisations to experience the theoretical benefits of these approaches.
Flexibility measure
Flexibility has been used by various authors as a performance measure for lean
implementation. Cua et al. (2006) found a significant effect of the JIT and TPM methods on
flexibility. As it can be seen from the regression results, JIT has a significant impact on
flexibility. This is due to the lower the inventory, the faster an organisation can change its
direction towards the manufacture of different products and adapt to new market trends. On
the other hand, kaizen and autonomation were not statistically significant, which means that
they have no impact on flexibility, though SEM analysis showed that it does affect flexibility
but its impact is minimal. As it has been previously mentioned, kaizen is based on
incremental improvements (Imai, 2012) and mainly acts as the sustainment base for the lean

initiative. For this reason, its effects on the improvement of different measures, including
flexibility, may not be easily perceived by organisations in the short term or as very
significant. In the case of autonomation, although it may be argued that the reduction of
defects will keep the level of inventories low due to less products will need to be reworked,
the regression analysis shows that this is still not significant, at least for the companies
involved in this study. Once more, the regression analysis has showed no statistical
significance of the effect of TPM on the flexibility measure. According to Kodali and
Chandra (2001), companies that successfully implement TPM can expect a 70 percent
reduction in lost production, 60 percent reduction in maintenance cost per unit, 50 percent
reduction in breakdowns, and between 50 and 90 percent reduction in setup time. It is
obvious that the successful and/or full implementation of TPM was not achieved by the
companies participating in this study, which once more, may explain the lack of impact of
TPM on the flexibility measure.
Cost measure
The regression and SEM analyses showed that the impact of JIT on cost is strongly
significant, see Figures 1 and 6. Specifically, the reduction of inventory that is achieved with
the implementation of JIT significantly contributes to the reduction of cost. Moreover,
Fullerton and Wempe (2009) found that the implementations of tools like cellular
manufacturing, which is one of the JIT tools, improve the profitability of the company.
Furthermore, Cua et al. (2006) found that JIT has the strongest impact on cost efficiency
compared to other approaches and methods like TQM or TPM. Although, it would be
expected to be universally accepted the fact that JIT, or other lean methods and tools, have a
significant contribution to the increase of profitability of a manufacturing organisation, some
authors have contradicted this point (Huson and Nanda, 1995; Mohrman et al., 1995; Lau,
2002). Despite these, it is well accepted in the academic literature that lean methods and tools
have a positive effect on the success and performance of organisations (Eriksson and
Hansson, 2003; Nahm et al., 2003; Kinney and Wempe, 2002; Fullerton and Wempe, 2009).
In the case of autonomation, it has a stronger effect on the cost measure than TPM, kaizen
and VSM. This is due to the prevention and reduction of quality defects, which add a
significant cost due to rework, inspection, after sales service, warranty claims, etc. In
addition, it also contributes to the increase of sales due to good product’s reputation and
imagine of the company. The regression and SEM analyses results in relation to TPM and
cost showed that similarly as with all the other measures, TPM does not affect it. It has been
discussed previously that the possible reason as to why TPM in this study seems not to have
any effect on any performance measure studied is the lack of its effective and/or full
implementation. The t-value of TPM is shown as negative in the results of the regression
analysis. This may be due to the fact that if TPM is not implemented effectively it will fail to
achieve the expected results, and it will also incur on extra cost for the organisation.
6. Conclusions, limitation and further research
This paper fills a research gap by investigating the relationship and impact that some of the
most essential and commonly implemented lean methods (i.e. JIT, TPM, autonomation, VSM
and kaizen) have on important contemporary measures of operational performance (i.e. cost,
speed, dependability, quality and flexibility). The study employs a three pronged verification
approach by using correlations, regressions, and structural equation modelling (SEM) method
to justify the findings. The results of this study indicate that out of the five lean methods
studied, JIT contributes to the highest impact on improvement in all five individual measures
and the overall performance of organisations. The relationship between JIT and significant
improvements in organisational performance has been well documented in the academic
literature (Cua et al., 2001; Lawrence and Hottenstein, 1995; Fullerton and McWatters, 2001;
Bortolotti et al., 2013). This study corroborates and supports the importance and impact of
the JIT method on performance highlighted in the academic literature. In the case of
autonomation, this study indicates that it also plays a significant role on the performance of
companies. In this context, the prevention and elimination of quality defects has a positive
impact, particularly, on the quality, speed, dependability and cost performance of
organisations. Similarly as with JIT, the results of this study corroborate the vast amount of
literature (Deming, 1986; Dale, 2003; Slack et al., 2013; Hill, 1989) that highlights the
benefits that the improvement of quality has on the performance of organisations. On the
other hand, kaizen was found to have a modest contribution towards the overall performance
of a company and the quality and speed measures. As previously discussed, this may be
explained due to the strategic objective of kaizen, which is more related to the sustainment of
the lean strategy and its methods and tools rather than to be directed toward the improvement
of specific operational aspects (Liker, 2004), such as is the case for JIT and autonomation.
Surprising results were obtained in relation to the no impact of TPM and negative effect of
VSM on the performance of organisations. As previously discussed, the academic literature
widely exposes the positive effects of TPM (Nakajima, 1988; Kodali and Chandra, 2001) and
VSM (Seth and Gupta, 2005; Abdulmalek and Rajgopal, 2007; Sahoo et al., 2008; Singh and
Sharma, 2009; Chen et al., 2010). Thus, the outcomes of this study contradict such results. A
possible explanation for this may be that the organisations studied have not been able to
obtain such benefits due to implementation, management and/or sustainment problems with
these lean methods. In addition, due to the purely operational scope of these lean methods,
top management may have less opportunity to observe and thus recognise the benefits of
these tools in the performance of their organisations.
Managerial and theoretical implications
The study presented in this paper offers organisations, and their managers, a better
understanding of the relationship and impact that some of the most essential lean methods
have on the performance of their operations. Thus, managers will be able to take better and
more effective decisions about the implementation of lean methods. Even the largest and
most profitable organisations will face some type of resource constraint that may stop them
from implementing all lean methods and tools simultaneously. Thus, this study can also guide
organisations to prioritise the implementation of lean methods according to the performance
measures they consider more strategically important to improve. In terms of its theoretical
value, this study complements the previous research performed in this area by considering the
analysis of the effects of all the most essential lean methods on the most currently important
measures of operational performance. None of the previous research had considered all the
same lean methods and measures of performance investigated in this study.
Research limitations and further research
In terms of the study limitations, various constraints were encountered with factors that
are important to highlight in order for similar future studies to take them into consideration.
The survey questionnaire software had access restrictions from a number of organisations’
internet browsers. It is unknown how many organisations were affected by this problem, but
it can be assumed that corporate restrictions within a number of organisations, particularly
large organisations that impose stricter access to external websites, were a barrier to increase
the questionnaire’s response rate. Due to the problems encountered with internet restrictions,
it may prove beneficial to send out a number of questionnaires by post in future studies.
Alternatively, carrying out interviews would increase response rates; these methods however
are constrained by resources such as time and capital. Although the response rate obtained
and used for the analysis is comparable to other similar studies, it can also be considered
limited. Therefore, similar studies conducted by using a higher response rate are considered
part of the agenda for further research proposed by this paper.
To further develop this area, research should be carried out with a focus on not only the
manufacturing industry, as it was the case for this research, but also on other industries where
the lean strategy can also be beneficial. Furthermore, considering the importance that many
governments, industries and society in general are paying to the “green” and sustainable area,
the impact of lean methods and tools can also be explored in relation to these two aspects.
Future empirical studies can also follow a mixed method approach involving quantitative and
qualitative data sets that could be tested through rigorous statistical methods, including the
conduction of a non-response bias test (Armstrong and Overton, 1977) in order to ensure a
higher confidence in the data collected. A higher response rate and a mixed quantitative-
qualitative approach with strong statistical analysis method may allow the generalisation of
the findings in similar studies. Finally, an analysis of results and drawn of conclusions from a
more specific level’s view point (i.e. considering industrial sector, company size, length of
time of the lean initiative) could also be carried out.
References
Abdulmalek, F. and Rajgopal, J. (2007), “Analyzing the benefits of lean manufacturing and
value stream mapping via simulation: a process sector case study”, International
Journal of Production Economics, Vol. 107, No 1, pp.223-236.
Ahmad, S. and Schroeder, R.G. (2003), “The impact of human resource management
practices on operational performance: recognizing country and industry differences”
Journal of Operations Management, Vol. 21, No. 1, pp. 19-43.
Anvari, A., Zulkifli, N. and Yusuff, R.M. (2013), “A dynamic modeling to measure lean
performance within lean attributes”, International Journal of Advanced
Manufacturing Technollogy, Vol. 66, No. 5-8, pp. 663–677.
Armstrong, J. and Overton, T. (1977), “Estimating nonresponse bias in mail surveys”,
Journal of Marketing Research, Vol. 14, No. 3, pp. 396-402.
Bayou, M.E. and de Korvin, A. (2008), “Measuring the leanness of manufacturing systems—
A case study of Ford Motor Company and General Motors”, Journal of Engineering
and Technology Management, Vol. 25, No. 4, pp. 287–304.
Bhasin, S. (2012), “Performance of lean in large organisations”, Journal of Manufacturing
Systems, Vol. 31, No. 3, pp. 349–357.
Bhasin, S. and Burcher, P. (2006), “Lean viewed as a philosophy”, Journal of Manufacturing
Technology Management, Vol. 17, No. 1, pp 56-72.
Bhuiyan, N. and Baghel, A. (2005), “An overview of continuous improvement: from the past
to the present”, Management Decision, Vol. 43, No. 5, pp. 761-771.
Behrouzi, F. and Wong, K.Y. (2011), “Lean performance evaluation of manufacturing
systems: a dynamic and innovative approach”, Procedia Computer Science, Vol. 3,
pp. 388-395.
Bortolotti, T., Danese, P. and Romano, P. (2013), “Assessing the impact of just-in-time on
operational performance at varying degrees of repetitiveness”, International Journal
of Production Research, Vol. 51, No. 4, pp. 1117–1130.
Brah, S.A. and Chong, W.K. (2004), “Relationship between total productive maintenance and
performance”, International Journal of Production Research, Vol. 42, No. 12, pp.
2383-2401.
Chen, J., Li, Y. and Shady, B. (2010), “From value stream mapping toward a lean/sigma
continuous improvement process: an industrial case study”, International Journal of
Production Research, Vol. 48, No. 4, pp.1069-1086.
Cohen, L., Manion, L. and Morrison, K. (2007), Research methods in education, 6th
ed.,
Routledge, Oxford.
Cua, K.O., McKone-Sweet, K.E., Schroeder, R.G. (2006), “Improving performance through
an integrated manufacturing program”, Quality Management Journal, Vol. 13, No. 3,
pp. 45-60.
Dale, B.G. (2003), Managing quality, 4th
ed., Wiley-Blackwell, Oxford, UK.
Daugherty, O.J. and Spencer, M.S. (1990), “Just-in-time concepts: applicability to
logistics/transportation”, International Journal of Physical Distribution & Logistics
Management, Vol. 20, No. 7, pp.12-18.
Deming, W.E. (1986), Out of the crisis, MIT Press, Massachusetts, US.
Dora, M., Kumar, M., Van Goubergen, D., Molnar, A. and Gellynk, X. (2013), “Operational
performance and critical success factors in European food processing SMEs”, Trends
in Food Science and Technology, Vol. 31, No. 2, pp. 156-164.
Eriksson, H. and Hansson, J. (2003), “The impact of TQM on financial performance”,
Measuring Business Excellence, Vol. 7, No. 1, pp. 36-50.
Flynn, B.B., Sakakibara, S. and Schroeder, R.G. (1995), “Relationship between JIT and
TQM: practices and performance”, Academy of Management Journal, Vol. 38, No. 5,
pp. 1325-1360.
Forrester, P., Shimizu, U., Soriano-Meier, H., Garza-Reyes, J.A., Basso, L. (2010), “Lean
production, market share and value creation in the agricultural machinery sector in
Brazil”, Journal of Manufacturing Technology Management, Vol. 21, No. 7, pp. 853-
871.
Fullerton, R.R. and Wempe, W.F. (2009), “Lean manufacturing, non-financial performance
measures, and financial performance”, International Journal of Operations and
Production Management, Vol. 29, No. 3, pp. 214-240.
Garza-Reyes, J.A., Oraifige, I., Soriano-Meier, H., Forrester, P.L. and Harmanto, D. (2012),
“The development of a lean park homes production process using process flow and
simulation methods”, Journal of Manufacturing Technology Management, Vol. 23,
No. 2, pp. 178-197.
Ghosh, M. (2013), “Lean manufacturing performance in Indian manufacturing plants”,
Journal of Manufacturing Technology Management, Vol. 24, No. 1, pp. 113-122.
Grewal, R., Cote, J. A., & Baumgartner, H. (2004). “Multicollinearity and measurement error
in structural equation models: Implications for theory testing”, Marketing Science,
Vol. 23, No. 4, pp. 519-529
Hallgren, M. and Olhager, J. (2009), “Lean and agile manufacturing: external and internal
drivers and performance outcomes”, International Journal of Operations and
Production Management, Vol. 29, No.10, pp. 976-999.
Hill, T. (1989), Manufacturing strategy text and cases, Irwin, Homewood, IL.
Hofer, C., Eroglu, C. and Hofer, A.R. (2012), “The effect of lean production on financial
performance: the mediating role of inventory leanness”, International Journal
Production Economics, Vol. 138, No. 2, pp. 242-253.
Huson, M., and Nanda, D. (1995), “The impact of just-in-time manufacturing on firm
performance in the US”, Journal of Operations Management, Vol. 12, pp. 3/4, pp.
297-310.
Imai, M. (2012), Gemba kaizen: a common sense approach to continuous improvement
strategy, 2nd
ed., McGrawHill Professional, New York, NY.
Karim, A. and Arif-Uz-Zaman, K. (2013), “A methodology for effective implementation of
lean strategies and its performance evaluation in manufacturing organizations”,
Business Process Management Journal, Vol. 19, No. 1, pp. 169-196.
Kinney, M. and Wempe, W. (2002), “Further evidence on the extent and origins of JIT’s
profitability effects”, The Accounting Review, Vol. 77, No. 1, pp. 203-225.
Kline, R. B., (1998), Principles and Practice of Structural Equation Modeling, The Guildford
Press, New York, NY
Kodali, R. and Chandra, S. (2001), “Analytical hierarchy process for justification of total
productive maintenance”, Production, Planning and Control, Vol. 12, No. 7, pp. 695-
705.
Koufteros, X. A. (1999), “Testing a model of pull production: a paradigm for manufacturing
research using structural equation modeling”, Journal of Operations Management,
Vol. 17, No. 4, pp. 467–488.
Kumar, V., Batista, L. C. and Maull, R.S. (2011), “The Impact of operations performance on
customer loyalty”, Service Sciences, Vol. 3, No. 2, pp. 158-171
Kumar, V. (2010), “JIT based quality management: concepts and implications in Indian
context”, International Journal of Engineering Science and Technology, Vol. 2, No.1,
pp. 40-50.
Kumar, V., Smart, P.A., Maddern, H. and Maull, R.S, (2008), “Alternative perspectives on
service quality and customer satisfaction: the role of BPM,” International Journal of
Service Industry Management, Vol. 19, No. 2, pp. 176 – 187
Lau, R. (2002), “Competitive factors and their relative importance in the US electronics and
computer industries”, International Journal of Operations and Production
Management, Vol. 22, No. 1, pp. 125-135.
Lawrence, J., and Hottenstein, M. (1995), “The relationship between JIT manufacturing and
performance in Mexican plants affiliated with US companies”, Journal of Operations
Management, Vol. 13, No.1, pp. 3-18.
Liker, J. K. (2004), The Toyota way: 14 management principles from the world's greatest
manufacturer, McGraw-Hill, New York, NY.
Liker, J. K., and Meier, D. (2006), The Toyota way fieldbook, McGraw-Hill, New York, NY.
Lyu, J. (1996), “Applying kaizen and automation to process reengineering”, Journal of
Manufacturing Systems, Vol. 15, No. 2, pp. 125-132.
McLachlin, R. (1997), “Management initiatives and Just-in-Time manufacturing”, Journal of
Operations Management, Vol. 15, No.4, pp. 271–292.
Mohrman, S.A., Tenkasi, R.V., Lawler, E.E. and Ledford, G.R. (1995), “Total quality
management: practice and outcomes in the largest US firms”, Employee Relations,
Vol. 17, No. 3, pp. 26-36.
Nahm, A.Y., Vonderembse, M.A. and Koufteros, X.A. (2003), “The impact of organizational
structure on time-based manufacturing and plant performance”, Journal of Operations
Management, Vol. 21, No. 3, pp. 281-306.
Nakajima, S. (1988), Introduction to TPM: Total Productive Maintenance, Productivity
Press, Cambridge.
Rahman, S., Laosirihongthong, T. and Sohal, A.S. (2010), “Impact of lean strategy on
operational performance: a study of Thai manufacturing companies”, Journal of
Manufacturing Technology Management, Vol. 21, No. 7, pp. 839 – 852.
Pavnaskar, S.J., Gershenson, J.K. and Jambekar, A.B. (2003), “Classification scheme for lean
manufacturing tools”, International Journal of Production Research, Vol. 41, No. 13,
pp. 3075–3090.
Rivera, L. and Chen, F.F. (2007), “Measuring the impact of lean tools on the cost–time
investment of a product using cost–time profiles”, Robotics and Computer-Integrated
Manufacturing, Vol. 23, No. 6, pp. 684–689.
Rocha-Lona, L., Garza-Reyes J.A., Kumar, V. (2013), Building quality management systems:
selecting the right methods and tools, Productivity Press, CRC Press, Taylor &
Francis, Boca Raton, FL.
Robson, C. (2002), Real world research, Blackwell, Oxford.
Sahoo, A., Singh, N., Shankar, R., and Tiwari, M. (2008), “Lean philosophy: implementation
in a forging company”, International Journal of Advanced Manufacturing
Technology, Vol. 36, No. 5/6, pp. 451-462.
Sakakibara, S., Flynn, B.B., Schroeder, R.G. and Morris, W.T. (1997), “The impact of just-
in-time manufacturing and its infrastructure on manufacturing performance”,
Management Science, Vol. 43, No. 9, pp. 1246–1257.
Saunders, M., Lewis, P. and Thornhill, A. (2009), Research methods for business students,
5th
ed., Pearson Education, Essex, UK.
Searcy, D. L. (2009), “Developing a lean performance score”, Strategic Finance, September,
pp. 34-39.
Seth, D. and Gupta, V. (2005), “Application of value stream mapping for lean operations and
cycle time reduction: an Indian case study”, Production Planning and Control, Vol.
16, No. 1, pp. 44-59.
Shah, R. and Ward, P.T. (2003), “Lean manufacturing: context, practice bundles, and
performance”, Journal of Operations Management, Vol. 21, No. 21, pp. 129–149.
Shah, R. and Goldstein, S.M. (2006), “Use of structural equation modelling in operations
management research: looking back and forward”, Journal of Operations
Management, Vol. 24, No.2, pp. 148–169
Shah, R., and Ward, P.T. (2007), “Defining and developing measures of lean production”,
Journal of Operations Management, Vol. 25, No. 4, pp. 785–805.
Sheeran, P., & Orbell, S. (1999), “Augmenting the Theory of Planned Behavior: Roles for
Anticipated Regret and Descriptive Norms”, Journal of Applied Social Psychology,
Vol. 29, No. 10, pp. 2107-2142.
Shingo, S. (1981), A study of Toyota production system: from an industrial engineering
viewpoint, Japan Management Association, Tokyo.
Shingo, S. (1986), Zero quality control: source inspection and the poka-yoke system,
Productivity Press, Portland.
Singh, B. and S.K. Sharma, S.K (2009), “Value stream mapping as a versatile tool for lean
implementation: an Indian case study of a manufacturing firm”, Measuring Business
Excellence, Vol. 13, No. 3, pp. 58 – 68.
Slack, N., Brandon-Jones, A. and Johnston, R. (2013), Operations Management, 7th
ed.,
FT/Prentice-Hall, London.
Sohal, S. and Egglestone, A. (1994), “Lean production: experience among Australian
organizations”, International Journal of Operations and Production Management,
Vol. 14, No. 11, pp. 35-51.
Soriano-Meier, H., and Forrester, P.L. (2002), “A model for evaluatiing the degree of
leanness of manufacturing firms”, Integrated Manufacturing Systems, Vol. 13, No. 2,
pp. 104-109.
Taj, S., and Morosan, C. (2011), “The impact of lean operations on the Chinese
manufacturing performance”, Journal of Manufacturing Technology Management,
Vol. 22, No.2, pp. 223-240.
Thun, J.H., Drüke, M. and Grübner, A. (2010), “Empowering Kanban through TPS-principles
– an empirical analysis of the Toyota Production System”, International Journal of
Production Research, Vol. 48, No. 23, pp. 7089–7106.
Vinodh, S. and Vimal, K.E.K. (2012), “Thirty criteria based leanness assessment using fuzzy
logic approach”, International Journal of Advanced Manufacturing Technology,Vol.
60, No. 9-12, pp. 1185–1195.
Wan, H. and Chen, F.F. (2008), “A leanness measure of manufacturing systems for
quantifying impacts of lean initiatives”, International Journal of Production
Research, Vol. 46, No. 23, pp. 6567–6584.
Ward, P., and Zhou, H. (2006), “Impact of information technology integration and lean/Just-
In-Time practices on lead-time performance”, Decision Sciences, Vol. 37, No. 2, pp.
177-204.
Watt, S., Simpson, C., McKillop, C. and Nunn, V. (2002), “Electronic course surveys: does
automating feedback and reporting give better results?”, Assessment and Evaluation
in Higher Education, Vol. 27, No. 4, pp. 325–337.
Womack, J., Jones, D. and Roos, D. (1990), The machine that changed the world, Rawson
Associates, New York, NY.
Womack, J. and Jones, D. (2003), Lean thinking: banish waste and create wealth in your
corporation, Free Press, New York.
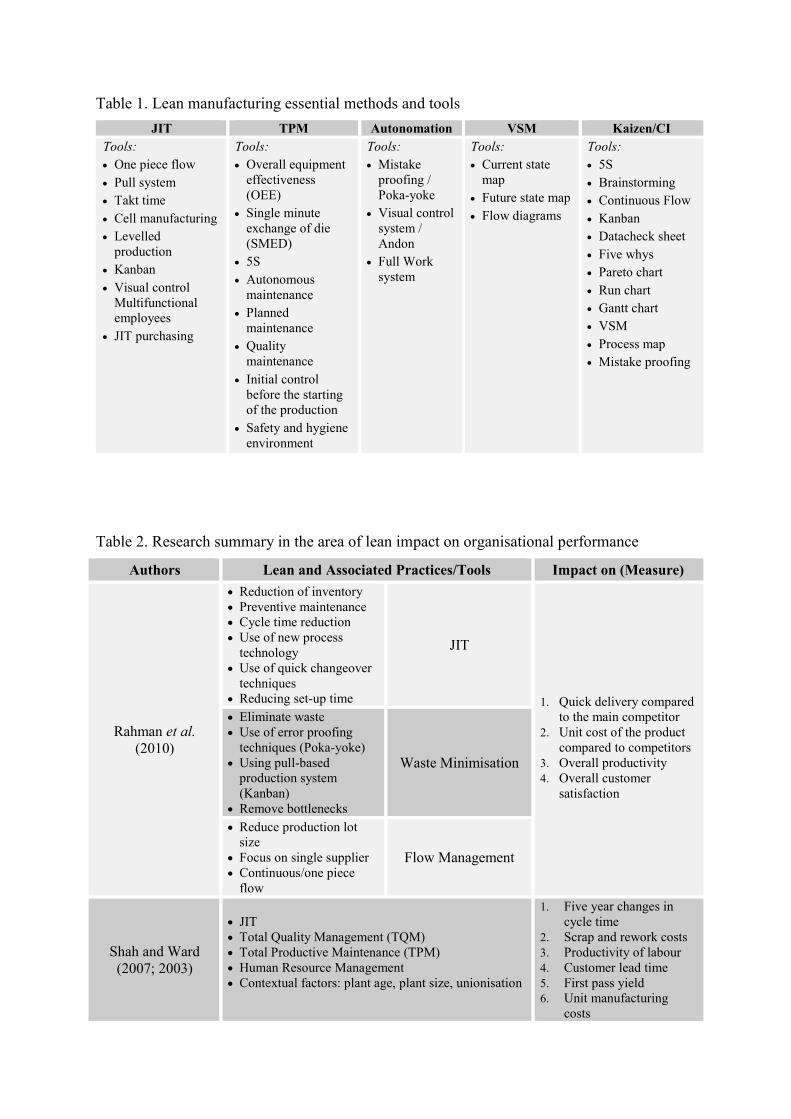
Table 1. Lean manufacturing essential methods and tools
JIT TPM Autonomation VSM Kaizen/CI
Tools:
One piece flow
Pull system
Takt time
Cell manufacturing
Levelled
production
Kanban
Visual control
Multifunctional
employees
JIT purchasing
Tools:
Overall equipment
effectiveness
(OEE)
Single minute
exchange of die
(SMED)
5S
Autonomous
maintenance
Planned
maintenance
Quality
maintenance
Initial control
before the starting
of the production
Safety and hygiene
environment
Tools:
Mistake
proofing /
Poka-yoke
Visual control
system /
Andon
Full Work
system
Tools:
Current state
map
Future state map
Flow diagrams
Tools:
5S
Brainstorming
Continuous Flow
Kanban
Datacheck sheet
Five whys
Pareto chart
Run chart
Gantt chart
VSM
Process map
Mistake proofing
Table 2. Research summary in the area of lean impact on organisational performance
Authors Lean and Associated Practices/Tools Impact on (Measure)
Rahman et al.
(2010)
Reduction of inventory
Preventive maintenance
Cycle time reduction
Use of new process
technology
Use of quick changeover
techniques
Reducing set-up time
JIT
1. Quick delivery compared
to the main competitor
2. Unit cost of the product
compared to competitors
3. Overall productivity
4. Overall customer
satisfaction
Eliminate waste
Use of error proofing
techniques (Poka-yoke)
Using pull-based
production system
(Kanban)
Remove bottlenecks
Waste Minimisation
Reduce production lot
size
Focus on single supplier
Continuous/one piece
flow
Flow Management
Shah and Ward
(2007; 2003)
JIT
Total Quality Management (TQM)
Total Productive Maintenance (TPM)
Human Resource Management
Contextual factors: plant age, plant size, unionisation
1. Five year changes in
cycle time
2. Scrap and rework costs
3. Productivity of labour
4. Customer lead time
5. First pass yield
6. Unit manufacturing
costs
Bhasin (2012)
Lean manufacturing (as overall approach)
1. Balanced Scorecard
(financial and
operational efficiency)
Cua et al. (2006)
Cross-functional product
design
Process management
Supplier quality
management
Customer involvement
TQM basic techniques
1. Quality
2. Flexibility
3. Cost
4. Delivery
Setup time reduction
Pull system production
JIT delivery by suppliers
Daily schedule
adherence
JIT basic techniques
Autonomous and
planned maintenance
Technology emphasis
Proprietary equipment
development
TPM basic
techniques
Committed leadership
Cross-functional training
Employee involvement
Information and
feedback
Strategic planning
Human and strategic
oriented common
practices
Authors Lean and Associated Practices/Tools Impact on (Measure)
Taj and Morosan
(2011)
Human resources
Supply chains
Design of production systems
1. Flow
2. Quality
3. Flexibility
Lawrence and
Hottenstein (1995)
Reduction of setup times
Reduction of production
lot sizes
Reduction of inventories
Simplification of
materials flow and
handling
Prevention of defective
products
JIT practices
1. Quality
2. Customer service
3. Lead time
4. Productivity
Thun et al. (2010)
Lean manufacturing (as overall approach)
1. On time delivery
2. Inventory turnover
3. Flexibility to change
volume
4. Product conformance
5. Cycle time
6. Cost
Bortolotti et al.
(2013)
Pull production systems
Lot size reduction
Cellular layout
Setup time reduction
Daily scheduled
adherence
JIT delivery by suppliers
JIT practices
1. Inventory turnover
2. Cycle time
3. Unit cost
4. On time delivery
5. Product volume
6. Product mix flexibility
7. Fast delivery
Searcy (2009)
Lean manufacturing (as overall approach)
1. Quality
2. Capacity
3. Productivity
4. Inventory
5. Cost
Table 2. Research summary in the area of lean impact on organisational performance (cont.)

Fullerton and
Wempe (2009)
Shop floor employee involvement in the problem
solving process
Cellular manufacturing
Setup time reduction
Quality improvement
1. Financial measures
Hallgren and
Olhager (2009)
Lean manufacturing (as overall approach)
Agile manufacturing (as overall approach)
1. Cost
2. Volume flexibility
3. Quality
4. Delivery speed
5. Product mix flexibility
6. Delivery dependability
Behrouzi and Wong
(2011)
JIT
Waste elimination
1. Quality
2. Cost
3. Time
4. JIT delivery
Rivera and Chen
(2007)
Waiting time
Activities duration
Reduction of material
JIT materials
1. Cost-time investment of
a product
Dora et al. (2013)
Lean manufacturing (as overall approach)
1. Productivity
improvement
2. Inventory reduction
3. Cycle time or lead time
reduction
4. Quality improvement
5. On time delivery
Authors Lean and Associated Practices/Tools Impact on (Measure)
Hofer et al. (2012)
Pull
Flow
Set-up
SPC
Employee involvement
TPM
Internal lean practices
1. Financial performance
2. Mediating role of
inventory leanness in the
relationship between
final performance and
lean production
Supplier feedback
Supplier JIT
Supplier development
Customer involvement
External lean practices
Karim and Arif-Uz-
Zaman (2013)
Lean manufacturing (as overall approach)
1. Effectiveness
2. Defect rate
3. Efficiency
4. Productivity
5. Value added time ratio
Sakakibara et al.
(1997)
Setup time reduction
Maintenance
Kanban
Equipment layout
JIT supplier relationships
Scheduling flexibility
JIT practices
1. Inventory turnover
2. Lead time
3. On time delivery
4. Cycle time
5. Quality
6. Flexibility
7. Unit cost
8. Plant’s management
opinion for the
performance of the plant
compared to global
competition.
Quality management
Manufacturing strategy
Product design
Workforce management
Organisational
characteristics
Infrastructure practices
Table 2. Research summary in the area of lean impact on organisational performance (cont.)
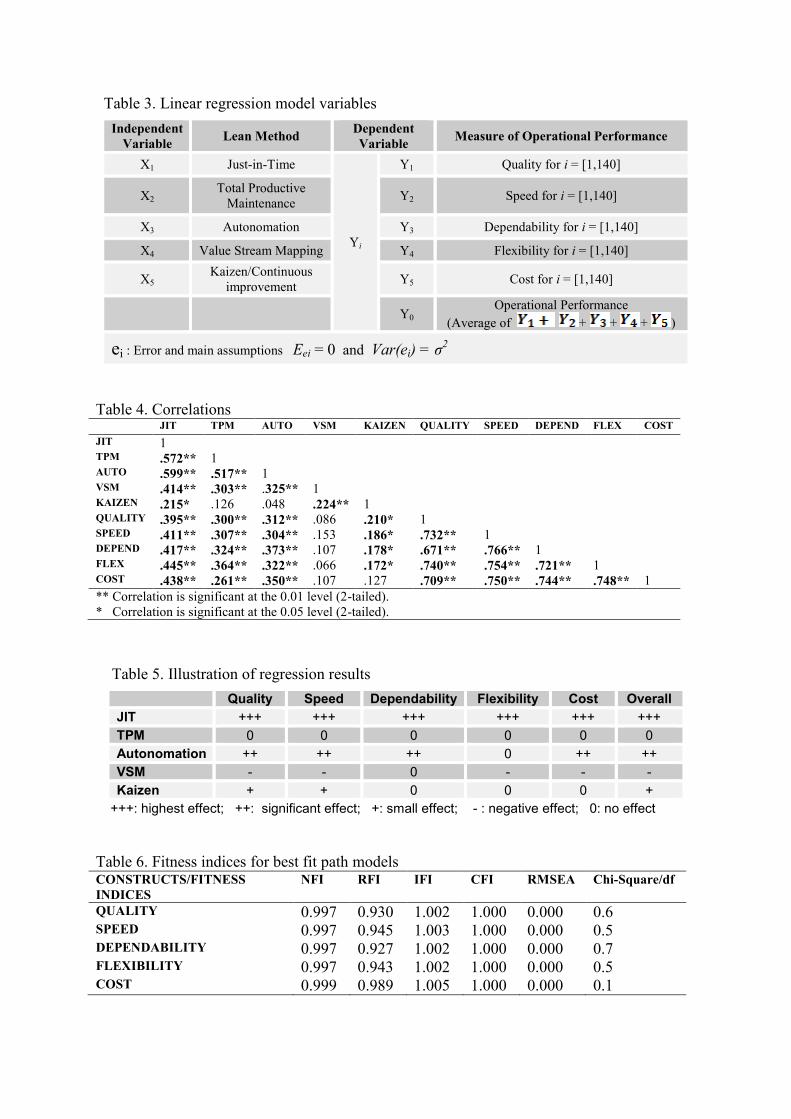
Table 3. Linear regression model variables
Independent
Variable Lean Method
Dependent
Variable Measure of Operational Performance
X1 Just-in-Time
Yi
Y1 Quality for i = [1,140]
X2 Total Productive
Maintenance Y2 Speed for i = [1,140]
X3 Autonomation Y3 Dependability for i = [1,140]
X4 Value Stream Mapping Y4 Flexibility for i = [1,140]
X5 Kaizen/Continuous
improvement Y5 Cost for i = [1,140]
Y0 Operational Performance
(Average of + + + )
ei : Error and main assumptions Eei = 0 and Var(ei) = σ2
Table 4. Correlations JIT TPM AUTO VSM KAIZEN QUALITY SPEED DEPEND FLEX COST
JIT 1 TPM .572** 1 AUTO .599** .517** 1 VSM .414** .303** .325** 1 KAIZEN .215* .126 .048 .224** 1 QUALITY .395** .300** .312** .086 .210* 1 SPEED .411** .307** .304** .153 .186* .732** 1 DEPEND .417** .324** .373** .107 .178* .671** .766** 1 FLEX .445** .364** .322** .066 .172* .740** .754** .721** 1 COST .438** .261** .350** .107 .127 .709** .750** .744** .748** 1
** Correlation is significant at the 0.01 level (2-tailed).
* Correlation is significant at the 0.05 level (2-tailed).
Table 5. Illustration of regression results
Quality Speed Dependability Flexibility Cost Overall
JIT +++ +++ +++ +++ +++ +++
TPM 0 0 0 0 0 0
Autonomation ++ ++ ++ 0 ++ ++
VSM - - 0 - - -
Kaizen + + 0 0 0 +
+++: highest effect; ++: significant effect; +: small effect; - : negative effect; 0: no effect
Table 6. Fitness indices for best fit path models CONSTRUCTS/FITNESS
INDICES
NFI RFI IFI CFI RMSEA Chi-Square/df
QUALITY 0.997 0.930 1.002 1.000 0.000 0.6 SPEED 0.997 0.945 1.003 1.000 0.000 0.5 DEPENDABILITY 0.997 0.927 1.002 1.000 0.000 0.7 FLEXIBILITY 0.997 0.943 1.002 1.000 0.000 0.5 COST 0.999 0.989 1.005 1.000 0.000 0.1
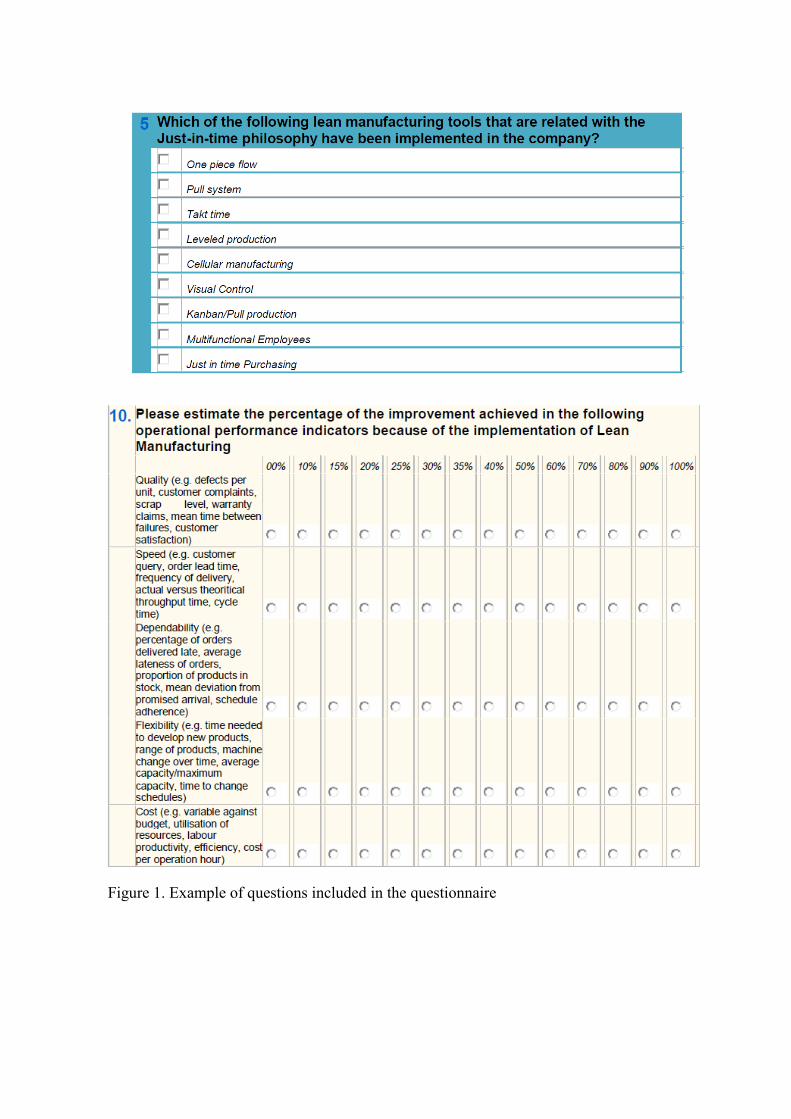
Figure 1. Example of questions included in the questionnaire

Figure 2. Summary of the linear regression results

Figure 3. Best Fit Model for Quality
0.2
8
0.2
0 -.17
0.0
7
Figure 4. Best Fit Model for Speed
0.3
1
0.1
7 -
0.1
0 0.0
5

Figure 5. Best Fit Model for Dependability
0.3
0
0.2
8 -0.20
0.0
5
Figure 6. Best Fit Model for Flexibility
0.4
0
0.2
0 -.26
0.0
4
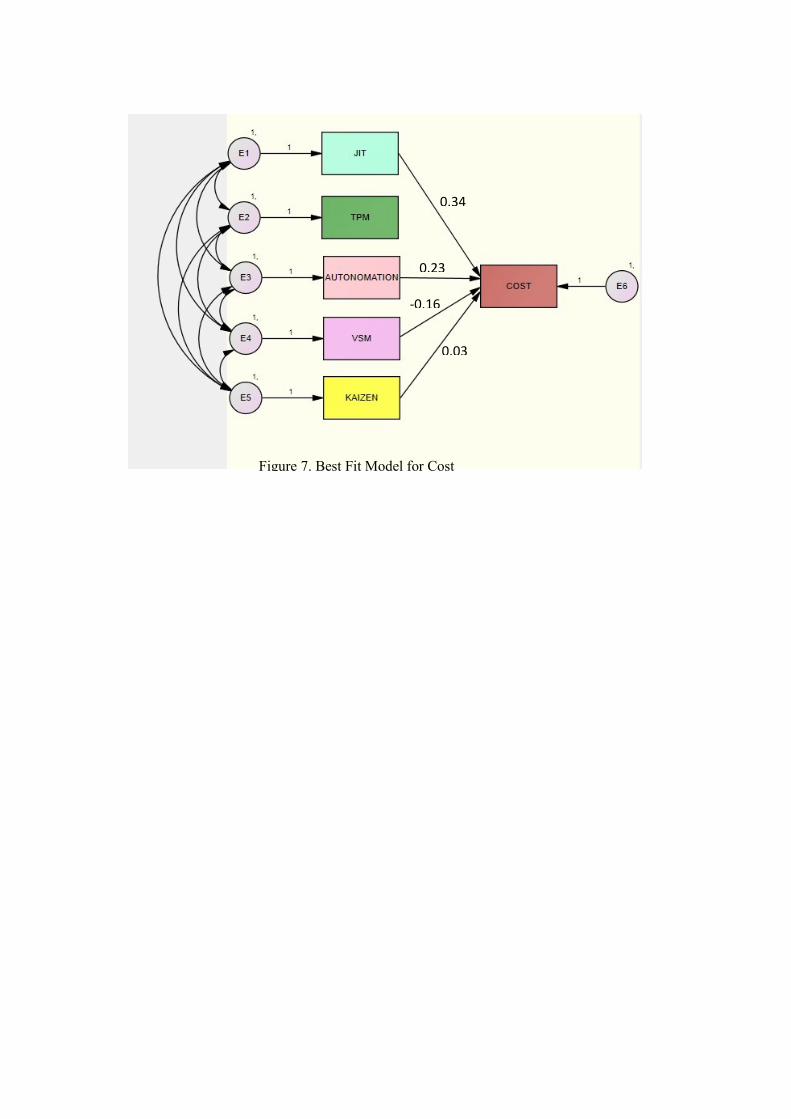
Figure 7. Best Fit Model for Cost
0.34
0.23
-0.16
0.03