the impact of diabetes mandates on infant health...
TRANSCRIPT

The Impact of Diabetes Mandates on Infant Health
Anca M. Cotet† and Lee C. Spector ‡ Seton Hall University and Ball State University
December 19, 2012
Abstract
Among the factors thought to contribute to lagging improvements in infant health in recent years are increasing obesity and diabetes prevalence among women of childbearing age. This paper uses a difference-in-difference-in-difference empirical strategy to investigate the impact of mandated insurance coverage for diabetes on adverse pregnancy outcomes. Among educated women, who have high rates of coverage through private insurance affected by mandates, diabetes mandates are associated with a reduction in low birth-weight and premature births prevalence. These gains are concentrated among older women and are larger for African-Americans. There is a weaker effect on the prevalence of high birth weight, potentially because of the deleterious effects of an increased probability of weight gain in excess of 35 pounds among diabetic women in states with mandates. Keywords: diabetes insurance mandates, prematurity, low birth weight, moral hazard
JEL Classifications: I18, I13, K32
† Department of Economics, Stillman School of Business, Seton Hall University, Jubilee Hall 674, 400 South Orange Ave, South Orange, NJ 07079. Email: [email protected] ‡ Department of Economics, Miller College of Business, Ball State University, WB 201, 2000 W. University Ave., Muncie, IN 47304. Email: [email protected]

1
INTRODUCTION
Despite significant gains made during the latter part of the 20th century, the United States lags
behind other developed countries in improving infant health outcomes.1 Certain trends over time
are particularly concerning: Between 1990 and 2005 the preterm birth rate, as well as the
prevalence of low birth weight, increased in the United States (CDC, NCHS data). Moreover,
during the 2000-2005 period, the United States experienced the first sustained period of no
decline in infant mortality rates since the 1950s (MacDorman et al., 2008).
Certain demographic trends are especially worrisome because they represent preventable
sources of poor infant outcomes. Among these is the incidence of diabetes among women of
childbearing age, which more than doubled between 1980 and 2009 to reach approximately 4%.2
In addition, there is also evidence of an increase in the incidence of gestational diabetes (GDM).
A Northern California study found that GDM prevalence increased by ~50% between 1991 and
1997 (from 5.1% to 7.4%) (Ferrara et al., 2002), while a Colorado study reported an increase in
prevalence of ~95% between 1994 and 2002 (Dabelea et al., 2005). Such changes in diabetes
prevalence can explain why there were twice as many births to women with diabetes in 2005
than there were in 1999 (Lawrence et al., 2008).
The increase in the incidence of diabetes among future mothers mirrors a broader trend of
increased diabetes prevalence in total population. This trend along with the high health-care costs
associated with complications from diabetes, have caught policy makers’ attention. Poor
information about complications from diabetes or lack of access to medical means of diabetes
management could explain the relatively high incidence of complications. In response to a
perceived need for improved management of diabetes, many states enacted legislation requiring
health-care insurance plans to provide coverage for equipment, supplies, services, and
medications used for treating diabetes without charging higher premiums for coverage.
Although improved insurance coverage of diabetes allows for better management of
diabetes, mandates also generate incentives for individuals to substitute away from preventive
1 For instance, in 2005 the United States ranked 30th in infant mortality, behind such countries as the Czech Republic and Cuba (NCHS, 2009). 2 Data Source: Centers for Disease Control and Prevention (CDC), National Center for Health Statistics, Division of Health Interview Statistics, data from the National Health Interview Survey. Data computed by personnel in CDC's Division of Diabetes Translation, National Center for Chronic Disease Prevention and Health Promotion. Data retrieved from http://www.cdc.gov/diabetes/statistics/incidence/fig5.htm on July 28, 2011.

2
measures, such as healthy eating and exercise. The presence of moral hazard makes for less-than-
clear-cut theoretical predictions regarding the impact of mandates on public health. Empirically,
Klick and Stratmann (2007) found evidence that diabetes mandates lead to an increase in obesity
rates among people with diabetes. However, for a comprehensive understanding of the costs and
benefits of these policies, any cost-benefit analysis should account for the impact on all affected
categories and not only people with diabetes. Another group to consider are infants born to
mothers with diabetes. As shown in the literature review below, uncontrolled diabetes is
associated with a higher incidence of macrosomia, prematurity, and low birth weight. Because of
their high medical and future cost, these health conditions represent a significant component of
the impact of diabetes and, thus, diabetes mandates.
When diabetes mandates are associated with an increase in obesity rates and, as shown
below, both mothers’ diabetes and obesity status have negative effects on infant outcomes, the
net effect of diabetes mandates on pregnancy outcomes is theoretically ambiguous. Assessing the
impact of better medical care when accompanied by poorer preventive care (moral hazard) is of
first-order importance in understanding how to effectively address the issue of poor infant
outcomes derived from the obesity-diabetes nexus.
Our results also contribute to the literature documenting the impact of mandated
insurance benefits and can provide some insight into the possible effects of federal health reform.
Surprisingly, although numerous studies document the effect of insurance mandates on
utilization (for diabetes treatment, see: Li et al., 2010; infertility treatment: Schmidt, 2007, Bitler
and Schmidt, 2012; mental health care: Harris et al., 2006, Busch and Barry, 2008, Pacula and
Sturm 2000; mammography: Bitler and Carpenter, 2012a; Pap tests: Bitler and Carpenter,
2012b), the literature on the effect on health outcomes is sparse (Kick and Stratmann, 2007).3
This might be due to the potentially long lag between mandates adoption and measurable
changes in health outcomes. By concentrating on the most fragile, infants, we are able to
document that diabetes insurance mandates significantly affect health among some categories of
population.
In this paper, we use the 1992-2003 panel data from the National Center for Health
Statistics (NCHS) Vital Statistics Natality Data to evaluate the population impact of diabetes
3 Bitler and Carpenter (2012a) also find that mammography mandates are associated with earlier detection, which presumably leads to lower mortality, although the effect on health is not documented.

3
mandates on infant health. Our econometric approach builds on triple-difference (DDD)
procedures commonly used in policy-evaluation literature (Meyer, 1995; Gruber, 1994a;
Bertrand et al., 2004). In this framework, the treatment group consists of infants born to diabetic
mothers, while all other infants serve as the control group. We compare changes in the outcomes
of infants born to diabetic mothers versus infants born to non-diabetic mothers in states that
enacted diabetes mandates pre- to post-adoption with changes in the same groups and time
periods in states that did not enact such mandates.
Because health-insurance mandates apply only to private insurance plans, diabetes
mandates pertain to only a portion of the population, namely people with diabetes covered by
private health insurance. Thus, the impact may be hard to identify in the total population. We
focus our analysis on a specific subgroup: infants born to diabetic mothers with more than 12
years of education, a group known to be more likely to have private insurance. Our results
suggest that diabetes mandates significantly decrease the prevalence of low birth weight and
prematurity but do not significantly change the incidence of high birth weight among births to
women with more than 12 years of education. These effects are plausibly larger where more
women are covered through private, fully insured health plans and are smaller and insignificant
in the case of births to women with 12 or fewer years of education or to non-diabetic women.
1. THEORETICAL PERSPECTIVES AND LITERATURE REVIEW
We briefly summarize the relevant literature in this section. We begin by discussing the likely
effect of diabetes insurance on private markets and the expected effect of diabetes mandates. We
then present existing evidence of the effect of diabetes on pregnancy outcomes. To put our study
into a broader perspective, we also briefly discuss previous studies on the economic impact of
adverse pregnancy outcomes.
1.1. Diabetes Mandates – Conceptual Framework
The high incidence of diabetes in the U.S. population, along with the high cost of complications
resulting from poor disease management, made for a total cost of diabetes in terms of direct
medical care and indirect productivity losses of approximately $174 billion in 2007 (2011
National Diabetes Fact Sheet). This high cost led the majority of state legislatures to pass laws
mandating that health-insurance providers cover supplies, services, medications, and equipment
for treating diabetes as part of their basic coverage without charging higher premiums (see Table

4
1).
Like any insurance problem, there are two possible opposing effects of providing
diabetes coverage. First, because people can get medical treatment much more cheaply than
before, they will be more likely to use this treatment and thus become healthier. Second, the
provision of health insurance has the potential to create moral hazard problems.4 In short,
insurance lowers the price of medicine, which causes some people to move from non- medical
solutions, such as healthy lifestyles, to medical solutions (Kahn, 1999). Should this substitution
occur, some of the gains from medication would be offset, and the cost savings from reduced
medical care after including diabetes medication in their coverage would not be as high as
originally predicted.
In response to the moral hazard problem insurance companies could refuse to provide
coverage for diabetes medicine or could price insurance that includes diabetes medicine
substantially higher, even for those who are not substituting this medicine for living a “healthy
lifestyle”. This could be very costly to society. For example, if people cannot afford this
insurance there might be large medical costs that society must bear; there is the cost to society by
the drop in productivity by those who have diabetes; and there can be large political costs to
legislators who do not pass mandates when there is interest group pressure. Those who worry
about such costs often suggest that governments should mandate that insurance companies cover
diabetes treatment at a reasonable price. This paper investigates the impact of such mandates.
In practice, diabetes mandates require private insurance companies to provide coverage
for medication, equipment, supplies, and sometimes education for at-home treatment. Noting
that some states do not define what each of the above terms means, medication usually implies
coverage of insulin, glucagon, and also other prescriptive medication, while equipment and
supplies could include coverage of insulin syringes, blood glucose monitors, insulin infusion
devices, podiatric appliances to prevent complications associated with diabetes, visual reading
and urine test strips, lancets and lancet devices, and injection aids. Coverage sometimes includes
outpatient self-management training, and education and medical nutrition therapy. People with
diabetes likely to be affected by mandates generally belong to employer-sponsored group health
4 See Pauly (1974), and Zweifel and Manning (2000).

5
plans or individual health plans.5
Diabetes mandates are likely to be associated with the same problems detailed above.
Previous literature (Klick and Stratman, 2007) found evidence that diabetes mandates are
associated with an increase in Body Mass Index (BMI) of people with diabetes. However,
estimating the direct impact on people with diabetes may understate/overstate the actual effect of
the mandates if third parties are affected. Another group to consider is pregnant women with
diabetes and their infants. In this paper, we focus on premature and low/high birth-weight babies
as one of the potential effects of diabetes mandates.6
1.2. The Effect of Diabetes on Pregnancy Outcomes
During pregnancy, women tend to develop hypoglycemia7 between meals and during sleep.
However, if the maternal insulin response is inadequate, hyperglycemia results and the mother
experiences recurrent postprandial hyperglycemic episodes. These episodes are a significant
source of accelerated growth of the fetus. High fetal glucose levels are accompanied by fetal
hyperinsulinemia, which promotes excess nutrient storage, resulting in macrosomia. Numerous
studies, of which for the sake of brevity we will mention only few, find that poor diabetes control
during pregnancy is associated with macrosomia (e.g., Jovanovic-Peterson et al., 1991; Combs et
al., 1992; Ostlund et al., 2003). In addition, maternal obesity, which is common among people
with type 2 diabetes, also has a strong effect on fetal macrosomia (Ehrenberg et al., 2004; Yogev
and Langer, 2008, Owens et al., 2010).
This is a potentially significant cost for society because high birth weight is a risk factor
for increased emergency visits (Sin et al., 2004), child obesity (Danielzik et al., 2004), diabetes
(Harder et al., 2007), cancer (Hjalgrim et al., 2003; Harder et al., 2008), rheumatoid arthritis
(Mandl et al., 2009), and asthma (Yuan et al., 2002; Remes et al., 2008). There is also some
evidence that high birth-weight is associated with poorer cognitive function (Richards et al.,
2001), reading difficulties (Kirkegaard et al., 2006), and lower test scores (Cesur and Rashad,
5 The Employment Retirement Income Security Act (ERISA) limits the role of state mandates. State health insurance laws apply only to the fully insured plans in which mostly individuals and small- and medium-sized businesses and organizations are enrolled. 6 Premature births occur at less than 37 weeks of gestation; very premature births occur at less than 32 weeks of gestation; very low birth weight (VLBW) occurs at less than 1500 grams; low birth weight (LBW) occurs at less than 2500 grams, high birth weight (HBW) occurs at greater than 4000 grams, and very high birth weight (VHBW) at greater than 4500 grams. 7 plasma glucose mean = 65-75 mg/dL

6
2010). Note, however, that while many articles associate high birth-weight with present and/or
future medical problems, the research examining the economic costs of these medical problems
is scant.
Although most fetuses of diabetic mothers exhibit growth acceleration, growth restriction
occurs with significant frequency in pregnancies of women with preexisting diabetes. The effect
is explained by the underlying maternal vascular disease associated with diabetes. Previous
literature finds that maternal diabetes is correlated with low birth-weight (Rosenberg et al., 2005;
McDonald et al., 2010). Research also shows that diabetes during pregnancy is associated with a
higher incidence of pre-term labor (Hedderson et al., 2003). These effects are again compounded
by obesity, as researchers found a positive correlation between obesity and both pre-term and
low birth-weight babies (Naeye, 1990; Chen et al., 2009).
An extensive literature examines the costs associated with pre-term and low birth-weight
babies. These costs include higher medical costs (McCormick et al., 1991; Gilbert et al., 2003),
as well as less education (Corman and Chaikind, 1998) and poorer longer-term health (Paneth,
1995) and economic outcomes (Currie and Hyson, 1998; Behrman and Rosenzweig, 2004; Black
et al., 2007; Behrman and Butler, 2007).8 These costs appear to be quite substantial. The
National Academy of Science estimates the total cost of pre-term babies in 2005 as “at least
$26.2 billion or $51,600 per infant.” Lewit et al. (1995) estimate the cost of low birth weight in
1988 as being between $5.4 and $6 billion, about 2 times higher than that of AIDS and around
two thirds the cost of alcohol abuse. Although it is possible these are overestimates (Almond et
al., 2005) overall the evidence suggests low birth-weight is quite costly.
Thus the cost of diabetes to third parties could be substantial and the benefit from better
control of diabetes significant. Nevertheless, when diabetes mandates are associated with weight
gain, and diabetes and obesity are independent factors in infant outcomes (Ehrenberg et al.,
2004; Rosenberg et al., 2005; Knight et al., 2012), the actual effect of diabetes mandates on high
birth-weight and pre-term and low birth-weight is theoretically ambiguous and remains to be
determined empirically.9 Note that the hypothesis that diabetes mandates can lead to a
significant change in high and low birth-weight prevalence, and thereby have a substantial long-
8 Note that the above is by no means a comprehensive description of the literature; those who are interested in a more extensive review of the costs associated with low birth-weight might find Petrou et al. (2001) worthwhile reading. 9 Wong et al. (2002) find that maternal BMI has a more direct and greater effect on incidence of large for gestational age (LGA) births than glucose control.

7
term benefit hinges on two premises. First, poor diabetes management must be the result of poor
access to medical care and not completely determined by behavioral factors.10 There is evidence
that state diabetes mandates are associated with higher utilization rates of diabetes management
devices (Li et al., 2010), an indication that not all existing private health insurance plans were
including diabetes coverage.11 Second, the moral hazard inducing women to substitute medical
treatments for lifestyle choices, as identified by Klick and Stratman (2007), must not completely
offset the benefit of medical care. To the degree that the empirical analysis finds a significant
impact of diabetes mandates on low and/or high birth-weight babies, this result is even more
powerful.
2. EMPIRICAL STRATEGY
Given that the literature supports the proposition that low and high birth-weight babies impose a
substantial cost on society, the question arises whether diabetes mandates have a significant
impact on the number of babies in the tails of the birth-weight distribution. Fortunately, we have
a natural experiment to consider this question, since these mandates have been imposed on some
states while not others. Likewise, these mandates were instituted at different times in different
states (Table 1).
The goal of the empirical work is to identify the causal effect of diabetes mandates on the
prevalence of adverse birth outcomes in population. To identify this effect, we need to control
for all shocks to the affected group in treated states that are correlated with the adoption of the
legislation. For this purpose, we use all birth data for the 1992-2003 period, which covers most
instances of diabetes mandate adoptions, in a difference-in-difference-in-difference (DDD)
analysis. We compare the treatment individuals in the experimental states to a set of control
individuals in those same states and measure the change in the treatments’ relative outcomes,
relative to states that did not pass diabetes mandates. The identifying assumptions of this DDD
estimator are fairly weak. It only requires that there be no contemporaneous shock that affects
the relative outcomes of the treatment group in the same state and year as the law.
10 To our knowledge, there are no direct estimates of the effect of diabetes mandates on the coverage of the diabetic population. Pollitz et al. (2005), however, mention several state reports indicating that diabetes mandates increase coverage. 11 In addition, findings that diabetes mandates affect the health of people with diabetes (Klick and Stratmann, 2007) imply that mandates lead to changes in utilization rates.

8
In our case, the treatment group comprises births to women with diabetes. The control
group represents all other births.12 Because of the very large sample size and the fact that the
relevant legislative variable varies only at state/year level, the data are collapsed into
state/year/mother diabetic status cells. The data are also divided by mother’s age and race,
because trends in diabetes incidence vary by age group (Lawrence et al., 2008) and because
African-American women with diabetes tend to have different rates of diabetic complications
and are more likely to have low birth-weight babies than are Caucasian women (Nicholson et al.,
2006). The age groups are: age below 25, 25 to 29, 30 to 34, and 35 and over. Thus, all
observations are averages for the state/year/mother’s age/mother’s race/mother’s diabetes, and
the regressions are run at that level, weighted by cell size.
We estimate the following equation:
(1) Ygdst = + β1Xgdst + β2γs + β3λtg + β4d + β5∂td + β6sd + β7st + β8std + εgdst,
where g indexes age/race group, d diabetic status of the mother, s states, and t time.
X is a vector of time-varying determinants of birth outcomes, such as female infant, plural
birth, first child, mother’s education, marital status, and prenatal care. γs is a fixed state effect, λtg
is a fixed year effect that varies by age group, and d is a dummy for treatment group (1 if
mother was diabetic, 0 otherwise).
We include state fixed effects, γs, to control for differences in birth outcomes that are
common to people in the same state (for instance, secular differences in the overall level of
health resulting from unmeasured cultural factors, such as cuisine specificity or weather).
Second, we include year fixed effects, λtg, to capture any time-varying differences in the health
common to the infants, such as changes in federal-level health-care policies. Because, as
mentioned above, there are different trends in infant outcomes by the mother's age and race, we
allow the time effects to vary by age-race demographic groups. The interactions between the
time effects and the mother's diabetic status, ∂td, account for differential changes over time in the
health status of infants born to diabetic mothers (such as those resulting from changes in diabetes
management technologies). The interactions between state effects and diabetic status, sd, of the
mother are included to control for systematic differences in outcomes of infants born to diabetic
12 We use year-to-year variation to identify the effect. One year is too short to raise concerns that the treatment group characteristics would change over time due to the mandates. Klick and Stratmann (2007) confirm that diabetes mandates do not produce behavioral changes among non-diabetics. We also find no evidence that the mandates led to a change in the share of births to diabetic mothers (coefficient 0.024, with standard error 0.118).

9
mothers across states. The equation includes state-by-year fixed effects, st, that control for
differential changes over time in states that adopted mandates.
In this framework β8, the coefficient of the triple interaction between diabetic status,
mandate state, and post-treatment status, std, captures the variation in health specific to infants
of diabetic mothers (relative to non-diabetic mothers) in states with diabetes mandates (relative
to states without such mandates) in the years after the law (relative to before the law). Note that
because the effects of diabetes mandates on birth outcomes likely lag at least several months
behind their adoption, we are agnostic ex-ante as to whether a change in diabetes-mandate status
should be recorded with one lag, two lags, or no lags. Hence, we experiment with different
specifications and let the data indicate the relevant time period. The dependent variable could be
percent low-birth-weight babies (defined as either <2500 grams or <1500 grams), percent high-
birth-weight babies (defined as either >4000 grams or >4500 grams), and percent premature
(defined as either <37 weeks or <32 weeks).13
Some issues regarding the estimation strategy should be mentioned. First, the unit of
observation is more detailed than the level of variation of the independent variable of interest, the
state level. Second, there are no instances of repeals in the data; thus the error terms are likely to
be correlated within each state over time. In the presence of autocorrelation, estimated standard
errors tend to be biased downward, making coefficient estimates spuriously statistically
significant. Moreover, misspecification of the autocorrelation process, which is likely to occur
with short time series like the ones used in this paper, can also lead to downward bias in the
standard error estimates. To correct for all these potential problems, this paper reports robust
standard errors clustered at the state level, a method that allows for an arbitrary autocorrelation
process (Bertrand et al., 2004).
Another issue is that only a subset of women who give birth are likely to be affected by
mandates, because state mandates apply only to individuals who have private insurance. In
addition, self-insured plans are exempted under the Employment Retirement Income Security
Act (ERISA). Although the coefficients estimated from the specification above are valid
estimates of the population impact of diabetes mandate, we may also want to know the impact 13 In some specifications, we also consider the 5-minute Apgar score. Note, however, that the data are less reliable because of a larger fraction of missing values. The Apgar score is a summary measure of the newborn’s condition based on heart rate, respiratory effort, muscle tone, reflex irritability, and skin color. It takes values from 1 to 10, where higher is better. Values of 8 and above are considered normal. Any score lower than 8 indicates the child needs assistance. Source: http://www.nlm.nih.gov/medlineplus/ency/article/003402.htm

10
among those subject to mandates (effect of treatment on the treated). In the analysis below, we
follow previous literature on state insurance mandates (Bitler and Carpenter, 2012a) and other
types of policies affecting subsets of the population (Almond et al., 2011), and we inflate the
coefficients by the estimated treatment rates (i.e., the estimated proportion of women in our
investigated demographic group having the type of insurance subject to diabetes mandates) to
obtain the estimated treatment effect on the treated. In addition, in the empirical analysis we will
test the robustness of results by exploiting this information about the likelihood of treatment.
In the subsequent analysis, we use detailed individual-level data to estimate the impact of
diabetes mandates for each of the eight separate age/race groups (mother’s age <25; ≥ 25 and
<30; ≥ 30 and <35; and ≥ 35 and mother’s race White or Black). For this purpose, we use a
similar equation:
(2) Yist = + β1Xist + β2γs + β3λt + β4d + β5∂td + β6sd + β7st + β8std + εist,
where i indexes individuals. In addition, in this specification we also include county-level
controls for log wages, number of physicians in the county per 1,000 residents, and number of
hospitals per 100,000 individuals.14
3. DATA
Birth outcomes data come from National Center for Health Statistics (NCHS) Vital Statistics
Detail Natality Data and cover all births15 in the 50 U.S. states. The analysis is performed on
1992-2003 data. As shown in Table 1, these data cover most instances of diabetes mandates. The
only exception is Wisconsin, where diabetes mandates became effective in 1988 when the data
on diabetic status of mothers were not reported in NCHS Natality Data. As such, the sample in
this study is extremely representative of the country as a whole.
14 State-by-year fixed effects control for such factors in the analysis using data collapsed in state cells. 15 We retain all births, including multiple births, and thus our results are valid for the entire population. Note that we find no evidence that the diabetes mandate led to any change in the proportion of plural births among women with diabetes relative to non-diabetics (the estimated effect is 0.088, with standard errors of 0.203 and thus highly insignificant). The results hold on the sample of singletons, although the estimates are slightly lower and sometimes with larger standard errors function of specification, which is understandable given that we lose power. This is because we lose significant variation in our dependent variable: More than 25% of low birth-weight babies are plural births. In state cell regressions, this leads to very thin cell sizes for women with diabetes in some age groups. We need this variation, given that we control for a very large number of fixed effects relative to the sample size in our state-level regressions. Although not reported the results using individual-level data on the sub-sample of singleton births are available on request (Appendix Table A4).

11
Infant characteristics, such as gender, plurality (single versus higher-order birth), and
parity (whether it was a first or subsequent birth), also come from Natality Data. In addition,
Natality Data provide information about the mothers' demographic characteristics, such as age,
race, education, marital status, and state of residence, but not income information. However,
education can act as a proxy for income and in the state-level regressions, the state-by-year fixed
effects and the demographic group fixed effects likely absorb most of the variation in income.
Because practically all means-tested programs are administered at the state level, the state-by-
year fixed effects absorb the impact of such programs on infant outcomes and thus any source of
bias from the introduction or expansion of such programs.
When using individual-level data, we also use county-level income as an additional
proxy. These data come from the Bureau of Labor Statistics Quarterly Census of Employment
and Wages. In the analysis using individual-level data, we also include variables acting as
controls for access to medical care: county number of physicians per 1,000 individuals and
county hospitals per 100,000 individuals come from U.S. Department of Health and Human
Services, Area Resource Files.
Natality data also provide information about the mother's diabetic status.16 Although
pregestational diabetes has more severe consequences for infant outcomes than gestational
diabetes, we cannot distinguish between type 1 diabetes, type 2 diabetes, and gestational diabetes
in these data. To investigate the differential effect of diabetes mandates on women with
pregestational diabetes versus gestational diabetes, we use the Behavioral Risk Factor
Surveillance System (BRFSS) to estimate the prevalence of pregestational versus gestational
diabetes among women of childbearing age.
To obtain an estimate of the proportion of women with the type of health insurance
falling under diabetes mandates, we use the private-insurance-prevalence and employment-by-
firm-size data from the March Supplement of the Current Population Survey (March CPS) and
the percentage of workers in self-insured plans by firm size from the Kaiser/HRET Survey of
Employer-Sponsored Health Benefits and the Medical Expenditure Panel Survey.
Because of the specific target of diabetes mandates, we concentrate our study on the
sample of infants born to mothers with more than a high-school education. Specifically, diabetes
16 The diabetes information is quite comprehensive: There are between 0.5 and 3% missing values in each year investigated. Observations with missing diabetes status were dropped.

12
mandates require health-care insurers to provide coverage for medically necessary equipment,
supplies, services, and medication for individuals with diabetes, and thus these mandates affect
women that have private health insurance. According to March CPS data, during the period
investigated, 1992-2003, 36% of women of childbearing years (18-45 years old) who had not
graduated from high-school are uninsured and 25% of women with a high-school education also
lack insurance, compared to just 17% of women with more than high-school degree. Moreover,
only 35% of women with less than a high-school education are covered through their employer.
The rate of employment-based coverage among women with a high-school education is larger at
63%, but this still is significantly lower than the 77% rate of employer coverage among women
with more than a high-school diploma. As such, diabetes mandates are more likely to affect
women with a college education because a significantly larger proportion will experience a
change in insurance coverage. We focus on this sub-sample where mandates are binding,
because regressions that impose the constraint of an equal effect for the entire population may
conclude that the policy had little or no effect (Bitler and Schmidt, 2012). Results obtained using
the sample of infants born to mothers with high-school education or less are discussed in the text
when relevant or are available on request.
The caveat is that these results may not be generalizable to women with less education
even if they are privately insured, because education may be a good predictor of individuals’
discount rates (Fuchs, 1982) and, thus, of their propensity to invest in health. Another reason
why the results may not be generalizable beyond educated women is that education may predict
consumer knowledge of coverage, which is correlated with individuals' propensity to use medical
care. And finally, education may simply affect the allocation of health inputs, medical care
versus self-care, in a way that shifts the health-production function (Grossman, 2006). Despite
these limitations, our study represents an important step in understanding the costs and benefits
of insurance mandates.
Another potential caveat regards the fact that there are many legitimate ways to code the
legislative data. If the transaction costs associated with insurance contractual arrangements are
high enough, the enactment of the law could prompt insurance companies to include diabetes
coverage on new insurance contracts even before the law becomes effective, knowing that within
months they will have to change the contract anyway. In this case, there may be an impact on
coverage even before the law becomes effective. If additional coverage is costly enough,

13
however, insurance companies may prefer to wait until the law becomes effective to include such
additional coverage for diabetes. Consequently, coverage changes would occur only after the law
becomes effective.17 Because of the difference between the timing of changes in coverage and
the date the effect is recorded, only after birth, it is unlikely that there is any impact on infants
born between the enactment and effective dates. For this reason, in the main analysis we measure
the impact using the diabetes mandates' effective dates. If the effective date of the reform was on
or after July 1st, the law was coded as belonging to the year after because the law did not apply
for most of the year and thus could not affect births in that year. In the sensitivity analysis we
show that our results are robust to different ways of coding of the diabetes insurance variable.
Summary statistics for the main sample used for our analysis are reported in Table 2. The
means and standard errors of variables used are shown for all births and separately for births to
diabetic mothers only.18 These means were calculated for the state-years with no mandates,
separated by treatment status in the following year: no diabetes mandate in columns 1 and 4, and
diabetes mandates adoption in columns 2 and 5. Columns 3 and 6 report the results of t-tests for
the equality of means. Because infant outcomes exhibit time trends and the means calculated in
columns 2 and 5 tend to use later data than the means in columns 1 and 4, we report the t-test of
equality of means conditional on time fixed effects. Adopting and non-adopting states appear to
be virtually identical with respect to the variables characterizing the environment and outcomes
of infants born prior to mandate adoptions. Similarly, there is no statistically significant
difference between the characteristics of infants born to diabetic mothers in experimental versus
nonexperimental states.
4. RESULTS
4.1. Main Results
4.1.1.Graphical Evidence
Figure 1 showing pre- and post-diabetes mandate trends in the incidence of high birth-weight and
low birth-weight separately for diabetic mothers and non-diabetic mothers anticipate our main
result. They are all consistent with a decrease in the tails of the gestation and birth-weight
distribution of babies born to women with diabetes living in mandate states. Among non-diabetic
17 Note that the year of enactment and the year the law became effective are identical for some states. 18 For the sake of parsimony, the summary statistics for the non-diabetic mothers are not reported here but are available on request – see appendix Table A1.

14
mothers, the trend in prevalence of poor infant outcomes before mandates is indistinguishable
from the trend after mandates.
In addition, this graphical evidence shows no indication of a transitory pre-treatment
increase in the tails of the distribution, the equivalent of an “Ashenfelter dip” for this case
(Ashenfelter, 1978), which would suggest that the estimates indicate just mean reversion and
thus are falsely attributed to diabetes mandates. A formal test for pre-trends performed by
entering leads of the diabetes mandates in the main specification also finds no evidence of a pre-
trend (results not reported but available on request, Appendix Table A7). At the same time,
however, the graphs are consistent with an upward trend in low birth weight and prematurity and
a downward trend in high birth weight that may vary by state, highlighting the need to control for
state-specific time trends.
4.1.2. Econometric Results
It is difficult to say with certainty whether diabetes mandates should have an
instantaneous effect or a lag effect. Previous research, however, shows that fetal growth
acceleration in large for gestational age fetuses of diabetic mothers begins in the second trimester
(Wong et al., 2002), and, in fact, high-glycemia appears to have the most impact on fetal growth
in the third trimester (Schaefer-Graf et al., 2003). In contrast, if diabetes leads to prematurity, it
likely does so through its effect on the fetal environment before the third trimester. As a result,
there could be heterogeneity in the timing of the effect on each tail of the birth-weight
distribution. In Table 3, we present estimates of the instantaneous impact, the one-year lag
impact, and the two-year lag impact obtained using equation (1). Each cell represents the
coefficient from a different regression.
As shown in the second column of Table 3, we find that the effects of a diabetes mandate
lag one year behind the year the legislation became effective. This is highly plausible because
small fetal size was correlated with maternal glycemic control during the first trimester
(Pedersen et al. 1984; Visser et al. 1985).19 Also, ostensibly, a significant proportion of low
19 The prevalent opinion appears to be that the frequency of congenital malformations is about 3 times higher in the children of insulin-dependent pregestationaly diabetic women (Coustan, 1998; Dunne et al., 2009). However, we find no evidence of a significant impact of diabetes mandates on the two most common types of congenital malformations: neural tube malformations and heart malformations (results available on request). This is not implausible because congenital malformations occur almost exclusively in offspring of women whose diabetic disease had an early onset and in whom it was severe enough to produce vascular complications during their childbearing years (Comess et al. 1969). Given that in our data we cannot separate pregestational from gestational
15
birth-weight babies are premature babies. Because the effect on prematurity seems to be
concentrated among births with less than 32 weeks of gestation, it is plausible that whatever
affected the fetal environment that led to premature birth took place relatively early during
pregnancy. It is thus more likely to be the case that the effect of diabetes mandates would show
in the year following the effective date of legislation. In either case, it is reassuring to find a lag
between the adoption and any significant correlation with infant outcomes, suggesting that the
adoption of diabetes mandates is exogenous and providing further confidence in our identifying
strategy. In the remainder of the paper, we report only the lag effect of diabetes mandates.
We find that diabetes mandates are associated with a statistically significant 0.34
percentage points, the equivalent of a 3.6 percent decrease in low birth-weight (<2500 grams)
prevalence among births to women with diabetes, and a 0.19 percentage points reduction, the
equivalent of 11% reduction (from the mean) of the prevalence of very low birth-weight (<1500
grams) among births to women with diabetes. The adoption of diabetes mandates also leads to a
0.22 percentage points decrease, the equivalent of a 10-percent decrease, in prematurity (32
weeks) prevalence among births to women with diabetes.20 These are estimates of the population
impact of diabetes mandate. We follow Almond et al. (2011) and calculate the implied impact on
those who were affected by mandates by dividing these coefficients by an estimate of the share
of population investigated subject to mandates.21 After inflating the estimated effect by this
diabetes and that the prevalence of congenital malformation is very low (less than 1% for either type of malformation considered), it is possible that we cannot detect the effect of mandates in our data. 20 The effect of mandates on the prevalence of low 5-minute Apgar scores (< 8) among infants born to diabetic mothers is negative but not statistically significant at conventional significance levels. Note that this variable has a relatively high non-reporting rate (~18%). Most non-response (~65%) is driven by one state only, California. All other results are robust to the exclusion of California. 21 We do not have information about private insurance in the Natality data, nor information about the share of women with private insurance from self-insured plans that are not subject to diabetes mandates. Instead we use data from the Kaiser/HRET Employer Health Benefits Annual Survey to obtain the percentage of insured workers in self-insured plans by firm size (specifically, we averaged the 1996 and 1998 data to obtain self-insurance rates in 1997, the middle of our sample period). This information, along with the data regarding the share of 18-45 year old workers with more than 12 years education by firm size (source: March CPS) allows us to obtain the share of population with more than a high-school education in self-insured plans. Our calculations indicate that approximately 44.8% of insured people with more than a high-school education were in self-insured plans. Using the 1997 Medical Expenditure Panel Survey (MEPS) data we find a slightly lower estimate: ~43.07% of private-sector enrollees are in self-insured plans. Given that according to March CPS data 81.28% of 18-45 year-old women with more than 12 years of education had private insurance during our sample period, we find that between 44.87% (HRET-based estimate: (100-44.8)*81.28/100) and 46.27% (MEPS-based estimate: (100-43.07)*81.28/100) of educated women of childbearing age would have had private insurance subject to this regulation. Note that we assume that the rates of self-insurance are the same for both group insurance and individually purchased insurance, while in fact individually purchased insurance is more likely to be fully funded (Klick and Stratman, 2007) and thus subject to mandates.
16
share, we find that diabetes mandates reduce low birth-weight prevalence by 0.73-0.76
percentage points (or approximately 7.9-8.1 percent), very low birth-weight prevalence by 0.41-
0.43 percentage points (or approximately 24-25 percent), and prematurity by 0.48-0.50
percentage points (or approximately 21.6-22.3 percent) among diabetic women subject to
diabetes mandates.22 These estimates, however, represent a partial equilibrium and could
overestimate the effect if, for instance, self-insured plans respond to the introduction of diabetes
mandates, and thus the share of women treated in the population is in fact larger than estimated.
Also, these instead might represent underestimates if mandated-benefits laws would cause
employers to reduce offers of health insurance. The empirical evidence to support this claim,
however, is mixed (Jensen and Gabel, 1992; Gruber 1994b; Sloan and Conover, 1998).
We find no statistically significant effect on high birth-weight prevalence. This result is
unlikely to be driven by endogeneity. It would require a contemporaneous shock that affects the
relative outcomes of the treatment group in the same state-years as the law. In addition, the tests
we performed did not find evidence of endogeneity.23 The alternative hypothesis is that the
incidence of moral hazard identified by Klick and Stratmann (2007), which increased obesity
prevalence among people with diabetes, offsets the expected impact of diabetes mandates in
reducing the prevalence of high birth weight. Previous research indicates that maternal BMI has
a greater effect on the incidence of large for gestational age (LGA) births than glucose control
(Wong et al., 2002), and, as shown below, we find evidence of higher pregnancy weight gain
among women with diabetes living in mandate states.
Note that even if insulin restores fertility in diabetic women some studies show that those
with onset of diabetes at young ages are still more likely to suffer from infertility than non-
diabetics (Livshits and Seidman, 2009). Thus, the diabetic pregnancies investigated here may be
among the healthiest diabetic women. To the extent that mandates providing better ability to
control diabetes may lead to more diabetic pregnancies, our study relying on year-to-year
variation in pregnancy outcomes may not be able to fully account for the general equilibrium
effects of diabetes mandates.
22 The lowest estimate is based on the1997 MEPS data on the prevalence of self-funded insurance plans, while the highest estimate is based on the 1996-1998 HRET data on the prevalence of self-funded insurance plans. 23 The graphs do not indicate pre-trends, nor is there any correlation between our measures of infant health and leads of diabetes mandates. We also find no evidence of sensitivity to sample size (results not reported but available on request, Appendix Table A7).

17
Although we cannot point out with certainty the mechanism of the effect, we can attempt
to identify the demographic categories that benefit most from diabetes mandates and the
categories still vulnerable. State-level data have the advantage of reducing noise and improving
tractability of regressions, as we deal with significantly fewer observations. At the same time,
using these data reduces the power of our tests and the ability to identify the effect in the
presence of the large number of fixed effects required by the DDD identification strategy.
Because cutting the data to investigate the impact of diabetes mandates by demographic group
reduces available variation, and thus, the power to identify the effect of the law, we use highly
detailed, individual-level data to identify the effect of diabetes mandates by age-race
demographic group.24 The age groups are: age below 25, 25 to 29, 30 to 34, and 35 and over.
Because the sample investigated is babies born to educated women, pregnancies before the age
of 25 would be more likely to be unplanned than post-age 25 pregnancies. While women
younger than 25 are more likely to be healthy, they also may invest less in healthy behaviors
during pregnancy. Similarly, older mothers, over 35 years old, are more likely to suffer from
diabetes, but they appear to have experienced a slower increase in diabetes incidence than
younger age groups (Lawrence et al., 2008), which could be driven by different lifestyle
choices.25 These women are also less likely to have unplanned pregnancies. As a result, there
may be significant heterogeneity in the effect of diabetes mandates.
As reported in Table 4, we find that the benefit of diabetes mandates is concentrated
among infants born to women over 30 years old. This is consistent with the higher prevalence of
diabetes among these women. A higher prevalence of private health insurance among older
women, as implied by March CPS data, is another potential explanation of these results. We also
find a larger effect on the prevalence of low birth-weight among babies born to Black women
with diabetes, which is consistent with the previous finding that low birth-weight incidence is
higher in this demographic group than it is among Caucasian diabetic women (Nicholson et al.,
2006).
To investigate the hypothesis that the effect of better access to medical care is attenuated
by behavioral changes, we estimate the effect of diabetes mandates on pregnancy weight gain
24 Note that the estimates are similar when using state-year cells, but the standard errors are understandably larger. (results not reported but available on request, Appendix Table A3). 25 In addition, similar lifestyle choices may or may not have different impacts on birth outcomes by mother’s age (Walker, Tekin, and Wallace, 2009).

18
among diabetic women. Because our data do not report weight before pregnancy, it is difficult to
assess whether changes in pregnancy weight are in fact an improvement or whether they put
women a weight category that might generate problems for their babies. Consequently, we
concentrate on weight gain of at least 35 pounds, which would be problematic for most women
in our sample. The Institute of Medicine pregnancy weight gain guidelines are 28-40 pounds for
underweight women, 25-35 for women of normal weight, 15-25 for overweight women, and 11-
20 for obese women.26 Given that approximately 59.5% of all women age 20-39 are overweight,
54.9% of Non-Hispanic White women are overweight, and 78% of Non-Hispanic Black women
are overweight (Flegal et al., 2010), while less than 3% of women over 20 years old are
underweight (Fryar and Ogden, 2010), a pregnancy weight gain of more than 35 pounds would
be too much for the large majority of women in our sample. Note that in our data there is heaping
at 35 pounds. It could be that women control their weight as to gain exactly 35 pounds, or else
misreporting causes the heaping. We believe it is more likely to be caused by under-reporting
than over-reporting and treat a weight gain of 35 pounds as problematic.27
We find that diabetes mandates are in fact associated with an increase in pregnancy
weight gain among diabetic women, but the change is statistically significant only among Black
women who are 30-35 years old. This change in behavior could attenuate the positive effect of
diabetes mandates and at least partially explain why we find no effect on the prevalence of high
birth-weight babies.
Another way to test this hypothesis is to look at women over 35 years old having their
first child. We believe these women would be more likely to avoid any type of behavior that
might cause harm to the pregnancy. We find that among Black women over 35 years old, there is
evidence of a significant increase in the probability of significant weight gain (35 pounds or
more) only among those already having had a child (coefficient 2.146, with standard error of
1.176 and significant at 5%) but not among those having their first child (coefficient 0.616 with
standard errors of 4.227). In addition, we find a significant decrease in very high birth weight
26 “Weight Gain During Pregnancy: Reexamining the Guidelines,” Institute of Medicine of the National Academies, May 28, 2009 available at www.iom.edu/pregnancyweightgain (downloaded August 2011). 27 Note that there is an approximately 18% non-response rate of weight gain. About 65% of the missing values come from California, for which there are no data on weight gain. Nevertheless the remaining missing values represent a significant enough proportion of the population to suggest that the data on weight gain might represent a selected sample. There is no evidence, however, that the non-response rate is different for diabetics versus non-diabetics. Using data from all other states, we find that the non-response rate among women with diabetes is 6.516%; and among non-diabetics it is 6.215%.

19
prevalence among first births to Black women over 35 years old (coefficient -1.782 with
standard error of 0.863 and significant at 5%) but a smaller decrease among those having second
or subsequent births (coefficient -0.559 with standard error of 0.394). Although the coefficients
follow a similar pattern, they are not significant in the case of White women.
Another question is raised by the differential responses of male versus female fetus to
changes in fetal environment because the human male is more fragile than the female (Kraemer
2000). To investigate the hypothesis of heterogeneity in the effect of mandates by infant gender,
we separate the state/year/demographic group cells by infant gender and run separate regressions
for male versus female infants. The results reported in Table 5 suggest that diabetes mandates are
associated with a statistically significant reduction in prematurity among female infants but not
among male infants. One explanation is that there are more female premature births because
females have a higher probability of survival if premature. It is possible that the fetal health
threshold at which a pregnancy results in a live birth is lower as maternal health improves. As a
result, diabetes mandates may lead to a decrease in prevalence of fetal deaths.28 A larger
decrease in male fetal deaths would be consistent with our estimates. Because our data do not
have reliable information about stillbirths29 and miscarriages, we defer this question for future
research.
An alternative hypothesis is that different mechanisms are behind the decreases in low
birth weight among male and female infants, respectively. As Kramer (1987a, 1987b) suggests,
birth weight is determined by gestation length and by the growth conditional on gestation length
(intrauterine growth or IUG). When we separate premature low birth-weight births from full-
term low birth-weight births, we find that most of the effect on low birth-weight is concentrated
among premature births for both male and female babies. For instance, mandates are associated
with a ~6% (coefficient -0.415) decrease in prevalence of premature low birth-weight male
infants but with a ~2.2% (coefficient -0.046) decrease in prevalence of full-term, low birth-
weight male infants. These results suggest that even if there is no significant change in the
proportion of premature male births, the resulting births either have slightly longer gestation or
28 By fetal deaths, we denote any attrition between conception and live births. 29 The NCHS Fetal Death datasets have missing values for mother's diabetic status for approximately 40% of observations, which makes it unsuitable for our analysis. We find no evidence of a significant change in sex ratio of infants born to diabetic women in states with mandates. The estimated coefficient of the lag diabetes mandate on the proportion of female births is -0.054, with a standard error of 0.251 (both multiplied by 100 to improve readability).

20
are just less fragile. This is important to document, because prematurity is more important than
IUG in determining low birth weight, but so far it has proved to be more difficult to manipulate.
4.2. Falsification Tests
One way to test whether we are capturing the effect of diabetes mandates is to investigate
whether this legislation is associated with any change in infant outcomes where there should be
none.
4.2.1 Effect by Education
We first show there is no effect when mothers are less likely to experience a change in
their insurance status. In the data section, we explained that the focus of this paper is on infants
born to mothers with more than high-school education, because data show that these women are
likely to have private health insurance and, thus, are more likely to be affected by the adoption of
diabetes mandates. It follows that if indeed our empirical strategy captures the effect of diabetes
mandates, we should observe a lower effect where mandates are less likely to be binding.
Women with a high-school education or less are less likely to have obtained health insurance
through their employer. In Table 6, Panel A we report results obtained by replicating our main
empirical specification on the sample of infants born to women with a high-school education or
less.30 The coefficients are indeed not significant and even change sign in some cases.
Moreover, when we restrict the sample to women with 16 or more years of education, among
which according to March CPS data almost 90% have private insurance, the effect is larger and
more precisely estimated. These findings provide further reassurance that our identifying strategy
can successfully isolate the impact of diabetes mandates.
4.2.2. Effect by Mother's Diabetic Status
In addition, we look at infants born to non-diabetic mothers. Any change in outcomes
among these women should be small, because they do not benefit directly from mandates. A
positive impact, if any, would be driven by access to education about preventive behaviors, and it
would be smaller. Mandates may also have an effect if they resulted in premium changes that
affected the decision to obtain coverage or if they reduced incentives to engage in preventive
behaviors. We find that there is no statistically significant effect on infants born to non-diabetic
30 We report the coefficients obtained under the assumption that the timing of the effect of diabetes mandates is the same across sub-samples. There is no evidence that diabetes mandates have any significant effect on this sample at any point in time. (results not reported but available on request, Appendix Table A2)

21
mothers (Table 6, Panel B), and the estimated coefficients imply changes several times smaller.
For instance, our DD estimates imply a ~4.4% decrease in low birth-weight prevalence among
mothers with diabetes (calculated at the mean of the data), but a ~0.7% decrease among women
with no diabetes; similarly, the implied decrease in prematurity (<32 weeks) is ~12% among
women with diabetes but only ~1.7% among all other women. The lack of worsening outcomes
is consistent with previous literature that found no evidence of moral hazard associated with
diabetes mandates among non-diabetics (Klick and Stratmann, 2007).
4.2.3. Effect by Diabetes Type: Pregestational versus Gestational
In Panel C of Table 6, we investigate whether the effect of mandates differs by type of
diabetes (pre-gestational or gestational). Because Natality data do not include information about
the type of diabetes, we use BRFSS data to obtain the relative prevalence of gestational diabetes
among 18-45 year-old women with diabetes for each state/year cell31 and interact it with the
triple interaction (diabetic status, mandate state, post-treatment status). The analysis is more
tentative, not only because of measurement error in this variable, but also because it has been
recognized that recorded gestational diabetes does in fact include cases of unrecognized
pregestational diabetes (Kim and Ferrara, 2010). Thus, a higher share of gestational diabetes
among pregnant women diagnosed with diabetes likely indicates more cases of gestational
diabetes, but it could also be indicative of more cases of undiagnosed pregestational diabetes.32 It
may not be entirely appropriate to interpret the results only through the lenses of expected effects
associated with diabetes early in pregnancy (the case of pregestational diabetes) versus the
effects associated with diabetes late in pregnancy (most likely the case of gestational diabetes).
In addition, the interpretation must account for potentially different effects of mandates on
insurance rates by type of gestation. It is likely that women with type 1 diabetes, diagnosed early
31 BRFSS includes pregnant women; however the sample-size is very small (an average of ~60 women in a state) thus making the sample of diabetic pregnant women too small (an average of ~3 in each state) for any meaningful estimates of relative prevalence of gestational versus pre-gestational diabetes. Consequently, we obtain estimates for the entire sample of women ages 18-45. There is measurement error in this variable. We do not have a very good estimate of the actual instances of gestational diabetes in a year, because the question asked in BRFSS is, “Have you EVER been told by a doctor that you have diabetes?” Thus, for instance, among women 30-44, some may have had gestational diabetes in their 20s. Nevertheless, the mean estimates appear to be quite similar to the estimates of prevalence of diabetes from other sources. Approximately 2.3% of women aged 18-45 have diabetes, which is slightly higher than the 1.82% pre-gestational diabetes among pregnancies in 2005 (Lawrence et al., 2008). Also, approximately 2.2% of women 18-45 have ever had gestational diabetes, compared to an estimated range of 2 to 10% of pregnancies (CDC, 2011). 32 The variable is the share of women with gestational diabetes among all women with diabetes; thus, a larger share could be driven by fewer women with pre-gestational diabetes, or by more women with gestational diabetes when the number of women with pre-gestational diabetes is the same.

22
in their life,33 would have obtained some sort of coverage even without mandates. The same is
not necessarily true for women with type 2 diabetes, believed to be driven by lifestyle, or for
women with gestational diabetes. The price of insurance may have changed because of
mandates,34 or else the demand for insurance may change with increased coverage, possibly
leading to differential changes in insurance rates by type of diabetes.
Our estimates point to larger decreases in the share of macrosomic infants in areas with
larger shares of women diagnosed with gestational diabetes. We also find smaller improvements
in low birth-weight/prematurity prevalence in areas with larger shares of gestational diabetes
(i.e., smaller shares of pregestational diabetes). This is consistent with previous medical studies
indicating that having diabetes early in pregnancy leads to low birth-weight and prematurity,
while having diabetes later in pregnancy, as in gestational diabetes, is more likely to lead to
macrosomia.
4.3.4. Effect by Likelihood of Treatment as Determined by Type of Insurance
Even among women with more than a high-school education, not all have private
insurance. Our data do not include information about whether the women had private insurance.
Instead, we follow Schmidt (2007) and use March CPS data to calculate the share of women ages
18-45 with more than 12 years of education in each state and year who are covered by private
insurance and test whether the effect of diabetes mandates varies with private insurance
coverage. Because we cannot calculate coverage through private insurance separately for women
with diabetes versus non-diabetics, we impose the constraint that the coverage is the same in
both groups. To test whether the estimated effect is driven by changes to the treated population,
i.e. having private insurance, we add to our main specification, equation (1), an interaction term
between our triple interaction (diabetic status, mandate state, post-treatment status) and the share
of privately insured women. Consistent with our hypothesis, the results reported in Table 7
column 1 indicate a systematic gradient in the size of the effect by prevalence of private
coverage. Specifically, diabetes mandates lead to larger decreases in both tails of the birth-
weight distribution where more women are covered by private insurance.
33 Peak age at diagnosis in the United States is 14. 34 We are not aware of any such estimates; however, the “2003 Diabetes Mandate Report” issued by the Utah Insurance Department (October 28, 2003) states that diabetes mandates increased costs by less than 0.1%, the equivalent of 2 USD per year per policyholder. Similarly, the Louisiana Department of Insurance's “A Study of the Costs Associated with Healthcare Benefits Mandated in Louisiana” issued on 28 February 2003 shows that the cost of diabetes mandate was less than 0.006 percent of the total cost paid by insurers.

23
In addition, not all women with private insurance will experience a change in their
coverage even when living in a state with a diabetes mandate. Under the Employment
Retirement Income Security Act of 1974 (ERISA), firms that self-insure are exempt from
mandates. If the effect we identify is driven by mandates, we should observe a larger impact on
births to women that do not obtain health insurance coverage through firms that self-insure.
Detailed information on the share of employees in such firms is not available. However, previous
empirical analyses found that large firms are more likely to self-insure (Park, 2000, Gabel et al.,
2003). We follow Schmidt (2007) and use the employment-by-firm-size data as a proxy for the
share of employment in firms that self-insure or not. Specifically, we use March CPS data to
obtain the share of 18-45 year-old employees with more than 12 years of education who work in
firms with less than 500 employees35 in each state and year and interact this variable with our
triple interaction (diabetic status, mandate state, post-treatment status).36 Although not all
estimates are statistically significant, we find that the decrease in the tails of the birth-weight
distribution is systematically larger where the share of employment in small- and medium-sized
firms is more significant.
Furthermore, we obtain an estimate of the share of the population in fully-insured plans
and investigate whether we observe a larger effect where more people are enrolled in fully-
insured plans. For this purpose, we use the Kaiser/HRET Employer Health Benefits Annual
Survey data to obtain an estimate of the share of covered workers in self-insured plans by firm
size.37 We use these data, along with the share of 18-45 year-old workers with more than 12
years of education by firm size in each state/year cell (March CPS data), to obtain an estimate of
the share of 18-45 year-old workers with more than 12 years of education enrolled in self-funded
insurance plans, and, thus, also the share enrolled in fully-insured plans. For an estimate of the
share of educated (>12 years education) women of childbearing age (18-45 years old) covered by
fully insured plans, we apply the private insurance rates within this population (March CPS data)
to the share of fully insured workers. The coefficients of the variable obtained from interacting
35 March CPS reports categories of less than 25, 25-99, 100-499, 500-999, and 1,000 or more employees. We chose the 500 employees cut-off because Gabel et al. (2003) found that only 13% of employees in firms with less than 200 employees were enrolled in self-insured plans, 46% in firms with 200-999 employees, but over 60% of employees in firms with 1,000 or more employees. 36 The share of employees working in firms that employ less than 500 workers is absorbed by the state-by-year fixed effects. 37 Because the data are not available for all years in our sample, we average 1996 and 1998 data to obtain the 1997 (middle of sample) estimate of the share of workers in self-insured plans by firm size.

24
our estimate of the share of fully insured with our triple interaction (diabetic status, mandate
state, post-treatment status) are reported in column 3 of Table 7. Again, we find the same pattern
of health improvements where the treatment population is likely to be larger.
Last, we test how the diabetes-mandates effect varies with employment in industries
where workers tend to obtain health insurance through fully insured plans (Table 7, column 4).
For this purpose, we retain the following industries: retail, wholesale, service, and finance. Both
the Kaiser/HRET Employer Health Benefits Annual Survey data and the Form 5500 filings, as
described by Brien and Panis (2011), indicate that retail, finance, and service have lower rates of
self-insurance than other industries. In addition, Kaiser/HRET data indicate that, in aggregate,
mining/construction/wholesale have low rates of self-insurance, but Brien and Panis (2011) find
low rates of self-insurance only in wholesale and not in mining and construction.38 These
observations made us retain wholesale employment in our analysis but not mining and
construction. We find a similar gradient as in our previous analyses, suggesting that mandates
have larger effects in areas known to have larger populations covered by fully funded private
health insurance.
All these tests point in the same direction: The effect of diabetes mandate is larger where
the likelihood of treatment is greater, providing further support for our estimates.
4.3. Sensitivity Analysis
All but three states implemented diabetes mandates that require private insurance policies
to provide coverage for diabetes treatment. Mississippi, Missouri, and Washington state laws
require only that insurers offer coverage; in other words, they must make available for purchase a
policy that covers diabetes treatment, but the laws do not require all insurance policies to cover
diabetes. So far we have treated both types of laws similarly; however, they could have different
implications with respect to their potential of generating moral hazard. If coverage is only
offered and not required, perhaps only those for which the benefits outweigh the cost of
additional coverage, i.e. only those who find it most difficult to manage diabetes through
lifestyle would choose to be covered. The implication for insurance companies is that they add to
their pool of insured only the frailest, but for the population at large the implication is that only
those who need diabetes coverage the most will get it. This might limit the potential of moral
38 MEPS data confirm high-rates of self-insured plans in mining, but not in construction. However, March CPS data indicate significantly lower rates of private insurance in construction, and thus even if many insured workers may be in fully funded plans, the proportion of total workers in fully funded plans is still lower than that in other industries.

25
hazard in the population, because perhaps fewer people with easy-to-manage diabetes would
substitute lifestyle for medication. It could thus be the case that requiring to offer coverage is
associated with larger improvements in health than requiring to provide coverage.
In contrast, if people do not assess correctly their ability to manage diabetes and/or the
costs associated with the failure to manage their diabetes on a permanent basis, mandating the
inclusion of coverage for everybody could imply faster interventions to correct poor diabetes
management. Coverage may be associated with having more contact with physicians that likely
are better at assessing the individuals’ ability to successfully manage diabetes and can
recommend corrective measures.
We find no statistically significant difference between the impact of the mandate to offer
coverage versus the mandate to provide coverage. The coefficients for the mandate to offer are
larger but are also less precisely estimated because of less variation in this variable. We do find a
marginally significant effect on high birth-weight prevalence in the case of the mandates to
provide coverage. This coefficient is positive, while the coefficient on the mandate to offer
coverage is negative. This pattern could be due to the higher moral hazard of increased weight
gain associated with the mandate to provide coverage.
In addition, our results are robust to a wide series of specification tests. They are robust to
using a log specification. They are also robust to using the enactment date and to recoding the
law as 1 if diabetes mandates became effective before July 1st of that year, and 0.5 if diabetes
mandates became effective in the first week of July. In addition, the estimates are very similar to
the results obtained from a difference-in-difference specification using only the states that
adopted mandates, or only the sub-sample of infants born to women with diabetes, providing
reassurance against any concerns that potential secular differences between the infant health of
diabetic versus non-diabetic mothers or between adopting and non-adopting states (not already
captured by controls) confound our estimates. There is no evidence of endogeneity as the lead of
the effective date of mandates or the lead of the enactment date are not significant predictors of
future infant outcomes. The results are also robust to the sample choice, providing support for
our identifying strategy. These results are not reported but are available on request (see
Appendix Table A7).

26
5. CONCLUSION
The question of how to best improve infant outcomes is of great importance, especially in the
United States, which lags behind other developed countries in infant outcomes. This is becoming
more pressing as current trends predict women will experience even higher rates of obesity and
diabetes, known predictors of poor infant health. This paper investigates the impact of diabetes
mandates, which improve access to medical care but may be accompanied by the moral hazard of
decreased preventive self-care among women during their fertile years. This paper contributes to
the empirical literature on the effect of mandated benefits on health by estimating the impact of
diabetes mandates on two measures of infant health, birth-weight and prematurity.
Four primary conclusions are drawn from our analysis:
1. Mandates are associated with a reduction in the prevalence of premature birth (32 weeks)
among diabetic mothers with more than 12 years of education. Within the same demographic
group, it is also associated with a decrease in the prevalence of very low birth-weight (<1500
grams), and the prevalence of low birth-weight (<2500 grams). Our estimates point out the
demographic categories that experience the most gains: African Americans and older women.
2. There is no evidence of a significant change in the mean prevalence of high birth-weight, but
there is some evidence of an effect among the demographic groups most likely to be treated:
those with the highest prevalence of private insurance and especially fully-funded private
insurance.
3. A positive correlation exists between the adoption of diabetes mandates and the likelihood that
diabetic mothers over 30 years old gain more than 35 pounds during pregnancy. The effect is
significant at conventional significance levels only among African-American mothers who are
30 to 35 years old. At the same time infants of older women and African-American women
experienced the largest improvement in the left tail of the birth-weight distribution. This could
indicate that mandates have a differential effect on both moral hazard (Cagatay, 2005) and
outcomes function of the initial health conditions. It could also indicate that these are the
categories for which mandates are binding. Nevertheless, the result raises concerns about the
potential deleterious effect of behavioral changes triggered by diabetes mandates.
4. No effect was found on the outcomes of infants born to women with high-school education or
less. This seems reasonable, because such women are less likely to hold private insurance and,
thus, are less likely to be affected by diabetes mandates.

27
Of the above results, the weak effect of diabetes mandates on the incidence of high birth-
weight babies is perhaps the most thought-provoking. One explanation is that the biological
mechanisms behind the correlation between maternal diabetes and high birth-weight are different
from the mechanisms linking maternal diabetes with prematurity and low birth weight. Another
is that moral hazard offsets the positive impact of mandates, while possibly affecting each tail of
the birth-weight distribution differently. The finding that diabetic women over 30 are more likely
to gain more than 35 pounds during pregnancy provides supportive evidence of the latter
proposed explanation, but does not reject the hypothesis that other factors also play a role.
If moral hazard explains the poor improvement in high birth-weight prevalence, it might
also be the case that without this moral hazard effect, the decrease in premature and low birth-
weight prevalence associated with the diabetes mandates would be greater. Nevertheless, overall,
our results suggest that a comprehensive investigation of all parties affected by mandates is
warranted. Although it is possible that the health of people with diabetes suffered because of an
increase in obesity rates, we found an improvement in outcomes of infants born to diabetic
women. Further investigation of the effects of diabetes mandates on other conditions, such as
chronic hypertension, vascular and heart problems might be useful in determining the efficacy of
these mandates.
Acknowledgements. We are grateful for especially valuable criticism from Lucie Schmidt. We
are also grateful to Reagan Baughman, Resul Cesur, Hope Corman, Richard Frank, Ted Joyce
and two anonymous referees for useful comments and conversations. All errors or omissions are
our own.

28
REFERENCES Almond, Douglas, Kenneth Y. Chay, and David S. Lee, “The Costs of Low Birth Weight,”
The Quarterly Journal of Economics, August 2005, 1031-1083. Almond, Douglas, Hilary W. Hoynes, and Diane Whitmore Schanzenbach “Inside the War
on Poverty: The Impact of Food Stamps on Birth Outcomes” The Review of Economics and Statistics, May 2011, 93(2): 387-403
Ashenfelter, Orley. “Estimating the effect of training programs on earnings.” The Review of Economics and Statistics, 1978, 60(1): 47-57.
Behrman, Jere R., and Mark R. Rosenzweig, “Returns to Birthweight,” The Review of Economics and Statistics, May 2004, 586-601.
Behrman, Richard E.; and Adrienne Stith Butler, Editors, “Preterm Birth: Causes, Consequences, and Prevention,” Committee on Understanding Premature Birth and Assuring Healthy Outcomes, National Academies Press, 2007
Bertrand, Marianne; Esther Duflo; and Sendhil Mullainathan. “How much should we trust differences- in-differences estimates?” Quarterly Journal of Economics, February 2004, 119(1): 249-275.
Bitler, Marianne P. and Christopher S. Carpenter. “Health Insurance Mandates, Mammography, and Breast Cancer Diagnoses” Working Paper, 2012a.
Bitler, Marianne P. and Christopher S. Carpenter. “Effects of State Cervical Cancer Insurance Mandates on Pap Test Rates,” 2012.
Bitler, Marianne P., and Lucie Schmidt. 2012 “Utilization of Infertility Treatments: The Effects of Insurance Mandates.” Demography, 49(1): 124-149
Black, Sandra E.; Paul J. Devereux; and Kjell G. Salvanes, “From the Cradle to the Labor Market? The Effect on Adult Outcomes,” The Quarterly Journal of Economics, February 2007, 122(1): 404-439.
Brien, Michael J. and Constantijn W.A. Panis. “Self-insured health benefit plans,” Deloitte Financial Advisory Services LLP (Deloitte FAS) and Advanced Analytical Consulting Group, Inc. (AACG), under contract DOLB109330993 from the U.S. Department of Labor
Busch, Susan H and Colleen L. Barry. “New Evidence on the Effects of State Mental Health Mandates,” Inquiry, Fall 2008, 45(3): 308-322.
Cagatay, Koc. “Health-Specific Moral Hazard Effects,” Southern Economic Journal, July 2005, 72(1): 98-118
Centers for Disease Control and Prevention (CDC). National Diabetes Fact Sheet: national estimates and general information on diabetes and prediabetes in the United States, 2011. Atlanta, GA: U.S. Department of Health and Human Services, Centers for Disease Control and Prevention, 2011.
Cesur Resul and Inas Rashad Kelly. “From Cradle to Classroom: High Birth Weight and Cognitive Outcomes” Forum for Health Economics and Policy, 2010; 13(2) (Health Economics), Article 2, 2010
Chen Aimin, Shingairai A. Feresu, Cristina Fernandez, and Walter J. Rogan, “Maternal Obesity and the Risk of Infant Death in the United States” Epidemiology, January 2009, 20(1): 74-81
Combs CA; Gunderson E; Kitzmiller JL; Gavin LA; Main EK. “Relationship of fetal macrosomia to maternal postprandial glucose control during pregnancy.” Diabetes Care, October 1992;15(10):1251-1257.
Comess LJ; Bennett PH; Burch TA et al. “Congenital anomalies and diabetes in the Pima

29
Indians of Arizona.” Diabetes, 1969, 18: 471–477 Corman, Hope and Stephen Chaikind, “The Effect of Low Birthweight on the School
Performance and Behavior of School-Aged Children,” Economics of Education Review, 1998, 17(3): 307-316.
Coustan Donald R. “Pre-conception planning: the relationship’s the thing.” Diabetes Care, 1998, 21(6): 887–888
Currie, Janet and Rosemary Hyson. “Is the Impact of Health Shocks Cushioned by Socioeconomic Status? The case of Low Birthweight.” American Economic Review, May 1999, 89(2): 245-250.
Dabelea D, Snell-Bergeon JK, Hartsfield CL, Bischoff KJ, Hamman RF, McDuffie RS. “Increasing prevalence of gestational diabetes mellitus (GDM) over time and by birth cohort: Kaiser Permanente of Colorado GDM Screening Program.” Diabetes Care, March 2005, 28(3): 579–584.
Danielzik S; Czerwinski-Mast M; Langnäse K; Dilba B; Müller MJ. “Parental overweight, socioeconomic status and high birth weight are the major determinants of overweight and obesity in 5–7 y-old children: baseline data of the Kiel Obesity Prevention Study (KOPS).” International Journal of Obesity and Related Metabolic Disorders, November 2004, 28(11): 1494-1502.
Dunne FP; Avalos G; Durkan M; Mitchell Y; Gallacher T; Keenan M; Hogan M; Carmody LA; Gaffney G; ATLANTIC DIP collaborators. “ATLANTIC DIP: Pregnancy outcome for women with pre-gestational diabetes along the Irish Atlantic seaboard.” Diabetes Care, July 2009. 32(7): 1205-6.
Ehrenberg Hugh M.; Brian M. Mercer; and Patrick M. Catalano. “The influence of obesity and diabetes on the prevalence of macrosomia.”American Journal of Obstetrics and Gynecology, September 2004, 191(3): 964-968.
Ferrara, Assiamira; Hedderson Monique M., Quesenberry Charles P., Selby Joseph V. “Prevalence of Gestational Diabetes Mellitus Detected by the National Diabetes Data Group or the Carpenter and Coustan Plasma Glucose Thresholds.” Diabetes Care, September 2002, 25(9): 1625–1630.
Flegal Katherine M., Margaret D. Caroll, Cynthia L. Ogden, Lester R. Curtin. “Prevalence and Trends in Obesity Among US Adults, 1999-2008,” JAMA, January 13, 2010, 303(3): 235-241.
Fryar, Cheryl D., Cynthia L. Ogden. “Prevalence of Underweight Among Adults Aged 20 Years and Over: United States, 2007-2008,” CDC, National Center for Health Statistics, October 2010.
Fuchs, Victor. “Time Preference and Health: An Exploratory Study,” in Victor Fuchs Editor, Economic Aspects of Health, Chicago: University of Chicago Press, 1982: 93-120.
Gabel, Jon R., Gail A. Jenson, and Samantha Hawkins. “Self-Insurance in Times of Growing and Retreating Managed Care,” Health Affairs, March/April 2003, 22(2): 201-210.
Gilbert, William M., Thomas S. Nesbitt, and Beate Danielson, “The Cost of Prematurity: Quantification by Gestational Age and Birth Weight,” Obstetrics & Gynecology, September 2003, 102(3): 488-492.
Grossman, Michael. “Education and Nonmarket Outcomes,” in Eric Hanushek and Finis Welch Editors, Handbook of the Economics of Education Volume1, North Holland, 2006.
Gruber, Jonathan. 1994a. “The Incidence of Mandated Maternity Benefits.” The American Economic Review, June 1994, 84 (3): 622-41.

30
Gruber, Jonathan. 1994b. “State Mandates Benefits and Employer Provided Insurance,” Journal of Public Economics, 55(3): 433-464.
Harder, Thomas; Andreas Plagemann; and Anja Harder. “Birth Weight and Subsequent Risk of Childhood Primary Brain Tumors: A Meta-Analysis,” American Journal of Epidemiology, 2008, 168 (4): 366-373.
Harder, Thomas; Elke Rodekamp, Karen Schellong, Joachim W. Dudenhausen, and Andreas Plagemann. “Birth Weight and Subsequent Risk of Type 2 Diabetes: A Meta-Analysis,” American Journal of Epidemiology, 2007, 165(8): 849-857.
Harris Katherine M., Cristopher Carpenter, and Yuhua Bao, “The Effects of State Parity Laws on the Use of Mental Health Care,” Medical Care, June 2006, 44(6): 499-505.
Hedderson, Monique M.; Ferrara, Assiamira; Sacks, David A. “Gestational Diabetes Mellitus and Lesser Degrees of Pregnancy Hyperglycemia: Association With Increased Risk of Spontaneous Preterm Birth”, Obstetrics & Gynecology, October 2003, 102(4): 850-856.
Hjalgrim LL; Westergaard T; Rostgaard K; Schmiegelow K; Melbye M; Hjalgrim H; Engels EA. “Birth weight as a risk factor for childhood leukemia: a meta-analysis of 18 epidemiologic studies.” American Journal of Epidemiology, October 2003,158(8):724–735.
Jensen Gail and Gabel Jon R. 1992. “State Mandated Benefits and the Small Firm’s Decision to Offer Insurance,” Journal of Regulatory Economics 4(4): 379-404.
Jovanovic-Peterson L; Peterson CM; Reed GF; Metzger BE; Mills JL; Knopp RH; Aarons JH. “Maternal postprandial glucose levels and infant birth weight: the Diabetes in Early Pregnancy Study. The National Institute of Child Health ad Human Development - Diabetes in Early Pregnancy Study.” American Journal of Obstetrics and Gynecology, January 1991, 164(1 Pt 1):103-111.
Kahn, Matthew, “Diabetic Risk Taking: The Role of Information, Education, and Medication.” Journal of Risk and Uncertainty, 1999, 18: 147-164.
Kirkegaard I; Obel C; Hedegaard M; Henriksen T. “Gestational Age and Birth Weight in Relation to School Performance of 10-Year-Old Children: A Follow-up Study of Children Born After 32 Completed Weeks.” Pediatrics, October 2006, 118(4): 1600-1606.
Kim, Catherine and Assiamira Ferrara. “Gestational Diabetes During and After Pregnancy” Springer; 1st Edition, 2010.
Klick, Jonathan and Thomas Stratmann. “Diabetes Treatments and Moral Hazard,” Journal of Law and Economics , 2007, 50(3): 519-638.
Knight, Kristin M.; Eva K. Pressman; David N. Hackney; Loralei L. Thornburg. “Perinatal outcomes in type 2 diabetic patients compared with non-diabetic patients matched by body mass index.” The Journal of Maternal-Fetal and Neonatal Medicine, June 2012, 25(6): 611-615
Kraemer, Sebastian. “The Fragile Male.” BMJ, 2000, 321: 1609–1612. Kramer, Michael S. (1987a) “Intrauterine Growth and Gestational Determinants,”
Pediatrics, 80: 502-511. Kramer, Michael S. (1987b) “Determinants of Low Birth Weight: Methodological
Assessment and Meta-Analysis,” Bulletin of the World Health Organization 65(5): 633-737. Lawrence, Jean M.; Richard Contreras; Wansu Chen; and David A. Sacks. “Trends in the
Prevalence of Preexisting Diabetes and Gestational Diabetes Mellitus Among a Racially/Ethnically Diverse Population of Pregnant Women, 1999–2005,” Diabetes Care, May 2008, 31(5): 899-904
Lewit, Eugene M.; Linda Schuurmann Baker; Hope Corman; and Patricia H. Shiono, “The Direct Cost of Low Birth Rate,” The Future of Children, Spring 1995, 5(1): 35-56.

31
Li, Rui; Ping Zhang, Lawrence Barker, and DeKeely Hartsfield. 2010 “Impact of state mandatory insurance coverage on the use of diabetes preventive care.” BMC Health Services Research, 10: 133
Livshits A.; Seidman DS. “Fertility issues in women with diabetes.” Womens Health (London England), 2009, 5:701–707.
Mandl, Lisa A.; Karen H. Costenbader; Julia Simard; and Elizabeth W. Karlson. “Is Birthweight Associated with Risk of Rheumatoid Arthritis? From a Large Cohort Study” Annals of the Rheumatic Diseases, April 2009; 68(4): 514-518
MacDorman; Marian F; T.J. Mathews. “Recent Trends in Infant Mortality in the United States,” NCHS Data Brief, No. 9, October 2008
McCormick, Marie C.; Judy C. Bembaum; John M. Eisenberg; Sharon Lee Kustra; and Emily Finnegan. “Costs Incurred by Parents of Very Low Birth Weight Infants After the Initial Neonatal Hospitalization.“ Pediatrics, September 1991, 88(3): 533-541.
McDonald, Sarah D; Zhen Han; Sohail Mulla; and Joseph Beyene. “Overweight and obesity in mothers and risk of preterm birth and low birth weight infants: systematic review and meta-analyses.” British Medical Journal, July 2010; 341:c3428.
Meyer, Bruce D. “Natural and Quasi-Experiments in Economics.” Journal of Business & Economic Statistics, April 1995, 13(2): 151-161.
Miriam King, Steven Ruggles, J. Trent Alexander, Sarah Flood, Katie Genadek, Matthew B. Schroeder, Brandon Trampe, and Rebecca Vick. Integrated Public Use Microdata Series, Current Population Survey: Version 3.0. [Machine-readable database]. Minneapolis, MN: Minnesota Population Center [producer and distributor], 2010.
Naeye, Richard L. “Maternal body weight and pregnancy outcome,” American Journal of Clinical Nutrition, August 1990, 52(2): 273-279
National Center for Health Statistics, “Health, United States 2008, with Chart book” Hyattsville, MD: 2009.
Nicholson, Wanda K.; Harold E. Fox; Lisa A. Cooper; Donna Strobino; Frank Witter; Neil R. Powe. “Maternal Race, Procedures, and Infant Birth Weight in Type 2 and Gestational Diabetes,” Obstetrics & Gynecology, September 2006, 108(3) Part 1: 626-634.
Ostlund, Ingrid; Ulf Hanson; Anders Björklund; Ragnhild Hjertberg; Nord Eva; Elisabeth Nordlander; Marja-Liisa Swahn ML; and Jan Wager. “Maternal and Fetal Outcomes if Gestational Impaired Glucose Tolerance is Not Treated.” Diabetes Care, July 2003; 26(7): 2107-2111.
Owens, Lisa A.; Eoin P. O'Sullivan; Breeda Kirwan; Gloria Avalos; Geraldine Gaffney; Fidelma Dunne, and for the ATLANTIC DIP Collaborators. “ATLANTIC DIP: The Impact of Obesity on Pregnancy Outcome in Glucose-Tolerant Women.” Diabetes care, March 2010, 33(3): 577-579.
Pacula, Rosalie Liccardo and Roland Sturm. “Mental Health Parity Legislation: Much Ado about Nothing?” Health Services Research, April 2000, 35(1 Pt 2):263-275.
Paneth, Nigel S., “The Problem of Low Birth Rate.” The Future of Children, Spring 1995, 5(1): 19-34.
Park, Christina H. “Prevalence of Employer Self-Insured Health Benefits: National and State Variation.” Medical Care Research and Review, 2000, 57(3): 340-60.
Pauly, Mark. “Overinsurance and Public Provision of Insurance: The Roles of Moral Hazard and Adverse Selection.” Quarterly Journal of Economics, 1974: 44-62
Pedersen JF, Mølsted-Pedersen L, Mortensen HB. “Fetal growth delay and maternal

32
hemoglobin A1c in early diabetic pregnancy.” Obstetrics Gynecology, 1984, 64: 351–352 Petrou, S.; T. Sach; and L. Davidson, “The Long-Term Costs of Preterm Birth and Low
Birth Weight: Results of a Systematic Review,” Child: Care, Health and Development, March 2001, 27(2): 97-115.
Pollitz, Karen; Eliza Bangit; Kevin Lucia; Mila Kofman; Kelly Montgomery, and Holly Whelan. “Falling through the Cracks: Stories of How Health Insurance Can Fail People with Diabetes.” Washington, D.C.: Georgetown University Health Policy Institute and the American Diabetes Association, 2005.
Remes ST; Patel SP; Hartikainen AL; Jarvelin MR; Pekkanen J. “High birth weight, asthma and atopy at the age of 16 years.” Pediatric Allergy and Immunology, 2008; 19(6):541-543
Richards Marcus; Hardy Rebecca; Kuh Diana; Wadsworth Michael EJ. “Birth weight and cognitive function in the British 1946 birth cohort: longitudinal population based study.” British Medical Journal, 2001,322: 199-203.
Rosenberg, Terry J.; Samantha Garbers; Heather Lipkind; and Mary Ann Chiasson. “Maternal Obesity and Diabetes as Risk Factors for Adverse Pregnancy Outcomes: Differences Among 4 Racial/Ethnic Groups.” American Journal of Public Health, September 2005, 95(9): 1545-1551.
Schaefer-Graf, Ute M.; Siri L. Kjos; ÖmerKilavuz; Andreas Plagemann; Martin Brauer; Joachim W. Dudenhausen; and Klaus Vetter. “Determinants of Fetal Growth at Different Periods of Pregnancies Complicated by Gestational Diabetes Mellitus or Impaired Glucose Tolerance,” Diabetes Care, January 2003, 26(1): 193-198.
Schmidt, Lucie. “Effects of infertility insurance mandates on fertility,” Journal of Health Economics, 2007, 26: 431-446.
Sin, Don D.; Sheldon Spier; Lary W. Svenson; Don P. Schopflocher; Ambikaipakan Senthilselvan; Robert L Cowie; S.F. Paul Man. “The Relationship Between Birth Weight and Childhood Asthma. A Population-Based Cohort Study.” Archives of Pediatrics & Adolescent Medicine. January 2004; 158(1): 60-64.
Sloan, Frank A., and Christopher J. Conover. Fall 1998. “Effects of State Reforms on Health Coverage of Adults,” Inquiry 35: 280-93.
Visser GH; Bedekam DJ; Mulder EJ et al. “Delayed emergence of fetal behavior in type-1 diabetic women.” Early Human Development, 1985, 12:167–172
Wong, Shell Fean; Fung Yee Chan; Jeremy J.N. Oats; David H. McIntyre. “Fetal Growth Spurt and Pregestational Diabetic Pregnancy,” Diabetes Care, October 2002, 25(10): 1681-1684.
Walker, Mary Beth, Erdal Tekin, and Sally Wallace. “Teen Smoking and Birth Outcomes,” Southern Economic Journal, 2009, 75(3): 892-907
Yogev Y, Langer O. Pregnancy outcome in obese and morbidly obese gestational diabetic women. Eur J Obstet Gynecol Reprod Biol. Mar 2008; 137(1): 21-6
Yuan, Wei; Basso Olga; Sorensen Henrik T. and Jorn Olsen. “Fetal growth and hospitalization with asthma during early childhood: a follow-up study in Denmark.” International Journal of Epidemiology 2002; 31(6):1240-1245
Zweifel, Peter and Willard G. Manning. “Moral hazard and consumer incentives in health care,” in A.J. Culyer $ J.P. Newhouse (ed.), Handbook of Health Economics, edition 1, vol. 1, ch. 8: 409-459.

33
Figure 1. The solid lines represent the prevalence of each outcome among infants born in the years preceding and following diabetes mandates adoption at time t. The long dash line represents the trend in outcomes determined by data 3 years before diabetes mandates became effective and up to and including the year prior to adoption. The short dash line is the trend in outcomes after the adoption determined by data starting the year of adoption and up to the third year following adoption.

34
Table 1: Diabetes Mandates Legislation State Effective Date LegislationAlaska July 27, 2000 ST §21.42.390Arizona January 1, 1999 A.R.S. §20-826(P), §20-934 Arkansas August 1, 1997 ST §23-79-603California January 1, 2000 HLTH & S §1367.51Colorado July 1, 1998 ST §10-16-104 (subsection 13) Connecticut October 1, 1997 §38a-492(d)Delaware September 29, 2000 18§3560District of Columbia October 21, 2000 DC CODE §31-3001Florida July 1, 1995 FL ST §627.65745Georgia July 1, 2002 §33-24-59.2Hawaii July 1, 2001 HI ST §432:1-612Illinois January 1, 1999 215 ILCS 5/356w - (H. 3427) Indiana January 1, 1998 IN ST 27-8-14.5-4Iowa July 1, 1999 IA ST §514C.18 Kansas January 1, 1999 KS ST § 40-2,163Kentucky July 15, 1998 KY ST §304.17A-148Louisiana January 1, 1998 LA R.S. 22:1034Maine July 4, 1996 ME ST T. 24 §2332-F: Maryland October 1, 1997 MD INSURANCE §15-822 Massachusetts August 2, 2000 MA ST 118E §10CMichigan March 28, 2001 MI ST 500.3406pMinnesota August 1, 1994 MN ST §62A.45 Mississippi January 1, 1999 MS ST § 83-9-46Missouri January 1, 1998 MS ST § 83-9-46Montana January 1, 2002 MT ST 33-22-129Nebraska October 1, 1999 NE ST § 44-790Nevada January 1, 1998 NV ST 689A.0427New Hampshire January 1, 1998 NH ST §415:6-eNew Jersey January 5, 1996 NJ ST 17:48-6nNew Mexico January 1, 1998 NM ST §59A-22-41New York January 1, 1994 NY INS §3216:North Carolina October 1, 1997 NC ST § 58-51-61:Oklahoma November 1, 1996 OK ST T. 36 §6060.2. Oregon January 1, 2002 OR ST §743.694.Pennsylvania February 13, 1999 40 P.S. §764e.Rhode Island January 1, 1997 RI ST §27-18-38South Carolina January 1, 2000 SC ST § 38-71-46. South Dakota July 1, 1999 SD ST §58-18-83Tennessee January 1, 1998 TN ST § 56-7-2605Texas January 1, 1998 TX INS §1358.001-TX INS §1358.005Utah July 1, 2000 UT ST §31A-22-626.Vermont October 1, 1997 VT ST T. 8 §4089c.Virginia July 1, 1999 VA ST §38.2-3418.8Washington January 1, 1998 WA ST 48.20.391West Virginia June 8, 1996 WV ST § 33-15C-1:Wisconsin April 7, 1988 WI Stat Ann §632.895[6] Wyoming July 1, 2001 WY ST §26-20-201

35
Table 2: Summary Statistics
All Mother Diabetic Non-Adopting
States Adopting
States t Non-Adopting
States Adopting
States t [1] [2] [3] [4] [5] [6]
HBW >4000g 12.003 11.551 -0.65 16.491 15.726 -0.29 (2.989) (2.828) (4.166) (3.573)
HBW >4500g 1.875 1.797 0.45 3.980 3.822 0.51 (0.748) (0.703) (1.966) (1.766)
LBW <2500g 6.125 6.485 0.75 7.563 8.196 -0.43 (2.379) (2.253) (3.535) (3.637)
LBW <1500g 1.150 1.256 0.90 1.179 1.322 -1.13 (0.780) (0.773) (1.405) (1.395)
Premature <37 weeks
9.548 10.071 0.19 14.407 15.224 -1.21 (2.867) (2.677) (4.813) (4.528)
Premature <32 weeks
1.487 1.585 1.17 1.667 1.868 -0.46 (0.975) (0.923) (1.668) (1.730)
Female 48.736 48.749 -0.18 47.924 48.295 0.92 (1.155) (1.043) (4.758) (4.291)
Plural 3.097 3.404 -0.33 4.249 4.665 -0.56 (1.081) (1.182) (2.759) (2.630)
First child 42.604 42.595 -0.21 39.930 39.472 -1.42 (14.843) (14.199) (14.529) (13.844)
Mother's Age 29.352 29.603 0.97 31.040 31.295 0.80 (4.880) (4.969) (4.848) (4.902)
Mother-Black 11.805 11.783 -0.06 12.751 13.509 0.39 (32.270) (32.3263) (33.362) (34.232)
Mother's Education
15.035 15.113 1.26 14.992 15.045 1.10 (0.537) (0.538) (0.424) (0.425)
Mother Married
84.979 83.957 -1.16 86.857 85.464 -1.32 (16.651) (17.088) (13.301) (13.833)
No Prenatal Care
0.548 0.473 -0.60 0.238 0.237 -0.64 (0.701) (0.526) (0.608) (0.526)
Log (wage) 2.576 2.638 0.74 2.570 2.638 0.91 (0.141) (0.153) (0.142) (0.153)
Physicians/ 1000 pop
2.283 2.494 1.25 2.280 2.554 1.50 (0.544) (0.571) (0.545) (0.591)
Hospitals/ 100,000 pop
2.475 2.240 -0.68 2.486 2.216 -0.93
(1.109) (0.972) (1.087) (0.941) All means are calculated for the sub-sample of infants born to mothers with more than 12 years of education. Columns 1, 2, 4, and 5 report averages of state-year observations with no non-economic damages caps. Columns 1 and 4 isolate the observations corresponding to states that did not adopt the caps in the following year. Columns 2 and 5 isolate the observations corresponding to states that adopted the caps in the following year. Standard errors clustered at state level are reported in parentheses. Columns 3 and 6 report t-test of equality of means conditional on time fixed effects. *significant at 10% significance level, ** significant at 5% significance level, *** significant at 1% significance level.

36
Table 3. The Impact of Diabetes Mandates on Infant Outcomes
Timing of Impact t t+1 t+2
High Birth-Weight >4000g 0.435* 0.323 0.223
(0.245) (0.238) (0.254)
>4500g 0.091 0.059 -0.063 (0.114) (0.113) (0.109)
Low Birth-Weight <2500g -0.128 -0.339** -0.260**
(0.119) (0.151) (0.129)
<1500g -0.008 -0.192** -0.073 (0.089) (0.080) (0.072)
Premature Birth <37 weeks -0.215 -0.335 -0.187
(0.275) (0.281) (0.245)
<32 weeks -0.042 -0.223** -0.134* (0.100) (0.099) (0.080)
5 minutes Apgar Score <8 -0.025 -0.088 -0.019
(0.140) (0.135) (0.117) The dependent variable is the incidence of high birth-weight, low birth-weight, prematurity, or a 5 minutes Apgar Score less than 8 among infants born to mothers from a demographic group defined by the race, age and diabetic status in a particular state and year. All regressions retain the sub-sample of infants born to mothers with more than 12 years of education. Due to missing values for the 5 minutes Apgar Score all regressions reported in the last row use 8968 observations. All other regressions run on 9352 observations from the period 1992-2003. All regressions control for mother’s education, marital status, and prenatal care (percent women starting prenatal care in 2nd trimester, 3rd trimester, or that did not receive prenatal care), infant gender, plurality, birth order (percent first child), age-race demographic group fixed effects that are allowed to vary over time. All regressions control for diabetic status of the mother, state fixed effects, year fixed effects, and all their interactions. Robust standard errors clustered at state level are reported in parentheses. * significant at 10% significance level; ** significant at 5% significance level, *** significant at 1% significance level

37
Table 4: The Impact of Diabetes Mandates on Infant Outcomes by Mother's Age-Race Demographic Group High Birth-Weight Low Birth-Weight Premature Birth Weight
Gain ≥35 >4000 g >4500 g <2500 g <1500 g <37 weeks <32 weeks
Panel A: WHITE Age <25 -0.501 0.261 0.194 -0.069 0.689 0.321 -0.004
(0.646) (0.417) (0.435) (0.184) (0.524) (0.273) (0.990)
25≥ Age >30 0.424 -0.235 -0.132 -0.185 -0.299 -0.315** -0.137 (0.384) (0.162) (0.208) (0.136) (0.375) (0.141) (0.463)
30≥ Age >35 0.264 0.308** -0.306 -0.164* -0.863** -0.404*** 0.041 (0.431) (0.141) (0.194) (0.090) (0.383) (0.110) (0.345)
Age ≥ 35 0.239 0.041 -0.303 -0.223*** 0.459 -0.165 0.397 (0.347) (0.219) (0.253) (0.082) (0.362) (0.130) (0.425)
Panel B: BLACK Age <25 1.645 0.352 0.406 0.534 0.426 0.410 1.073
(1.118) (0.621) (0.972) (0.419) (1.368) (0.478) (2.094)
25≥ Age >30 1.157 -1.287 -0.006 0.350 -2.194* 0.226 1.659 (0.886) (5.137) (0.675) (0.380) (1.166) (0.512) (1.311)
30≥ Age >35 0.005 -0.422 -1.516* -0.828* -0.321 -0.374 2.471** (0.669) (0.538) (0.821) (0.466) (0.769) (0.436) (1.215)
Age ≥ 35 -0.137 -0.692* -2.150** -1.053** -1.090 -1.227** 2.001* (0.906) (0.346) (0.915) (0.517) (1.283) (0.594) (1.019) Each cell reports estimates from a separate regression using individual level data. All regressions retain the sub-sample of infants born to mothers with more than 12 years of education. All regressions use data from the period 1992-2003. The number of observations varies across regressions from a low 298,593 births to Black women over 35 to a high 5,703,032 births to White women age 30-35. To improve readability all coefficients and standard errors were multiplied by 100. All regressions control for mother age, race, education, marital status, and prenatal care, infant gender, plurality, and birth order (dummy equal to 1 if first child and zero otherwise). All regressions control for diabetic status of the mother, state fixed effects, year fixed effects, and all their interactions. Robust standard errors clustered at state level are reported in parentheses. * significant at 10% significance level; ** significant at 5% significance level, *** significant at 1% significance level

38
Table 5. The Impact of Diabetes Mandates on Infant Outcomes – by Gender High Birth-Weight Low Birth-Weight Premature Birth
>4000 g >4500 g <2500 g <1500 g <37 weeks <32 weeks
Female 0.061 -0.056 -0.150 -0.216** -0.226 -0.256** (0.252) (0.116) (0.220) (0.098) (0.274) (0.115)
Male 0.463 0.150 -0.464** -0.154 -0.402 -0.167 (0.305) (0.168) (0.195) (0.095) (0.401) (0.110)
Each cell reports estimates from a separate regression using the 1992-2003 data on infants born to mothers with more than 12 years of education collapsed into state/year/mother’s age/mother’s race/mother’s diabetic status cells. Regressions reported in first row use 9142 observations, while regressions reported in second row use 9154 observations. All regressions control for mother’s education, marital status, and prenatal care, infant gender, plurality and birth order, age-race demographic group fixed effects that are allowed to vary over time. All regressions control for diabetic status of the mother, state fixed effects, year fixed effects, and all their interactions. Robust standard errors clustered at state level are reported in parentheses. ** significant at 5% significance level, *** significant at 1% significance level Table 6: The Impact of Diabetes Mandates on Infant Outcomes - Falsification Tests
High Birth-Weight Low Birth-Weight Premature Birth >4000 g >4500 g <2500 g <1500 g <37 weeks <32 weeks
Panel A. Mandates effect by mothers' education: DDD
Sample: ≤ 12 years of education
-0.047 0.039 0.079 -0.018 0.100 0.026 (0.296) (0.126) (0.187) (0.093) (0.237) (0.108)
Sample: ≥16 years of education
0.355 0.114 -0.580*** -0.323*** -0.450 -0.367***
(0.301) (0.153) (0.208) (0.118) (0.386) (0.136)
Panel B. Mandates effect by diabetic status: DD Diabetic 0.308 0.057 -0.368*** -0.225*** -0.389 -0.270***
(0.266) (0.116) (0.136) (0.079) (0.289) (0.091)
Non-diabetic 0.059 0.022 -0.043 -0.026* -0.040 -0.024 (0.075) (0.022) (0.037) (0.014) (0.062) (0.017)
Panel C. Mandates effect by type of diabetes: DDD DiabetesMandate 0.362 0.098 -0.304** -0.206** -0.328 -0.227**
(0.237) (0.116) (0.141) (0.078) (0.271) (0.100)
DiabetesMandate % Gestational Diabetes
-0.046*** -0.008*** 0.009** 0.004** -0.004 0.005**
(0.008) (0.003) (0.004) (0.002) (0.006) (0.002) Each cell reports estimates from a separate regression using the 1992-2003 data collapsed into state/year/mother’s age/mother’s race/mother’s diabetic status cells. The regressions in row 1 retain the sub-sample of infants born to mothers with 12 or fewer years of education, those in row 2 the sub-sample of infants born to mothers with 16 or more years of education, and those in rows 3-6 the sub-sample of infants born to mothers with more than 12 years of education. All regressions control for mother’s education, marital status, and prenatal care, infant gender, plurality and birth order, age-race demographic group fixed effects that are allowed to vary over time. All regressions control for diabetic status of the mother, state fixed effects, year fixed effects. In addition regressions in rows 1-3 and 6-7 include all two-way interactions between diabetic status, year fixed effects, and state fixed effects. Robust standard errors clustered at state level are reported in parentheses. * significant at 10% significance level; ** significant at 5% significance level, *** significant at 1% significance level

39
Table 7. The Impact of Diabetes Mandates by Likelihood of Treatment
Diabetes MandatePrivate
Insurance
Diabetes Mandate Small/Medium Firm
Employment
DiabetesMandateFully
Insured
DiabetesMandateMostly Fully
Insured Industry [1] [2] [3] [4]
High Birth-Weight >4000g -0.077*** -0.069* -0.151*** -0.071*
(0.025) (0.035) (0.041) (0.035)
>4500g -0.026* -0.035* -0.057** -0.037** (0.015) (0.020) (0.025) (0.017)
Low Birth-Weight <2500g -0.013 -0.014 -0.017 -0.009
(0.017) (0.025) (0.032) (0.025)
<1500g -0.008 -0.012 -0.011 -0.004 (0.010) (0.009) (0.017) (0.011)
Premature Birth <37 weeks -0.074*** -0.092** -0.164*** -0.068
(0.020) (0.045) (0.044) (0.052)
<32 weeks -0.002 -0.019 -0.002 -0.027**
(0.013) (0.012) (0.021) (0.013) Each cell reports estimates from a separate regression using the 1992-2003 data on infants born to mothers with more than 12 years of education collapsed into state/year/mother’s age/mother’s race/mother’s diabetic status cells. All regressions control for mother’s education, marital status, and prenatal care, infant gender, plurality and birth order, age-race demographic group fixed effects that are allowed to vary over time. All regressions control for diabetic status of the mother, state fixed effects, year fixed effects, and all their interactions. Robust standard errors clustered at state level are reported in parentheses. * significant at 10% significance level; ** significant at 5% significance level, *** significant at 1% significance level

40
Table 8. The Impact of Diabetes Mandates: Mandate to Provide Coverage versus Mandate to Offer Coverage
High Birth-Weight Low Birth-Weight Premature Birth >4000 g >4500 g <2500 g <1500 g <37 weeks <32 weeks
Mandate to:
Cover diabetes treatment
0.399* 0.093 -0.328** -0.184** -0.309 -0.218** (0.230) (0.112) (0.150) (0.080) (0.286) (0.100)
Offer coverage for diabetes treatment
-0.770 -0.435 -0.501 -0.307* -0.708** -0.289 (0.740) (0.293) (0.343) (0.155) (0.318) (0.205)
F-test of joint significance
2.34 1.70 2.63* 3.24** 2.48* 2.60*
F-test of equality of coefficients
2.47 3.19* 0.29 0.75 1.85 0.13
Each cell reports estimates from a separate regression using the 1992-2003 data on infants born to mothers with more than 12 years of education collapsed into state/year/mother’s age/mother’s race/mother’s diabetic status cells. All regressions control for mother’s education, marital status, and prenatal care (percent women starting prenatal care in 2nd trimester, 3rd trimester, or that did not receive prenatal care), infant gender, plurality, birth order (percent first child), age-race demographic group fixed effects that are allowed to vary over time. All regressions control for diabetic status of the mother, state fixed effects, year fixed effects, and all their interactions. Robust standard errors clustered at state level are reported in parentheses. * significant at 10% significance level; ** significant at 5% significance level, *** significant at 1% significance level
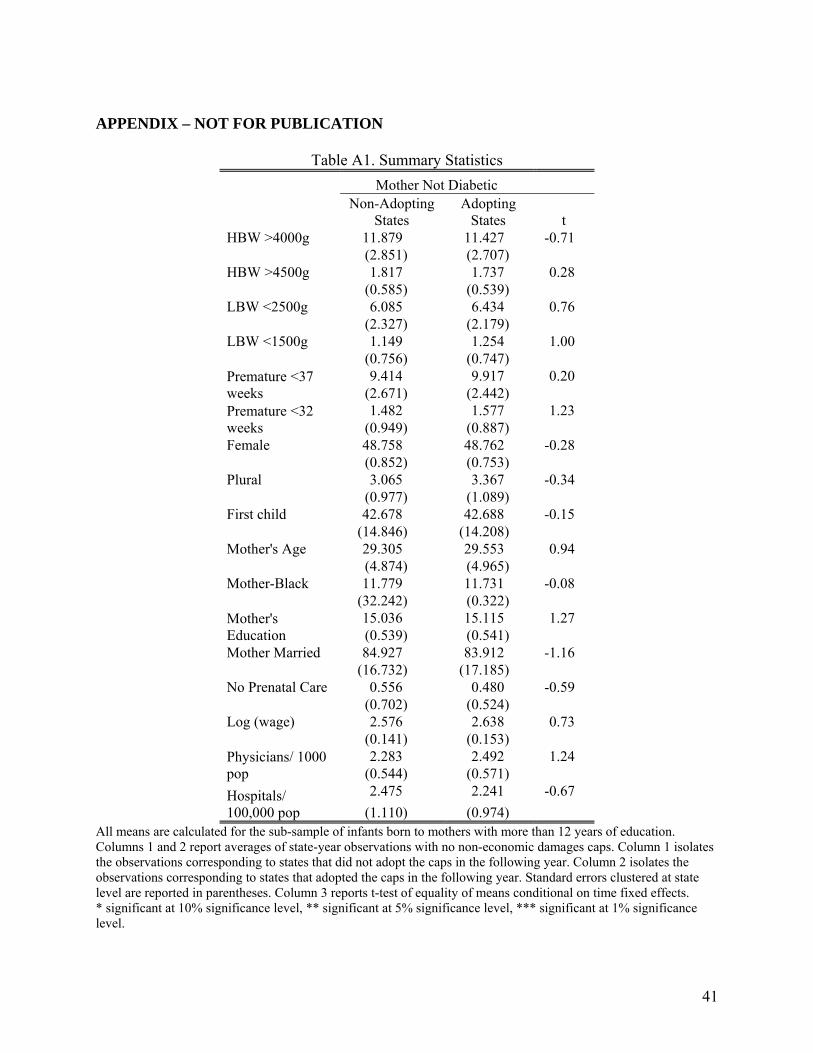
41
APPENDIX – NOT FOR PUBLICATION
Table A1. Summary Statistics
Mother Not Diabetic Non-Adopting
States Adopting
States t HBW >4000g 11.879 11.427 -0.71
(2.851) (2.707) HBW >4500g 1.817 1.737 0.28
(0.585) (0.539) LBW <2500g 6.085 6.434 0.76
(2.327) (2.179) LBW <1500g 1.149 1.254 1.00
(0.756) (0.747) Premature <37 weeks
9.414 9.917 0.20 (2.671) (2.442)
Premature <32 weeks
1.482 1.577 1.23 (0.949) (0.887)
Female 48.758 48.762 -0.28 (0.852) (0.753)
Plural 3.065 3.367 -0.34 (0.977) (1.089)
First child 42.678 42.688 -0.15 (14.846) (14.208)
Mother's Age 29.305 29.553 0.94 (4.874) (4.965)
Mother-Black 11.779 11.731 -0.08 (32.242) (0.322)
Mother's Education
15.036 15.115 1.27 (0.539) (0.541)
Mother Married 84.927 83.912 -1.16 (16.732) (17.185)
No Prenatal Care 0.556 0.480 -0.59 (0.702) (0.524)
Log (wage) 2.576 2.638 0.73 (0.141) (0.153)
Physicians/ 1000 pop
2.283 2.492 1.24 (0.544) (0.571)
Hospitals/ 100,000 pop
2.475 2.241 -0.67
(1.110) (0.974) All means are calculated for the sub-sample of infants born to mothers with more than 12 years of education. Columns 1 and 2 report averages of state-year observations with no non-economic damages caps. Column 1 isolates the observations corresponding to states that did not adopt the caps in the following year. Column 2 isolates the observations corresponding to states that adopted the caps in the following year. Standard errors clustered at state level are reported in parentheses. Column 3 reports t-test of equality of means conditional on time fixed effects. * significant at 10% significance level, ** significant at 5% significance level, *** significant at 1% significance level.

42
Table A2. The Impact of Diabetes Mandates on Infant Outcomes: Sub-Sample Mothers with 12
or Fewer Years of Education
Timing of Impact t t+1 t+2
High Birth-Weight >4000g -0.145 -0.048 0.032
(0.252) (0.296) (0.269)
>4500g 0.115 0.039 0.110 (0.086) (0.126) (0.137)
Low Birth-Weight
<2500g 0.137 0.079 0.185 (0.167) (0.188) (0.158)
<1500g -0.052 -0.018 0.007 (0.087) (0.093) (0.078)
Premature Birth <37 weeks 0.213 0.100 0.184
(0.280) (0.237) (0.207)
<32 weeks -0.001 0.026 0.039
(0.099) (0.108) (0.092) The dependent variable is the prevalence of high birth weight, low birth-weight or prematurity among infants born to mothers from a demographic group defined by the race, age and diabetic status in a particular state and year. All regressions retain the sub-sample of infants born to mothers with 12 or fewer years of education. All regressions run on 9314 observations from the period 1992-2003. All regressions control for mother’s education, marital status, and prenatal care (percent women starting prenatal care in 2nd trimester, 3rd trimester, or that did not receive prenatal care), infant gender, plurality and birth order (percent first child), age-race demographic group fixed effects that are allowed to vary over time. All regressions control for diabetic status of the mother, state fixed effects, year fixed effects, and all their interactions. Robust standard errors clustered at state level are reported in parentheses. * significant at 10% significance level; ** significant at 5% significance level, *** significant at 1% significance level

43
Table A3: The Impact of Diabetes Mandates on Infant Outcomes by Mother's Age-Race Demographic Group: Data collapsed by state/year/demographic group cells
High Birth Weight Low Birth Weight Premature Birth Weight Gain≥35 >4000 g >4500 g <2500 g <1500 g <37 weeks <32 weeks
Panel A: WHITE
All ages 0.271 0.092 -0.213 -0.162** -0.240 -0.206** -0.056
(0.263) (0.123) (0.134) (0.076) (0.278) (0.090) (0.321)
Age <25 -0.951 0.002 0.109 0.070 0.429 0.328 -0.732
(1.025) (0.605) (0.523) (0.298) (0.882) (0.414) (1.421)
25≥ Age >30 0.321 -0.243 -0.353 -0.172 -0.418 -0.276 -0.382
(0.550) (0.258) (0.289) (0.212) (0.547) (0.219) (0.726)
30≥ Age >35 0.243 0.355 -0.143 -0.155 -0.789 -0.313* -0.095
(0.616) (0.216) (0.289) (0.133) (0.509) (0.157) (0.470)
Age ≥ 35 0.407 0.069 -0.215 -0.219 0.388 -0.157 0.528
(0.534) (0.297) (0.348) (0.132) (0.522) (0.196) (0.671)
Panel B: BLACK
All ages 0.374 -0.213 -1.024** -0.358 -0.951 -0.320 1.450**
(0.458) (0.326) (0.472) (0.250) (0.582) (0.293) (0.577)
Age <25 1.224 0.111 0.462 0.252 0.649 -0.008 0.294
(1.667) (0.907) (1.688) (0.696) (2.220) (0.734) (3.196)
25≥ Age >30 0.706 0.016 -0.045 0.226 -1.477 0.118 0.666
(1.357) 0.871 (1.027) (0.552) (1.742) (0.794) (1.790)
30≥ Age >35 0.281 -0.286 -1.650 -0.682 -0.530 -0.383 2.157
(0.947) (0.859) (1.248) (0.646) (1.123) (0.710) (1.648)
Age ≥ 35 -0.013 -0.470 -2.326* -0.962 -1.902 -1.086 2.127
(1.350) (0.547) (1.280) (0.743) (1.810) (0.865) (1.659) Each cell reports estimates from a separate regression. The dependent variable is the prevalence of high birth weight, low birth weight, prematurity or mother pregnancy weight gain above 35 pounds among infants born to mothers from a demographic group defined by the race, age and diabetic status in a particular state and year. All regressions retain the sub-sample of infants born to mothers with more than 12 years of education. All regressions use data from the period 1992-2003. All regressions control for mother’s education, marital status, and prenatal care (percent women starting prenatal care in 2nd trimester, 3rd trimester, or that did not receive prenatal care), infant gender, plurality and birth order (percent first child), age-race demographic group fixed effects that are allowed to vary over time. All regressions control for diabetic status of the mother, state fixed effects, year fixed effects, and all their interactions. Robust standard errors clustered at state level are reported in parentheses. * significant at 10% significance level; ** significant at 5% significance level, *** significant at 1% significance level.

44
Table A4: The Impact of Diabetes Mandates on Singleton Birth Outcomes by Mother's Age-Race Demographic Group
High Birth Weight Low Birth Weight Premature Birth Weight
Gain ≥35 >4000 g >4500 g <2500 g <1500 g <37
weeks <32
weeks
Panel A: WHITE
Age <25 -0.503 0.263 0.449 0.158 0.470 0.281 -0.230
(0.657) (0.424) (0.408) (0.150) (0.536) (0.194) (1.081)
25≥ Age >30 0.446 -0.236 0.022 -0.083 -0.092 -0.122 0.008
(0.401) (0.168) (0.196) (0.103) (0.401) (0.100) (0.473)
30≥ Age >35 0.278 0.326 -0.227 0.060 -0.690** -0.153** 0.091
(0.460) (0.150) (0.129) (0.060) (0.327) (0.072) (0.377)
Age ≥ 35 0.231 0.042 -0.060 0.146** 0.568 0.102 0.615
(0.374) (0.237) (0.230) (0.068) (0.341) (0.091) (0.396)
Panel B: BLACK
Age <25 1.629 0.328 0.187 0.273 0.894 -0.095 1.604
(1.179) (0.637) (0.903) (0.342) (1.265) (0.447) (2.043)
25≥ Age >30 1.241 -0.140 -0.253 0.065 -2.404** -0.112 1.575
(0.936) (0.536) (0.740) (0.337) (1.152) (0.464) (1.300)
30≥ Age >35 0.089 -0.444 -0.996 -0.396 -0.108 -0.185 2.343*
(0.688) (0.570) (0.800) (0.378) (0.765) (0.401) (1.231)
Age ≥ 35 -0.223 -0.723** -1.760** -0.714 -0.813 -1.008** 1.452
(0.920) (0.361) (0.878) (0.473) (1.276) (0.438) (1.039) Each cell reports estimates from a separate regression using individual level data. All regressions retain the sub-sample of singleton births to mothers with more than 12 years of education. All regressions use data from the period 1992-2003. To improve readability all coefficients and standard errors were multiplied by 100. All regressions control for mother age, race, education, marital status, and prenatal care, infant gender, plurality, and birth order (dummy equal to 1 if first child and zero otherwise). All regressions control for diabetic status of the mother, state fixed effects, year fixed effects, and all their interactions. Robust standard errors clustered at state level are reported in parentheses. * significant at 10% significance level; ** significant at 5% significance level, *** significant at 1% significance level

45
Table A5: Effect of Diabetes Mandates by Likelihood of Treatment: Proportion of Population with Individually Purchased Private Health Insurance
DiabetesMandateIndividually purchased private insurance
High Birth-Weight >4000g 0.031
(0.046)
>4500g 0.001 (0.019)
Low Birth-Weight <2500g -0.031
(0.023)
<1500g 0.010 (0.013)
Premature Birth <37 weeks -0.015
(0.052)
<32 weeks -0.009
(0.019) Each estimate comes from a different regression. The dependent variable is either the prevalence of high birth weight, low birth weight, or prematurity among infants born to mothers from a demographic group defined by the race, age and diabetic status in a particular state and year. All regressions retain the sub-sample of infants born to mothers with more than 12 years of education. All regressions run on data from the period 1992-2003. All regressions control for mother’s education, marital status, and prenatal care (percent women starting prenatal care in 2nd trimester, 3rd trimester, or that did not receive prenatal care), infant gender, plurality and birth order (percent first child), age-race demographic group fixed effects that are allowed to vary over time. All regressions control for diabetic status of the mother, state fixed effects, year fixed effects, and all their interactions. Robust standard errors clustered at state level are reported in parentheses. * significant at 10% significance level; ** significant at 5% significance level, *** significant at 1% significance level

46
Table A6. The Effect of Diabetes Mandate: Time since Implementation
High Birth Weight Low Birth Weight Premature Birth
>4000 g >4500 g <2500 g <1500 g <37
weeks <32
weeks
Diabetes Mandate
0.104 0.081 -0.286* -0.168** -0.520* -0.205* (0.250) (0.118) (0.160) (0.078) (0.278) (0.106)
Diabetes Time since Mandate
0.061 -0.001 -0.050 -0.034 0.111 -0.026 (0.041) (0.023) (0.053) (0.022) (0.087) (0.028)
Each estimate comes from a different regression. The dependent variable is either the prevalence of high birth-weight, low birth-weight, or prematurity among infants born to mothers from a demographic group defined by the race, age and diabetic status in a particular state and year. The variable “Time since Mandate” is equal to 1 in the year following the effective date of the mandate, 2 in the second year following the mandate adoption, 3 in the third, etc, and 0 in all state-years with no mandate (the effective date is also coded 0 because of the lag effect of the mandate). All regressions retain the sub-sample of infants born to mothers with more than 12 years of education. All regressions run on data from the period 1992-2003. All regressions control for mother’s education, marital status, and prenatal care (percent women starting prenatal care in 2nd trimester, 3rd trimester, or that did not receive prenatal care), infant gender, plurality and birth order (percent first child), age-race demographic group fixed effects that are allowed to vary over time. All regressions control for diabetic status of the mother, state fixed effects, year fixed effects, and all their interactions. Robust standard errors clustered at state level are reported in parentheses. * significant at 10% significance level; ** significant at 5% significance level, *** significant at 1% significance level

47
Table A7. Robustness Checks
High Birth-Weight Low Birth-Weight Premature Birth >4000 g >4500 g <2500 g <1500 g <37 weeks <32 weeks
[1] Main 0.323 0.059 -0.339** -0.192** -0.335 -0.223** (0.238) (0.113) (0.151) (0.080) (0.281) (0.099)
[2] Log Dependent Variable
0.018 0.011 -0.033* -0.073** -0.020 -0.073** (0.014) (0.026) (0.017) (0.030) (0.016) (0.033)
[3] Different Law Coding
0.356 0.078 -0.322** -0.183** -0.304 -0.203* (0.247) (0.116) (0.144) (0.087) (0.295) (0.107)
[4] Enactment, t+2 0.363 0.062 -0.288* -0.178** -0.348 -0.207** (0.237) (0.115) (0.146) (0.080) (0.283) (0.100)
[5] Adopting states only
0.176 0.025 -0.286* -0.135** -0.176 -0.185* (0.218) (0.117) (0.164) (0.065) (0.299) (0.100)
[6] Lead 1 0.488* 0.193* -0.076 -0.038 -0.164 0.000 (0.249) (0.112) (0.121) (0.092) (0.255) (0.095)
[7] Lead 2 0.159 0.001 0.013 -0.091 -0.287 -0.020 (0.264) (0.122) (0.136) (0.091) (0.228) (0.083)
[8] Lead 1 enactment
0.163 0.023 0.049 -0.077 -0.296 -0.009 (0.269) (0.124) (0.137) (0.093) (0.232) (0.085)
[9] 1995-2001 0.202 -0.034 -0.365* -0.271*** -0.091 -0.253** (0.250) (0.147) (0.187) (0.080) (0.292) (0.121)
[10] 1991-2004 0.307 0.024 -0.301** -0.193** -0.315 -0.206** (0.251) (0.115) (0.141) (0.075) (0.289) (0.083)
The dependent variable is the prevalence of high birth weight, low birth weight or prematurity among infants born to mothers from a demographic group defined by the race, age and diabetic status in a particular state and year. All regressions retain the sub-sample of infants born to mothers with more than 12 years of education. Unless otherwise specified these regressions use data from the period 1992-2003. All regressions control for mother’s education, marital status, and prenatal care (percent women starting prenatal care in 2nd trimester, 3rd trimester, or that did not receive prenatal care), infant gender, plurality and birth order (percent first child), age-race demographic group fixed effects that are allowed to vary over time. All regressions control for diabetic status of the mother, state fixed effects, year fixed effects, and all their interactions. Robust standard errors clustered at state level are reported in parentheses. * significant at 10% significance level; ** significant at 5% significance level, *** significant at 1% significance level