diabetes in pregnancy: are we providing the best … in... · diabetes in pregnancy: are we...
TRANSCRIPT

England, Wales and Northern Ireland
Diabetes in pregnancy: are we providing the best care?
Confidential Enquiry into Maternal and Child Health
Findings of a national enquiry
February 2007

Our aim is to improve the health of mothers, babies and children by carrying out confi dential enquiries on a nationwide basis and by widely disseminating our fi ndings and recommendations.
Please cite this work as: Confi dential Enquiry into Maternal and Child Health. Diabetes in Pregnancy: Are we providing the best care? Findings of a National Enquiry: England, Walesand Northern Ireland. CEMACH: London; 2007.
This work was funded by the National Institute for Clinical Excellence up to 31 March 2005, by the National Patient Safety Agency from 1 April 2005 and by the Department of Health, Social Services and Public Safety of Northern Ireland. The views expressed within this publication are those of the Confi dential Enquiry into Maternal and Child Health and not necessarily those of its funding bodies.
The recommendations contained in this report represent the view of CEMACH, which was arrived at after a careful consideration of the available evidence. It does not override healthcare professionals’ individual responsibility to make appropriate decisions in the circumstances of the individual patient, in consultation with the patient and/or guardian or carer.
Published February 2007 by CEMACH
CEMACH, Chiltern Court, 188 Baker Street, London, NW1 5SD Tel: 0207 486 1191 Fax: 0207 486 6543 Email: [email protected] Website: www.cemach.org.uk
Designed and produced by Interface. Bristol Tel 0117 923 2235.
ISBN: 978-0-9533536-3-7
CEMACH Mission statement

iii
Contents
Acknowledgements ...........................................................................iv
Glossary and abbreviations ...............................................................vi
Foreword ...........................................................................................xi
Preface .............................................................................................xii
1. Introduction .................................................................................... 1
2. Key fi ndings of the CEMACH Diabetes Programme ..................... 3
3. Summary of recommendations ..................................................... 7
4. Methodology ................................................................................ 10
5. A description of women and babies in the enquiry ...................... 18
6. Factors associated with poor pregnancy outcome in women with type 1 and type 2 diabetes .................................. 25
7. Social and lifestyle issues ........................................................... 32
8. Clinical care issues: preconception ............................................. 41
9. Clinical care issues: pregnancy ................................................... 50
10. Clinical governance ................................................................... 64
11. A comparison of type 1 and type 2 diabetes .............................. 72
12. Neonatal care of term babies .................................................... 82
13. Conclusions ............................................................................... 96
Appendices ...................................................................................... 98

iv
CEMACH acknowledges with grateful thanks the contribution made by Dr Mary Macintosh, Medical Director of CEMACH until 30th April 2006, to the Diabetes Programme since its inception in 2001.
Editor
Jo Modder, Clinical Director (Obstetrics)
Authors
• Jo Modder, Clinical Director (Obstetrics) • Kate Fleming, Senior Data Analyst (until 8th November 2006) • Dominique Acolet, Clinical Director (Neonatology) – Chapter 12
External commentators
• Kirsty Samuel, Lay Panel Assessor, Yorkshire & Humberside Region • Sue Roberts, National Clinical Director for Diabetes • Stephen Walkinshaw, Chair, CEMACH Diabetes Professional Advisory Group • John Scarpello, Deputy Medical Director, National Patient Safety Agency • Robert Fraser, Chair, NICE Diabetes in Pregnancy Guideline Development Group • Patricia Hamilton, President, Royal College of Paediatrics and Child Health
Acknowledgements
Thanks are due to all maternity unit co-ordinators, clinicians and staff who have contributed their time and expertise and without whom this report would not have been possible.
In particular, thanks are due to:
• All Panel Assessors for their extensive and detailed review of medical records during panel enquiries and the signifi cant amount of time contributed to panel meetings.
• All Panel Chairs; for chairing panel enquiries in their region, supporting the CEMACH Regional Managers, and contributing to the recommendations of this report.
• All CEMACH Regional Managers and Assistants for liaising with local clinicians, managing the data collection process, preparing medical records for review and organising panel enquiry meetings.
• Pat Doyle, Head of Department of Epidemiology, London School of Hygiene and Tropical Medicine, for her advice on the statistical analysis of this report.
• Tim Clayton, Medical Statistics Unit, London School of Hygiene and Tropical Medicine, for independent statistical review of this report.
• Gillian Hawthorne, Consultant Diabetes Physician, Newcastle Diabetes Centre, for her contribution to the analysis of enquiry panels’ free text comments.
• Oliver Rackham, Consulant Paediatrician, Arrowe Park Hospital, for his contribution to the analysis of cause of death of stillbirths and neonatal deaths.
• Chris Wright, Consultant Paediatric Pathologist, Royal Victoria Infi rmary, for his advice regarding the data on post mortem examination.
Acknowledgements

v
• Members of the CEMACH Diabetes Professional Advisory Group (chaired by Stephen Walkinshaw) for their support during the Diabetes Programme, and in particular, their advice on the development of data tools and processes of the enquiry, the content of this report and their contribution to the recommendations contained within this report.
• Members of the Neonatal Enquiry Steering Group for their contribution to the development of the Neonatal Enquiry, the content of the neonatal chapter, and their contribution to the neonatal recommendations.
• Peer reviewers of the report (Appendix F). • Rosie Houston, Assistant Projects Manager, for managing the publication of this report. • Naufi l Alam, Data Analyst; Alison Miller, Programme Director and Midwifery Lead; Shona Golightly,
Director of Research and Development; Richard Congdon, CEMACH Chief Executive; and all other staff at CEMACH Central Offi ce for their support and advice during the development of this report.

vi
Glossary and abbreviations
AC Abdominal circumferenceACE inhibitor Angiotensin-converting enzyme inhibitor; a class of drugs that reduce peripheral arterial
resistance by inactivating an enzyme that converts angiotensin I to the vasoconstrictor angiotensin II.
Albuminuria The presence of albumin in the urine, indicating renal dysfunctionAntenatal The period of time in pregnancy preceding birth
Antepartum stillbirth Death of a baby before the onset of labourAudit An examination or review that establishes the extent to which a condition, process,
or performance conforms to predetermined standards or criteria Autolysis Spontaneous disintegration of cells or tissues by autologous enzymes, as occurs after
deathBlack, Asian and Other
minority ethnic group Term encompassing Black, Asian, Chinese and other ethnic groups as distinct from White ethnic origin
BM A blood glucose testing strip originally made by the pharmaceutical company Boehringer Mannheim (now Roche). ‘BM’ is often used to describe any non-laboratory blood glucose test.
BMI Body Mass IndexBody Mass Index The body’s weight in kilograms divided by the square of the height in metres,
used in the assessment of obesityCaesarean section Surgical abdominal delivery of the baby
Caesarean section rate The percentage of births that are by caesarean sectionCardiomegaly Enlargement of the heart
Cardiotocograph Graphical representation of electronic monitoring of the fetal heart rate and of uterine contractions. The fetal heart rate is recorded by means of either an external ultrasonic abdominal transducer or a fetal scalp electrode. Uterine contractions are recorded by means of an abdominal pressure transducer.
Case-control study A study that compares exposure in subjects who have a particular outcome with those who do not
CEMACH Confi dential Enquiry into Maternal and Child HealthCentile Any of the 99 numbered points that divide an ordered set of scores into 100 parts
each of which contains one-hundredth of the totalChildbearing age Defi ned as 15 to 44 years
CNST Clinical Negligence Scheme for TrustsConfi dence interval A range of values for which there is a 95% chance that it includes the true value.
Confounder A factor that can bring an alternative explanation to an association observed between an exposure and the outcome of interest
Congenital anomaly A physical or biochemical malformation which is present at birthCTG Cardiotocograph
Early neonatal death Death of a live born baby occurring less than 7 completed days from the time of birth Diabetic ketoacidosis A state of absolute or relative insulin defi ciency characterised by hyperglycaemia,
dehydration, acidosis and ketosisDiabetic nephropathy Kidney dysfunction or disease occurring as a result of diabetes
Diabetic retinopathy A complication of diabetes affecting the blood vessels in the retina at the back of the eye, which can affect vision. There may be bleeding from retinal vessels (non-proliferative retinopathy) or the development of new abnormal vessels (proliferative retinopathy).
DKA Diabetic ketoacidosis

vii
Erb’s palsy Injury to the nerve roots of the brachial plexus of an arm mainly related to birth trauma and leading to various degrees of weakness of the affected arm which may resolve during the fi rst year of life
EUROCAT European Surveillance of Congenital AnomaliesFetal growth restriction Evidence of abnormally slow growth of the fetus within the uterus; either estimated
weight or abdominal circumference below the 10 th percentile, or slowing growth velocity of the abdominal circumference as measured at a subsequent ultrasound scan.
Fetal surveillance The process of performing fetal well being tests (these may include ultrasound scans, fetal and placental Dopplers, biophysical profi les and fetal heart monitoring)
Folic acid A water-soluble vitamin in the B-complex group which helps to prevent fetal neural tube defect when commenced by the mother before conception
Gestation The time from conception to birth. The duration of gestation is measured from the fi rst day of the last normal menstrual period
Gestational diabetes Carbohydrate intolerance of varying severity which is diagnosed in pregnancy and resolves after pregnancy
Glucose electrode Blood glucose measurement using electrochemical biosensorsGlycaemic control
targets Recommended levels of blood glucose
Glycaemic control test A test that assesses how well blood glucose levels have been controlled over a period of time
Glycosylated haemoglobin
A test which measures the amount of glucose-bound haemoglobin and refl ects how well the blood glucose level has been controlled over the previous 2 – 3 months
HbA1c Glycosylated haemoglobinHigh dependency care Criteria for receipt of high-dependency care are:
• Receiving NCPAP for any part of the day but not fulfi lling any of the criteria for intensive care • Below 1000g current weight and not fulfi lling any of the criteria for intensive care • Receiving parenteral nutrition • Having convulsions • Receiving oxygen therapy and below 1500g current weight • Requiring treatment for neonatal abstinence syndrome • Requiring specifi c procedures that do not fulfi l any criteria for intensive care: • Care of intra-arterial catheter or chest drain • Partial exchange transfusion • Tracheostomy care until supervised by a parent • Requiring frequent stimulation for severe apnoea.(British Association of Perinatal Medicine, 2001)
Home blood glucose monitoring (HBGM)
Self-monitoring by the patient of blood glucose levels on a regular basis outside the hospital setting, using a blood glucose meter
Hyperplasia An abnormal increase in the number of normal cells in normal arrangement in an organ or tissue, which increases its volume
Hypertension High blood pressureHypoglycaemia Low blood glucose level
Hypothermia Abnormally low body temperatureHypothyroidism Defi ciency of thyroid gland activity which leads to insuffi cient production
of thyroid hormonesInduction of labour The process of attempting to start labour (see spontaneous labour).
A combination of pharmacological and physical methods may be used

viii
Infant formula An industrially produced milk product based on cow or soy milk, which aims to duplicate the nutrient content of natural human breast milk
Intensive care Criteria for receipt of intensive care are: • Receiving any respiratory support via a tracheal tube and in the fi rst 24 hours after its withdrawal • Receiving NCPAP for any part of the day and less than 5 days old • Below 1000g current weight and receiving NCPAP for any part of the day and for 24 hours after withdrawal • Less than 29 weeks of gestational age and less than 48 hours old • Requiring major emergency surgery, for the preoperative period and postoperatively for 24 hours • Requiring complex clinical procedures: • Full exchange transfusion • Peritoneal dialysis • Infusion of inotrope, pulmonary vasodilator or prostaglandin and for 24 hours afterwards. • Any other very unstable baby considered by the nurse-in-charge to need one-to-one nursing • A baby on the day of death.(British Association of Perinatal Medicine, 2001)
Interquartile range (IQR) The spread of a set of values between which 25% (25th centile) and 75% (75th centile) of these values lie
Intrauterine death Death of the fetus within the uterus before deliveryIUD Intrauterine death
Late fetal loss A death occurring between 20 weeks + 0 days and 23 weeks + 6 daysLate neonatal death Death of a live born baby occurring from 7 completed days from the time of birth
and before 28 completed days after birth.Legal abortion In England and Wales, term used to describe the deliberate ending of a pregnancy,
under the provisions of the current law (1967/92 Act of Parliament), with the intention that the fetus will not survive
Macrosomia Oversized baby as seen for example as a consequence of the effect of diabetes during pregnancy. Defi ned as having a birth weight above the 90th centile for gestation or a birth weight of 4000g or more.
Median The value of the middle item of a series when the items are arranged in numerical orderMetformin An oral antidiabetic agent that decreases glucose production by the liver and lowers
plasma glucose levelsMicroalbuminuria A very small increase in urinary albumin
Miscarriage Spontaneous ending of a pregnancy before viability (currently taken as 24 weeks of gestation)
MODY Maturity onset diabetes of the young. A group of autosomal dominant disorders in young people each caused by a single gene defect, associated with decreased insulin production and varying degrees of clinical severity
Multidisciplinary clinic A clinic with access to care from health professionals in more than one discipline. For diabetes, the disciplines recommended are obstetrics, diabetology, nursing, midwifery and dietetics.
Multiparous A woman who has had at least one previous birth (from 24 weeks onwards)Multiple birth Birth of more than one baby from a pregnancy
Neonatal death Death of a live born baby before 28 completed days after birth
Glossary and abbreviations

ix
Neonatal unit A unit which provides additional care for babies over and above that which can be offered on a postnatal ward or transitional care unit. There are different levels of complexity of care which can be offered by an individual neonatal unit
Neural tube defect A major birth defect caused by abnormal development of the neural tube, the structure present during embryonic life which later gives rise to the central nervous system (brain and spinal cord)
NHSLA National Health Service Litigation AuthorityNICE National Institute for Health and Clinical ExcellenceNSF National Service Framework
Obesity Increased body weight, defi ned as a Body Mass Index of 30 or greaterOdds ratio A measure of the excess risk or degree of protection given by exposure to a certain
factor. An odds ratio of greater than 1 shows an increased risk and less than 1 shows a protective effect
Offspring Term encompassing live births, in utero losses after 20 completed weeks of gestation and terminations of pregnancy for congenital anomaly
Parity The number of viable infants that a woman has delivered. Viability is currently accepted from 24 weeks of gestation onwards
Perinatal mortality rate The number of stillbirths and early neonatal deaths per 1000 live and stillbirthsPlacental insuffi ciency Impairment of placental blood fl ow leading to impaired fetal growth and nutrition
Post-mortem examination
Examination of the body after death to determine cause of death
Postnatal The period of time occurring after birthPreconception care Counselling and clinical management strategies before conception to ensure that
women are well prepared for pregnancy. For women with diabetes, this includes ensuring near-normal glycaemic control before conception, commencing high dose folic acid, reviewing medication, screening for diabetes complications, and giving information about pregnancy risks, appropriate diet and lifestyle.
Preterm delivery Delivery before 37+0 weeks’ gestationPreterm delivery rate Percentage of all deliveries that occur before 37 + 0 weeks’ gestation
Prevalence The proportion of individuals in a population having a diseasePrimary care The health services that play a central role in the local community, such as general
practitioners, health visitors, pharmacists, dentists and midwivesPrimigravida A woman who is in her fi rst pregnancy
QDS Quarter die sumendum (Latin) meaning four times a dayQuintile The portion of a frequency distribution containing one fi fth of the total sample
Range The difference or interval between the smallest and largest values in a frequency distribution
Retinal assessment Examining the fundi through pupils which have been dilated with eye dropsSecondary care Services provided by medical specialists who generally do not have fi rst contact
with patientsSevere hypoglycaemia Hypoglycaemia requiring help from another person
Shoulder dystocia Any documented evidence of diffi culty with delivering the shoulders after delivery of the baby’s head
Singleton One fetus or babySliding scale Intravenous insulin and dextrose infusions with a set of instructions for adjusting
the dose of insulin on the basis of blood glucose test results

x
Stillbirth Legal defi nition: a child that has issued forth from its mother after the 24th week of pregnancy and which did not at any time after being completely expelled from its mother breathe or show any other signs of life (Section 41 of the Births and Deaths Registration Act 1953 as amended by the Stillbirth Defi nition Act 1992)
Stillbirth rate The number of stillbirths per 1000 total births (live births and stillbirths)Termination of
pregnancy See Legal abortion
Thrombosis The formation or presence of a clot of coagulated blood in a blood vesselThyroxine An iodine-containing hormone produced by the thyroid gland
Transitional care unit A unit providing care of term or near-term babies not needed high-dependency or intensive care, which can be safely delivered without babies being separated from their mothers
Trimester One of the 3-month periods into which pregnancy is divided. The fi rst trimester is 0-13 weeks of gestation, the second trimester is 14-26 weeks of gestation, and the third trimester is 27 weeks of gestation until birth.
Type 1 diabetes There is an absolute defi ciency of insulin production, due to autoimmune destruction of the insulin-producing beta cells in the islets of Langerhans in the pancreas. It accounts for 5 – 15% of all people with diabetes.
Type 2 diabetes There is a relative defi ciency of insulin production, and/or the insulin produced is not effective (insulin resistance). It accounts for 85% - 95% of all people with diabetes.
UK United KingdomUSS Ultrasound scan
Glossary and abbreviations

xi
This third and fi nal report of the CEMACH national diabetes programme comes at an important time in the national drive to improve services for women with diabetes in pregnancy. The National Service Framework (NSF) for Diabetes requires the NHS to develop, implement and monitor policies that seek to empower and support women with diabetes to optimise the outcomes of their pregnancy. The CEMACH report shows that, whilst progress has been made in improving services for women with diabetes and their babies, there is much still to be done to meet the standards recommended by the NSF. Too many women continue to be poorly prepared for pregnancy in the critical areas of glycaemic control and folic acid supplementation. The report underlines the need for an increased focus on diabetes preconception care services and the development of strategies to educate women with diabetes of childbearing age. The growing proportion of women with type 2 diabetes during pregnancy, many of whom are from minority ethnic groups, presents an additional challenge for health services in developing responsive and accessible services.
This CEMACH report has identifi ed several areas of good clinical practice during pregnancy in women with pre-existing diabetes. However, there continue to be areas where there is room for improvement, including antenatal fetal surveillance, glycaemic control during labour and delivery and postnatal diabetes care. The National Institute for Health and Clinical Excellence (NICE) is currently in the fi nal stages of development of its new guideline for the management of diabetes in pregnancy. This guideline, when taken together with the CEMACH report, will provide local health services with an unprecedented wealth of material on which to base their development of improved services for women with diabetes in pregnancy.
Sir Liam DonaldsonChief Medical Offi cerDepartment of Health, England
Foreword

xii
The Confi dential Enquiry into Maternal and Child Health (CEMACH) is a unique study into diabetes and pregnancy which gives us a much needed insight into the issues surrounding this important time of a woman’s life. Previous modules of CEMACH’s diabetes programme have highlighted the increased risk of stillbirth, perinatal mortality and congenital anomaly for babies of women with diabetes. They also showed that women were often poorly prepared for pregnancy and that the care they received within the NHS was not always appropriate.
Now, the fi nal enquiry module, which includes an audit of standards of care, has revealed a worrying lack of emphasis on care prior to pregnancy. The fi nal report draws together a wealth of information and shows us the way forward by giving clear recommendations that will help improve the chances of women with diabetes to have a successful pregnancy.
It is crucial that women with diabetes are made fully aware of the risks they face before they become pregnant. Those looking after them then need to ensure that all the right steps are being taken to allow women to effectively reduce those risks. The fact that currently many women with diabetes enter pregnancy with poor glycaemic control is of great concern. Better care provision prior to pregnancy should help address the issue. The report also shows that social deprivation in women with diabetes is associated with poor pregnancy outcome. We now need to make sure that services are better targeted to reach the most vulnerable members of our communities.
At a time when the prevalence of both type 1 and type 2 diabetes in the UK is increasing rapidly, Diabetes UK believes that the recommendations made in the Confi dential Enquiry into Maternal and Child Health’s fi nal diabetes in pregnancy report, need to be taken forward by health service professionals and commissioners alike.
Positive changes are needed to make sure that pregnancy and childbirth remain a time of hope and joy for women with diabetes.
Douglas SmallwoodChief ExecutiveDiabetes UK
Preface

1
This is the fi nal report of the Confi dential Enquiry into Maternal and Child Health (CEMACH) Diabetes Programme, which commenced in 2002. The programme has focused on pregnancy in women with type 1 and type 2 diabetes (with gestational diabetes excluded) and has included 3 modules:
1. A survey of diabetes maternity services for women with type 1 and type 2 diabetes in England, Wales and Northern Ireland.1
2. A descriptive study of 3808 pregnancies to women with type 1 and type 2 diabetes in England, Wales and Northern Ireland who were identifi ed at any time between booking and delivery from 1 March 2002 to 28 February 2003, with follow up to pregnancy outcome at 28 days after delivery.2
3. A national confi dential enquiry reviewing demographic, social and lifestyle factors, and clinical care in 442 pregnancies to women with type 1 and type 2 diabetes, and their association with pregnancy outcomes. The results of this last module are included within this report.
1.1 Context of the CEMACH Diabetes Programme
The topic of diabetes and pregnancy was chosen by CEMACH for a number of reasons:
• Diabetes is a common medical disorder complicating pregnancy, affecting 1 in 250 women in England, Wales and Northern Ireland.
• In the mid-1990s, women with diabetes continued to have an increased risk of perinatal mortality, stillbirth and poor pregnancy outcomes compared to the general maternity population3-5, despite the St. Vincent’s Declaration in 19896, which set a 5 year target for women with diabetes to achieve similar pregnancy outcomes to women without diabetes.
• In 2001, the Diabetes National Service Framework (NSF)7, set out national standards for the management of diabetes and pregnancy. The CEMACH Diabetes Programme offered the opportunity to provide a national overview of maternity service provision and clinical care for women with diabetes, which could be used to evaluate progress in implementation of the NSF.
1.2 Aims of the national enquiry
The aims of the enquiry module were:
• To investigate standards of care provided to women with type 1 and type 2 diabetes in England, Wales and Northern Ireland and identify any underlying issues.
• To investigate any associations between poor pregnancy outcomes and demographic, social and lifestyle, and clinical care factors.
• To investigate any associations between demographic and clinical characteristics, social and lifestyle factors, and clinical care with type of diabetes.
1.3 A need for change
The prevalence of diabetes in the general population is increasing rapidly, due partly to an increasing contribution from particular ethnic minority groups, and increasing obesity in the general population. Type 2 diabetes is being diagnosed more frequently in younger age groups including children.8 This is likely to result in a continuing increase in the numbers of women with diabetes of childbearing age in
1. Introduction

2
England, Wales and Northern Ireland, which has signifi cant implications for both primary and secondary care health services.
The National Institute for Health and Clinical Excellence (NICE) is due to publish a national guideline on diabetes in pregnancy in November 2007, and this is anticipated to provide health professionals with guidance on best practice supported by current evidence.
CEMACH’s fi ndings will contribute to the evidence-base for this guideline, and it is hoped that the fi ndings and recommendations of this report will also help the NHS to identify any gaps in current services and work towards improving care and ultimately outcomes for all women with type 1 and type 2 diabetes.
References
1. Confi dential Enquiry into Maternal and Child Health: Maternity services in 2002 for women with type 1 and type 2 diabetes, England, Wales and Northern Ireland. CEMACH: London; 2004.
2. Confi dential Enquiry into Maternal and Child Health: Pregnancy in women with type 1 and type 2 diabetes in 2002-03, England, Wales and Northern Ireland. CEMACH: London; 2005.
3. Casson IF, Clarke CA, Howard CV, McKendrick O, Pennycook S, Pharoah PO et al. Outcomes of pregnancy in insulin dependent women with diabetes: results of a fi ve year population cohort study. BMJ 1997;315:275-82.
4. Hawthorne G, Robson S, Ryall EA, Sen D, Roberts SH, Ward Platt MP. Prospective population based survey of outcome of pregnancy in women with diabetes: results of the Northern Diabetic Pregnancy Audit, 1994. BMJ 1997; 315:279-81.
5. Hadden DR, Alexander A, McCance DR, Traub AI. Obstetric and diabetic care for pregnancy in diabetic women: 10 years outcome analysis, 1985-1995. Northern Ireland Diabetes Group, Ulster Obstetrical Society. Diabetic Med: 2001; 18:546-53.
6. Workshop Report. Diabetes Care and Research in Europe: The Saint Vincent Declaration. Diabetic Med: 1990; 7:360.
7. National Service Framework for Diabetes (England) Standards. Department of Health. The Stationery Offi ce: London; 2001.
8. Ehtisham S. The emergence of type 2 diabetes in childhood. Annals of Clinical Biochemistry 41(Pt1): Jan 2004; 10-6.
Introduction

3
The three modules of the CEMACH Diabetes Programme (the CEMACH survey of diabetes maternity services, the descriptive study of 3808 pregnancies to women with type 1 and type 2 diabetes, and the national enquiry into 521 diabetic pregnancies), have identifi ed a number of key fi ndings. These fi ndings are summarised in this chapter. Additional details can be found in the two previous reports of the Diabetes Programme and in the relevant chapters of this report.
2.1 Social and demographic characteristics
Women with type 1 diabetes accounted for 73% (2767/3808) of women in the descriptive study and women with type 2 diabetes accounted for 27% (1041/3808) of women in the descriptive study.1
Women with type 2 diabetes were more likely to be older, multiparous, live in a deprived area and come from a Black, Asian or Other Ethnic minority group, than women with type 1 diabetes.1
In the enquiry, maternal social deprivation (based on postcode of residence) was associated with poor pregnancy outcome.
Smoking before pregnancy in women with diabetes was associated with an increased risk of poor pregnancy outcome. Further work is required to elucidate the interrelationship and relative contribution of factors such as smoking, deprivation and ethnicity to pregnancy outcome in women with diabetes.
2.2 Clinical characteristics
In the descriptive study, there was a 36% preterm delivery rate and a 67% caesarean section rate for women with diabetes.1 This compares to a 7% preterm delivery rate and a 22% caesarean section rate in the general maternity population.2
In the descriptive study, 21% of singleton babies of women with diabetes had a birth weight of 4000g or more compared to 11% of singleton babies in the general maternity population in England, 2002-03.1 8% of babies in the descriptive study had shoulder dystocia, compared with 3% in a regional general maternity population.3
There was a ten-fold increased incidence of Erb’s palsy in babies of women with diabetes compared to babies in the general maternity population in the UK.1, 4
Nearly half of women in the enquiry had recurrent hypoglycaemia during pregnancy and more than a tenth had at least one severe hypoglycaemic episode requiring external help. There was no evidence from case-control analysis that hypoglycaemia was associated with a poor pregnancy outcome for the baby.
2.3 Pregnancy outcomes
In the descriptive study, women with diabetes had signifi cantly increased risks of adverse pregnancy outcome compared to the general maternity population: a fi vefold increased risk of stillbirth, a threefold increased risk of perinatal mortality and a twofold increased risk of fetal congenital anomaly.1
A number of demographic and clinical characteristics, social and lifestyle factors, and clinical care factors were associated with poor pregnancy outcome, and are discussed in detail in other chapters of this report.
2. Key fi ndings of the CEMACH Diabetes Programme

4
Key fi ndings of the CEMACH Diabetes Programme
2.4 Preconception care
In the CEMACH survey of maternity services, less than a fi fth of maternity units in England, Wales and Northern Ireland provided structured multidisciplinary preconception care for women with diabetes.5
Women with diabetes were poorly prepared for pregnancy:
• Less than half were recorded to take folic acid supplements prior to pregnancy • Less than half were recorded to have had preconception counselling regarding glycaemic control,
diet, contraception, diabetes complications and alcohol intake • A third were recorded to have a test of glycaemic control in the 6 months before pregnancy1 • Two-thirds had evidence of suboptimal glycaemic control before conception and in the fi rst
trimester of pregnancy.
Suboptimal preconception care, glycaemic control before and during pregnancy and approach of the woman to managing her diabetes were all associated with poor pregnancy outcome.
One of the main underlying factors to suboptimal preconception care was failure of provision of appropriate care by health professionals: preconception counselling, contraceptive advice, provision of high dose folic acid, and appropriate screening and management of diabetes complications.
The main factors underlying suboptimal glycaemic control and a suboptimal approach to managing diabetes were social and lifestyle issues: non-attendance of women at planned appointments, non-adherence to medical advice about diabetes management, unplanned pregnancy and social factors including language diffi culties, diffi cult domestic circumstances and erratic or busy lifestyles.
Only a minority of women in the enquiry appeared to be using any form of contraception in the 12 months before pregnancy, based on documentation by adult diabetes services and primary care. This suggests that women are not aware of the importance of continuing effective contraception until their glycaemic control is as near-normal as possible.
In the enquiry, a minority of women were documented to be on high dose (5mg) folic acid before pregnancy.
There was poor documentation of preconception care and advice given.
2.5 Clinical care during pregnancy
Suboptimal maternity care during pregnancy was associated with poor pregnancy outcome. Underlying issues identifi ed included suboptimal fetal surveillance (both cardiotocograph and ultrasound monitoring) and poor management of maternal risks identifi ed during the course of pregnancy.
Suboptimal diabetes care (excluding glycaemic control) during pregnancy was associated with poor pregnancy outcome.

5
Suboptimal fetal surveillance of babies with antenatal evidence of macrosomia (defi ned for the enquiry as evidence of fetal size greater than the 90th centile for gestation) was associated with poor pregnancy outcome. The main underlying issues identifi ed were lack of timely follow up and poor interpretation of ultrasound scans.
2.6 Differences between women with type 1 and type 2 diabetes
In the enquiry, women with type 2 diabetes were more likely to be obese than women with type 1 diabetes.
In the 12 months prior to pregnancy, women with type 2 diabetes were less likely than women with type 1 diabetes to have a retinal assessment, a test for albuminuria and to be recorded to be using contraception.
Women with type 1 diabetes were more likely than women with type 2 diabetes to have recurrent hypoglycaemia during pregnancy or episodes of hypoglycaemia requiring external help. Nevertheless, a fi fth of pregnant women with type 2 diabetes had recurrent hypoglycaemia.
Fewer women with type 2 diabetes than type 1 diabetes had a retinal assessment in the fi rst trimester of pregnancy (or at booking if later).
2.7 Clinical governance issues
In the CEMACH survey of maternity services5, nearly two-thirds of maternity units in England, Wales and Northern Ireland self-reported a multidisciplinary antenatal team that included all the health professionals (obstetrician, diabetes physician, midwife, diabetes specialist nurse, dietitian) recommended by the Diabetes National Service Framework.6
There was poor documentation of both obstetric and diabetes care for more than half of women in the enquiry.
Concerns were raised at panel enquiry about the standard of local guidelines for three-quarters of women in the enquiry.
2.8 Neonatal care of term babies of women with diabetes
In the CEMACH survey carried out in 2002-035, nearly a third of units had a policy of routinely admitting babies of mothers with diabetes to the neonatal unit.
In the neonatal enquiry (see Chapter 12, Neonatal care of women with diabetes), one third of term babies were admitted to a neonatal unit for special care and over half of these admissions were avoidable.
Intention to breastfeed was lower among mothers with diabetes than the breastfeeding rate in the general population.1 There appeared to be several barriers to breastfeeding, including maternal choice, infant formula given despite maternal choice to breastfeed, and some babies not receiving an early feed soon after birth.
Blood glucose testing of the baby was being carried out too early following delivery, and inappropriate methods of testing were often used.

6
Two thirds of babies in the neonatal enquiry had suboptimal care on the labour ward and this frequently impacted on subsequent care.
2.9 Postnatal care
Half of women in the enquiry had suboptimal postnatal diabetes care. The main underlying issues were poor management of glycaemic control after delivery, lack of contact with the diabetes team, inadequate plans of care at discharge from hospital, and no contraceptive advice given to women.
Women who had a poor pregnancy outcome were more likely not to receive postnatal contraceptive advice and were more likely to have had suboptimal postnatal diabetes care.
In the enquiry, women with type 2 diabetes were less likely to receive postnatal contraceptive advice.
References
1. Confi dential Enquiry into Maternal and Child Health. Pregnancy in women with type 1 and type 2 diabetes in 2002-03, England, Wales and Northern Ireland. CEMACH: London; 2005.
2. The National Sentinel Caesarean Section Audit Report. Royal College of Obstetricians and Gynaecologists, Clinical Effectiveness Support Unit. RCOG Press: London; 2001.
3. Nesbitt TS, Gilbert WM, Herrhen B. Shoulder dystocia and associated risk factors with macrosomic infants born in California. Am J Obstet Gynecol; Aug 1998; 179:476-80.
4. Evans-Jones G, Kay SP, Weindling AM, Cranny G, Ward A, Bradshaw A, et al. Congenital brachial palsy: incidence, causes, and outcomes in the United Kingdom and Republic of Ireland. Arch Dis Child Fetal Neonatal Ed; 2003; 88:F185-9.
5. Confi dential Enquiry into Maternal and Child Health. Maternity services in 2002 for women with type 1 and type 2 diabetes, England, Wales and Northern Ireland. CEMACH: London; 2004.
6. National Service Framework for Diabetes (England) Standards. Department of Health. The Stationery Offi ce: London; 2001.
Key fi ndings of the CEMACH Diabetes Programme

7
3. Summary of recommendations
This chapter includes the recommendations that have been made arising from the fi ndings of this report. Details of the process followed to derive the recommendations can be found in Chapter 5.
The recommendations below apply to all women with type 1 and type 2 diabetes.
Social and lifestyle issues
Clinical
1. Preconception and maternity services related to pregnancy should be easily accessible and responsive to all women with diabetes, and provide appropriate care and information.
2. There should be mechanisms in place to identify vulnerable communities and individuals, so that additional services can be provided as appropriate to women of childbearing age with diabetes, thereby ensuring optimal preconception care.
3. Providers of diabetes care should develop educational strategies that will enable all women of childbearing age with diabetes to prepare adequately for pregnancy.
Audit and research
4. Research should be carried out to: • identify the barriers to accessing preconception care • identify possible strategies to support self-care and pregnancy planning by women with diabetes.
Clinical issues: preconception
Clinical
1. Commissioners of services must ensure that all women with diabetes are provided with specialist preconception services, with access to all members of the specialist multidisciplinary team. As a minimum, these services should include: • Clear signposting to different aspects of care • Diet and lifestyle advice • Provision of appropriate contraception • Higher dose folic acid supplementation • Smoking cessation support • Assessment and management of diabetes complications • Setting of glycaemic control targets and regular discussion of results of self-monitoring,
to enable the woman to achieve control that is as near to normal as possible before conception • Discussion of diabetes pregnancy risks and expected management strategies • Clear documentation of care and counselling, ideally using a standard template.

8
Summary of recommendations
Audit and research
2. Preconception services should be audited to ensure that minimum standards are being met.
Clinical issues: pregnancy
Clinical
1. An individualised care plan covering the pregnancy and postnatal period up to 6 weeks should be clearly documented in the notes, ideally using a standard template. The plan may require changes to be made depending on the clinical circumstances through pregnancy. As a minimum, the care plan should include: • Targets for glycaemic control • Retinal screening schedule • Renal screening schedule • Fetal surveillance • Plan for delivery • Diabetes care after delivery.
2. The care plan should be implemented from the outset of pregnancy by a multidisciplinary team present at the same time in the same clinic. As a minimum, the multidisciplinary team should include an obstetrician, diabetes physician, diabetes specialist nurse, diabetes midwife and dietitian.
3. Pregnancies with ultrasound evidence of macrosomia should have a clear management plan put in place by a consultant obstetrician. This should include timing of follow-up scans, fetal surveillance and mode and timing of delivery.
4. A care plan for postnatal management should be clearly documented in the notes for all women. As a minimum, this should include: • Plan for management of glycaemic control • Neonatal care • Contraception • Follow-up care after discharge from hospital.
Audit and research
5. Research should be carried out to investigate: • the most appropriate management strategy following antenatal evidence of macrosomia
in babies of women with diabetes • how best to achieve optimal blood glucose control during pregnancy, labour and delivery.
Clinical governance
Clinical
1. Commissioners should recognise the complexity of diabetes management immediately before and during pregnancy, and ensure that the available service provision includes all members of the multidisciplinary team.

9
2. Patient pathways of care including preconception counselling, pregnancy care and post-pregnancy management should be incorporated into the clinical record.
3. Services should review their local guidelines. The NICE Diabetes in Pregnancy guideline, due to be published in November 2007, is anticipated to provide current evidence for best practice.
4. In order to raise awareness, specialist multidisciplinary teams should provide regular educational days for all primary and secondary care professionals likely to be involved in the care of women with diabetes in the local population, to cover all aspects of preconception, pregnancy and postnatal care.
Audit and research
5. Diabetes networks should carry out regular audits of preconception and pregnancy services.
Type 1 and type 2 diabetes
Clinical
1. During pregnancy, retinal and renal screening schedules should be provided for both women with type 1 and women with type 2 diabetes.
2. Advice about hypoglycaemia during pregnancy, including prevention and management strategies, should be provided to both women with type 1 diabetes and women with type 2 diabetes.
Audit and research
3. Diabetes networks should audit standards of preconception and pregnancy care for both women with type 1 and women with type 2 diabetes.
Neonatal care of term babies of women with diabetes
1. All units delivering women with diabetes should have a written policy for the management of the baby. The policy should assume that babies will remain with their mothers in the absence of complications.
2. Mothers with diabetes should be informed antenatally of the benefi cial effects of breastfeeding on metabolic control for both themselves, and their babies.
3. Mothers with diabetes should be offered an opportunity for skin-to-skin contact with their babies immediately after delivery. Breastfeeding within one hour of birth should be encouraged.
4. Blood glucose testing performed too early should be avoided in well babies, without signs of hypoglycaemia. Testing should be performed before a feed, using a reliable method (ward-based glucose electrode or laboratory analysis). For all blood glucose tests, the time it is performed, method used, result, and action taken should be clearly documented in the notes. Further research is needed to defi ne the optimal timing of fi rst blood glucose test in babies of diabetic mothers.
5. Junior paediatric staff should be trained in the management of babies of mothers with diabetes. This should include appreciation of the importance of supporting early breastfeeding, avoidance of early blood glucose testing in the well baby, and formulation of a written plan agreed with the mother.
6. Midwives should recognise the importance of supporting early breastfeeding for women with diabetes, and the need to document this aspect of care.

10
4.1 Introduction
The enquiry module of the CEMACH diabetes programme encompassed a case-control study, a comparison of type 1 and type 2 diabetes, and an audit of care:
• A case-control analysis to examine any differences in demographic factors, social and lifestyle issues, and clinical care between a) pregnancies resulting in adverse pregnancy outcome (deaths from 20 weeks gestation up to 28 days after delivery or major fetal congenital anomaly at any gestation) and b) pregnancies resulting in a normally formed baby surviving to 28 days of life.
• A comparison of any differences in demographic factors, social and lifestyle issues, and clinical care between women with a) type 1 and b) type 2 diabetes.
• An audit of the care received before, during and after pregnancy by a subset of women within the whole study population of the CEMACH diabetes programme.
4.2 Selection of pregnancies for enquiry
To enable the audit of care and case-control analysis to be conducted, four groups of pregnancies were selected for enquiry:
1. Anomalies – pregnancy to a woman with type 1 or type 2 diabetes resulting in a singleton baby (including terminations of pregnancy at any gestation, late fetal losses, stillbirths and live births) with a confi rmed major congenital anomaly, diagnosed up to 28 days of life.
2. Deaths – pregnancy to a woman with type 1 or type 2 diabetes resulting in death of a singleton baby from 20 weeks of gestation up to 28 days after delivery, excluding terminations of pregnancy and confi rmed congenital anomalies.
3. Controls – pregnancy to a woman with type 1 or type 2 diabetes resulting in a singleton birth delivering at 20 weeks of gestation onwards and surviving to 28 days of life, excluding those with a confi rmed congenital anomaly.
Preliminary fi ndings from the CEMACH descriptive study of 3808 pregnancies to women with diabetes in England, Wales and Northern Ireland in 2002-03 showed that women with type 2 diabetes appeared to be more poorly prepared for pregnancy and also had an equivalent risk of adverse pregnancy outcome to women with type 1 diabetes.1,2 It was therefore decided to enquire on an additional sample of pregnancies of women with type 2 diabetes to enable a more thorough investigation of the care received by these women.
4. Additional type 2 sample – pregnancy to a woman with type 2 diabetes resulting in a singleton birth delivering at 20 weeks of gestation onwards and surviving to 28 days of life, excluding those with a confi rmed congenital anomaly.
All pregnancies meeting the defi nition of anomaly or death within the CEMACH descriptive study were selected to form the cases for the case-control analysis. Controls were randomly sampled from the group of pregnancies reported in the CEMACH descriptive study fi tting the defi nition of a control in order to sample one control per case. The additional type 2 pregnancies were randomly sampled from
4. Methodology

11
the pregnancies meeting this defi nition (see 4. above) after exclusion of the type 2 pregnancies which had already been sampled as controls.
All the chapters in this report apart from Chapters 5, 10, 11 and 12 refer to the cases and controls described above.
The additional sample of type 2 pregnancies was used only in the analysis examining differences between women with type 1 and type 2 diabetes, and the methodology for this analysis is described separately in Chapter 11.
In total, 590 pregnancies were sampled for enquiry. Notes were requested from the unit of delivery and followed up on three occasions over the subsequent three months. Notes were unable to be retrieved for 12% of all notes requested giving a fi nal total of 521 pregnancies going for enquiry (table 4.1).
Table 4.1Summary of notes requested and receivedType of pregnancy Total requested Notes not
availableNotes received
Control 245 25 220Death 110 15 95Anomaly 138 11 127Additional Type 2 97 18 79Total 590 69 521
4.3 Panel process
Medical records of all pregnancies in the enquiry module were reviewed by multidisciplinary enquiry panels of senior health care professionals, held at regional level. Panels reviewed three or four cases per meeting. Cases reviewed were selected from a national pool excluding the region of the assessing panel, to ensure an independent assessment of the care provided.
In total, 143 panel meetings were convened between April 2004 and December 2005 in the CEMACH regions throughout England, Wales and Northern Ireland. Panel meetings did not take place in the West Midlands region but any pregnancy to a woman delivering in the West Midlands that was selected for enquiry was included in the national pool and reviewed by enquiry panels outside of the West Midlands.
4.3.1 Panel chairs
Two or three panel chairs were appointed per region by a central selection committee. The specifi c remit of the panel chairs was to ensure that an equitable process was followed to reach consensus on each of the specifi c questions asked in the enquiry pro forma. Panel chairs were invited to attend a training day before the commencement of the panel process. This allowed an opportunity to discuss various challenges likely to be faced by a panel chair and to develop mechanisms of working that would ensure a consistent approach to panel enquiry meetings across the regions.

12
4.3.2 Panel composition
Each panel for the diabetes enquiry consisted of two of each of the following disciplines:
• Obstetrician • Midwife • Diabetes specialist nurse • Diabetes physician.
At least one clinician from each specialty was required to be present in order for the panel meeting to take place. Under exceptional circumstances the panel chair could participate as a full assessor if there were no other clinicians available from their specifi c discipline. If it was not possible for at least one clinician from each specialty to be represented then the panel meeting was cancelled. Additional panel members whose input was relevant to particular enquiry cases were invited to attend meetings as required e.g. general practitioners, pathologists, neonatologists.
Previous confi dential enquiries had not included lay panel assessors. For the diabetes enquiry, CEMACH sought to include lay assessors on the enquiry panels. Criteria for lay panel assessors were agreed with Diabetes UK, and the initiative was piloted in 2 regions. One lay member attended 5 panel meetings in Yorkshire and Humberside region.
Observers were allowed to attend (with due notice) but were not expected to contribute to the discussion during assessment.
In total, 647 health professionals contributed over 5000 hours to panel enquiries over the course of the enquiry module, with 70 additional observers attending one or more panels. The median number of cases reviewed by each assessor was 8 (range 4-48).
4.4 Enquiry documentation
Panel members were provided with the medical records for each case pertaining to care in the antenatal, delivery and postnatal periods. These included diabetes and maternity notes plus any relevant drug charts, haematology, biochemistry and histology results. Neonatal notes up to day 3 post delivery were also provided where applicable. Following a feasibility exercise at the outset of the project it was deemed impractical to collect all medical records pertaining to diabetes care prior to the pregnancy of interest. In order to allow some assessment of care in the pre-pregnancy period a pre-pregnancy pro forma was also completed by a health professional involved in the preconception care of the woman, either within the adult diabetes service or in primary care (see Appendix A). In addition, any professional correspondence relating to diabetes management within the year preceding the last menstrual period was requested. Women were not contacted directly at any stage of this process, and information about social and lifestyle issues and clinical care was therefore based solely on documentation provided by the health professionals involved in the care of the woman and her baby.
In order to maintain confi dentiality of the women, their families and the health professionals involved in their care, all notes provided to panel assessors were anonymised by the CEMACH regional managers
Methodology

13
in order to remove any identifi able information. This included patient identifi ers, hospital identifi ers and staff identifi ers. Where names of staff were anonymised, the designation (grade) of the staff member was entered onto the documentation, to enable panel assessment of whether care had been provided by the appropriate grade of staff.
4.5 Assessment of care
The scope of this enquiry included preconception care, care during pregnancy, labour and delivery, and postnatal and neonatal care up to 3 days post delivery. A structured enquiry pro forma (see Appendix B) was developed by the CEMACH central offi ce with advice from members of the CEMACH Diabetes Professional Advisory Group. This pro forma contained a mixture of factual questions and assessments of care from review of the medical records, after a round-table discussion and after panel consensus had been reached. Panel assessors were asked to grade their opinion of the quality of care as ‘optimal’, ‘adequate’ or ‘poor’. ‘Optimal’ indicated that there were no issues with care, while ‘adequate’ indicated that there were some issues of concern. ‘Adequate’ and ‘poor’ care were aggregated as ‘suboptimal’ care for the purpose of analysis.
If concerns had been identifi ed, panels were asked to describe the key issues contributing to this assessment and to code the issues according to the following categories:
Issues relating directly to the patient and/or family issuesPD Duration or severity of diabetes.PO Other complicating medical or social and / or lifestyle factors which may hinder optimal management e.g.
management-intensive medical conditions such as thrombophilia or cardiac disease, and social factors such as housing problems or lack of family support.
PC Woman actively chose not to follow the medical advice given e.g. refusal to undergo induction of labour until 42+ weeks of gestation.
PA Woman’s actions detracted from optimal management e.g. infrequent home blood glucose monitoring, not following dietary instructions.
PN Woman did not attend appointments e.g. failure to attend for clinic visits or ultrasound scans.
Issues relating to the provision of health servicesHP Clinical practice e.g. no timely discussion of timing and mode of delivery.HC Communication. This could be a failure of communication between professionals caring for the woman
e.g. inadequate discussion between obstetrician and physician, or a failure of communication between professionals and the woman e.g. interpreting services were not adequate despite diffi culties with English.
HR Resources including staffi ng e.g. no dietitian in the antenatal clinic, lack of midwifery staff on labour ward, problems with accessing timely fetal surveillance such as growth scans.
Panels were asked to code up to four issues that were appropriate to the judgment of ‘adequate’ or ‘poor’ care. During analysis, these codes were used as a guide for the analysis of the themes arising from the free text.

14
Associations in the main body of the report are those for group 4 i.e. poor pregnancy outcome. Results from the additional analyses are included in Appendices C, D and E. Analyses are reported as odds ratios examining the association between each factor of interest and adverse pregnancy outcome compared to the control group. Adjusted odds ratios are presented where appropriate. Where there are notable differences between any of the four case defi nitions in the direction and/or magnitude of a particular association, these are referenced in the text.
A CBDeathsMajorcongenital anomalies
Methodology
4.5.1 Panel guidance
Some questions in the enquiry pro forma included guidance for the panel assessors. The purpose of this guidance was to aid consistent defi nitions but was not prescriptive, recognising that panel assessors may have had access to information at panel enquiry which was at variance with the guidance provided.
4.6 Case-control analysis
For the purposes of the case-control analysis, four distinct sets of analyses were performed. The following four groups were classed as cases and compared with all controls
1. Anomalies, as per defi nition above (Figure 4.1, B+C) 2. Deaths excluding anomalies, as per defi nition above (Figure 4.1, A only) 3. All deaths, including deaths with congenital anomaly (Figure 4.1, A+B) 4. Poor pregnancy outcome - all adverse outcomes formed by groups 1 and 2 together
(Figure 4.1, A+B+C)
Figure 4.1Selection of cases for case-control analysis

15
When deriving odds ratios for any particular factor, information for any particular question which was recorded as ‘not documented’ or ‘missing’, were excluded from the analysis. However, when documented evidence of care was investigated (in Chapters 7 – 9), ‘not documented’ was included in the analysis.
4.7 Type 1 versus type 2 analysis
The methodology for this analysis is described in Chapter 11.
4.8 Analysis of panel comments
Panel assessment of the quality of care before, during and after pregnancy was assessed as optimal versus suboptimal, where suboptimal refl ected a combination of ‘adequate’ (some issues with care) and ‘poor’ responses.
Where a case was considered to have had suboptimal care, panels were asked to summarise the key issues (see enquiry assessment above). These free text fi elds were categorised into one or more theme headings by an individual clinician (obstetrician, diabetes physician or neonatologist as appropriate) to allow further exploration of the data. Tables where free text information has been categorised are footnoted throughout the report. Categorisation was based purely on the text contained in the pro forma.
4.9 Derivation of recommendations
Recommendations were derived following consultation with all members of the CEMACH Diabetes Professional Advisory Group (PAG) and with regional panel chairs. The draft report was reviewed by the Diabetes PAG and suggested recommendations sent by individual PAG members to the CEMACH central offi ce. These recommendations were collated and sent to all PAG members for scoring. Suggested recommendations were scored for validity (whether the recommendation was based on the fi ndings of the report) on a scale of 1-4, where 1 was extremely valid and 4 was not at all valid; and for clinical importance (the potential of the recommendation to impact on clinical practice or outcomes) on a scale of 1-4, where 1 was of high clinical importance and 4 was of no clinical importance.
Any individual recommendation with a median score of 4 for validity or clinical importance was excluded. The scored recommendations were then sent out for consultation to regional panel chairs for a second round of scoring. Panel chairs were also invited to make any additional recommendations they felt were both valid and clinically important.
Following a second round of scoring and analysis, a meeting of the Diabetes PAG and regional panel chairs was held to review all scored recommendations and reach consensus on inclusion of recommendations within the report. These revised recommendations were collated and reviewed by the Chair of the Diabetes PAG and CEMACH Central Offi ce, and recommendations then sent out again to PAG members and panel chairs for comments. Comments received were reviewed, fi nal revisions made, and the recommendations then fi nalised by CEMACH Central Offi ce.

16
4.10 Limitations
All data collected during this enquiry were derived from review of the medical records. Findings of this report are therefore based on documentation in the medical records of demographic factors, social and lifestyle issues and clinical care, and are not based on direct questioning of clinicians or women.
In many cases it was not possible to complete all questions on the pro forma with reference to the medical notes provided. The proportion of missing information was even more pronounced for information pertaining to the pre-pregnancy period, where missing data ranged from less than 5% to more than 50% for specifi c data items.
Throughout the report, numbers are reported with reference to the total number of records where information was recorded i.e. excluding all missing data. In general, there was no systematic difference in the number of missing responses dependent on whether a pregnancy was a case or a control.
With regard to panel assessment of women’s behaviour and clinical care, it should be noted that the enquiry sample is not fully representative of the whole population of pregnant women with diabetes, as approximately half of women in the enquiry had a poor pregnancy outcome due to the sampling process. It is therefore possible that the issues identifi ed by enquiry panels represent the worse end of the spectrum of suboptimal behaviour and care. However, for many factors examined there was no difference between cases and controls.
One of the potential limitations to the panel enquiry approach is variation of assessments between different regional panels. Panel guidance notes were provided in order to minimise variation, and the panel chairs and regional managers had an important role to play in directing the discussion and ensuring that all factors were taken into consideration during assessments. Panel chairs attended a training day (as described above) in order to standardise the approach to the enquiry assessment, and guidance was provided in the enquiry pro forma (see appendix B) to aid in its completion. Despite this training and guidance there remains a degree of subjectivity in the panel assessment process which cannot be completely eliminated.
A source of bias that has been previously experienced in some confi dential enquiry programmes is that knowledge of the pregnancy outcome may affect the panel assessment of care. The Project 27/28 study3 which enquired into standards of care for babies born at 27 and 28 weeks gestation, blinded assessors to the outcome of the case up to the point of delivery. In this study, as one of the outcomes was congenital anomaly which could be diagnosed antenatally, it was not possible to blind the panels to pregnancy outcome in all cases. For this reason, it was agreed that assessors would not be blinded to any outcomes for the pregnancies being reviewed. This may have led to an element of bias in this study particularly with respect to the questions which asked for panel assessment of the standard of care received or the woman’s approach to managing her diabetes. This bias could have led to an overestimate of the extent of the association of panel assessment of suboptimal care with adverse pregnancy outcome. Results relating to panel assessment are clearly identifi ed throughout the report and should be interpreted with a degree of caution.
Methodology

17
Associations are reported in Chapters 6–10 for poor pregnancy outcome, which combines two separate adverse outcomes, fetal congenital anomaly and death from 20 weeks of gestation, compared to controls. In some cases, this precludes a more specifi c focus on the impact of the particular behaviour or care factor on individual poor outcomes e.g. fetal anomalies. For this reason, Appendices C, D, and E have been included to provide information on associations with poor outcome for each additional case defi nition (fetal congenital anomalies, all deaths, and deaths excluding anomalies).
It is recognised that some of the factors reported to have an association with adverse outcome are not likely to be on the causal pathway, for example poor glycaemic control after the fi rst trimester of pregnancy is unlikely to have been causative for fetal congenital anomaly, and poor diabetes care after delivery is not causative for poor pregnancy outcome. However, there may be other explanations for these associations, and they have therefore been retained, with discussion in the text where appropriate.
Results reported within chapter 6 are crude odds ratios examining each potential risk factor or assessment of clinical care and its association with poor pregnancy outcome in isolation. In order to allow for potential confounding factors, all odds ratios were adjusted for the effect of maternal age and deprivation on pregnancy outcome and these are also displayed. These adjusted odds ratios are displayed throughout chapters 7-9. It is possible, however, that there are additional confounding factors or interactions which have not been allowed for in this analysis.
4.11 The diabetes neonatal enquiry
Details on the methodology and derivation of recommendations for the diabetes neonatal enquiry can be found in Chapter 12.
References
1. Confi dential Enquiry into Maternal and Child Health: Pregnancy in women with type 1 and type 2 diabetes in 2002-03, England, Wales and Northern Ireland. CEMACH: London; 2005.
2. Macintosh M, Fleming K, Bailey J, Doyle P, Modder J, Acolet D, et al. Perinatal mortality and congenital anomalies in babies of women with type 1 or type 2 diabetes in England, Wales and Northern Ireland: population based study. BMJ, Jul 22 2006 333 (7560):177.
3. Confi dential Enquiry into Stillbirths and Deaths in Infancy. Project 27/28: An Enquiry into quality of care and its effect on the survival of babies born at 27-28 weeks. The Stationery Offi ce: London; 2003.

18
5. A description of women and babies in the enquiry
5.1 Introduction
This chapter describes the 442 women and 442 offspring in the enquiry module of the CEMACH Diabetes Programme, after excluding the additional 79 pregnant women with type 2 diabetes sampled for the purpose of carrying out a comparison between type 1 and type 2 diabetes (see Chapters 4 and 11).
Multiple births were excluded before sampling from the 3808 pregnancies in the descriptive study (see Chapter 4 for details of sampling methods). All babies who died from 20 weeks gestation up to 28 days after delivery, and all fetal congenital anomalies, were sampled for enquiry, together with a random sample of controls (singleton babies without a congenital anomaly surviving to day 28) so that there was one control for each case sampled. Women with poor pregnancy outcomes therefore represented a higher proportion of the enquiry sample than of the 3808 pregnancies in the descriptive study (approximately 50% of pregnancies in the enquiry module versus less than 10% of all pregnancies in the descriptive study).1
5.2 The women
5.2.1 Socio-demographic characteristics
The women in the enquiry were very similar to the whole population sampled from with respect to socio-demographic characteristics (table 5.1). Slightly more women in the enquiry were in the more deprived quintiles compared to women in the descriptive study.
5.2.2 Diabetes complications
Twelve percent of 359 women in the enquiry had nephropathy (panel guidance was that this could be incipient with microalbuminuria or established with persistent dipstick positive proteinuria and/or serum creatinine greater than 130mmol/l).
Thirty two percent of 316 women had retinopathy (pre-existing or diagnosed for the fi rst time in pregnancy) (table 5.2). Fifty one percent of 400 women in the enquiry had recurrent hypoglycaemia during pregnancy and 20% of 311 women had at least one severe hypoglycaemic episode requiring external help.
Information on specifi c diabetes complications was not collected for the descriptive study of 3808 pregnancies so direct comparisons cannot be made. Chapter 6 presents the proportions of women with poor pregnancy outcome and good pregnancy outcome who had diabetes complications.

19
Table 5.1Characteristics of women (all fi gures are % unless otherwise stated)Socio-demographic characteristics Women in the enquiry
n (%)(N=442)
Women in the CEMACH descriptive study 1
n (%)(N=3808)
Type of diabetes Type 1 324 (73) 2767 (73) Type 2 118 (27) 1041 (27)Median age at delivery (years) [IQR] 31 [25, 34] 31 [27, 35]Ethnicity: White 354 (80) 3059 (80) Black African 16 (4) 121 (3) Black Caribbean 9 (2) 84 (2) Black Other 0 (0) 14 (0.4) Indian 15 (3) 110 (3) Pakistani 24 (5) 203 (5) Bangladeshi 8 (2) 86 (2) Chinese 1 (0.2) 7 (0.2) Other 13 (3) 116 (3) Not known 2 (0.5) 8 (0.2) Primigravidas 192 (43) 1507 (40)Median age at onset of diabetes (years) [IQR]
19 [10, 26] 20 [11, 28]
Median duration of diabetes (years) [IQR]
9 [4, 17] 9 [4, 17]
Deprivation quintile: 1 59 (14) 496 (14) 2 60 (15) 581 (17) 3 72 (18) 638 (18) 4 89 (22) 728 (21) 5 128 (31) 1002 (29)Missing or resident in Wales or Northern Ireland
34 363

20
Table 5.2Specifi c diabetes complications in women in the enquirySpecifi c diabetes complication Women in the enquiry
n/N (%) Recurrent hypoglycaemia during pregnancy 203/400 (51)Hypoglycaemia requiring external help 63/311 (20)Pre-existing retinopathy 73/316 (23)New retinopathy 29/316 (9)Nephropathy 42/359 (12)
5.3 The babies
5.3.1 Pregnancy outcomes
The outcomes of all pregnancies in the enquiry are shown in table 5.3.
Table 5.3Outcome of pregnancies in the enquiry
No congenital anomaly(N=315)
Congenital anomaly(N=127)
Total(N=442)
Alive at 28 days 220 66 286Loss before 20 weeks N/Aa 19 19Late fetal loss 13 26 39Stillbirth 71 6 77Early neonatal death 9 4 13Late neonatal death 2 6 8
a Not within defi nition of pregnancies sampled for enquiry
Gender was known for 385 of 442 offspring. There were 192 males, 192 females and one indeterminate sex.
5.3.2 Fetal growth restriction
Thirty seven babies in the enquiry had documented antenatal evidence of fetal growth restriction or poor growth velocity (table 5.4). Seventy percent (26/37) of these babies had a poor outcome (death and/or fetal congenital anomaly) compared with 50% (222/442) of all babies in the enquiry. There was no difference in the distribution of type of diabetes or ethnicity amongst women whose babies had fetal growth restriction (table 5.4). However, 31% of the women whose babies had antenatal evidence of fetal growth restriction had nephropathy compared to 12% of women in the whole enquiry sample (p=0.002).
A description of women and babies in the enquiry

21
Table 5.4Characteristics of women whose babies had antenatal evidence of fetal growth restrictionMaternal characteristics Women with antenatal evidence of
fetal growth restrictionn (%)
(N=37)
All women in the enquiry
n (%)(N=442)
Type of diabetes Type 1 26 (70) 324 (73) Type 2 11 (30) 118 (27)Ethnicity White 31 (84) 354 (80) Black 3 (8) 25 (6) Asian 2 (5) 47 (11) Chinese and Other 1 (3) 14 (3)Median maternal age (years) [IQR] 33 [30, 34] 31 [25, 34]Nephropathy 10/32 (31) 42/359 (12)
5.3.3 Macrosomia
One hundred and twenty nine babies had documented antenatal evidence of macrosomia (the guidance given to panels was evidence of fetal size greater than the 90th centile for gestational age). Forty one percent (53/129) of these babies had a poor outcome; this was similar to the proportion (50%, 222/442) of all babies in the enquiry having a poor outcome. There was a slightly greater proportion of type 1 diabetes and White ethnicity in women whose babies had antenatal evidence of macrosomia compared to all women in the enquiry sample, but this did not reach signifi cance (p=0.13 and p=0.08 respectively) (table 5.5).
Table 5.5Characteristics of women whose babies had antenatal evidence of macrosomiaMaternal characteristics Women with antenatal evidence
of fetal macrosomian (%)a
(N=129)
All women in the enquiry
n (%)(N=442)
Type of diabetes Type 1 103 (80) 324 (73) Type 2 26 (20) 118 (27)Ethnicity White 112 (88) 354 (80) Black 7 (5) 25 (6) Asian 6 (5) 47 (10) Chinese and Other 3 (2) 14 (3.2)Maternal age (years) [IQR] 31 [26, 34] 31 [25, 34]Nephropathy 10/102 (10) 42/359 (12)
a Percentages are the proportion of women in a category out of the total number of women with a valid response, i.e. excluding ‘not
applicable’ and ‘missing’.

22
5.3.4 Fetal congenital anomalies
A total of 127 offspring of women in the enquiry had a confi rmed major congenital anomaly, using the European Surveillance of Congenital Anomalies (EUROCAT) classifi cation system.2 Over half of these babies survived beyond the neonatal period (table 5.3). Two thirds of the anomalies were detected antenatally. More details about fetal congenital anomalies in the CEMACH programme can be found elsewhere.1,3
5.3.5 Deaths
A total of 137 babies in the enquiry died from 20 weeks gestation up to 28 days after delivery. Forty two (31%) of these babies had a confi rmed major congenital anomaly (table 5.3).
The cause of death for stillbirths and neonatal deaths (babies who died from 24 weeks of gestation up to 28 days after delivery) was categorised according to the Extended Wigglesworth classifi cation4 using information within the medical records, including postmortem where available. The distribution of causes of death by major category was compared to the general maternity population (table 5.6). There was a greater proportion of unexplained antepartum stillbirths amongst babies of women with diabetes than in the general maternity population. There were a greater proportion of deaths due to immaturity in the general maternity population, despite the fact that the preterm delivery rate for women with diabetes was fi ve times higher than in the general population.1 Further work needs to be done to investigate the possible reasons for this difference.
Table 5.6Cause of death of stillbirths and neonatal deaths (Extended Wigglesworth classifi cation)Extended Wigglesworth classifi cation*
Stillbirths and neonatal deaths in enquiry
n (%)(N=98)
Stillbirths and neonatal deaths in general maternity
population (2002)5n (%)
(N=5756)
P-value
Congenital defect / malformation (lethal or severe)
18 (18) 1087 (19) 0.68
Unexplained antepartum fetal death 58 (59) 2516 (44) 0.002Death from intrapartum causes 10 (10) 429 (8) 0.30Immaturity 4 (4) 1027 (18) <0.001Infection 1 (1) 252 (4) 0.10Classifi cation not possible from information in medical records 7
36
* Extended Wigglesworth classifi cation categories that were not assigned to any stillbirth or neonatal death in the enquiry, are not
included in the table.
5.3.6 Postmortem examination
A postmortem examination was documented to have been offered for 89% (122/137) of babies who died. Postmortem examination was declined by parents in 39% (48/122) of cases. In ten further cases there
A description of women and babies in the enquiry

23
was no information available to panels as to why the postmortem examination was not carried out despite being offered. In one case only external examination was performed, and for one case it was documented in the medical records that postmortem examination was not needed. Overall, 45% (62/137) of babies who died were documented to have had a postmortem examination, which is slightly higher than the national average of 40% in 2002-03.5
Postmortem examination fi ndings were available to the panel for 57 out of 62 babies and are reported in table 5.7. The reported incidence of islet cell hyperplasia and eosinophilic infi ltrates in the pancreas was lower in this group of babies than in previous reports.6 It is diffi cult to be certain of the reasons for this difference, but possibilities include under-reporting due to advanced autolysis, a particular problem in the pancreas.
Table 5.7Postmortem examination fi ndings in babies who died after 20 weeks gestation having a postmortemSpecifi c fi ndings reported n (%)
(N=57)* † Islet cell hyperplasia 6 (11)Eosinophilic pancreatitis 1 (2)Cardiomegaly 10 (18)Vascular thrombosis 0 (0)No abnormality reported on postmortem 41 (72)
* 5 postmortem examination reports were not available.
† There may have been more than one fi nding reported for any baby undergoing postmortem examination.
5.4 Conclusions
Women in the enquiry were similar to women in the descriptive study with respect to socio-demographic characteristics. Due to the sampling methodology for the enquiry (see Chapter 4), half of the women in the enquiry had a poor pregnancy outcome.
Twelve percent of women in the enquiry had nephropathy and 32% had retinopathy (pre-existing or diagnosed for the fi rst time in pregnancy). About half of women in the enquiry had recurrent hypoglycaemia during pregnancy and a fi fth had at least one severe hypoglycaemic episode requiring external help.
Babies with antenatal evidence of fetal growth restriction had a higher proportion of mothers with nephropathy compared to all babies in the enquiry, and 70% had a poor outcome. Forty one per cent of babies with antenatal evidence of macrosomia had a poor outcome, which was similar to the 50% of babies in the whole enquiry sample with a poor outcome.
Sixteen percent of babies who died from 24 weeks of gestation up to 28 days after delivery had a cause of death classifi ed as ‘severe or lethal congenital anomaly’. Women in the enquiry had a higher proportion of unexplained antepartum fetal death and a lower proportion of deaths due to immaturity than the general maternity population. Nearly half of all babies who died had a postmortem examination.

24
References
1. Confi dential Enquiry into Maternal and Child Health. Pregnancy in women with type 1 and type 2 diabetes in 2002-03, England, Wales and Northern Ireland. CEMACH: London; 2005.
2. EUROCAT Report 8: Surveillance of Congenital Anomalies in Europe 1980-1999. European Registration of Congenital Anomalies. University of Ulster: Belfast; 2002.
3. Macintosh MCM, Fleming KM, Bailey JA, Doyle P, Modder J, Acolet D, et al. Perinatal mortality and congenital anomalies in babies of women with type 1 or type 2 diabetes in England, Wales and Northern Ireland: population based study. BMJ 2006; 333:177.
4. Confi dential Enquiry into Stillbirths and Deaths in Infancy. 4th Annual Report 1 January – 31 December 1995. Maternal and Child Health Research Consortium: London; 1997.
5. Confi dential Enquiry into Maternal and Child Health. Stillbirth, Neonatal and Post-neonatal Mortality 2000 – 2003, England, Wales and Northern Ireland. CEMACH: London; 2005.
6. Jaffe R. In Wigglesworth JS, Singer DB eds. The pancreas. Textbook of Fetal and Perinatal Pathology. Blackwell: Massacussetts: 900-932.
A description of women and babies in the enquiry

25
6.1 Introduction
Women with type 1 and type 2 diabetes continue to have an increased risk of adverse pregnancy outcomes, including miscarriage, fetal congenital anomaly and perinatal death.1-4 A case-control approach was utilised within the enquiry module to examine the association of demographic and clinical characteristics, social and lifestyle factors and clinical care with poor pregnancy outcome.
6.2 Methodology
Poor pregnancy outcome was defi ned as a singleton baby with a major congenital anomaly who delivered at any gestation and/or a baby who died from 20 weeks gestation up to 28 days after delivery.
There were 222 cases that met the defi nition of poor pregnancy outcome. These comprised:
• Sixty one singleton babies with a major congenital anomaly who died at any gestation during pregnancy and up to 28 days after delivery. This included terminations of pregnancy for fetal congenital anomaly.
• Ninety fi ve singleton babies without a major congenital anomaly who died from 20 weeks gestation up to 28 days after delivery.
• Sixty six babies with a major congenital anomaly who survived to 28 days after delivery.
There were 220 controls (singleton babies without a major congenital anomaly who survived to day 28 after delivery).
Odds ratios and associated 95% confi dence intervals were calculated to examine each factor identifi ed by panels and its association with adverse outcomes. Odds ratios are also displayed adjusting for maternal age and deprivation, where appropriate, to allow for the potential confounding by these factors.
6.2.1 Additional analyses
In addition to the primary analysis (section 6.2), associations of different factors with outcome were also analysed using three separate case defi nitions:
• All major fetal congenital anomalies • All deaths from 20 weeks gestation up to 28 days after delivery • Deaths from 20 weeks gestation up to 28 days after delivery, excluding major fetal
congenital anomalies.
The results of these analyses can be found in Appendices C, D and E. In most cases the direction of association was the same regardless of the case defi nition used. Any notable differences are highlighted throughout the text.
6.3 Results
Associations of factors with poor pregnancy outcome are presented below. Each group of factors is discussed in more detail in the relevant chapter in this report.
6. Factors associated with poor pregnancy outcome in women with type 1 and type 2 diabetes

26
Factors associated with poor pregnancy outcomein women with type 1 and type 2 diabetes
6.3.1 Socio-demographic characteristics
Associations with poor pregnancy outcome were investigated for specifi c social and demographic characteristics, including age, ethnicity, social deprivation, and gravidity (table 6.1).
Table 6.1Association of demographic characteristics in women with type 1 and type 2 diabetes with poor pregnancy outcomeDemographic characteristic Cases
n/N (%)Controlsn/N (%)
Crude OR [95% CI]
Adjusted OR[95% CI]
Age - - 1.0 [1.0, 1.0] 1.0 [1.0, 1.0]b
Black, Asian or Other Ethnic Minority group
47/222 (21)
41/220 (19) 1.2 [0.7, 1.9] 0.9 [0.5, 1.5]a
Primigravidity 100/222 (45) 92/220 (42) 1.1 [0.8, 1.7] 1.3 [0.9, 2.0]a
Maternal social deprivationd - - 1.2 [1.1, 1.4] 1.2 [1.1, 1.4]c
a adjusted for maternal age and deprivation.b adjusted for maternal deprivation. c adjusted for maternal age. Odds ratio is for one year increase in maternal age.d Quintile of social deprivation derived from postcode of residence. Odds ratio is for unit increase in deprivation quintile.
Maternal deprivation was associated with poor pregnancy outcome for women with type 1 and type 2 diabetes. This was similar to the general maternity population nationally, with over one third of all stillbirths and neonatal deaths in 2004 being born to mothers resident in the most deprived quintile.5
However, ethnicity was not associated with poor pregnancy outcome for women in the enquiry sample, which is different to previous fi ndings for the general maternity population.5,6 CEMACH is committed to further investigating the contribution of ethnicity and deprivation to specifi c pregnancy outcomes for women with type 1 and type 2 diabetes.
6.3.2 Clinical characteristics
The clinical characteristics examined included characteristics of the women such as Body Mass Index (BMI); known complications of diabetes before pregnancy; retinopathy, nephropathy and hypoglycaemia during pregnancy; and evidence of fetal growth restriction or macrosomia during pregnancy. The results are shown in table 6.2. Women with pre-existing diabetes complications were more likely to have a poor pregnancy outcome. However, nephropathy and recurrent or severe hypoglycaemia in pregnancy were not shown to be associated with poor pregnancy outcome. Antenatal evidence of fetal growth restriction was associated with poor pregnancy outcome but antenatal evidence of fetal macrosomia was not.

27
Table 6.2Association of clinical characteristics of women with type 1 and type 2 diabetes and their babies, with poor pregnancy outcomeClinical characteristics Cases
n/N (%)Controlsn/N (%)
Crude OR [95% CI]
Adjusted ORa
[95% CI]Body Mass Index (BMI) ≥30 40/136 (29) 33/137 (24) 1.3 [0.8, 2.3] 1.1 [0.6, 1.9]Pre-existing diabetes complications 37/182 (20) 16/197 (8) 2.9 [1.5, 5.5] 2.6 [1.3, 4.9]Retinopathy in pregnancy 55/149 (37) 50/167 (30) 1.4 [0.9, 2.2] 1.4 [0.9, 2.4]Diabetic nephropathy in pregnancy 28/174 (16) 14/185 (8) 2.3 [1.2, 4.7] 2.0 [1.0, 4.2]Recurrent episodes of hypoglycaemia during pregnancy
98/195 (50) 105/205 (51) 1.0 [0.7, 1.4] 1.1 [0.7, 1.7]
Severe hypogylacemia during pregnancy (one or more episode of hypoglycaemia requiring external help)
31/144 (22)
32/167 (19) 1.2 [0.7, 2.0] 1.3 [0.7, 2.3]
Antenatal evidence of fetal growth restriction 26/186 (14)
11/218 (5) 3.1 [1.5, 6.4] 2.9 [1.4, 6.3]
Antenatal evidence of macrosomia(fetal size >90th centile) 53/179 (30)
76/216 (35) 0.8 [0.5, 1.2] 0.8 [0.5, 1.3]
a adjusted for maternal age and deprivation.
6.3.3 Social and lifestyle factors
In the enquiry, a number of social and lifestyle factors were signifi cantly associated with poor pregnancy outcome (table 6.3), and these are further discussed in Chapter 7. There appears to be an urgent need for further research into the socio-cultural factors affecting women’s behaviour; education programmes for women and health professionals; and consideration of how best to develop diabetes maternity services.
Table 6.3Association of social and lifestyle factors in women with type 1 and type 2 diabetes with poor pregnancy outcomeSocial and lifestyle factor Cases
n/N (%)Controlsn/N (%)
Crude OR [95% CI]
Adjusted ORa
[95% CI]Unplanned pregnancy 72/141 (51) 55/144 (38) 1.7 [1.1, 2.7] 1.8 [1.0, 2.9]No contraceptive use in the 12 months before pregnancy
71/108 (66)
54/121 (45) 2.4 [1.4, 4.1] 2.3 [1.3, 4.0]
No folic acid commenced prior to pregnancy 83/120 (69) 66/131 (50) 2.2 [1.3, 3.8] 2.2 [1.3, 3.9]Smoking 63/183 (34) 44/182 (24) 1.7 [1.0, 2.6] 1.9 [1.2, 3.2]Assessment of suboptimal approach of the woman to managing her diabetes before pregnancy
137/160 (83)
88/154 (57) 4.5 [2.5, 7.9] 4.9 [2.7, 8.8]
Assessment of suboptimal approach of the woman to managing her diabetes during pregnancy
118/197 (60)
56/207 (27) 4.0 [2.6, 6.3] 3.9 [2.5, 6.1]
a adjusted for maternal age and deprivation.

28
Factors associated with poor pregnancy outcomein women with type 1 and type 2 diabetes
6.3.4 Glycaemic control
A test of glycaemic control before pregnancy, local glycaemic control targets, and panel assessments of glycaemic control before and during pregnancy, were examined in relation to poor pregnancy outcome (table 6.4). A lack of local glycaemic control targets, and suboptimal glycaemic control before and during pregnancy were associated with poor pregnancy outcome. These issues are discussed further in Chapters 7 and 8.
Table 6.4Association of factors related to glycaemic control before and during pregnancy in women with type 1 and type 2 diabetes, with poor pregnancy outcomeFactor related to glycaemic control Cases
n/N (%)Controlsn/N (%)
Crude OR [95% CI]
Adjusted ORa [95% CI]
No test of glycaemic control in the12 months prior to pregnancy
36/139 (26)
24/139 (17) 1.7 [0.9, 3.0] 1.5 [0.8, 2.8]
No local targets set for glycaemic control 44/90 (49) 28/86 (33) 2.0 [1.1, 3.7] 2.0 [1.0, 3.8]Assessment of suboptimal preconception glycaemic control 165/187 (88) 115/167 (69) 3.4 [1.9, 6.0] 3.9 [2.2, 7.0]Assessment of suboptimal 1st trimester glycaemic control 171/204 (84) 118/192 (61) 3.3 [2.0, 5.3] 3.4 [2.1, 5.7]Assessment of suboptimal glycaemic control after 1st trimester 146/205 (71)
76/209 (37) 4.3 [2.8, 6.7] 5.2 [3.3, 8.2]
Assessment of suboptimal glycaemic control during labour and delivery
80/162 (49)
96/202 (48) 0.9 [0.6, 1.4] 1.0 [0.7, 1.6]
No intravenous insulin and dextrose during labour and/or delivery
48/208 (23)
31/217 (14) 1.8 [1.1, 3.0] 1.8 [1.1, 3.0]
a adjusted for maternal age and deprivation.
6.3.5 Preconception care in the 12 months prior to pregnancy
Specifi c preconception care factors, based on the medical records held by adult diabetes services or general practitioners, were investigated for association with poor pregnancy outcome. The results are shown in table 6.5 and are discussed further in chapter 8. These fi ndings were dependent on documentation in the medical records, and poor documentation by health professionals of the care and advice given to women may have infl uenced the apparent association with poor pregnancy outcome.

29
Table 6.5Association of specifi c preconception care factors in women with type 1 and type 2 diabetes with poor pregnancy outcome Preconception care factor Cases
n/N (%)Controlsn/N (%)
Crude OR [95% CI]
Adjusted ORa
[95% CI]No contraceptive advice providedbefore pregnancy
28/85 (33)
19/83 (23) 1.7 [0.8, 3.3] 1.7 [0.8, 3.5]
No discussion of the following specifi c diabetes issues: Alcohol intake 31/70 (44) 19/66 (29) 2.0 [1.0, 4.1] 2.5 [1.1, 5.4] Diet 20/103 (19) 12/100 (12) 1.8 [0.8, 3.9] 1.8 [0.8, 4.1] Poor glycaemic control 18/118 (15) 14/117 (12) 1.3 [0.6, 2.8] 1.2 [0.5, 2.5] Retinopathy 25/83 (30) 25/96 (26) 1.2 [0.6, 2.4] 1.1 [0.6, 2.3] Nephropathy 28/74 (38) 29/76 (38) 1.0 [0.5, 1.9] 0.8 [0.4, 1.7] Hypertension 27/71 (38) 23/75 (31) 1.4 [0.7, 2.8] 1.1 [0.5, 2.3]No discussion of the following pregnancy issues: Increased diabetes surveillance 13/123 (11) 7/124 (6) 2.0 [0.8, 5.2] 1.7 [0.6, 4.5] Increased pregnancy surveillance 13/117 (11) 8/124 (6) 1.8 [0.7, 4.6] 1.5 [0.6, 4.0] Increased risk of induction 21/83 (25) 14/110 (13) 2.3 [1.1, 5.0] 2.2 [1.0, 4.9] Possible caesarean section 20/95 (21) 11/110 (10) 2.4 [1.1, 5.4] 2.4 [1.0, 5.8] Fetal risks in diabetic pregnancy 17/98 (17) 7/114 (6) 3.2 [1.3, 8.2] 2.9 [1.1, 8.2]No dietetic review 46/129 (36) 42/135 (61) 1.2 [0.7, 2.1] 1.2 [0.7, 2.1]No assessment of the following diabetes complications in the 12 months prior to pregnancy:Baseline retinal examination 36/141 (26) 18/137 (13) 2.3 [1.2, 4.3] 2.3 [1.2, 4.5]Baseline test of renal function 26/130 (20) 15/133 (11) 2.0 [1.0, 3.9] 2.0 [0.9, 4.3]Assessment of albuminuria 41/116 (35) 30/109 (28) 1.4 [0.8, 2.6] 1.5 [0.8, 2.8]Assessment of suboptimal preconception care (excluding glycaemic control) 116/133 (87)
80/134 (60) 4.6 [2.4, 8.8]
5.2 [2.7, 10.1]
a adjusted for maternal age and deprivation.
6.3.6 Diabetes care (excluding glycaemic control)
Diabetes care in the enquiry referred to monitoring for diabetes complications, including retinal assessments and tests of renal function. Findings are shown in table 6.6 and are discussed further in Chapter 9.

30
Factors associated with poor pregnancy outcomein women with type 1 and type 2 diabetes
Table 6.6Association of diabetes care factors (excluding glycaemic control) in women with type 1 and type 2 diabetes, with poor pregnancy outcomeDiabetes care factor Cases
n/N (%)Controlsn/N (%)
Crude OR [95% CI]
Adjusted ORa
[95% CI]No retinal assessment during fi rst trimester or at booking if later
70/194 (36)
49/183 (27) 1.5 [1.0, 2.4] 1.4 [0.9, 2.2]
No referral to ophthalmologist (if retinopathy present)
10/45 (22)
21/44 (48) 0.3 [0.1, 0.8] 0.2 [0.1, 0.7]
No monitoring for nephropathy 46/209 (22) 26/206 (13) 2.0 [1.2, 3.3] 1.9 [1.1, 3.3]No test of renal function(if nephropathy present)
12/26 (46)
5/14 (36) 1.5 [0.4, 6.0] 1.9 [0.3, 6.0]
Assessment of suboptimal diabetes care during pregnancy 146/204 (72) 118/204 (58) 1.8 [1.2, 2.8] 1.7 [1.1, 2.6]
a adjusted for maternal age and deprivation.
6.3.7 Maternity care
The association of maternity care factors with poor pregnancy outcome are shown in table 6.7. It is of concern that suboptimal maternity care during pregnancy and suboptimal antenatal fetal surveillance of big babies were associated with poor pregnancy outcome. This, together with issues relating to discussion of mode and timing of delivery, are discussed further in Chapter 9.
Table 6.7Association of maternity care factors in women with type 1 and type 2 diabetes with poor pregnancy outcomeMaternity care factor Cases
n/N (%)Controlsn/N (%)
Crude OR[95% CI]
Adjusted OR[95% CI]
Assessment of suboptimal fetal monitoring (with antenatal evidence of growth restricted baby)
6/24 (25)
1/11 (9) 3.3 [0.3, 34.1]
2.3 [0.2, 26.3]
Assessment of suboptimal fetal monitoring (with antenatal evidence of fetal size > 90th centile)
35/52 (67)
27/73 (37) 3.5 [1.7, 7.4]
5.3 [2.4, 12.0]
No discussion of mode and timing of delivery 15/178 (8) 4/202 (2) 4.6 [1.5, 14.2] 4.0 [1.2, 12.7]No administration of antenatal corticosteroids b 14/41 (34) 12/33 (36) 0.9 [0.4, 2.4] 0.9 [0.3, 2.5]Assessment of suboptimal maternity care during the antenatal period 125/215 (58)
95/215 (44) 1.8 [1.2, 2.6] 1.9 [1.2, 2.8]
Assessment of suboptimal maternity care during labour and delivery
78/199 (39)
72/213 (34) 1.3 [0.8, 1.9] 1.3 [0.8, 1.9]
a adjusted for maternal age and deprivation.b Analysis restricted to babies delivering from 24+0 to 35+6 weeks gestation and excluding antepartum stillbirths.
6.3.8 Postnatal care
Although postnatal care factors could not have been causative to poor pregnancy outcome, women who had a poor pregnancy outcome were more likely to have suboptimal postnatal diabetes care and no contraceptive advice before discharge from hospital (table 6.8). This is discussed further in Chapter 9.

31
Table 6.8Association of postnatal care factors with poor pregnancy outcome in women with type 1 and type 2 diabetesPostnatal care factor Cases
n/N (%)Controlsn/N (%)
Crude OR[95% CI]
Adjusted ORa
[95% CI]No postnatal contraceptive advice 63/143 (44) 26/163 (16) 4.2 [2.4, 7.3] 4.2 [2.4, 7.4]No written plan for post-delivery diabetes management
31/184 (17)
25/188 (13) 1.3 [0.8, 2.3] 1.4 [0.8, 2.6]
Assessment of suboptimal postnatal diabetes care 133/203 (66) 106/211 (50) 1.9 [1.3, 2.8] 1.8 [1.2, 2.7]
a adjusted for maternal age and deprivation.
6.4 Conclusions
The case-control analysis has noted a number of associations between demographic, social and lifestyle factors and clinical care with poor pregnancy outcome, and these are discussed further in the relevant chapters in this report. It should be noted that these factors are based on documentation in the medical records and on panels’ assessment of behaviour or care, which introduce potential problems, fi rstly with the high proportion of missing results for some data items, and secondly with potential bias due to lack of blinding of the panel assessors. There may also be confounding factors and although attempts have been made to adjust for some of these in the analysis, there may still be other factors that have not been taken into account. Overall, however, the fi ndings support the argument that preparation for pregnancy, glycaemic control, and the standard of preconception and pregnancy care need to be improved if better pregnancy outcomes are to be achieved for women with diabetes.
References
1. Macintosh M, Fleming K, Bailey J, Doyle P, Modder J, Acolet D, et al. Perinatal mortality and congenital anomalies in babies of women with type 1 or type 2 diabetes in England, Wales and Northern Ireland: population based study. BMJ, Jul 22 2006 333 (7560):177.
2. Evers I, de Valk H, Visser G. Risk of complications of pregnancy in women with type 1 diabetes: nationwide prospective study in the Netherlands. BMJ, Apr 17 2004 328(7445):915.
3. Verheijen E, Critchley J, Whitelaw D, Tuffnell D. Outcomes of pregnancies in women with pre-existing type 1 or type 2 diabetes, in an ethnically mixed population. BJOG, Nov 2005 112(11):1500-3.
4. Jensen D, Damm P, Moelsted-Pedersen L, Ovesen P, Westergaard J, Moeller M, et al. Outcomes in type 1 diabetic pregnancies: a nationwide, population-based study. Diabetes Care, Dec 2004 27(12):2819-23.
5. Confi dential Enquiry into Maternal and Child Health. Perinatal Mortality Surveillance, 2004: England, Wales and Northern Ireland. CEMACH: London; 2006.
6. Collingwood Bakeo A. Investigating variations in infant mortality in England and Wales by mother’s country of birth, 1983 – 2001. Paediatric and Perinatal Epidemiology, Mar 2006 20(2):127-39.

32
7. Social and lifestyle issues
Learning points
• Women with diabetes do not appear to be adequately prepared for pregnancy. • Two thirds of women with diabetes had suboptimal glycaemic control before and during the fi rst
trimester of pregnancy. • Suboptimal glycaemic control before and during pregnancy, and a suboptimal approach of the
woman to managing her diabetes, were associated with poor pregnancy outcome. • The main underlying issues for women with diabetes were:
- non-attendance at planned appointments - non-adherence to medical advice about diabetes management - unplanned pregnancy - social factors including language diffi culties and domestic circumstances.
7.1 Introduction
The prevalence of diabetes in the UK is increasing, with an increasing number of young people being diagnosed.1-3 There are an estimated 131 000 women diagnosed with diabetes of childbearing age in England (Diabetes UK, personal communication) . The CEMACH report on 3808 pregnancies to women with type 1 and type 2 diabetes has shown that women in England, Wales and Northern Ireland are poorly prepared for pregnancy.4
This chapter examines some of the underlying issues that were identifi ed during panel reviews of 442 singleton pregnancies to women with diabetes in England, Wales and Northern Ireland.
7.2 Preparation for pregnancy
Development of the fetal organs occurs during the fi rst three months of pregnancy, and there is evidence that good glycaemic control in the preconception period and during the fi rst trimester of pregnancy decreases the risk of fetal congenital anomaly and miscarriage.5-7 Women with diabetes of childbearing age need to use an effective and reliable method of contraception to avoid unplanned pregnancy, and it is recommended that women planning a pregnancy should continue contraception until good glycaemic control has been achieved.8 In addition, it has been shown that high dose (5mg) folic acid commenced before pregnancy decreases the risk of fetal neural tube defects in high risk populations9 and this is recommended for women with diabetes.1,10 Smoking increases the risk of diabetes vascular complications and placental insuffi ciency, and women should be advised and encouraged to stop smoking.
7.2.1 Enquiry fi ndings
Less than half (41%, 158/384) of women in the enquiry (35% of 197 casesa and 48% of 187 controlsb) were documented to have planned their current pregnancy, compared to a planned pregnancy rate of 58% in 2001-02 in the general maternity population.11 Twenty seven percent (107/32) of women (19% of 196 cases and 36% of 196 controls) were documented to have been using any form of contraception in the 12 months before conception. Twenty seven percent of 380 women were documented to have commenced

33
folic acid before pregnancy (19% of 193 cases and 35% of 187 controls). This is comparable to the general maternity population in the UK, where the uptake of folic acid has been shown to range from less than 10% to 50% in different studies.12 Only 33 women were documented to be on high dose (5mg daily) folic acid.
Women who did not have a record of any form of contraceptive use in the 12 months before pregnancy were more likely to have a poor pregnancy outcome (OR 2.3, 95% CI 1.3 - 4.0 adjusted for maternal age and deprivation, see Chapter 6). In the additional case-control analysis (see Appendices C, D and E) the specifi c association was with fetal or neonatal death from 20 weeks gestation and not with fetal congenital anomaly. This suggests that these women were not aware of the importance of using contraception until optimal glycaemic control had been achieved prior to conception, and may have been unaware of the importance of good pregnancy preparation in order to reduce the risks of adverse pregnancy outcomes.
Twenty eight percent (107/386) of women with diabetes were documented as smoking before pregnancy (32% of 197 cases and 23% of 189 controls). This compares to a rate of 35% in the general maternity population.11
7.3 Panel assessment of glycaemic control
Optimal glycaemic control before and during pregnancy is one of the main principles of management for women with pre-existing diabetes, as this decreases the risk of adverse pregnancy outcomes. 5-7 This can be challenging for women who already have to cope with the ongoing demands of their diabetes, and health professionals and women need to work in partnership to achieve good control.
The guidance given to enquiry panels was that optimal glycaemic control before and during pregnancy referred to an HbA1c of less than 7%. However, it was emphasised that panel assessors may have additional information available to them at enquiry, and in this case should base their assessment on all the available information.
Enquiry panels assessed that 64% of 440 women (74% of 222 cases and 53% of 218 of controls) had suboptimal glycaemic control before pregnancy and 66% of 439 women (77% of 222 cases and 54% of 217 controls) had suboptimal control during the fi rst trimester of pregnancy. After the fi rst trimester and up to labour and delivery, this decreased to 51% of 443 women (68% of 215 cases and 35% of 218 controls) of women with continuing pregnancies. Suboptimal glycaemic control before and during pregnancy was associated with poor pregnancy outcome (OR 3.9, 95% CI 2.2 - 7.0 pre-pregnancy; OR 3.4, 95% CI 2.1 - 5.7 in fi rst trimester; OR 5.2 , 95% CI 3.3 - 8.2 after fi rst trimester (all OR adjusted for maternal age and deprivation, see Chapter 6).
a In this chapter, a case refers to a woman who had a poor pregnancy outcome, defi ned as a singleton baby with a major congenital
anomaly who delivered at any gestation and/or a baby who died from 20 weeks gestation up to 28 days after delivery.
b In this chapter, a control refers to a woman who had a good pregnancy outcome, defi ned as a singleton baby without a congenital
anomaly who survived to day 28 after delivery.

34
7.3.1 Panel comments on suboptimal preconception glycaemic control
Enquiry panels made a total of 334 comments for 280 women with suboptimal preconception glycaemic control. The majority of these comments related to social and lifestyle issues (table 7.1). Twenty percent of women with suboptimal glycaemic control did not attend planned appointments, Ten percent had an unplanned pregnancy and 19% did not follow advice about the management of their diabetes. Eleven percent of women were socially vulnerable (mainly language diffi culties and domestic circumstances) or had erratic or busy lifestyles.
Table 7.1Panel comments on suboptimal preconception glycaemic control (table contains information following categorisation of free text)
Women with suboptimal preconceptionglycaemic control
Good pregnancy outcome(N=115)
Poor pregnancy outcome(N=165)
No. of comments % of women No. of comments % of womenTotal commentsa 68 119Medical, social and lifestyle factorsb 32 - 48 - Unplanned pregnancy 12 10 16 10 Social vulnerability or lifestyle problems 9 8 22 13 Medical factors 11 10 9 5 Poor education / understanding
0 -
1
1 of diabetes
Woman did not attend appointments 14 12 41 25Non adherence to diet, HBGMc
or insulin 22 19
30 18
a There were 81 additional comments where the issues were not described by panels; 18 comments where there was a lack of
preconception care with the reason being unclear to panels; and 48 comments about clinical care. These comments are not
included in the table. b A single woman could have more than one comment in the medical, social and lifestyle category, therefore % of women calculated
only for individual factors. c Home blood glucose monitoring.
7.3.2 Panel comments on suboptimal glycaemic control during pregnancy
Panels made a total of 154 comments about social and lifestyle issues in the fi rst trimester and 94 comments about social and lifestyle issues in the second trimester . The main issues were non-adherence to medical advice and failure to attend planned appointments. ‘Medical, lifestyle or social factors’ included concerns about erratic lifestyles and social problems (table 7.2).
Social and lifestyle issues

35
Table 7.2Panel comments on social and lifestyle issues underlying suboptimal glycaemic control during pregnancy in women with pre-existing diabetes (table contains information following categorisation of free text)
Women assessed to have suboptimal glycaemic control in the 1st trimester
Women assessed to have suboptimal glycaemic control after the 1st trimester
Good pregnancy outcome(N=118)
Poor pregnancy outcome(N=171)
Good pregnancy outcome(N=76)
Poor pregnancy outcome(N=146)
No. of comments
% of women
No. of comments
% of women
No. of comments
% of women
No. of comments
% of women
Total comments* 57
- 97 - 27 - 67 -
Non adherence to medical
advice19 16 36 21 11 14 26 18
Medical, lifestyle or
social factors
8
7
9
5
4
5 11
8
Duration and severity of
diabetes
6
5
8
5
4
5 10
7
Woman did not attend planned
appointments10
8 21 12
5
7 14 10
Actively chose not to follow
medical advice
1
1
3
2
3
4
6
4
Late booker 6 5 14 8 0 0 0 0Unplanned pregnancy
7
6
6
4
0
0
0
0
* There were 178 comments made about clinical care issues; these comments are not included in this table but are included in
table 9.1 (Chapter 9).
7.4 Women’s approach to managing their diabetes
Women with diabetes may have an increased burden on their work and personal lives both before and during pregnancy, due to the additional issues which arise at this time. This can sometimes lead to a suboptimal approach to managing their diabetes.
7.4.1 Panel assessment of women’s approach to managing their diabetes
Enquiry panels assessed that 51% of 434 women had a suboptimal approach to managing their diabetes before pregnancy (62% of 216 cases and 40% of 218 controls) and 40% of 434 women had a suboptimal approach to managing their diabetes during pregnancy (55% of 216 cases and 26% of 218 controls). A suboptimal approach of the woman to managing her diabetes either before or during pregnancy was associated with poor pregnancy outcome (OR 4.9, 95% CI 2.7 - 8.8 and OR 3.9 , 95% CI 2.5 - 6.1 respectively, adjusted for maternal age and deprivation, see Chapter 6).

36
7.4.2 Panel comments on suboptimal approach of the woman to managing her diabetes
Panels made 283 comments for 222 women before pregnancy and 199 comments for 174 women during pregnancy (table 7.3). The main issues were non-adherence to medical advice, non-attendance at planned appointments, and social factors including unplanned pregnancy, poor motivation and poor understanding of diabetes.
Table 7.3Panel comments on suboptimal approach of the woman to managing her diabetes (table contains information following categorisation of free text)
Women assessed to have suboptimal approach to diabetes management before
pregnancy
Women assessed to have suboptimal approach to diabetes management during
pregnancy Good pregnancy
outcome(N=88)
Poor pregnancy outcome(N=134)
Good pregnancy outcome(N=56)
Poor pregnancy outcome(N=118)
No. of comments
% of women
No. of comments
% of women
No. of comments
% of women
No. of comments
% of women
Total comments* 110 167 65 106Medical, lifestyle, social factors†
42 -
65 - 16
-
38
-
Unplanned pregnancy or no contraception
14 16
22 16
1
2
2
2
Poorly motivated 8 9 8 6 4 7 2 2Poor education or understanding of diabetes
3
3
6
4
3
5
4
3
Other social or lifestyle factors
15 17
29 22
4
7
16 14
Medical factors 2 2 0 - 4 7 14 12Non-adherence to medical advice
32 36
45 34 27 48
38 32
Woman did not attend appointments
25 28
46 34 13 23
18 15
Woman actively chose not to follow medical advice
8
9
7
5
7 13
9
8
Duration or severity of diabetes
3
3
4
3
2
4
3
3
* There were 6 comments on clinical care before pregnancy and 28 comments on clinical care during pregnancy; these comments are
not included in the table. † A single woman could have more than one comment in the medical, social and lifestyle category, therefore % of women calculated
only for individual factors.
Social and lifestyle issues

37
7.5 Conclusions
One of the key fi ndings of the previous CEMACH report4 was that women with diabetes in England, Wales and Northern Ireland are poorly prepared for pregnancy, and many enter pregnancy with poor glycaemic control. Further exploration of the underlying issues for the 442 women in the enquiry has confi rmed that two thirds of women had suboptimal glycaemic control before and in early pregnancy, as assessed by enquiry panels. It is of concern that the main underlying factors appeared to be social issues and women’s approach to managing their diabetes.
Suboptimal glycaemic control and a suboptimal approach by women to diabetes management is associated with poor pregnancy outcome (see Chapter 6), and the above issues need to be considered as a matter of urgency if education programmes and preconception services are to reach those women who need support to improve their pregnancy outcomes. Further research is needed into the possible social, cultural and emotional factors affecting women’s preconception behaviour and how these can be addressed. Primary and secondary care providers are likely to need to work together with local communities in order to engage with women with diabetes before they enter pregnancy.
Some quotes from the panel discussions
Social and lifestyle issues:
• 'HbA1c 8.8. Communication problems (husband acted as interpreter). Cultural problems: woman fasting during festivals. Suspected educational problems.'
• 'HbA1c 9.3 at 4 weeks. Patient not monitoring. Overseas refugee, language diffi culties' . • ‘Lifestyle – hours of work - busy life.’ • 'Her obesity, social factors 'domestic turmoil'. No evidence of regular diabetes review - seems to
have lost contact with professionals.' • 'Unplanned pregnancy' . • Non-adherence to medical advice: • 'patient did not take dietary recommendations and did not take insulin regularly' . • 'HbA1c pre-pregnancy range 11.5 - 7.4%, but non-compliant with diet, forgets injection, regular
hypo's, lack of carbohydrates.' • 'patient did not test her levels for optimal care (average three per week)' .
Non-attendance at planned appointments:
• 'No pre-pregnancy care. 5 appointments sent by midwife and DSN. Not checking blood sugars' . • 'Inconsistent attendances at clinic. ? Lifestyle problems - single mother with 2 small children' . • HBA1c 10.4 at booking, brittle diabetic disease process. Woman was poor attender. Diabetic
coma three months prior to pregnancy' .

38
7.6 Recommendations
Clinical
1. Preconception and maternity services related to pregnancy should be easily accessible and responsive to all women with diabetes, and provide appropriate care and information.
2. There should be mechanisms in place to identify vulnerable communities and individuals, so that additional services can be provided as appropriate to women of childbearing age with diabetes, thereby ensuring optimal preconception care.
3. Providers of diabetes care should develop educational strategies that will enable all women of childbearing age with diabetes to prepare adequately for pregnancy .
Audit and research
4. Research should be carried out to: • identify the barriers to accessing preconception care • identify possible strategies to support self-care and pregnancy planning by women with diabetes.
References
1. National Service Framework for Diabetes (England) Standards. Department of Health: The Stationery Offi ce: London 2001.
2. Newham A, Ryan R. Prevalence of diagnosed diabetes mellitus in general practice in England and Wales, 1994 to 1998. Health Statistics Quarterly 14 Summer 2002.
3. The emergence of type 2 diabetes in childhood. Ehtisham S. Annals of Clinical Biochemistry 41(Pt1), Jan 2004: 10-6.
4. Confi dential Enquiry into Maternal and Child Health. Pregnancy in women with type 1 and type 2 diabetes in 2002-03, England, Wales and Northern Ireland. CEMACH: London; 2005.
5. Pregnancy outcomes in the Diabetes Complications Trial. The Diabetes Control and Complications Trial Research Group. Am J Obstet Gynecol; 1996 174: 1343-53.
6. Suhonen L, Hiilesmaa V, Teramo K. Glycaemic control during early pregnancy and fetal malformations in women with type 1 diabetes mellitus.. Diabetologia 2000; 43:79-82.
7. Kitzmiller JL, Gavin LA, Gin GD et al. Preconception care of diabetes. Glycemic control prevents congenital anomalies. JAMA: 1991 265: 731-6.
8. Diabetes UK Care Recommendation. Preconception care for women with diabetes. [http://www.diabetes.org.uk/About_us/Our_Views/Care_recommendations/Preconception_care_for_women_with_diabetes/] accessed 9 December 2006.
9. Lumley J, Watson L, Watson M, Bower C. Periconceptional supplementation with folate and/or multivitamins for preventing neural tube defects. Cochrane Pregnancy and Childbirth Group. Cochrane Database of Systematic Reviews, 2006 3.
10. Diabetes UK Care Recommendation. Folic acid supplementation in pregnancy. June 2005 [http://www.diabetes.org.uk/About_us/Our_Views/Care_recommendations/Folic_acid/supplementation_in_pregnancy/] accessed 9 December 2006.
Social and lifestyle issues

39
11.Dex S, Heather J (eds). Millennium Cohort Study First Survey: a user’s guide to initial fi ndings. Centre for Longitudinal Studies: London; 2004.
12. Ray JG, Singh G, Burrows RF. Evidence for suboptimal use of periconceptional folic acid supplements globally. BJOG 2004;111:399-408.
Commentary
Kirsty Samuel CEMACH lay panel assessor, Legal assessor, woman with type 1 diabetes and mother of two children.
As a lay panel assessor in the CEMACH diabetes enquiry, a woman with diabetes and a mother of two children, I feel this chapter highlights a number of important areas in explaining the unacceptably high number of adverse pregnancy outcomes for women with diabetes. However it is the reasons behind the fi gures that are of relevance in going forward. Why is suboptimal glycaemic control before and during pregnancy so common and why is the woman’s approach to managing her diabetes less than ideal? These two questions are, in my opinion, inextricably linked. The answer lies in the lack of accessible diabetes education and pre-pregnancy counselling. Women do not realise the importance of good control, and therefore do not ‘follow the advice given’, as it does not seem either signifi cant or achievable to them.
Women with diabetes of childbearing age need to be made more aware of the potential impact of poor glycaemic control on pregnancy outcomes. This information should be made available before pregnancy is seriously contemplated so that HbA1c levels can be reduced in preparation for pregnancy and unplanned pregnancies can be avoided. Women with type 2 diabetes particularly need to be targeted as many wrongly believe that their condition is less serious than type 1 diabetes and therefore will have less of an impact on pregnancy.
In conjunction with this counselling, women need to be told of the tangible benefi ts of good control and the greatly increased likelihood of having a healthy baby, as fear of complications and congenital anomalies also has a part to play in non-attendance at clinics.
As optimal glycaemic control is central to diabetes management in pregnancy, the means to achieve it has to be provided more effectively. The practicalities of attaining near perfect control for such a long period of time are frightening and off-putting to many women, who fi nd good control hard enough to achieve without the additional burden of pregnancy. Realistic targets must be set, and ongoing support and reassurance provided. Women need to know that their blood sugar levels will fl uctuate, and should be taught how to deal with these fl uctuations in practical terms - how to adjust their insulin, when and how to test their urine for ketones, and when to seek medical help. This will require a great deal of additional support and resources but by teaching women how to manage their glycaemic control more effectively, they will feel more involved, more secure and more able to deal with the realities of pregnancy.
Non-attendance at appointments will hopefully decrease in the future with increased public knowledge and awareness of the importance of adhering to medical advice. However this, along with a fear of being ‘told off’ for failing to meet targets, is only one element of non-attendance at clinics. Practical problems such as

40
long waiting times, especially for women with children, must be addressed. If more women actually saw all the relevant physicians during one clinic appointment this would reduce the time spent at the hospital, the burden of multiple appointments, and would increase women’s motivation to attend further appointments.
The fi ndings of this report all point to the need for a widespread diabetes education programme for all women with type 1 and type 2 diabetes of childbearing age and the development of an effective preconception service. While many women are far from ‘perfect’ in terms of knowledge, attitude and co-operation, this can only change in a signifi cant way if the basic education and support systems are in place. Women need to have the knowledge, and the means to achieve good control, so that they can increase their chances of a positive pregnancy outcome.
Social and lifestyle issues

41
8. Clinical care issues: preconception
Learning points
• In the CEMACH survey of maternity services, only 17% of maternity units in England, Wales and Northern Ireland reported providing structured multidisciplinary preconception care for women with diabetes. A quarter of women in the enquiry were reported to have had preconception care at a multidisciplinary hospital clinic.
• Two thirds of women in the enquiry had suboptimal preconception care. One of the main underlying issues was failure of health professionals to provide appropriate care such as preconception advice and higher dose folic acid. There was poor documentation of pre-pregnancy counselling.
• Suboptimal preconception care was associated with poor pregnancy outcome.
8.1 Introduction
Women with type 1 and type 2 diabetes represent a high-risk population during pregnancy. Clinicians have a responsibility to provide appropriate information, effective fetal and maternal surveillance, and timely health care interventions to achieve the best possible outcome for the woman and her baby. The Diabetes National Service Framework (NSF) emphasises the importance of an effective multidisciplinary team, both to support and empower women to plan their pregnancies, optimise glycaemic control before conception and improve the quality of antenatal care during pregnancy.1 However, the recent CEMACH descriptive study of 3808 pregnancies to women with type 1 and type 2 diabetes found that the majority of women with pre-existing diabetes in England, Wales and Northern Ireland are poorly prepared for pregnancy.2
8.2 Preconception care services
The increased risk of fetal congenital anomalies (with the main contributors being neural tube and cardiac defects)3 and perinatal death in babies of women with pre-existing diabetes2 can be minimised by ensuring good glycaemic control before and during pregnancy4 and by commencing high dose (5mg daily) folic acid before conception.5
During the CEMACH survey of maternity services (2004)6 , only 17% of maternity units in England, Wales and Northern Ireland reported that they provided a multidisciplinary diabetes preconception service. The CEMACH descriptive study found that only 35% of women were documented in the medical notes to have had pre-pregnancy counselling, with only a tenth of these seen in a formal preconception clinic.2 During the enquiry, general practitioners and adult diabetes services were also asked where preconception care had been provided.

42
Clinical care issues: preconception
8.2.1 Enquiry fi ndings
28% of 442 women in the enquiry were reported to have had preconception care in the adult diabetes clinic and 15% with their general practitioner. 26% were reported to have had care at a hospital multidisciplinary clinic, although it was not specifi ed as to whether this included a maternity component. For a further 4% the venue of preconception care was reported as ‘other’. Information about where preconception care was provided was not available for 27% of 442 women.
8.3 Pre-pregnancy counselling
Women need to be aware of the importance of pregnancy planning, good glycaemic control, and screening for specifi c diabetes complications before pregnancy, and should be supported to have a healthy diet and lifestyle. They are also more likely than the general maternity population to have medical intervention during pregnancy1,2 and this may be perceived as negative or frightening unless it is discussed at an early stage. It is therefore important to discuss pregnancy risks, planned pregnancy surveillance and any possible interventions, in the preconception period.
For each woman, the general practitioner or adult diabetes service was asked if there was documented evidence that these issues had been discussed in the 12 months before pregnancy.
8.3.1 Enquiry fi ndings
Just over half (53%, 203/382) of women in the enquiry were documented to have had a discussion about glycaemic control before pregnancy. Forty fi ve percent of 382 women were recorded to have had a discussion about diet and 46% of 380 women to have been reviewed by a dietitian before pregnancy. Contraception was recorded to have been discussed with only 32% of 380 women. Documentation of discussion about specifi c diabetes complications ranged from 24% of 381 women for nephropathy to 34% of 380 women for retinopathy. Alcohol intake was discussed with just over a fi fth of women (table 8.1).
Table 8.1Diabetes-related issues discussed with women before pregnancySpecifi c issue discussed Women with poor
pregnancy outcomen/N (%)
Women with good pregnancy outcome
n/N (%)
All women in the enquiryn/N (%)
Glycaemic control 100/197 (51) 103/185 (56) 203/382 (53)Diet 83/196 (42) 88/185 (48) 171/381 (45)Retinopathy 58/196 (30) 71/184 (39) 129/380 (34)Contraception 37/196 (19) 67/186 (36) 121/382 (32)Hypertension 44/196 (22) 52/184 (28) 96/380 (25)Nephropathy 46/196 (23) 47/185 (25) 93/381 (24)Alcohol intake 39/196 (20) 47/185 (25) 86/381 (23)
Sixty percent of 381 women (54% of 191 casesa and 62% of 187 controlsb) were recorded to have had a discussion about the need for increased pregnancy surveillance. However, discussion about fetal risks was documented for just 50% of 380 women (42% of 194 cases and 58% of 186 controls). The increased

43
chance of induction of labour was recorded as discussed with 42% of 380 women (32% of 193 cases and 51% of 187 controls); and the possibility of caesarean delivery was recorded as discussed with 46% of 381 women (39% of 194 cases and 53% of 187 controls). Women who did not have a discussion about fetal risks and the possibility of caesarean delivery were more likely to have a poor pregnancy outcome (OR 2.9, 95% CI 1.1, 8.2; and 2.4, 95% CI 1.0– 5.8 respectively, adjusted for maternal age and deprivation, see Chapter 6). Additional case-control analysis (see Appendices C, D and E) showed that the specifi c association was with fetal or neonatal death from 20 weeks gestation and not with fetal congenital anomaly. Women who did not receive appropriate information about the risks and strategies of management before pregnancy may have been less aware of the importance of optimal glycaemic control and the need for careful diabetes management through pregnancy.
a In this chapter, a case refers to a woman who had a poor pregnancy outcome, defi ned as a singleton baby with a major congenital anomaly who delivered at any gestation and/or a baby who died from 20 weeks gestation up to 28 days after delivery.
b In this chapter, a control refers to a woman who had a good pregnancy outcome, defi ned as a singleton baby without a congenital anomaly who survived to day 28 after delivery.
8.4 Screening for diabetes complications
Pregnancy can cause deterioration of diabetes complications such as retinopathy and renal disease, and screening for diabetes complications should be undertaken so that any necessary treatment can be provided prior to pregnancy.
8.4.1 Enquiry fi ndings
In the year before pregnancy, only 59% of 382 women (54% of 196 cases and 64% of 186 controls) had a retinal examination, and 58% of 382 women (53% of 195 cases and 63% of 187 controls) had a renal function test (creatinine, electrolytes and urea). Women who did not have a retinal examination in the year before pregnancy were more likely to have a poor pregnancy outcome (OR 2.3, 95% CI 1.2 - 4.5, adjusted for maternal age and deprivation, see Chapter 6). In the additional case-control analysis (see Appendices C, D and E) the specifi c association was with fetal or neonatal death from 20 weeks gestation and not with fetal congenital anomaly. These women may have been less likely to access diabetes services before pregnancy, either for cultural and societal reasons or due to inaccessible services; and may not have been aware of the importance of pregnancy preparation and the risks of diabetic pregnancy.
8.5 Panel assessment of preconception care
The enquiry panels assessed that 73% of 267 women (87% of 133 cases and 60% of 134 controls) had suboptimal preconception care. Women having suboptimal care were more likely to go on to have a poor pregnancy outcome (OR 5.2, 95% CI 2.7 - 10.1, adjusted for maternal age and deprivation, see Chapter 6). Additional case-control analysis (see Appendices C, D and E) showed an association with fetal congenital anomaly but not with fetal or neonatal death from 20 weeks in babies without a congenital anomaly.

44
Clinical care issues: preconception
8.5.1 Panel comments on suboptimal preconception care
Enquiry panels made 349 comments about preconception care. There were approximately equal numbers of comments about clinical care issues and social and lifestyle issues. The social and lifestyle issues identifi ed were identical to those described in Chapter 7, and are not reported again here. With respect to clinical care issues, health professionals did not take the opportunity to give preconception advice, including advice about contraception and folic acid, for 43% of women with suboptimal preconception care (table 8.2). There were concerns about screening and management of diabetes complications for nearly a tenth of the women.
Table 8.2Panel comments on suboptimal preconception care in women with pre-existing diabetes (table contains information following categorisation of free text)
Women assessed to have suboptimal preconception careGood pregnancy outcome
(N=80) Poor pregnancy outcome
(N=116) No. of
comments% of
womenNo. of
comments% of
womenTotal comments* 51 88Suboptimal clinical practice 47 - 74 - Folic acid not advised or prescribed 16 20 21 18 Did not take opportunity to give preconception advice 12 15 20 17 Poor screening or management of diabetes complications
8 10
9
8
Contraception not advised 6 8 10 9 Suboptimal review of medication 1 1 8 7 Other 4 5 7 6Communication between health professionals or between health service and woman
2
3
9
8
Miscellaneous 2 3 5 4
* There were 70 comments where the woman did not receive folic acid and 3 comments where she did not have preconception
care, where it was unclear as to whether this was a clinical care or social and lifestyle issue; these comments are not included in the
table. There were 137 comments on social and lifestyle issues, however these were identical to the themes underlying suboptimal
preconception glycaemic control (Chapter 7) and are not described further in this report.
8.6 Glycaemic control tests and targets
Regular testing of long term glycaemic control using glycosylated haemoglobin (HbA1c) is important in order to inform the management of glycaemic control (Diabetes NSF 2001).1 Targets for glycaemic control should be set and discussed with women before pregnancy, so that they can take control of managing their diabetes more effectively.

45
8.6.1 Enquiry fi ndings
Just over half (58%, 218/379) of women in the enquiry (54% of 192 cases and 62% of 187 controls) were reported to have had a test of glycaemic control in the 12 months before pregnancy. This compares favourably with the 37% reported for the full cohort of 3808 diabetic pregnancies.2 This may be because the enquiry data related to 12 months before conception rather than just 6 months as for the full cohort, and may also be due to the fact that information for the full cohort was dependent upon medical records at secondary care, while in the enquiry module the general practitioner and adult diabetes service were also approached for information.
Sixteen percent of 379 women did not have a glycaemic control test in the year before pregnancy, and for more than a quarter (27%, 101/379) of women there was no documentation available.
There was evidence that targets for glycaemic control had been set before pregnancy for only 28% of 369 women (24% of 188 cases and 32% of 181 controls); for 52% of women, there was no documentation in the medical records (either at primary or secondary care) about targets.
8.7 Panel assessment of glycaemic control before pregnancy
The enquiry panels assessed that 79% of 354 women with available documentation (88% of 187 cases and 69% of 167 controls) had suboptimal glycaemic control before pregnancy. Women who had suboptimal preconception glycaemic control were more likely to go on to have a poor pregnancy outcome (OR 3.89, 95% CI 2.15 - 7.02, adjusted for maternal age and deprivation, see Chapter 6).
8.7.1 Panel comments on suboptimal preconception glycaemic control
The majority of enquiry panel comments related to social and lifestyle issues, and these are described in Chapter 7. However, there were 48 comments about clinical care (table 8.3). The main concerns about clinical practice were a lack of timely clinical input by health professionals to improve glycaemic control, and also concerns that the insulin regime advised was inadequate to achieve tighter control. Suboptimal communication referred mainly to poor follow-up of non-attenders and women who had lost contact with the health service.

46
Clinical care issues: preconception
Table 8.3Panel comments about clinical care issues related to suboptimal preconception glycaemic control (table contains information following categorisation of free text)
Women assessed to have suboptimal preconception glycaemic control
Good pregnancy outcome(N=115)
Poor pregnancy outcome(N=165)
No. of comments % of women No. of comments % of womenTotal comments*† 20 28
Suboptimal clinical practice 15 13 11 7Suboptimal communication 5 4 16 10
Miscellaneous 0 0 1 1
* There were 81 comments where the issues were not described by panels and 18 comments where there was a lack of
preconception care with the reason being unclear to panels; these comments are not included in this table.
† 187 comments were made on social and lifestyle issues; these are described in Chapter 7.
8.8 Conclusions
Prior to pregnancy, clinical support and information for women appeared to be poor:
• Just over half of women had a retinal examination and a renal function test in the 12 months before pregnancy.
• Only a quarter of women had evidence of glycaemic control targets being set and just over half had documented evidence of a discussion about glycaemic control in the 12 months prior to pregnancy.
• Less than half of women had documented evidence that diet, contraception, or diabetes complications had been discussed in the 12 months before pregnancy.
• Less than half of women were documented to be informed about fetal risks, the increased chance of induction of labour and the possibility of caesarean delivery.
• Documentation of pre-pregnancy counselling was poor.
Enquiry panels found that health professionals often missed the opportunity to provide pre-pregnancy counselling, and did not appear to advise about or prescribe folic acid or contraception before pregnancy. There were also concerns about a lack of timely input by the diabetes team and whether insulin regimes in the preconception period were appropriate to achieve tight glycaemic control.
These fi ndings suggest that the majority of women with diabetes are not having effective annual diabetes reviews, and that the maternity component of preconception care (contraception, folic acid, information about the impact of diabetes on pregnancy) is missing for many women.
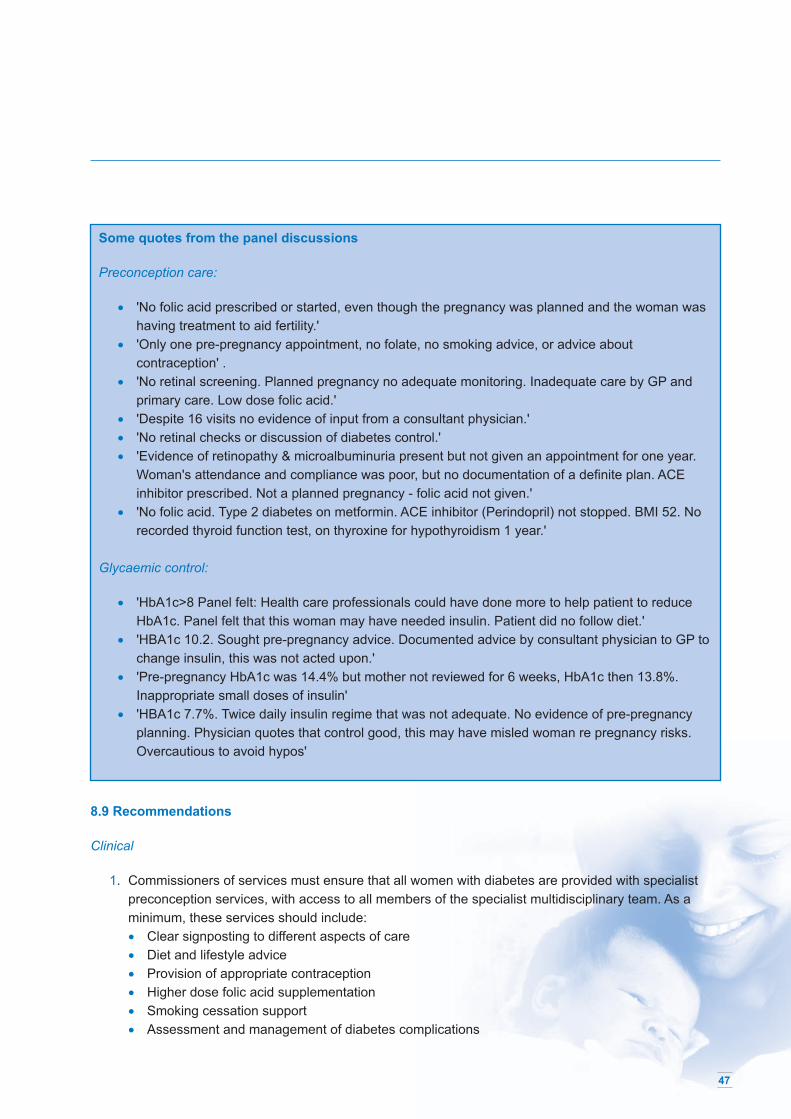
47
Some quotes from the panel discussions
Preconception care:
• 'No folic acid prescribed or started, even though the pregnancy was planned and the woman was having treatment to aid fertility.'
• 'Only one pre-pregnancy appointment, no folate, no smoking advice, or advice about contraception' .
• 'No retinal screening. Planned pregnancy no adequate monitoring. Inadequate care by GP and primary care. Low dose folic acid.'
• 'Despite 16 visits no evidence of input from a consultant physician.' • 'No retinal checks or discussion of diabetes control.' • 'Evidence of retinopathy & microalbuminuria present but not given an appointment for one year.
Woman's attendance and compliance was poor, but no documentation of a defi nite plan. ACE inhibitor prescribed. Not a planned pregnancy - folic acid not given.'
• 'No folic acid. Type 2 diabetes on metformin. ACE inhibitor (Perindopril) not stopped. BMI 52. No recorded thyroid function test, on thyroxine for hypothyroidism 1 year.'
Glycaemic control:
• 'HbA1c>8 Panel felt: Health care professionals could have done more to help patient to reduce HbA1c. Panel felt that this woman may have needed insulin. Patient did no follow diet.'
• 'HBA1c 10.2. Sought pre-pregnancy advice. Documented advice by consultant physician to GP to change insulin, this was not acted upon.'
• 'Pre-pregnancy HbA1c was 14.4% but mother not reviewed for 6 weeks, HbA1c then 13.8%. Inappropriate small doses of insulin'
• 'HBA1c 7.7%. Twice daily insulin regime that was not adequate. No evidence of pre-pregnancy planning. Physician quotes that control good, this may have misled woman re pregnancy risks. Overcautious to avoid hypos'
8.9 Recommendations
Clinical
1. Commissioners of services must ensure that all women with diabetes are provided with specialist preconception services, with access to all members of the specialist multidisciplinary team. As a minimum, these services should include: • Clear signposting to different aspects of care • Diet and lifestyle advice • Provision of appropriate contraception • Higher dose folic acid supplementation • Smoking cessation support • Assessment and management of diabetes complications

48
Clinical care issues: preconception
• Setting of glycaemic control targets and regular discussion of results of self-monitoring, to enable the woman to achieve control that is as near to normal as possible before conception
• Discussion of diabetes pregnancy risks and expected management strategies • Clear documentation of care and counselling, ideally using a standard template.
Audit and research
2. Preconception services should be audited to ensure that minimum standards are being met.
References
1. National Service Framework for Diabetes (England) Standards. Department of Health. The Stationery Offi ce: London: 2001.
2. Confi dential Enquiry into Maternal and Child Health. Pregnancy in women with type 1 and type 2 diabetes in 2002-03, England, Wales and Northern Ireland. CEMACH: London; 2005.
3. Macintosh M, Fleming K, Bailey J, Doyle P, Modder J, Acolet D, et al. Perinatal mortality and congenital anomalies in babies of women with type 1 or type 2 diabetes in England, Wales and Northern Ireland: population based study. BMJ, 22 Jul 2006: 333 (7560):177.
4. Pregnancy outcomes in the Diabetes Complications Trial. The Diabetes Control and Complications Trial Research Group. Am J Obstet Gynecol; 1996; 174: 1343-53.
5. Lumley J, Watson L, Watson M, Bower C. Cochrane Pregnancy and Childbirth Group. Periconceptional supplementation with folate and/or multivitamins for preventing neural tube defects. Cochrane Database of Systematic Reviews. 2006, 3.
6. Confi dential Enquiry into Maternal and Child Health. Survey of maternity services for women with type 1 and type 2 diabetes in 2002-03, England, Wales and Northern Ireland. CEMACH: London; 2005.
Commentary
Sue Roberts National Clinical Director for DiabetesConsultant Diabetes Physician, North Tyneside General Hospital
This chapter paints a disturbing picture of a lack of diabetes preconception care services across England, Wales and Northern Ireland, and a lack of knowledge both on the part of healthcare professionals and women with diabetes, about the importance of preconception care. The evidence indicates that preconception care is vital in trying to ensure that both mothers and babies have as safe and healthy a pregnancy and birth as possible. The fi ndings in this report suggest that when there is suboptimal preconception care, pregnancy outcomes can be devastating for the mother-to-be and her baby.
Adult diabetes services and primary care professionals are often in contact with women prior to pregnancy, and therefore have a real responsibility to provide relevant information and monitoring, both in the immediate pre-pregnancy period and as part of women’s routine care. In the current situation, many women are missing out on information and monitoring as part of their routine care on a year by year basis.

49
Apart from the explanation of pregnancy risks and the need to maintain good glycaemic control, some drugs which may be prescribed for women with type 2 diabetes, such as ACE inhibitors, are harmful in pregnancy. This emphasis on informing women of the risks and the preventive actions they can take, means that diabetes services for women of child bearing age should be planned in a slightly different way to other diabetes services. This is supported by the recently developed diabetes workforce competenciesc that specifi cally address the needs of women of child bearing age with diabetes, as well as those actively seeking to become pregnant, and those who are already pregnant.
The current absence of structured preconception care needs to be set within the context of the increasing number of women of child bearing age with diabetes – mainly type 2 diabetes. This rise has been fuelled by a number of factors, including the increasing obesity of the general population, changing ethnic demographics and reducing levels of exercise and fi tness. An additional factor is that women from ethnic minority groups with an increased risk of type 2 diabetes, tend to have larger families. The General Household Survey 1988-2001d found that women of Bangladeshi origin tended on average to have families twice as large as the White population.
The Diabetes National Service Framework (NSF) recommends that all diabetes services should be effectively planned, but it is clear that this is currently not the case for the majority of local services across the country, either for routine or preconception care. While pregnancy in women with diabetes used to be considered a specialist activity, there is now a critical need for services to be planned jointly in primary as well as secondary care in order to achieve integrated models of preconception and pregnancy care. This is an immense challenge, and diabetes networks have a crucial role in supporting this planning and commissioning process by enabling each of the stakeholders to identify needs and priorities.
Although it may be diffi cult to accept, we must understand that pregnancy for women with diabetes will always be high risk. However, it is our responsibility to discover new ways of working with women that will reduce the risks and ensure the best possible outcomes, both for them and their babies.
c Skills for Health, Diabetes Workforce Competencies, 2006. d Sources: Census 2001, Offi ce for National Statistics; General Register Offi ce for Scotland.

50
9. Clinical care issues: pregnancy
Learning points
• Suboptimal glycaemic control during pregnancy was associated with poor pregnancy outcome. The main clinical issues identifi ed were failure to change insulin regimes to achieve good glycaemic control, and a non-responsive local strategy of diabetes antenatal care.
• Suboptimal maternity care and diabetes care (excluding glycaemic control) during pregnancy was associated with poor pregnancy outcome. Underlying issues included suboptimal fetal and maternal surveillance and suboptimal monitoring of diabetes complications.
• For babies with antenatal evidence of macrosomia, suboptimal antenatal fetal surveillance was associated with poor pregnancy outcome, with the main issues being lack of timely follow up and poor interpretation of ultrasound scans.
• Women who had a poor pregnancy outcome were more likely not to receive postnatal contraceptive advice and more likely to have suboptimal postnatal diabetes care.
9.1 Introduction
During pregnancy, there are often rapid changes in glycaemic control due to increasing insulin resistance. Suboptimal glycaemic control has been associated with fetal congenital anomaly,1 an increased risk of miscarriage2 and fetal macrosomia;3 and there may also be placental insuffi ciency (particularly associated with nephropathy) resulting in fetal growth restriction. Women themselves may have complications including hypoglycaemia, retinopathy, nephropathy, diabetic ketoacidosis and pre-eclampsia. Clinicians and health services have an important role in building relationships with women before and during pregnancy, empowering them to manage their diabetes, and providing effective maternal and fetal surveillance.
9.2 Glycaemic control during pregnancy, labour and delivery
Tight glycaemic control during pregnancy is one of the main principles of management for women with pre-existing diabetes. During labour and delivery, good glycaemic control should be maintained to reduce the risk of neonatal hypoglycaemia.4
The 2005 CEMACH report5 on pregnant women with pre-existing diabetes found that although approximately three quarters of 2732 women had a glycosylated haemoglobin test (HbA1c) performed during the fi rst trimester of pregnancy, just over a third of these women achieved an HbA1c value less than 7%. This improved in the second and third trimesters, with two thirds of women with an HbA1c test achieving a result less than 7%.
9.2.1 Enquiry fi ndings
Enquiry panels assessed that the majority of women in the enquiry had suboptimal glycaemic control during pregnancy (84% of 204 cases and 61% of 192 controls in the fi rst trimester; 71% of 205 cases and 37% of 209 controls after the fi rst trimester). Suboptimal glycaemic control at any time during pregnancy

51
was associated with poor pregnancy outcome (OR 3.4, 95% CI 2.1 - 5.7 in fi rst trimester and OR 5.2, 95% CI 3.3 - 8.2 after fi rst trimester, both ORs adjusted for maternal age and deprivation, see Chapter 6).
Fifty percent (176/354) of women (49% of 162 cases, 48% of 202 controls) with ongoing pregnancies after 24 weeks were assessed by panels to have suboptimal glycaemic control during labour and/or delivery.
9.2.2 Panel comments on suboptimal glycaemic control during pregnancy
The majority of panel comments related to social and lifestyle issues and these are described in Chapter 7. However, there were 178 panel comments made on clinical care issues, with the main concern being suboptimal clinical practice (table 9.1). This included failure to change insulin regimes to achieve good glycaemic control, and a non-responsive local strategy of diabetes antenatal care, including lack of support, failure to follow up women, and poor integration of the care provided by different disciplines. Problems within the diabetes multidisciplinary team included lack of involvement of consultant obstetricians or diabetes physicians, and lack of dietetic input.
Table 9.1Panel comments on suboptimal glycaemic control during pregnancy in women with type 1 and type 2 diabetes (table contains information following categorisation of free text)
Women assessed to have suboptimal glycaemic control in 1st trimester
Women assessed to have suboptimal glycaemic control after 1st trimester
Good pregnancy outcome(N=118)
Poor pregnancy outcome(N=171)
Good pregnancy outcome(N=76)
Poor pregnancy outcome(N=146)
No. of comments
% of women
No. of comments
% of women
No. of comments
% of women
No. of comments
% of women
Total comments* 34 - 46 35 - 63Suboptimal clinical practice 30 - 32
- 27 - 47 -
Failure to change insulin regime 13 11
9
5 11 14 18 12
Non-responsive local strategy of diabetes antenatal care
7
6 9 5 9 12 15 10
Problems within diabetes multidisciplinary team
8 7 4 2 6 8 10 7
Lack of preconception care 2 2 5 3 0 - 2 1Inappropriate management (other than insulin)
0 - 4 2 1 1 2 1
Did not follow guideline 0 - 1 1 0 - 0 -Poor documentation / communication
4 3 14 8 8 11 16 11
* 248 comments were made on social and lifestyle issues. In 198 comments, panels did not describe the specifi c issue underlying
suboptimal glycaemic control.

52
9.2.3 Panel comments on suboptimal glycaemic control during labour and delivery
The guidance given to enquiry panels was that optimal glycaemic control during labour and delivery referred to blood glucose values between 3.5 – 8 mmols/l, although this was not prescriptive. The target range recommended by Diabetes UK for labour and delivery is 4– 6 mmol/l6 and the Diabetes NSF recommends tight blood glucose control during labour.7
Panels made 211 comments for 176 women about suboptimal glycaemic control during labour and delivery. The main issue identifi ed was suboptimal clinical practice, particularly concerns about inadequate intravenous insulin/dextrose regimes, delays in commencing intravenous regimes and the subsequent management of those regimes (table 9.2).
Table 9.2Panel comments on suboptimal glycaemic control during labour and delivery (table contains information following categorisation of free text)
Women assessed to have suboptimal glycaemic control during labour and delivery
Good pregnancy outcomen=96
Poor pregnancy outcomen=80
No. of comments % of women No. of comments % of womenTotal comments* 98 - 70 -Suboptimal clinical practice 90 - 62 - Inappropriate intravenous insulin/ dextrose regime 26 27 8 11 Delay in starting intravenous insulin/ dextrose regime 19 19 14 20 Poor management of sliding scale 17 17 17 24 Suboptimal blood glucose monitoring 15 15 10 14 Hypoglycaemia due to clinical practice 2 2 4 6 Poor management of hypoglycaemia 4 4 2 3 Other clinical practice issues 7 7 7 10Communication issues 4 4 6 9Resource issues 2 2 0 0Patient issues 2 2 2 3
* The underlying issues were not described in 43 comments made by panels.
9.3 Glycaemic control targets
It is important that women should be informed of what short and long term glycaemic control targets they are trying to achieve, to enable them to optimise their control.
9.3.1 Enquiry fi ndings
Target ranges for glycaemic control were documented in the medical records or local hospital guidelines for just over half of women during pregnancy (53%, 232/440 of women in the fi rst trimester and 54%, 239/441
Clinical care issues: pregnancy

53
of women after the fi rst trimester up to labour and delivery). This improved during labour and delivery, with 79% of the 384 women delivering after 24 weeks having a target range documented.
When a target range was present during pregnancy, there was evidence that this had been communicated to the woman for only 48% of the 232 women in the fi rst trimester and 51% of the 239 women after the fi rst trimester.
9.4 Diabetes care - monitoring for diabetes complications
In addition to achieving good glycaemic control during pregnancy, women with diabetes also need ongoing monitoring and treatment for diabetes complications. There may be development of new retinopathy or deterioration of pre-existing retinopathy during pregnancy,8 and women should have a full retinal assessment during the fi rst trimester,7 with prompt referral to an ophthalmologist if an abnormality is found.
Women with diabetes nephropathy are at increased risk of hypertensive disease of pregnancy, adverse fetal outcomes, and progressive deterioration of renal disease.9-11 Enquiry panels were not provided with an explicit standard of monitoring for nephropathy, but were provided with the guidance that appropriate monitoring included testing for microalbuminuria (incipient nephropathy), protein dipstick testing of urine or serum creatinine.
9.4.1 Enquiry fi ndings
Just over half of women (59%, 258/441), had a retinal assessment documented during the fi rst trimester or at the fi rst booking visit. Only 55% of these 258 assessments were recorded to have been done through dilated pupils; for 40% of women, details about the retinal assessment procedure were not documented. Seventy eight percent (343/441) of women were monitored for signs of nephropathy. Lack of monitoring for nephropathy was associated with poor pregnancy outcome (OR 1.9, 95% CI 1.1 - 3.3, adjusted for maternal age and deprivation, see Chapter 6). However, in the additional case-control analysis (see Appendices C, D and E), lack of monitoring for nephropathy was associated only with fetal congenital anomaly and not with fetal or neonatal death after 20 weeks gestation, and is therefore unlikely to have been causative for poor pregnancy outcome. Nephropathy itself was not associated with poor pregnancy outcome.
Enquiry panels assessed that 60% (264/440) of women (72% of 204 cases and 58% of 204 controls) had suboptimal diabetes care (care other than glycaemic control management) during pregnancy. These women were more likely to have a poor pregnancy outcome (OR 1.7, 95% CI 1.1 - 2.6, adjusted for maternal age and deprivation, see Chapter 6). Additional case-control analysis (see Appendices C, D and E) showed an association with fetal or neonatal death from 20 weeks gestation and not with fetal congenital anomaly.
9.4.2 Panel comments on suboptimal diabetes care in pregnancy
Panels made 432 comments for 264 women about suboptimal diabetes care in pregnancy, with the majority of these being concerns about suboptimal clinical practice (table 9.3).

54
Table 9.3Panel comments on suboptimal diabetes care (excluding glycaemic control) in pregnancy (table contains information following categorisation of free text)
Women assessed to have suboptimal diabetes care in pregnancy Good pregnancy outcome
n=118 Poor pregnancy outcome
n=146 No. of comments % of women No. of comments % of women
Total comments* 174 - 224 -Suboptimal clinical practice 159 196 Lack of /suboptimal retinal screening/ management 72 61 71 49 Suboptimal renal function monitoring/ management 38 32 49 34 Lack of multidisciplinary involvement 25 21 31 21 Lack of senior input 2 2 7 5 Poor management of glycaemic control during steroid administration 1 1 1 1 Suboptimal management of pre-pregnancy medication 0 0 2 1 Suboptimal management of other complications e.g. proteinuria +/-BP, ketonuria
6 5 12 8
Infrequent clinic appointments 2 2 9 6 Other 13 11 14 10Communication issues 5 4 9 6Patient factors 10 8 19 13
* 34 comments were about social and lifestyle issues.
9.5 Antenatal fetal surveillance
Careful fetal surveillance is important in diabetic pregnancy, including serial ultrasound scans for fetal growth during the third trimester and consideration of cardiotocograph monitoring from 36 weeks.7 Enquiry panels assessed that fetal surveillance was suboptimal for 20% of 37 babies with antenatal evidence of fetal growth restriction and for 45% of 129 babies with antenatal evidence of macrosomia (defi ned for panel enquiries as fetal size >90th centile). For babies with antenatal evidence of macrosomia, suboptimal fetal surveillance was associated with poor pregnancy outcome (OR 5.3, 95% CI 2.4 -12.0, adjusted for maternal age and deprivation, see Chapter 6). Additional case-control analysis (see Appendices C, D and E) showed an association with fetal or neonatal death after 20 weeks gestation and not with fetal congenital anomaly.
Clinical care issues: pregnancy

55
9.5.1 Panel comments on suboptimal antenatal fetal surveillance
Panels made 89 comments for 65 women about suboptimal antenatal fetal surveillance. The main issue for both macrosomic and growth restricted babies was a lack of timely follow-up (table 9.4). For macrosomic babies, there were also concerns about poor interpretation of ultrasound scans and about actions taken as a response to tests.
Table 9.4Panel comments on suboptimal antenatal fetal surveillance in women with pre-existing diabetes (table contains information following categorisation of free text)
Babies assessed to have suboptimal antenatal fetal surveillance Growth restricte
babies(N=7)
Macrosomicbabies(N=58)
No. of comments % of babies No. of comments % of babiesTotal comments* 8 - 74 - Suboptimal clinical practice 8 - 73 - Lack of timely follow-up 6 86 47 81 Should have had additional investigations 0 - 2 3 Poor interpretation of surveillance 1 14 11 19 Incorrect actions taken 1 14 11 19 Poor standard of investigative procedure 0 - 2 3Poor communication 0 - 1 2
* There were 4 comments where the issues were not described by panels, and 3 comments about social and lifestyle issues.
9.6 Management of antenatal steroid administration
Women with pre-existing diabetes have a higher preterm delivery and spontaneous preterm labour rate compared to the general maternity population.5 Women who are at risk of preterm delivery and require prophylactic antenatal steroids need careful management of glycaemic control to minimise the risk of diabetic ketoacidosis, and it is recommended that additional insulin should be given during this time.6,7
9.6.1 Management of glycaemic control with antenatal steroids
In the 2005 CEMACH study, 70% of women delivering a live born baby before 34 weeks received prophylactic steroids.5
In the enquiry, 56 women delivering before 34 weeks gestation received antenatal steroids. The majority of these women (68%, 38/56), were commenced on an intravenous insulin and dextrose infusion during treatment. However, a tenth of women did not have any change in glycaemic control management despite having been given antenatal steroids (table 9.5).
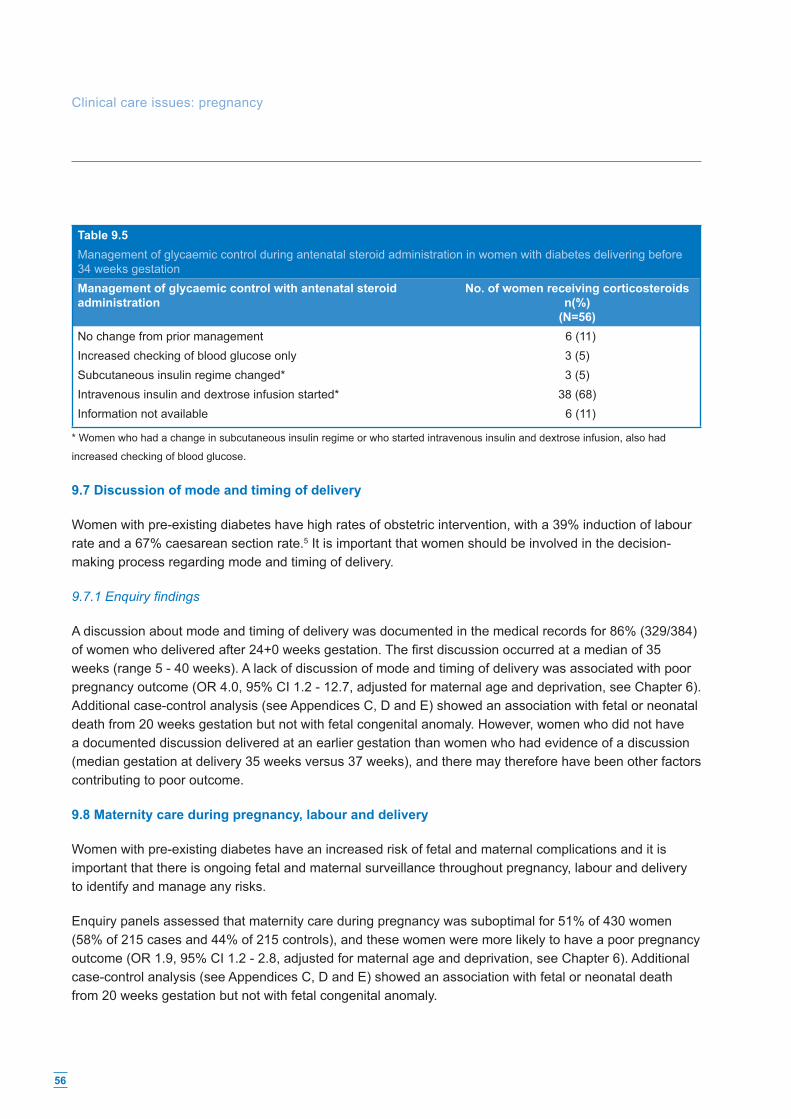
56
Table 9.5Management of glycaemic control during antenatal steroid administration in women with diabetes delivering before 34 weeks gestationManagement of glycaemic control with antenatal steroid administration
No. of women receiving corticosteroidsn(%)
(N=56) No change from prior management 6 (11)Increased checking of blood glucose only 3 (5)Subcutaneous insulin regime changed* 3 (5)Intravenous insulin and dextrose infusion started* 38 (68)Information not available 6 (11)
* Women who had a change in subcutaneous insulin regime or who started intravenous insulin and dextrose infusion, also had
increased checking of blood glucose.
9.7 Discussion of mode and timing of delivery
Women with pre-existing diabetes have high rates of obstetric intervention, with a 39% induction of labour rate and a 67% caesarean section rate.5 It is important that women should be involved in the decision-making process regarding mode and timing of delivery.
9.7.1 Enquiry fi ndings
A discussion about mode and timing of delivery was documented in the medical records for 86% (329/384) of women who delivered after 24+0 weeks gestation. The fi rst discussion occurred at a median of 35 weeks (range 5 - 40 weeks). A lack of discussion of mode and timing of delivery was associated with poor pregnancy outcome (OR 4.0, 95% CI 1.2 - 12.7, adjusted for maternal age and deprivation, see Chapter 6). Additional case-control analysis (see Appendices C, D and E) showed an association with fetal or neonatal death from 20 weeks gestation but not with fetal congenital anomaly. However, women who did not have a documented discussion delivered at an earlier gestation than women who had evidence of a discussion (median gestation at delivery 35 weeks versus 37 weeks), and there may therefore have been other factors contributing to poor outcome.
9.8 Maternity care during pregnancy, labour and delivery
Women with pre-existing diabetes have an increased risk of fetal and maternal complications and it is important that there is ongoing fetal and maternal surveillance throughout pregnancy, labour and delivery to identify and manage any risks.
Enquiry panels assessed that maternity care during pregnancy was suboptimal for 51% of 430 women (58% of 215 cases and 44% of 215 controls), and these women were more likely to have a poor pregnancy outcome (OR 1.9, 95% CI 1.2 - 2.8, adjusted for maternal age and deprivation, see Chapter 6). Additional case-control analysis (see Appendices C, D and E) showed an association with fetal or neonatal death from 20 weeks gestation but not with fetal congenital anomaly.
Clinical care issues: pregnancy

57
During labour and delivery, the majority of women were assessed to have optimal maternity care. Care was assessed to be suboptimal for 35% of 382 women , with no association between suboptimal care and pregnancy outcome (see Chapter 6).
9.8.1 Panel comments on suboptimal maternity care during pregnancy
Panels made 378 comments for 228 women, with nearly all of these being about clinical care issues. The two largest categories related to suboptimal fetal surveillance (ultrasound monitoring of fetal growth and fetal heart rate monitoring) and management of maternal risks. Problems with the antenatal diabetes multidisciplinary team, communication and the level of seniority of obstetric staff involved in the woman’s care were also noted (table 9.6).
Table 9.6Panel comments on suboptimal maternity care during pregnancy for women with pre-existing diabetes (table contains information following categorisation of free text)
Women assessed to have suboptimal maternity care during pregnancy
Good pregnancy outcome(N=95)
Poor pregnancy outcome(N=125)
No. of comments % of women No. of comments % of womenTotal comments* 147 - 209 -Suboptimal clinical practice 141 - 178 - Fetal surveillance 47 49 58 46 Management of maternal risks 29 31 39 31 Problem with the multidisciplinary team 17 18 28 22 Need for more senior obstetrician input 11 12 24 19 Mode and timing of delivery 20 21 10 8 No plan of care 7 7 15 12 Steroids not given/full course not completed 4 4 2 2 Other 6 6 2 2Communication 6 6 31 25
* 22 comments were made about social and lifestyle issues; these comments are not included in this table.
9.8.2 Panel comments on suboptimal maternity care during labour and delivery
Enquiry panels made 245 comments for 150 women. The most frequent issues noted were poor management of maternal risks, inappropriate decisions relating to delivery and inadequate fetal surveillance during labour or delay in acting on signs of fetal compromise (table 9.7).
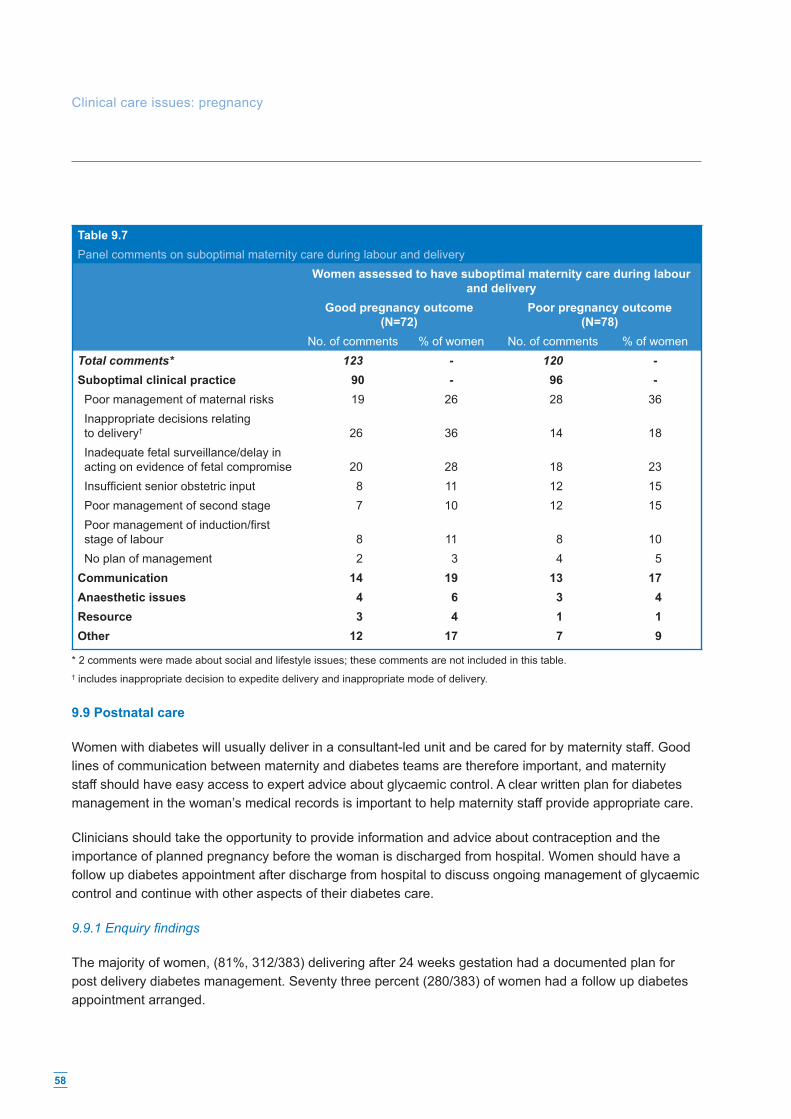
58
Table 9.7Panel comments on suboptimal maternity care during labour and delivery
Women assessed to have suboptimal maternity care during labour and delivery
Good pregnancy outcome(N=72)
Poor pregnancy outcome(N=78)
No. of comments % of women No. of comments % of womenTotal comments* 123 - 120 -Suboptimal clinical practice 90 - 96 - Poor management of maternal risks 19 26 28 36 Inappropriate decisions relating to delivery† 26 36 14 18 Inadequate fetal surveillance/delay in acting on evidence of fetal compromise 20 28 18 23 Insuffi cient senior obstetric input 8 11 12 15 Poor management of second stage 7 10 12 15 Poor management of induction/fi rst stage of labour 8 11 8 10 No plan of management 2 3 4 5Communication 14 19 13 17Anaesthetic issues 4 6 3 4 Resource 3 4 1 1 Other 12 17 7 9
* 2 comments were made about social and lifestyle issues; these comments are not included in this table. † includes inappropriate decision to expedite delivery and inappropriate mode of delivery.
9.9 Postnatal care
Women with diabetes will usually deliver in a consultant-led unit and be cared for by maternity staff. Good lines of communication between maternity and diabetes teams are therefore important, and maternity staff should have easy access to expert advice about glycaemic control. A clear written plan for diabetes management in the woman’s medical records is important to help maternity staff provide appropriate care.
Clinicians should take the opportunity to provide information and advice about contraception and the importance of planned pregnancy before the woman is discharged from hospital. Women should have a follow up diabetes appointment after discharge from hospital to discuss ongoing management of glycaemic control and continue with other aspects of their diabetes care.
9.9.1 Enquiry fi ndings
The majority of women, (81%, 312/383) delivering after 24 weeks gestation had a documented plan for post delivery diabetes management. Seventy three percent (280/383) of women had a follow up diabetes appointment arranged.
Clinical care issues: pregnancy

59
Just 52% of 383 women (38% of 164 cases and 63% of 219 controls) were documented to have had contraceptive advice provided before discharge from hospital. Women who had had a poor pregnancy outcome were more likely not to receive contraceptive advice than women with a good pregnancy outcome (OR 4.2, 95% CI 2.4 - 7.4, adjusted for maternal age and deprivation, see Chapter 6)
Enquiry panels assessed that 57% of 364 women (66% of 153 cases and 50% of 211 controls) delivering after 24 weeks gestation had suboptimal postnatal diabetes care and advice. Women who had a poor pregnancy outcome were more likely to have suboptimal postnatal diabetes care (adjusted OR 1.8, 95% CI 1.2 - 2.7, adjusted for maternal age and deprivation, see Chapter 6).
9.9.2 Panel comments on suboptimal postnatal diabetes care
Panels made 267 comments for 207 women, with the majority of these being related to suboptimal clinical care. Concerns included management of glycaemic control after delivery, inadequate plans of care at discharge from hospital, lack of contact with the diabetes team and no contraceptive advice given to women (table 9.8).
Table 9.8Panel comments about suboptimal postnatal diabetes care (table contains information following categorisation of free text)
Women assessed to have suboptimal postnatal diabetes care Good pregnancy outcome
(N=106) Poor pregnancy outcome
(N=101) No. of comments % of women No. of
comments% of women
Total comments* 95 129Suboptimal clinical practice 95 - 129 -Suboptimal management of glycaemic control 40 38 31 31Inadequate plan of care at discharge 24 23 36 36Lack of contact with diabetes team 15 14 30 30No contraceptive advice 14 13 29 29Other 2 2 3 3
* There were 32 comments where the underlying issues were not described by panels, and 11 comments about social and lifestyle
issues; these comments are not included in this table.
9.10 Conclusions
It is encouraging that there were a number of areas of good practice identifi ed:
• 78% of women were monitored for nephropathy • 79% of women had evidence of glycaemic control targets for labour and delivery • 68% of women receiving antenatal steroids had an insulin and dextrose infusion commenced • 86% of women had a documented discussion about timing and mode of delivery • 65% of women had optimal maternity care during labour and delivery • 81% of women had a written plan for post-delivery diabetes management.

60
However, there were a number of concerns about clinical care during pregnancy. Nearly half of women in the enquiry did not have a retinal examination during the fi rst trimester and there were concerns about failure to change insulin regimes to achieve good glycaemic control, and a non-responsive local strategy of diabetes antenatal care. A tenth of women did not have any additional interventions to ensure good glycaemic control during antenatal steroid administration. Fetal surveillance was suboptimal for nearly half of babies with antenatal evidence of macrosomia, and this was associated with poor pregnancy outcome, specifi cally fetal or neonatal death from 20 weeks gestation (see Chapter 6 and Appendices C, D and E).
It is disappointing that women who had a poor pregnancy outcome were more likely to have suboptimal diabetes care after delivery and were less likely to receive contraceptive advice prior to discharge from hospital. It is recognised that clinicians are likely to need to provide more intensive counselling to women who have had a fetal loss, stillbirth or a baby born with a congenital anomaly, and discussion about contraception in this situation can be diffi cult. However, it is important that diabetes care is not compromised for these women, and discussion about future pregnancy preparation may help to minimise the risk of adverse pregnancy outcome in the future.
Some quotes from the panel discussions
Suboptimal glycaemic control during pregnancy:
• 'HbA1C 10.7% - should have been put on insulin.' • 'At 36 weeks HbA1c 8.6%. Insulin was changed to QDS at 28 weeks this should have
been sooner.' • 'Fragmented Care, locum consultants. No notes from Diabetologist.'
Suboptimal glycaemic control during labour and delivery:
• 'Sliding scale not commenced until well established in labour and blood glucose high. Fixed sliding scale that did not adequately maintain blood glucose at acceptable levels.'
• 'The pump became disconnected, the 3 way tap was turned off. No one noticed for some time until her BMs went up considerably.'
Diabetes care (excluding glycaemic control):
• ‘Inadequate nephropathy monitoring - no regular urine testing, only 2 dipstick urine tests. No retinal screening after 13 weeks.’
• ‘Lack of evidence of holistic care, seemed to be outside multidisciplinary service, no information about diabetes nurse specialist, dietetic or community team’s input, no joint clinic.’
Antenatal fetal surveillance:
• ‘Noted increase in abdominal circumference with previous history of IUD and the next scan is arranged for 4 weeks. There should have been increased surveillance.’
Clinical care issues: pregnancy

61
• ‘No serial growth scans performed (not in protocol either). The method of management; CTGs only, inappropriate.’
• 'Stated USS good growth - despite AC >97th centile.'
Maternity care:
• ‘Given steroids as outpatient.’ • ‘Signifi cant hypertension was never treated; pre-eclampsia symptoms were not addressed.’ • ‘This lady was admitted to hospital on several occasions with vomiting, but was not reviewed by
the medical or diabetic team. The diagnosis of DKA was not picked up on one of her admissions.’
Postnatal care
• 'Given pre-delivery dose of insulin post delivery, despite the Registrar recording "use pre-delivery dose". The mother became hypoglycaemic.'
• 'One BM stix in 3 days, no evidence of plan of care and contraceptive advice left to GP.'
9.11 Recommendations
Clinical
1. An individualised care plan covering the pregnancy and postnatal period up to 6 weeks should be clearly documented in the notes, ideally using a standard template. The plan may require changes to be made depending on the clinical circumstances through pregnancy. As a minimum, the care plan should include: • Targets for glycaemic control • Retinal screening schedule • Renal screening schedule • Fetal surveillance • Plan for delivery • Diabetes care after delivery.
2. The care plan should be implemented from the outset of pregnancy by a multidisciplinary team present at the same time in the same clinic. As a minimum, the multidisciplinary team should include an obstetrician, diabetes physician, diabetes specialist nurse, diabetes midwife and dietitian.
3. Pregnancies with ultrasound evidence of macrosomia should have a clear management plan put in place by a consultant obstetrician. This should include timing of follow-up scans, fetal surveillance and mode and timing of delivery.
4. A care plan for postnatal management should be clearly documented in the notes for all women. As a minimum, this should include: • Plan for management of glycaemic control • Neonatal care • Contraception • Follow-up care after discharge from hospital.

62
Audit and research
5. Research should be carried out to investigate: • the most appropriate management strategy following antenatal evidence of macrosomia in babies
of women with diabetes • how best to achieve optimal blood glucose control during pregnancy, labour and delivery.
References
1. Miller E, Hare JW, Cloherty JP, Dunn PJ, Gleason RE, Soeldner JS, et al. Elevated maternal haemoglobin A1c in early pregnancy and major congenital anomalies in infants of diabetic mother. N Engl J Med, 1981.304:1331-4.
2. Mills JL, Simpson JL, Driscoll SG, Jovanovic-Peterson L, Van Allen M, Aarons JH, Metzger B, Bieber FR, Knopp RH, Holmes LB et al. Incidence of spontaneous abortion among normal women and insulin-dependent diabetic women whose pregnancies were identifi ed within 21 days of conception. N Engl J Med, 1988: 319:1617-1623.
3. Rey E, Attie C, Bonin A. The effects of fi rst-trimester diabetes control on the incidence of macrosomia. Am J Obstet Gynecol, 1999; 181, 202-6.
4. Taylor R, Lee C, Kyne-Grzebalski D, Marshall SM, Davison JM. Clinical outcomes of pregnancy in women with type 1 diabetes. Obstet Gynecol, 2002; 99, 537 – 41.
5. Confi dential Enquiry into Maternal and Child Health. Pregnancy in women with type 1 and type 2 diabetes in 2002-03, England, Wales and Northern Ireland. CEMACH: London; 2005.
6. Recommendations for the management of pregnant women with diabetes (including gestational diabetes). Diabetes UK Care Recommendation. Updated June 2005.
7. National Service Framework for Diabetes (England) Standards. Department of Health. The Stationery Offi ce: London; 2001.
8. Sheth BP. Does pregnancy accelerate the rate of progression of diabetic retinopathy? Current Diabetes Reports, Aug 2002: 2(4):327-30.
9. Duckitt K, Harrington D. Risk factors for pre-eclampsia at antenatal booking: systematic review of controlled studies. BMJ, 12 Mar 2005: 330(7491):565.
10. Fischer MJ, Lehnerz SD, Hebert JR, Parikh CR. Kidney disease is an independent risk factor for adverse fetal and maternal outcomes in pregnancy. American Journal of Kidney Diseases. Mar 2004: 43(3):415-23.
11. Irfan S, Arain TM, Shaukat A, Shahid A. Effect of pregnancy on diabetic nephropathy and retinopathy. J Coll Physicians Surg Pak: Feb 2004: 14(2):75-8.
Commentary
Stephen WalkinshawChair, CEMACH Diabetes Professional Advisory GroupConsultant Obstetrician, Liverpool Women’s Hospital, Liverpool
Although there are many areas of good clinical practice during pregnancy for women with diabetes, this chapter has highlighted some aspects of diabetes and maternity care that are less impressive.
Clinical care issues: pregnancy

63
The panel enquiries, which are in essence a detailed peer review of clinical care, have identifi ed a number of underlying issues which may help multidisciplinary teams to work towards improving care and outcomes.
It is surprising that barely half of women in the enquiry had optimal glycaemic control after the fi rst trimester. Some of the underlying issues included poor integration of care, failure to follow up women and failure to change insulin regimens to enable optimal glycaemic control. It should be feasible to address these issues within the organisation of multidisciplinary clinics without signifi cant additional resource. Similarly, improving the setting of blood glucose targets, retinal and renal screening and more senior involvement should be feasible within existing local frameworks of care, though maintaining continuous senior input at the clinic may be a challenge.
Women with diabetes are a ‘captive’ group during labour and delivery, and it cannot be acceptable that a large number were considered to have suboptimal glycaemic control during this time, especially given the knowledge that the level of glycaemic control during labour infl uences the risk of neonatal hypoglycaemia. Panels noted delays in starting intravenous insulin, and inadequate dose regimens, which when taken together with panels’ concerns about local guidelines in Chapter 10, suggests that the organisation of diabetes care on the labour ward needs improvement. Multidisciplinary teams need to consider how they can continue the high level of antenatal specialist involvement through to the labour ward, and how they can provide clear written guidance and practical training for non-specialist staff.
Suboptimal maternity care during pregnancy, which was present in half of women in the enquiry, was associated with a two to threefold increase in the risk of losing a baby after 20 weeks. For babies with evidence of macrosomia, suboptimal fetal surveillance was strongly associated with an increased risk of death after 20 weeks gestation. The main underlying issues identifi ed were poor antenatal fetal surveillance, poor management of maternal risks, and inappropriate decisions about mode and timing of delivery.
Though there is a relatively small evidence base for fetal surveillance in diabetic pregnancy, most women with diabetes have regular ultrasound scans and some form of fetal well-being monitoring. There is, however, little point in any form of surveillance if no or inadequate action is taken in response to the results. It suggests that such surveillance is carried out ‘routinely’ in many cases without detailed consideration of the possible impact on the fetus, and perhaps echoes the panels’ comments about lack of senior input. Similarly, it may be that all women with diabetes are regarded as high risk without any stratifi cation within the group, leading to poor management of individual risks and a blanket policy on mode and timing of delivery. Obstetric and midwifery members of the multidisciplinary team need to consider what tests and interventions are actually needed, and what these mean to the individual pregnancy and not for diabetic pregnancy in general. The NICE guidelines on diabetes in pregnancy, currently under development, may give some direction to these discussions.
From the panels’ comments on postnatal care, it does appear that the diabetes team is not as closely involved with the woman’s care after birth as before, even though 4 out of 5 women had a documented plan. Delivery of consistent quality in postnatal care is a problem outwith pregnancy in women with diabetes, and this diffi cult service issue will be a challenge to improve.

64
Learning points
• Only a fi fth of women were reported to have had all members of the multidisciplinary team involved in their care.
• There was poor documentation of obstetric and diabetes care for more than half ofwomen in the enquiry.
• In a fi fth of cases there were concerns that the design of the maternity notes was notfi t for purpose for antenatal care of a woman with diabetes.
• There were concerns about the standard of local maternity units’ diabetes guidelines for nearly three quarters of women.
10. Clinical governance
10.1 Introduction
Providing a high standard of clinical care is a central tenet of clinical governance. This needs to be supported by effi cient referral pathways, multidisciplinary working, good documentation, evidence-based guidelines and clear lines of communication between health professionals and between health professionals and patients. The Clinical Negligence Scheme for Trusts (CNST), administered by the NHS Litigation Authority (NHSLA), has defi ned minimum standards for maternity units in all these areas. This chapter examines some of the issues identifi ed by panels for women with type 1 and type 2 diabetes using maternity services.
10.2 Access to maternity care
Women with pre-existing diabetes should be referred promptly from primary care to the diabetes specialist team as soon as pregnancy is confi rmed1, for review of glycaemic control, assessment for diabetes complications and a dating fi rst trimester ultrasound scan. It is encouraging that women in the enquiry had their fi rst contact with a health professional at a median of 6+6 weeks, and their fi rst hospital appointment at 8+3 weeks.
10.3 Multidisciplinary working
Women with pre-existing diabetes require the clinical expertise of a number of different professionals during pregnancy. The Diabetes NSF recommends that antenatal care should be provided by a full multidisciplinary team comprising an obstetrician, diabetes physician, diabetes specialist nurse, midwife and dietitian.1 In the CEMACH survey of diabetes maternity services2, 63% of maternity units in England, Wales and Northern Ireland reported a full multidisciplinary team, and there had been an increase in specialist staff compared with the last national survey 8 years previously.3 In particular, the availability of a dietitian in the antenatal clinic had doubled from 40% to 88% of units and the availability of a midwife specialist had tripled from 25% to 77% of units.

65
10.3.1 Enquiry fi ndings
Seventy fi ve percent (329/441) of women in the enquiry were reported to have care provided in a combined clinic. However, only 22% of 441 women were reported to have had all members of the multidisciplinary team involved in their care. The professionals most likely not to have been involved were the midwife and the dietitian (for 54% and 53% of 441 women respectively). This is surprising in view of the fi ndings of the previous CEMACH survey. A possible reason is that women were not easily able to access dietitians and midwives even though they were members of the multidisciplinary team, perhaps due to patterns of working within the antenatal clinic. However, it is also possible that there were panel variations in interpretation of the term ‘midwife with special interest in diabetes’ which was used in the enquiry pro forma.
10.4 Documentation
Clear documentation of care given and plans of management enables different clinicians to effectively follow up individual women. The CNST ‘Health Record’ standard states that a woman’s health record should provide a complete and contemporaneous record of her treatment and related features.4
10.4.1 Enquiry fi ndings
Enquiry panels’ consensus was that there were defi ciencies in the standard of 44% of 436 obstetric notes and 51% of 439 diabetes notes.
For both diabetes and obstetric notes, the main issue identifi ed for 55% and 61% of women respectively where defi ciencies were identifi ed, was poor documentation of what care had been given and the plan of care (table 10.1). In many instances diabetes information was so scanty that panels questioned whether the diabetes notes had been written elsewhere. In a fi fth of cases there were concerns that the design of the notes was not fi t for purpose for antenatal care of a woman with diabetes.
Table 10.1Panel comments on defi ciencies in obstetric and diabetes notes (table contains information followingcategorisation of free text)
Obstetric notes(N=192)
Diabetes notes(N=224)
No. of comments* % of notes No. of comments % of notesTotal comments* 210 236Poor documentation of care given or care plans 105 55 136 61Poor design of notes 40 21 53 24Missing notes or CTGs 30 16 40 18Fetal growth not plotted on scans 14 7 - -Grade of staff not recorded 8 4 3 1Illegible writing 9 5 3 1Date/time not recorded 4 2 1 0
* In 1 panel comment, the issue was not specifi ed.

66
10.5 Maternity unit guidelines
CNST emphasises the importance of evidence-based, referenced, multidisciplinary guidelines which are easily accessible to the health professionals providing care.4 For each woman in the enquiry, panels were asked to review the local maternity unit’s diabetes guideline (contemporaneous for 2002-2003) when these had been provided by the unit. An individual unit’s guideline may have been reviewed more than once by panels, and the results are therefore presented as the proportion of women to whom any concerns related.
Enquiry panels had concerns about local maternity units’ diabetes guidelines for nearly three quarters (72%) of 386 women where unit guidelines were available.
10.5.1 Panel comments on maternity unit diabetes guidelines
Panels made 386 comments about the local diabetes guidelines for 278 women. The two most frequent issues cited were no antenatal guidelines and lack of clarity or insuffi cient detail (table 10.2). For nearly a quarter of the women, the panels’ view was that intravenous insulin regimes for labour were inadequate, and for approximately a fi fth of the women the guideline did not include blood glucose targets. There was considered to be wrong or inappropriate advice in the guidelines for more than a tenth of women assessed to have suboptimal local guidelines.
Table 10.2Panel comments on suboptimal maternity unit diabetes guidelines (table contains information following categorisation of free text)
Number of women with suboptimal local guidelines
(N=278)No. of comments % of women
Total comments* 386 -No antenatal guideline 80 29Not enough detail/not clear 70 25Inadequate intravenous insulin regime for labour 64 23Blood glucose issues (mainly no targets set) 57 21Wrong/inappropriate advice in guideline 35 13No postnatal guideline 24 9Out of date 19 7No guidance on management during antenatal steroid administration
16 6
No advice on screening or management of diabetes complications 9 3Not referenced 6 2Recommends routine admission of baby to neonatal unit 6 2
* hospital protocols not available or data missing for 56 women.
Clinical governance

67
10.6 Communication
Effective communication between health professionals, and between health professionals and women, is vital to achieving a high standard of clinical care which is responsive and puts the needs of the woman fi rst.
10.6.1 Defi ciencies in communication between health professionals
Enquiry panels assessed that there were defi ciencies of communication between health professionals for 56% (222/398) of women (table 10.3). Poor communication between maternity staff and diabetes specialist teams occurred mainly during antenatal hospital admission and after delivery. Poor communication between disciplines alluded mainly to failure of the antenatal team to refer to other specialists such as renal physicians, cardiologists and ophthalmologists, with some comments made about poor transfer of information from midwifery and junior obstetric staff to more senior obstetricians during labour. Problems noted with the multidisciplinary diabetes team included a lack of a dedicated joint clinic and poor sharing of information between the obstetrician and diabetes physician.
Table 10.3Panel comments on defi ciencies of communication between health professionals caring for women with type 1 and type 2 diabetes (table contains information following categorisation of free text)
Number of women with defi ciencies in communication
(N=222)No. of comments % of women
Total comments 258 -Poor communication between secondary care disciplines 59 27Poor communication between diabetes antenatal team and obstetric/midwifery staff 61 27Problems within the multidisciplinary diabetes team 45 21Poor communication between primary and secondary care 44 20Poor documentation 20 9Issue not described 20 9Poor communication between secondary care and other health or social agencies 9 4
* 7 panel comments did not relate to communication issues
10.6.2 Defi ciencies of communication between health professionals and women
Enquiry panels assessed that there were defi ciencies of communication between health professionals and women for 47% (169/360) of women. The main issue seemed to be a lack of discussion between professionals and women about risks and plans for care, which occurred in nearly two thirds of the women for whom there were concerns (table 10.4).

68
Table 10.4Panel comments on defi ciencies of communication between health professionals and women with type 1 and type 2 diabetes (table contains information following categorisation of free text)
Number of women with defi ciencies in communication
(N=169)No. of comments % of women
Total comments* 193Suboptimal discussion about risks 77 46Plan of care not discussed 31 18Lack of professional interpreters for women with language diffi culties 23 14Problem within health service (poor inter-professional communication, poor follow-up, clinician’s attitude etc)
19 11
Communication affected by social/lifestyle factors relating to woman 17 10Wrong or confl icting information given 15 9Documentation 11 7
* There were 5 comments where the issues were not described by panels
10.7 Conclusions
It is encouraging that the majority of pregnant women with pre-existing diabetes fi rst accessed the hospital antenatal clinic within the fi rst trimester of pregnancy and three quarters attended a combined antenatal clinic. However, just over a fi fth of women in the enquiry were documented to have all members of the multidisciplinary team involved in their care, with the dietitian and midwife being the professionals least likely to be involved. While there may have been variations in interpretation of the term ‘midwife with special interest in diabetes’, patterns of working should be reviewed by local multidisciplinary teams to ensure that all women are receiving equivalent care and advice.
In both the obstetric and diabetes antenatal notes, there was poor documentation about what care had been given and the plans for care. Many panels had concerns that the design of the maternity hand held notes were not fi t for purpose.
For nearly two thirds of women, there were concerns about local diabetes guidelines. The main issues were a lack of clarity and insuffi cient detail, no antenatal guidelines, inadequate intravenous insulin regimes and no guidance on blood glucose targets in labour.
There were concerns about communication between health professionals for half of women in the enquiry. A particular issue appeared to be poor lines of communication between the general maternity staff and the diabetes specialist team, and poor information sharing within the diabetes multidisciplinary team.
Clinical governance
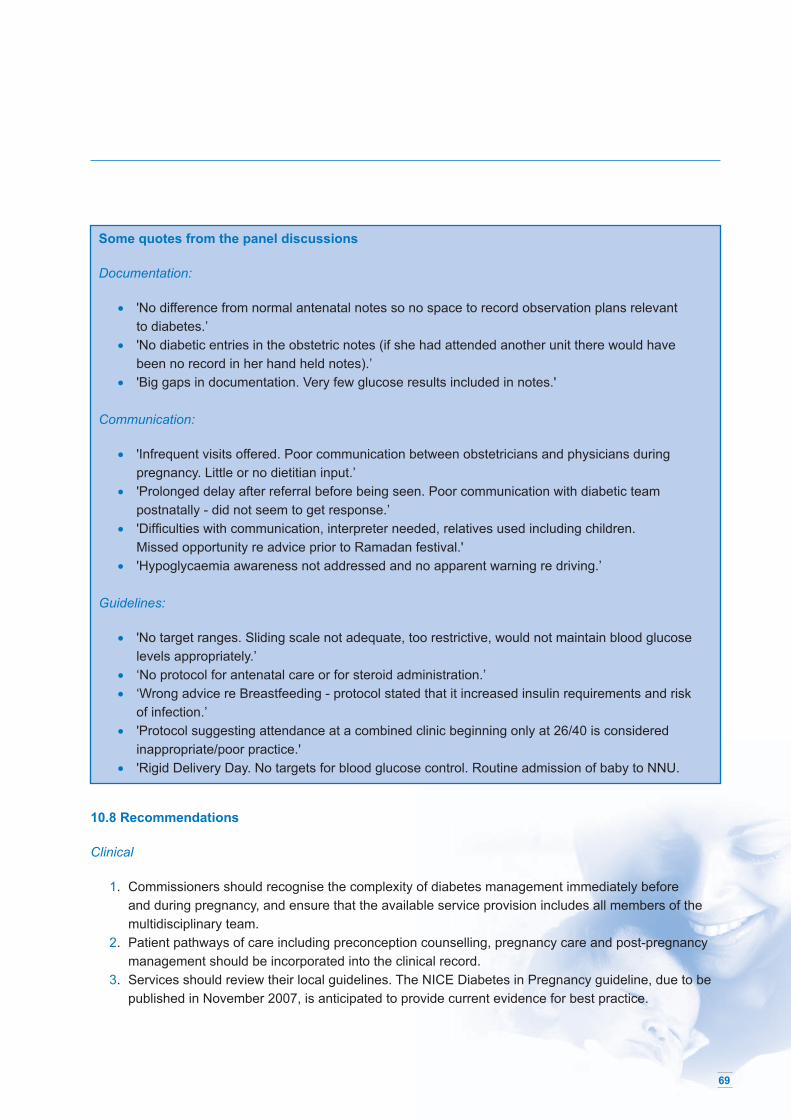
69
Some quotes from the panel discussions
Documentation:
• 'No difference from normal antenatal notes so no space to record observation plans relevant to diabetes.’
• 'No diabetic entries in the obstetric notes (if she had attended another unit there would have been no record in her hand held notes).’
• 'Big gaps in documentation. Very few glucose results included in notes.'
Communication:
• 'Infrequent visits offered. Poor communication between obstetricians and physicians during pregnancy. Little or no dietitian input.’
• 'Prolonged delay after referral before being seen. Poor communication with diabetic team postnatally - did not seem to get response.’
• 'Diffi culties with communication, interpreter needed, relatives used including children. Missed opportunity re advice prior to Ramadan festival.'
• 'Hypoglycaemia awareness not addressed and no apparent warning re driving.’
Guidelines:
• 'No target ranges. Sliding scale not adequate, too restrictive, would not maintain blood glucose levels appropriately.’
• ‘No protocol for antenatal care or for steroid administration.’ • ‘Wrong advice re Breastfeeding - protocol stated that it increased insulin requirements and risk
of infection.’ • 'Protocol suggesting attendance at a combined clinic beginning only at 26/40 is considered
inappropriate/poor practice.' • 'Rigid Delivery Day. No targets for blood glucose control. Routine admission of baby to NNU.
10.8 Recommendations
Clinical
1. Commissioners should recognise the complexity of diabetes management immediately before and during pregnancy, and ensure that the available service provision includes all members of the multidisciplinary team.
2. Patient pathways of care including preconception counselling, pregnancy care and post-pregnancy management should be incorporated into the clinical record.
3. Services should review their local guidelines. The NICE Diabetes in Pregnancy guideline, due to be published in November 2007, is anticipated to provide current evidence for best practice.
70
4. In order to raise awareness, it is recommended that the specialist multidisciplinary team should provide regular educational days for all primary and secondary care professionals likely to be involved in the care of women with diabetes in the local population, to cover all aspects of preconception, pregnancy and postnatal care.
Audit and research
5. Diabetes networks should carry out regular audits of preconception and pregnancy services.
References
1. National Service Framework for Diabetes (England) Standards. Department of Health. The Stationery Offi ce: London: 2001.
2. Confi dential Enquiry into Maternal and Child Health. Survey of maternity services for women with type 1 and type 2 diabetes in 2002-03, England, Wales and Northern Ireland. CEMACH: London; 2004.
3. Jardine Brown C, Dawson A, Dodds R, Gamsu H, Gillmer M, Hall M, et al. Report of the Pregnancy and Neonatal Care Group. Diabetic Med 1996;13:S43-S53.
4. Clinical Negligence Scheme for Trusts Maternity Clinical Risk Management Standards. NHS Litigation Authority. April 2006.
Commentary
John ScarpelloDeputy Medical Director, National Patient Safety AgencyConsultant Diabetes Physician, University Hospital of North Staffordshire
The CEMACH Diabetes Programme has raised important issues for those providing maternity services for women with diabetes. The CEMACH survey of diabetes maternity services showed an encouraging increase in the support available to women and most of the trusts surveyed had established combined multidisciplinary clinics. However, despite these developments, areas of unsatisfactory practice remain. All members of the multidisciplinary team were only involved in 22% of women in the enquiry and, surprisingly, dietitians were often absent. Dietetic support is important for both maternal and fetal nutrition but is also especially valuable in optimising glycaemic control, which is vital to a successful outcome.
Women with type 1 and type 2 diabetes require careful pre-pregnancy assessment with excellent glycaemic control and folic acid supplementation before conception. Once pregnancy is confi rmed prompt referral is required to the multidisciplinary diabetes and obstetric team. The present enquiry has shown several areas where management is suboptimal. These include little evidence of pre-pregnancy planning and a lack of antenatal care guidelines.
Diabetes management is now more often provided by primary care rather than the secondary care specialist diabetes service. Whilst there may be advantages to this model for many people with diabetes, the management of women with diabetes of childbearing age demands agreed patient pathways and joint
Clinical governance
71
working between primary and secondary providers. The enquiry has found evidence of poor documentation in clinical records, and in many cases the design of the maternity notes was described as not fi t for purpose. The enquiry has also highlighted defi ciencies in communication between the multidisciplinary team and other disciplines, for example, general maternity staff, renal physicians, cardiologists and ophthalmologists.
Providers of diabetes maternity services should ensure that agreed standards have been documented in the patient care records, including records of diabetes complications, glycaemic control and blood pressure. Postnatal care plans should include contraceptive advice, insulin management while breastfeeding and targets for glycaemic control. Those providing diabetes maternity services will need to demonstrate that their multidisciplinary team is working to agreed patient pathways and evidence-based standards. The multi-professional team must include specialists (diabetes specialist nurses, obstetric and diabetology consultants, midwives and dietitians) trained in the management of diabetes pregnancy.
Unfortunately, the outcomes of pregnancy for women with diabetes remain poor compared to outcomes for the general maternity population. This report challenges policy makers and commissioners to improve the services provided to this high risk group of women.

72
11. A comparison of type 1 and type 2 diabetes
Learning points
• Women with type 2 diabetes in pregnancy were more likely to be obese compared to women with type 1 diabetes.
• Planned pregnancy rates were similar for women with type 1 and type 2 diabetes but women with type 2 diabetes were less likely to have evidence of contraceptive use in the 12 months before pregnancy.
• Women with type 2 diabetes were less likely than women with type 1 diabetes to have had a retinal assessment or test for albuminuria in the 12 months before pregnancy.
• Women with type 1 diabetes in pregnancy were more likely to have retinopathy, recurrent hypoglycaemia and severe hypoglycaemic episodes than women with type 2 diabetes. Nevertheless, a fi fth of women with type 2 diabetes had recurrent hypoglycaemia and 5% had new retinopathy in pregnancy.
• Women with type 2 diabetes were less likely than women with type 1 diabetes to have a retinal assessment in the fi rst trimester of pregnancy and less likely to receive postnatal contraceptive advice.
11.1 Introduction
The prevalence of type 2 diabetes is increasing1 and the CEMACH report on 3808 pregnancies in women with pre-existing diabetes in England, Wales and Northern Ireland found that more than a quarter (27%) of women with pre-existing diabetes had type 2 diabetes.2 Women with type 2 diabetes were a very different group to women with type 1 diabetes being more likely to be older, multiparous, from a Black, Asian and Other ethnic minority group and resident in an area of social deprivation.2 Women with type 2 diabetes were also less likely to have had pre-pregnancy counselling, preconception folic acid and a test of glycaemic control in the 6 months before pregnancy.2
The enquiry module of the CEMACH Diabetes programme therefore set out to provide additional information about the differences between women with type 1 and type 2 diabetes, in terms of clinical characteristics, social and lifestyle issues, and the care provided to women.
11.2 Methodology
All women selected for the main enquiry as the control group (n=220) were included in the analyses for this chapter. In addition, 79 extra type 2 diabetic pregnancies resulting in a good outcome were also included (see Chapter 4). This gave a total of 170 women with type 1 diabetes and 127 women with type 2 diabetes, which represented 7.2% and 14.4% of all women with type 1 diabetes and type 2 diabetes respectively having a good pregnancy outcome in the full descriptive study population of 3808 pregnancies. In order to analyse a representative sample of women with type 1 and type 2 diabetes from the descriptive study,

73
we therefore selected 7.2% of pregnancies to women with type 1 diabetes resulting in a poor pregnancy outcome and 14.4% of pregnancies to women with type 2 diabetes with a poor pregnancy outcome.
This chapter therefore relates to 181 women with type 1 diabetes (170 with good pregnancy outcome and 11 with poor pregnancy outcome) and 137 women with type 2 diabetes (127 with good pregnancy outcome and 10 with poor pregnancy outcome).
11.3 Clinical characteristics
11.3.1 Body Mass Index
Women with type 2 diabetes were more likely to have a high Body Mass Index (BMI) than women with type 1 diabetes (χ2 test for trend p<0.001, table 11.1). This was as expected, as type 2 diabetes is known to be associated with obesity.
Table 11.1Maternal obesity in women with pre-existing diabetesBody Mass Index (BMI) Women with type 1 diabetes
n (%)(N=181)
Women with type 2 diabetesn (%)
(N=137)18.5-24 57 (48) 12 (16)25-29 45 (38) 17 (22)≥ 30 18 (15) 47 (62)Missing 61 61
11.3.2 Antenatal evidence of macrosomia and fetal growth restriction
There was no difference in the proportion of women with type 1 or type 2 diabetes with antenatal evidence of macrosomia, which was defi ned for the enquiry as evidence of fetal size greater than the 90th centile (p=0.99, table 11.2). This was despite the fact that a greater proportion of women with type 2 diabetes had a BMI greater than 30. However, women with type 2 diabetes were also more likely to be from an Asian ethnic minority group than women with type 1 diabetes, and their babies may not have met the enquiry defi nition of macrosomia (fetal size greater than the 90th centile) using standard antenatal fetal growth charts, even if it was macrosomic for an Asian population.
There was no observed difference between women with type 1 or type 2 diabetes regarding antenatal evidence of fetal growth restriction, although the absolute numbers were small (p=0.31, table 11.2).
Table 11.2Antenatal evidence of fetal growth restriction or macrosomia in women with pre-existing diabetes
Women with type 1 diabetesn/N (%)
Women with type 2 diabetesn/N (%)
p-value
Antenatal evidence of fetal growth restriction 11/178 (6) 12/129 (9) 0.31Antenatal evidence of macrosomia 63/176 (36) 45/126 (36) 0.99

74
11.3.3 Retinopathy in pregnancy
Women with pre-existing diabetes are at risk of deterioration of existing retinopathy and development of new retinopathy during pregnancy.3,4
In the enquiry, retinopathy was present in more women with type 1 diabetes than in type 2 diabetes (p<0.001,table 11.3). Of the women who had retinopathy, this was a new fi nding for 26% of women with type 1 diabetes and also for 5 out of 9 women with type 2 diabetes (table 11.3). This highlights the importance of regular retinal assessment in pregnancy for all women with pre-existing diabetes.
Table 11.3Retinopathy in pregnancy in women with type 1 and type 2 diabetes
Women with type 1 diabetesn/N (%)
Women with type 2 diabetesn/N (%)
p-value
Retinopathy in pregnancy 50/138 (36) 9/96 (9) P<0.001 Pre-existing – no change 25/50 (50) 3/9 (33) - Pre-existing and deteriorating 9/50 (18) 1/9 (11) - New fi nding 13/50 (26) 5/9 (56) -
11.3.4 Nephropathy in pregnancy
In the enquiry, 8% (12/148) of pregnant women with type 1 diabetes and 5% (6/119) of women with type 2 diabetes had nephropathy. This was not a signifi cant difference (p=0.32).
11.3.5 Hypoglycaemia in pregnancy
Women with diabetes are at increased risk of hypoglycaemic episodes during pregnancy due to the need to have tighter glycaemic control and also due to ‘hypoglycaemia unawareness’.5
In the enquiry, 61% of women with type 1 diabetes had recurrent hypoglycaemic episodes during pregnancy, and nearly a fi fth had a hypoglycaemic episode severe enough to require external help (Table 11.4). This refl ects the diffi culty in achieving optimal glycaemic control with currently available insulin therapies. Women with type 2 diabetes were less likely than women with type 1 diabetes to experience recurrent or severe hypoglycaemic episodes (p<0.001) although it is of note that 21% of women with type 2 diabetes were documented as having recurrent episodes of hypoglycaemia. The enquiry did not collect information about the proportion of women with type 2 diabetes that were on insulin during pregnancy so we are unable to report on any association between insulin use in pregnancies to women with type 2 diabetes and hypoglycaemia during pregnancy.
Table 11.4Hypoglycaemia during pregnancy in women with pre-existing diabetes
Women with type 1 diabetesn/N (%)
Women with type 2 diabetesn/N (%)
p-value
Recurrent episodes of hypoglycaemia 105/171 (61) 25/121 (21) <0.001One or more episode of hypoglycaemia requiring help 33/133 (25) 4/102 (4) <0.001
A comparison of type 1 and type 2 diabetes

75
11.4 Preconception behaviour
The CEMACH report on 3808 pregnancies in women with pre-existing diabetes found a poor level of pregnancy preparation, which was more marked for women with type 2 diabetes.2 The enquiry module provided the opportunity to examine differences in other aspects of preconception behaviour.
11.4.1 Planned pregnancy and contraceptive use
Planned pregnancy rates were similar for women with type 1 diabetes (60% of 121 women) and type 2 diabetes (62% of 84 women) (p=0.73, table 11.5), compared to a planned pregnancy rate of 58% in the UK in 2001-2002.6 However, fewer women with type 2 diabetes had evidence of contraceptive use in the 12 months prior to pregnancy (p=0.001, table 11.5). This suggests that for women with type 2 diabetes, planning a pregnancy does not necessarily equate to the use of contraception when not actively trying to conceive. This may be linked to cultural beliefs and attitudes, and health professionals need to explore these issues during annual diabetes reviews and pre-pregnancy counselling.
11.4.2 Folic acid
In the 2005 CEMACH report, 39% of all women were documented in the maternity notes or medical professional correspondence to have commenced folic acid before pregnancy, with fewer women with type 2 diabetes documented to have started folic acid in the preconception period.2 For the enquiry module, general practitioners and the adult diabetes service were asked to provide information on folic acid use before pregnancy. A higher rate of preconception folic acid use than for the full cohort was reported (49% of women with type 1 diabetes and 45% of women with type 2 diabetes), and there was no observed difference between folic acid use in the two groups of women (p=0.60, Table 11.5).
The difference in fi ndings between the descriptive study and the enquiry may be due to the fact that the information on folic acid in the descriptive study was dependent on documentation in the maternity notes, whereas in the enquiry, adult diabetes services and general practitioners were approached for information. It is also possible that health professionals were less likely to document folic acid use in the maternity notes or general medical records for women with type 2 diabetes than for women with type 1 diabetes, perhaps due to issues such as language diffi culties.
Table 11.5Preconception behaviour in women with pre-existing diabetes
Women with type 1 diabetesn/N (%)
Women with type 2 diabetesn/N (%)
p-value
Planned pregnancy 72/121 (60) 52/84 (62) 0.73Evidence of contraceptive use in the 12 months prior to pregnancy 61/104 (59) 21/65 (32) 0.001Evidence of preconception folic acid 54/110 (49) 32/71 (45) 0.60Smoking 41/150 (27) 22/108 (20) 0.20Assessment of suboptimal approach of the woman to managing her diabetes before pregnancy
83/135 (61) 51/88 (60) 0.60
Assessment of suboptimal approach of the woman to managing her diabetes during pregnancy
50/171 (29) 36/124 (29) 0.97

76
11.5 Preconception care in the 12 months prior to pregnancy
There were no differences between women with type 1 and type 2 diabetes in terms of the contraceptive advice, specifi c diabetes advice and information about pregnancy risks and surveillance provided by clinicians before pregnancy (table 11.6) However, women with type 2 diabetes were less likely to have a retinal examination and assessment of albuminuria than women with type 1 diabetes in the 12 months before pregnancy (p=0.004, p=0.04 respectively, table 11.6).
Table 11.6Differences in preconception care between women with type 1 and type 2 diabetes
Women with type 1 diabetesn/N (%)
Women with type 2 diabetesn/N (%)
p-value
No contraceptive advice given 18/76 (24) 18/44 (41) 0.05No recorded discussion of the following specifi c diabetes issues: Alcohol intake 16/57 (28) 8/30 (27) 0.09 Diet 10/82 (12) 5/56 (9) 0.55 Poor glycaemic control 12/102 (12) 4/60 (7) 0.29 Retinopathy 17/80 (21) 11/37 (30) 0.31 Nephropathy 21/64 (33) 14/29 (48) 0.15 Hypertension 19/64 (30) 11/32 (34) 0.64No recorded discussion of the following pregnancy issues: Increased diabetes surveillance 7/109 (6) 4/57 (7) 0.88 Increased pregnancy surveillance 8/109 (7) 4/56 (7) 0.96 Increased risk of induction 13/95 (14) 8/40 (20) 0.36 Possible caesarean section 11/93 (12) 6/47 (13) 0.87 Fetal risks in diabetic pregnancy 7/97 (7) 4/48 (8) 0.81 No dietetic review 87/110 (79) 19/77 (25) 0.19No assessment of the following diabetes complications in the 12 months prior to pregnancy: Baseline retinal examination 12/122 (10) 17/66 (26) 0.004 Baseline test of renal function 10/115 (9) 21/175 (12) 0.06 Assessment of albuminuria 20/92 (22) 21/56 (38) 0.04Assessment of suboptimal preconception care (apart from glycaemic control) 72/116 (62) 53/72 (74) 0.1
11.6 Glycaemic control
There was no difference in the proportion of women with type 1 or type 2 diabetes having a test of glycaemic control in the 12 months before pregnancy (table 11.7). This was different to the fi ndings of the descriptive study, where women with type 2 diabetes were less likely than women with type 1 diabetes to have documented evidence of a pre-pregnancy test of glycaemic control.2 This may be because the
A comparison of type 1 and type 2 diabetes
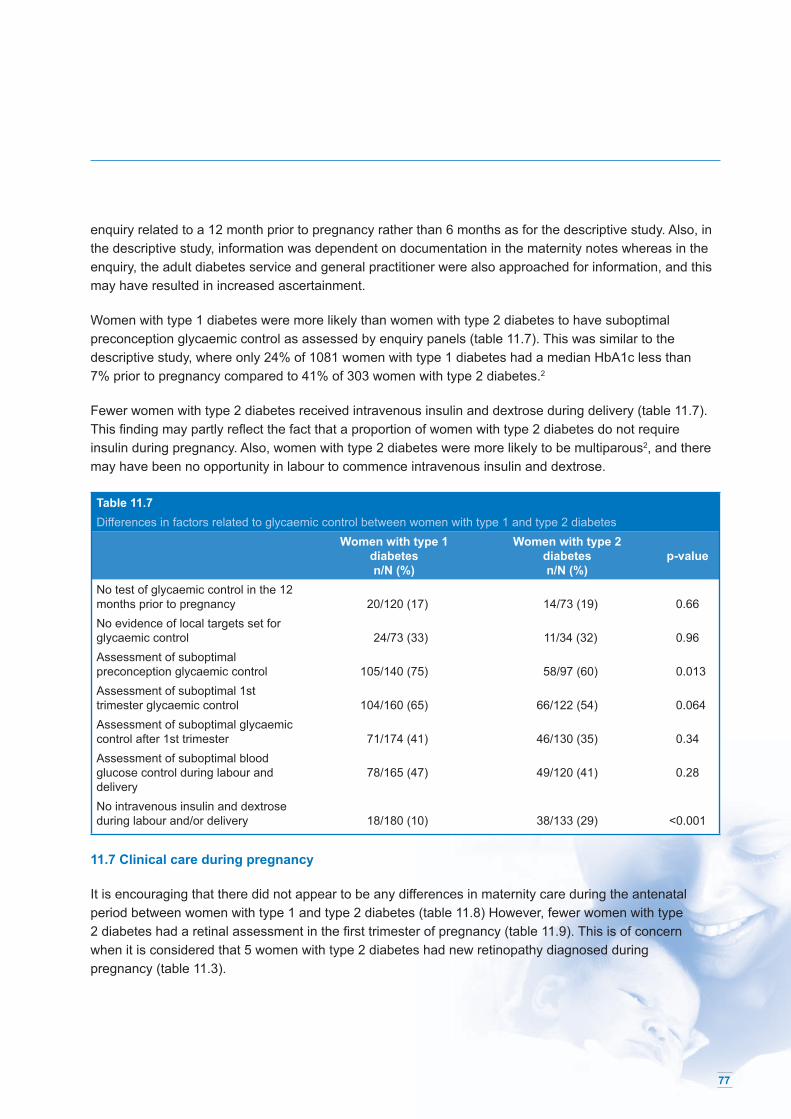
77
enquiry related to a 12 month prior to pregnancy rather than 6 months as for the descriptive study. Also, in the descriptive study, information was dependent on documentation in the maternity notes whereas in the enquiry, the adult diabetes service and general practitioner were also approached for information, and this may have resulted in increased ascertainment.
Women with type 1 diabetes were more likely than women with type 2 diabetes to have suboptimal preconception glycaemic control as assessed by enquiry panels (table 11.7). This was similar to the descriptive study, where only 24% of 1081 women with type 1 diabetes had a median HbA1c less than 7% prior to pregnancy compared to 41% of 303 women with type 2 diabetes.2
Fewer women with type 2 diabetes received intravenous insulin and dextrose during delivery (table 11.7). This fi nding may partly refl ect the fact that a proportion of women with type 2 diabetes do not require insulin during pregnancy. Also, women with type 2 diabetes were more likely to be multiparous2, and there may have been no opportunity in labour to commence intravenous insulin and dextrose.
Table 11.7Differences in factors related to glycaemic control between women with type 1 and type 2 diabetes
Women with type 1 diabetesn/N (%)
Women with type 2 diabetesn/N (%)
p-value
No test of glycaemic control in the 12 months prior to pregnancy 20/120 (17) 14/73 (19) 0.66No evidence of local targets set for glycaemic control 24/73 (33) 11/34 (32) 0.96Assessment of suboptimal preconception glycaemic control 105/140 (75) 58/97 (60) 0.013Assessment of suboptimal 1st trimester glycaemic control 104/160 (65) 66/122 (54) 0.064Assessment of suboptimal glycaemic control after 1st trimester 71/174 (41) 46/130 (35) 0.34Assessment of suboptimal blood glucose control during labour and delivery
78/165 (47) 49/120 (41) 0.28
No intravenous insulin and dextrose during labour and/or delivery 18/180 (10) 38/133 (29) <0.001
11.7 Clinical care during pregnancy
It is encouraging that there did not appear to be any differences in maternity care during the antenatal period between women with type 1 and type 2 diabetes (table 11.8) However, fewer women with type 2 diabetes had a retinal assessment in the fi rst trimester of pregnancy (table 11.9). This is of concern when it is considered that 5 women with type 2 diabetes had new retinopathy diagnosed during pregnancy (table 11.3).

78
Table 11.8Differences in maternity care during the antenatal period between women with type 1 and type 2 diabetes
Women with type 1 diabetesn/N (%)
Women with type 2 diabetesn/N (%)
p-value
Assessment of suboptimal fetal monitoring (with antenatal evidence of growth restricted baby)
2/11 (18) 1/11 (9) 0.53
Assessment of suboptimal fetal monitoring (with antenatal evidence of big baby > 90th centile)
19/32 (59) 16/45 (36) 0.68
No discussion of mode and timing of delivery 5/164 (3) 4/122 (3) 0.91No administration of corticosteroids 9/28 (32) 8/24 (33) 0.93Assessment of suboptimal maternity care during the antenatal period 76/177 (43) 70/131 (53) 0.07Assessment of suboptimal maternity care during labour and delivery 59/178 (33) 56/131 (43) 0.08
Table 11.9Differences in diabetes care (excluding glycaemic control) during pregnancy between women with type 1 and type 2 diabetes
Women with type 1 diabetesn/N (%)
Women with type 2 diabetesn/N (%)
p-value
No retinal assessment 33/148 (22) 42/117 (36) 0.02No referral to ophthalmologist (if retinopathy present) 20/43 (47) 5/9 (56) 0.62No monitoring for nephropathy 24/169 (14) 21/128 (16) 0.6No test of renal function (if nephropathy present) 3/12 (25) 3/6 (50) 0.29Assessment of suboptimal diabetes care during pregnancy 96/169 (57) 49/120 (41) 0.28
11.8 Postnatal care
Women with type 2 diabetes were less likely to receive postnatal contraceptive advice than women with type 1 diabetes (table 11.10). This may have been due partly to language diffi culties and also perceived differences in cultural attitudes to contraception. All women with pre-existing diabetes should receive advice about contraception soon after delivery in order to prevent future unplanned pregnancies, and it should be agreed locally as to which professionals are best placed to provide this advice in the puerperium.
A comparison of type 1 and type 2 diabetes

79
Table 11.10Differences in postnatal care between women with type 1 and type 2 diabetes
Women with type 1 diabetesn/N (%)
Women with type 2 diabetesn/N (%)
p-value
No postnatal contraceptive advice 21/137 (15) 31/105 (30) 0.008No written plan for post-delivery diabetes management 20/156 (13) 15/115 (13) 0.95Assessment of suboptimal postnatal diabetes care 93/177 (53) 59/127 (46) 0.3
11.9 Conclusions
The comparison of women with type 1 and type 2 diabetes has shown some differences in clinical characteristics (Body Mass Index, retinopathy and frequency and severity of hypoglycaemia in pregnancy) which are to be expected from the difference in disease profi les between the two groups of women.
It is concerning that women with type 2 diabetes were less likely than women with type 1 diabetes to have a retinal assessment in the fi rst trimester (or at booking if later), especially since retinopathy was a new fi nding in fi ve out of the nine women with type 2 diabetes who had retinopathy in pregnancy. This may refl ect a perception by health professionals that type 2 diabetes is less likely to cause complications than type 1 diabetes, and highlights the importance of early and regular retinal assessment for all women with pre-existing diabetes.
Before pregnancy, women with type 2 diabetes were less likely than women with type 1 diabetes to have a retinal assessment or test for albuminuria in the 12 months before pregnancy. Women with type 2 diabetes are more likely to be managed in primary care, and this fi nding may therefore refl ect a lack of awareness by primary care professionals of the importance of screening for diabetes complications in women with type 2 diabetes. There may also be diffi culties in accessing investigations such as retinal photographs that are usually provided in the secondary care setting.
Women with type 2 diabetes were less likely to receive postnatal contraceptive advice. It is recognised that health professionals may fi nd it diffi cult to provide contraceptive advice to women from different cultural backgrounds due to language diffi culties and perceived cultural sensitivities. However, this is a vital aspect of post-delivery counselling, and every effort should be made by health professionals to help women with diabetes, including those with type 2 diabetes, to prepare adequately for future pregnancies.

80
11.10 Recommendations
Clinical
1. During pregnancy, retinal and renal screening schedules should be provided for both women with type 1 and women with type 2 diabetes.
2. Advice about hypoglycaemia during pregnancy, including prevention and management strategies, should be provided to both women with type 1 diabetes and women with type 2 diabetes.
Audit and research
3. Diabetes networks should audit standards of preconception and pregnancy care for both women with type 1 and women with type 2 diabetes.
References
1. Lusignan S, Sismanidis C, Carey IM, DeWilde S, Richards N, Cook DG. Trends in the prevalence and management of diagnosed type 2 diabetes 1994-2001 in England and Wales. BMC Family Practice 6(1), 2 Mar 2005: 13.
2. Confi dential Enquiry into Maternal and Child Health. Pregnancy in women with type 1 and type 2 diabetes in 2002-03, England, Wales and Northern Ireland. CEMACH: London; 2005.
3. Sheth BP. Does pregnancy accelerate the rate of progression of diabetic retinopathy? Current Diabetes Reports 2(4), Aug 2002: 327-30.
4. Temple RC, Aldridge VA, Sampson MJ, Greenwood RH, Heyburn PJ, Glenn A. Impact of pregnancy on the progression of diabetic retinopathy in Type 1 diabetes. Diabetic Medicine. Jul 2001: 18(7): 573-7.
5. ter Braak EW, Evers IM, Erkelens DW, Visser GH.Maternal hypoglycaemia during pregnancy in type 1 diabetes: maternal and fetal consequences. Diabetes Metab Res Rev 2002; 18:96-105.
6. Dex S, Heather J (eds). Millennium Cohort Study First Survey: a user’s guide to initial fi ndings. Centre for Longitudinal Studies: London; 2004.
Commentary
Robert FraserChair, NICE Diabetes in Pregnancy Guideline Development GroupConsultant Obstetrician, Royal Hallamshire Hospital, Sheffi eld
The proportionate distribution of type 1 and type 2 diabetes in women with diabetes during pregnancy is changing, with an increasing number of pregnancies in women with type 2 diabetes being seen. This is due to a rapid increase in the prevalence of obesity in all ethnic groups in the population, obesity occurring in younger people, and a rise in age specifi c maximum fertility. The importance of mature onset diabetes of youth (MODY) is also becoming recognised amongst younger women with type 2 diabetes and this group bring their own particular problems to pregnancy management which deserve separate and detailed management guidelines.
A comparison of type 1 and type 2 diabetes

81
Type 1 and type 2 diabetes have traditionally been managed differently. As the prevalence of type 2 diabetes in pregnancy increases, it is appropriate to review how we manage women of childbearing age with known type 2 diabetes. Also, women with gestational diabetes (GDM) are at increased risk of type 2 diabetes after pregnancy, and in some populations up to 20% of women diagnosed to have gestational diabetes actually have previously undiagnosed type 2 diabetes. This brings them into a high risk group for future pregnancies, and although this report did not address gestational diabetes, these women may also benefi t from properly structured management strategies including pre-pregnancy care.
Although retinopathy is much less common in women with type 2 diabetes it is present in a signifi cant minority and they are presumably equally vulnerable to deterioration of retinopathy during pregnancy. They therefore need to be enrolled in a suitable annual review outside pregnancy, either in primary or secondary care. They are likely to benefi t as much as women with type 1 diabetes from digital retinal photography.
In the CEMACH enquiry, unplanned pregnancy and preconception folic acid use was equivalent in women with type 1 and type 2 diabetes, and women with type 2 diabetes appeared less likely to use contraception. It is important that both groups of women should have messages reinforced about pregnancy preparation. During pregnancy, it is clear that women with type 2 diabetes should have the same standard of maternal and fetal surveillance as women with type 1 diabetes. However, women with type 2 diabetes have a relative rarity of severe hypoglycaemia requiring third party assistance.
During labour, fewer women with type 2 diabetes receive intravenous insulin and dextrose; this is perhaps a refl ection of reasonable clinical practice in that these women may very well have shorter labours and are certainly at less risk of serious metabolic disturbance during labour.
The fi nding that women with type 2 diabetes are less likely to receive postnatal contraceptive advice is of concern, and the importance of providing contraceptive advice to this particular group of women must be emphasised through adult diabetes services and general practitioners. It may also be worthwhile to extend education about the pregnancy risks for women with type 2 diabetes to other primary care health professionals such as Family Planning practitioners and nurses.

82
12. Neonatal care of term babies
Learning points
• One third of admissions to a neonatal unit occurred because of a unit policy of routinely admitting well babies of mothers with diabetes. Enquiry panels assessed that over half of all neonatal admissions were avoidable.
• Several barriers to breastfeeding were reported:- Lack of early close maternal contact and early feeding on the labour ward - High rate of infant formula given as fi rst feed - Infant formula given to all babies admitted to a neonatal unit, even when the maternal intention was to breastfeed - Infant formula feeding on the postnatal ward often explained by maternal choice.
• Blood glucose testing often took place too early with inappropriate methods of testing used; documentation of blood glucose tests was poor.
• Two thirds of babies were assessed to have suboptimal neonatal care on the delivery suite; this frequently affected subsequent care.
• A quarter of medical records did not have a written management plan.
12.1 Introduction
In 2002, 30% of hospitals in England, Wales and Northern Ireland reported that they routinely admitted babies of women with diabetes to a neonatal unit.1 In addition, the CEMACH descriptive study of 3808 pregnancies to women with type 1 and type 2 diabetes found substandard neonatal management of hypoglycaemia and early feeding; a lower intention to breastfeed in mothers with diabetes at birth than in the general population; and a higher number than expected admissions of term babies to a neonatal unit.2 It was therefore decided to carry out an additional enquiry into the neonatal care of term babies of women with diabetes in the CEMACH Diabetes Programme. The key fi ndings are summarised in this chapter.
12.2 Methodology
12.2.1 Composition and location of enquiry panels
Enquiry panel meetings were held in fi ve CEMACH regions (East of England, London, North East, North West and South West) between January and April 2006. Each panel consisted of two representatives from each of the following disciplines:
• Neonatologists • Neonatal nurses • Midwives.

83
Panels were chaired by the panel chairs appointed for the Diabetes Enquiry or by the CEMACH regional manager of that region. Six cases were reviewed at each meeting. Cases reviewed were selected from a national pool excluding the region of the assessing panel, to ensure an independent assessment of the care provided. Each panel was provided with neonatal records and charts pertaining to the fi rst three days after delivery, discharge summaries, the postnatal maternity notes, any relevant correspondence and hospital protocols.
12.2.2 Enquiry pro forma
Clinical guidance for the neonatal enquiry was provided by a steering group of clinicians with specifi c experience in neonatal care for babies of women with diabetes (Appendix F). A structured enquiry pro forma (accessible at www.cemach.org.uk) was developed in consultation with members of the steering group. This pro forma was designed to assess neonatal care provided on the labour ward, the postnatal ward or on the neonatal unit.
12.2.3 Standards of care
Care was assessed against standards relating to the location of care, blood glucose monitoring, temperature management and feeding. The clinical standards for this enquiry were those used in the CEMACH Diabetes Programme (accessible at www.cemach.org.uk), with some additional standards from the Baby Friendly Initiative.3
12.2.4 Enquiry sample
In the neonatal enquiry, pregnancies were randomly sampled from the diabetes cohort database of 3808 pregnancies after excluding deaths, fetal congenital anomalies, multiple births and gestation at delivery less than 37+0 weeks. The case defi nition for the neonatal enquiry was therefore all term pregnancies in women with diabetes resulting in a normally formed baby surviving to 28 days after delivery. One hundred and thirty two babies met this case defi nition. Neonatal medical records were not available for 13 babies, leaving 119 babies for enquiry. These babies were then divided into two groups for further comparative analysis:
• babies who were initially admitted with their mother to the postnatal ward or to a transitional care unita, or who stayed with their mother on the labour ward or a maternal high dependency unit
• babies who were initially admitted to a neonatal unit for special care.b
a defi ned as units where, if baby needs non intensive treatment and monitoring, mothers and babies can be cared for together under
supervision of neonatal staff.
b Care provided for all babies not receiving intensive or high dependency care but whose carers could not reasonably be expected to
look after them in hospital or at home (British Association of Perinatal Medicine 2001).

84
12.3 The babies in the neonatal enquiry
In the 119 babies selected for neonatal enquiry, two sets of medical records were not available and fi ve babies had no documented location of care. Amongst the remaining 112 babies with data available on their care in the fi rst three days of life, 70 babies were nursed initially with their mothers (61 on the postnatal ward, fi ve in a transitional care unit and four on the labour ward or maternal high dependency unit). By day three, nearly half of these 70 babies had been discharged from hospital. Six babies, who were initially nursed with their mother, were later admitted to a neonatal unit.
Forty two babies were admitted directly to a neonatal unit after delivery. By day three, one third of these 42 babies were still on the unit while two thirds had returned to be with their mothers on the postnatal ward. Two babies were later readmitted to the neonatal unit.
12.4 Avoidable admissions
Current national guidance is that babies of women with diabetes should be admitted to a neonatal unit only if there is a specifi c medical indication.5-7 As already mentioned, in 2002, a third of units routinely admitted babies of women with diabetes to the neonatal unit.1 The CEMACH descriptive study also found that 30% of term babies were admitted to a neonatal unit2, a threefold increase over the neonatal admission rate in the general maternity population in the UK.4 This is concerning, as separation of mother and baby after birth may affect a number of important processes such as early establishment of breastfeeding, temperature control and emotional bonding.
12.4.1 Enquiry fi ndings
The three main indications for admission to a neonatal unit were a hospital policy of routine admission of healthy babies of mothers with diabetes; non-symptomatic hypoglycaemia in a healthy baby; and a clinical need for admission such as poor feeding and respiratory problems.
Table 12.1Reasons for admission of babies of mothers with diabetes to a neonatal unit
Babies admitted to a neonatal unitn (%)
(N=42)Hospital policy (infant of mother with diabetes) 12 (29)Non symptomatic hypoglycaemia in a well baby 11 (26)Baby clinically needing admission: 18 (43) Hypothermia (with hypoglycaemia) 6 Poor feeding (with hypoglycaemia) 3 Macrosomia (otherwise well baby) 3 Respiratory diffi culties 5 Other medical condition (cardiac) 1Not known 1 (0)
Neonatal care of term babies

85
In 57% (24/42) of cases, a junior doctor (senior house offi cer in paediatrics) made the decision to admit a baby to the neonatal unit. Enquiry panels assessed that 57% (24/42) of admissions could have been avoided, with subsequent care being adversely affected for 63% (15/24) of the babies. The main area of care affected by an avoidable admission was feeding, for 50% (12/24) of the babies.
12.4.2 Panel comments on avoidable admissions
Enquiry panels made 24 comments for 24 babies about avoidable admissions. The most frequent comment, for 63% (15/24) of babies, was that there was no valid medical reason to admit to the neonatal unit (table 12.2).
Table 12.2Panel comments on avoidable admissions to a neonatal unit (table contains information following categorisation of free text)
No. ofcomments
% of avoidable admissions(N=24)
Total comments 24No medical reason for admission 15 63Poor management of temperature 5 21Delay in initiating feeding 2 8Poor maternal blood glucose management during labour/at delivery
1 4
Blood glucose tested too soon after delivery 1 4
12.5 Barriers to breastfeeding
Several studies have shown that postnatal care programmes such as the Baby Friendly initiative that help promote undisturbed mother-infant contact improve breastfeeding success.3,8,9 These initiatives are likely to be of benefi t to mothers with diabetes and their babies, who may be more vulnerable to the negative psychological impact of a high-risk medical condition in pregnancy.10 There is evidence that babies whose mothers keep them in closer skin contact are warm, calm and reassured.11,12 Systematic reviews of early skin contact between mothers and babies also show benefi ts in relation to breastfeeding and infant crying.13
National guidance for women with diabetes recommends breastfeeding as early as possible after delivery,6,7 as these babies may be at risk of hypoglycaemia.5,14 In addition, infant formula supplementation may suppress the process of normal metabolic adaptation. Breast milk is thought to promote ketogenesis15 and should therefore be the fi rst choice for babies of women with diabetes, as they are at risk of hypoketonaemic hypoglycaemia. However, the previous CEMACH descriptive study found that the intention to breastfeed rate in women with diabetes was lower than the initial breastfeeding rate in the general population.2,16

86
12.5.1 Enquiry fi ndings
Early feeding and skin-to-skin contact on the labour ward
Opportunity for early skin-to-skin contact after birth (within 30 minutes of delivery, or as soon as the mother was able to respond following caesarean section) was documented to be achieved for 29% (30/102) of babies. In eight instances, skin-to-skin contact was considered not practicable because of the clinical condition of mother and/or the baby.
Seventy seven percent (75/97) of babies received their fi rst feed while on the labour ward. Ninety fi ve percent of babies remaining with their mothers received their fi rst feed on the labour ward compared to 50% of babies admitted to a neonatal unit (p<0.001). It is possible that the clinical condition of a proportion of babies admitted to the neonatal unit did not allow feeding and in particular breastfeeding; however, these fi ndings imply that at least half of the babies admitted to a neonatal unit were well enough to breastfeed.
Breastfeeding support on the labour ward
Twenty six percent (29/112) of mothers were documented to have received help with breastfeeding within the fi rst hour after birth (34% of mothers whose babies remained with them and 12% of mothers whose babies were admitted to a neonatal unit, p=0.07). It is of concern that a third of mothers in both groups had no documented breastfeeding support despite breastfeeding being their intended method of feeding (table12.3).
Table 12.3Documented evidence of breastfeeding support on the labour ward for women with type 1 and type 2 diabetes
Babies in neonatal enquiry
Breastfeeding support
Remaining with mothern(%)
(N=70)
Admitted to NNUn(%)
(N=42)
Totaln(%)*
(N=112) Yes 24 (37) 5 (13) 29 (28)No 23 (35) 14 (35) 36 (35)Assessed as not practicable 1 (2) 9 (23) 10 (9)Not applicable† 17 (26) 12 (30) 29 (28)Missing 5 2 7
* Percentages are calculated from all babies in relevant category excluding those where data was missing.† Breastfeeding was not mother’s intended method of feeding.
Breastfeeding support in the neonatal unit
Only 31% (13/42) of mothers whose babies were admitted to the neonatal unit had documented evidence in the medical records that they had been shown how to breastfeed and maintain lactation (e.g. express breast milk) when separated from their babies. Nineteen percent (8/42) of mothers did not wish to breastfeed.
Neonatal care of term babies

87
Infant formula given as fi rst feed
Infant formula was the most frequently recorded milk given at fi rst feed (for 63%, 67/106 of babies in the enquiry) (table 12.4). Twenty nine percent of the 31 formula-fed babies admitted to a neonatal unit were fed either by a cup or by tube, but a bottle was used to give the fi rst feed for all 36 formula-fed babies who remained with their mothers. Breast milk was the fi rst feed for 40% of 106 babies (50%, 34/68 of babies who remained with their mothers and 21%, 8/38 of babies admitted to a neonatal unit, p=0.001).
The most frequent reason documented for infant formula being given at any feed to babies remaining with their mothers, was maternal choice, for 46% (32/70) of babies.
Table 12.4Type of milk at fi rst feed for babies of women with type 1 and type 2 diabetes
Babies remaining with mothern(%)
(N=70*)
Babies admitted to NNUn(%)
(N=42*)
Totaln(%)
(N=112) Maternal breast milk 34 (50) 8 (21) 42 (40)Donor breast milk 2 (3) 0 (0) 2 (2)Infant formula 36 (53) 31 (82) 67 (63)Type of milk at fi rst feed not recorded 2 4 6
* some babies had more than one option for fi rst feed ticked.
Intention to breastfeed
The fi rst feed given was not the mothers’ intended type of feed for 28% (27/96) of babies (16% of babies who remained with their mothers and 50% of those admitted to a neonatal unit, p<0.001)). This information was not available for 14% of babies (8 babies in each group).
Infant formula given to all babies admitted to a neonatal unit, even when maternal intention to breastfeed
The type of milk given on the neonatal unit was documented for 41/42 babies (table 12.5). Twenty eight of the 41 babies received more than one type of milk. Infant formula was the most frequently recorded fi rst feed, being given to all the 41 babies for whom information was available.
Twenty fi ve out of 41 babies had breast milk, always by breastfeeding.
Table 12.5Type of milk given to babies of women with type 1 and type 2 diabetes on the neonatal unitType of milk*
Received only one type of milk
Received more than one type of milk
Total no. of babies (N=41)
Breast milk 0 25 25Donor milk 0 1 1Infant formula 13 28 41
* Babies could be fed by multiple methods but same type of milk e.g. infant formula from cup and tube.

88
12.5.2 Panel assessment of feeding in the neonatal unit
Panels assessed that the type of feed the baby received was appropriate in 62% (26/42) of cases.
12.5.3 Panel assessment of the impact of management in the neonatal care unit on feeding
Panels considered that management of the baby, over and above the fact of being on the neonatal unit for special care, was likely to have had a negative impact on the establishment of feeding for 38% (15/40) of all babies (46%, 11/24 when there was a maternal intention to breastfeed and 25%, 4/16 when an alternative method of feeding was intended (p=0.18) (table 12.6).
Table 12.6Panel assessment of the impact of management of the baby on establishment of feeding for babies of women with type 1 and type 2 diabetes on the neonatal unit
Maternal intention to breastfeed
Effect of management of the baby Yesn(%)
(N=25)
Non(%)
(N=17)
Totaln(%)*(N=42)
Had an impact on establishment of feeding 11 (46) 4 (25) 15 (38)Did not have an impact on establishment of feeeing 12 (50) 10 (63) 22 (55)Not enough information 1 (4) 2 (13) 3 (8)Missing 1 1 2
* Percentages are calculated from all babies in relevant category excluding those babies where data was missing.
12.6 Blood glucose management
The standard agreed for the CEMACH Diabetes Programme (standards accessible at www.cemach.org.uk) stated that babies of mothers with diabetes should have a test of blood glucose concentration by 4-6 hours of age, before a feed.2 The previous descriptive study suggested that blood glucose testing was often performed too soon, coinciding with the physiological fall in blood glucose after birth and potentially leading to unnecessary admissions to the neonatal unit.2
The descriptive study also found that neonatal blood glucose testing was mainly carried out using a reagent strip technique.2 Reagent strip testing is unreliable17 and when considering the diagnosis of hypoglycaemia, at least one laboratory value should be obtained.18 The suitability of using a portable glucose photometer such as the HaemoCue to diagnose neonatal hypoglycaemia is not universally accepted.17, 19-21 Currently, national guidelines recommend that the diagnosis of neonatal hypoglycaemia in babies at increased risk should be made using ward-based glucose electrode or laboratory methods and not by reagent strip.2,6
12.6.1 Enquiry fi ndings
12.6.1.1 Timing of fi rst blood glucose testing
Babies had their fi rst blood glucose test mainly during the fi rst two hours of life (table 12.7 ). The fi rst test was performed at a median of 1.15 hours in babies admitted to a neonatal unit and at a median of
Neonatal care of term babies

89
2.1 hours in babies remaining with their mothers. The wide range in age of the baby at fi rst blood glucose test shows that some tests were carried out almost immediately after birth. Median fi rst blood glucose values were identical in both groups. Panels were asked if there were abnormal clinical signs attributable to hypoglycaemia at the time of the fi rst blood glucose measurement: two babies were described as jittery with no other symptoms.
Table 12.7Timing and result of fi rst blood glucose measurement in term babies of women with type 1 and type 2 diabetes
Babies remaining with mother (N=70)
Babies admitted to NNU (N=42)
p-value
Time of fi rst blood glucose measurement (hours) (median [IQR] (range)
2.1 [0.97-433](0.05 - 9.63)
N=58 1.15 [0.38-1.97](0 - 7.6)
n=34 0.08
First blood glucose value (mmol/L) (median [IQR] (range)
2.8 [2.3-3.7](0.8 - 9.0)
N=68 2.5 [2.0-3.3](0.8 - 5.7)
n=39 0.42
12.6.1.2 Methods of blood glucose testing
Reagent strip testing was the main method documented. In many cases, there was no documentation of the method used (table 12.8). It was also noted that the abbreviation “BM” was often used inappropriately to denote blood glucose.
Table 12.8Method used for fi rst blood glucose measurement in babies of women with type 1 and type 2 diabetesMethod used Babies in neonatal enquiry
(N=112) HaemoCue 10Reagent strip 53 Dextrostix 0 “BM” 53Glucose electrode method 6 Yellow springs 0 Blood gas analyser 4 Other glucose electrode method 2 Other 1Not documented 42
Sixty eight percent of blood glucose measurement tests were done pre-feed and 26% post-feed (table 12.9). These proportions were similar for babies admitted to a neonatal unit and babies remaining with their mothers.

90
Table 12.9Timing of fi rst blood glucose measurement in relation to feed in babies of mothers with type 1 and type 2 diabetes
Timing of fi rst blood glucose measurement
Babies remaining with mother
n(%)(N=70)
Babies admitted to NNUn(%)
(N=42)
Total(N=112)
Pre-feed 43 (64) 28 (74) 71 (68)Post-feed 18 (27) 9 (24) 27 (26)Random 6 (9) 1 (3) 7 (7)Missing 3 4 7
12.6.2 Panel assessment of documentation of blood glucose management
Panels assessed that documentation of blood glucose measurements was more frequently suboptimal on the postnatal ward (81%, 57/70 of babies) than on the neonatal unit (48%, 20/42 of babies, p<0.001). Panels made 99 comments for 77 babies with suboptimal documentation of blood glucose measurements (table 12.10). The two main issues identifi ed by panels were a lack of documentation of the methods used and no written plan for blood glucose management.
Table 12.10Panel comments on suboptimal documentation relating to blood glucose measurements (table contains information following categorisation of free text)
Babies with suboptimal documentation of blood glucose
measurements(N=77)
No. of comments % of babies Total comments 99No documentation of methods used 30 39No written blood glucose management plan 22 29Pre and post-feed not specifi ed 10 13“BM” stated as the method of testing 10 13Confusion due to baby’s and mother’s blood glucose recorded in the same notes 11 14Poor design of notes 6 8Timing of blood glucose testing or feeding not recorded 5 7Notes/charts not available 3 4Other 2 3
12.7 Panel assessment of care of babies on the labour ward
Enquiry panels assessed that care on the labour ward was suboptimal for 55% (62/112) of babies(53%, 37/70 of babies remaining with their mothers and 71%, 25/42 of those admitted to a neonatal unit, no signifi cant difference).
Neonatal care of term babies

91
12.7.1 Panel comments on suboptimal care of babies on the labour ward
Panels made 95 comments for the 62 babies whose care on the labour ward was suboptimal (table 12.11). The most frequently recorded issues were: a) inappropriate timing of blood glucose testing b) no close early contact between mother and baby/ missed breastfeeding opportunities c) allowing the baby to get cold and d) no plan of care.
Table 12.11Panel comments on suboptimal care on the labour ward (table contains information following categorisation of free text)
Babies with suboptimal care on labour ward
(N=62) No. of comments % of babies
Total comments 95Blood glucose 22 36 Done too soon 7 Delayed 5 No monitoring 2 Substandard management 7 No documentation 1Feeding 23 37 Delayed 7 No skin-to-skin contact/breastfeeding opportunity 12 Breastfeeding impaired/overturned 2 Other management 1 No documentation 1Temperature 29 47 Allowed to get cold 12 No monitoring 9 Not documented 8Overall management 16 26 No clinical assessment 2 No plan of care 12 No guidelines/protocol 2Other 5 8
12.8 Written management plans
It is important to have a clear written management plan at birth for babies of women with diabetes, to help staff on the neonatal unit and midwives on the postnatal ward to direct their neonatal care appropriately.
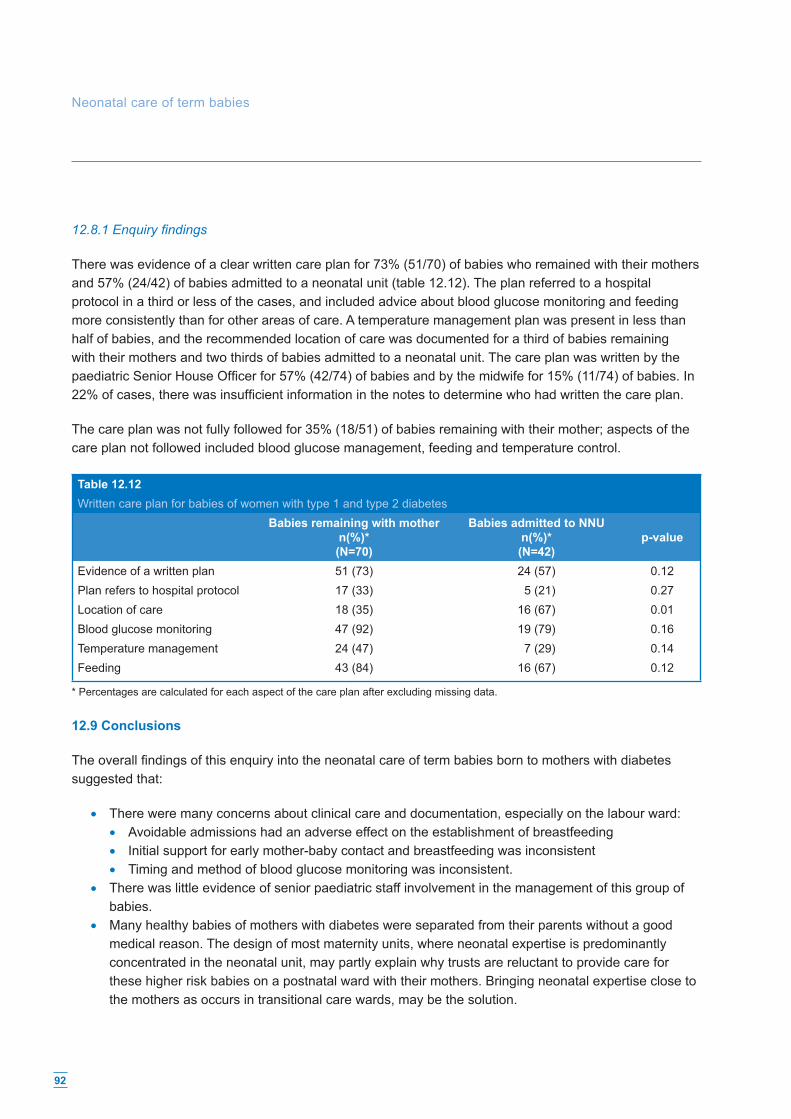
92
12.8.1 Enquiry fi ndings
There was evidence of a clear written care plan for 73% (51/70) of babies who remained with their mothers and 57% (24/42) of babies admitted to a neonatal unit (table 12.12). The plan referred to a hospital protocol in a third or less of the cases, and included advice about blood glucose monitoring and feeding more consistently than for other areas of care. A temperature management plan was present in less than half of babies, and the recommended location of care was documented for a third of babies remaining with their mothers and two thirds of babies admitted to a neonatal unit. The care plan was written by the paediatric Senior House Offi cer for 57% (42/74) of babies and by the midwife for 15% (11/74) of babies. In 22% of cases, there was insuffi cient information in the notes to determine who had written the care plan.
The care plan was not fully followed for 35% (18/51) of babies remaining with their mother; aspects of the care plan not followed included blood glucose management, feeding and temperature control.
Table 12.12Written care plan for babies of women with type 1 and type 2 diabetes
Babies remaining with mothern(%)*(N=70)
Babies admitted to NNUn(%)*(N=42)
p-value
Evidence of a written plan 51 (73) 24 (57) 0.12Plan refers to hospital protocol 17 (33) 5 (21) 0.27Location of care 18 (35) 16 (67) 0.01Blood glucose monitoring 47 (92) 19 (79) 0.16Temperature management 24 (47) 7 (29) 0.14Feeding 43 (84) 16 (67) 0.12
* Percentages are calculated for each aspect of the care plan after excluding missing data.
12.9 Conclusions
The overall fi ndings of this enquiry into the neonatal care of term babies born to mothers with diabetes suggested that:
• There were many concerns about clinical care and documentation, especially on the labour ward: • Avoidable admissions had an adverse effect on the establishment of breastfeeding • Initial support for early mother-baby contact and breastfeeding was inconsistent • Timing and method of blood glucose monitoring was inconsistent.
• There was little evidence of senior paediatric staff involvement in the management of this group of babies.
• Many healthy babies of mothers with diabetes were separated from their parents without a good medical reason. The design of most maternity units, where neonatal expertise is predominantly concentrated in the neonatal unit, may partly explain why trusts are reluctant to provide care for these higher risk babies on a postnatal ward with their mothers. Bringing neonatal expertise close to the mothers as occurs in transitional care wards, may be the solution.
Neonatal care of term babies

93
Some quotes from the panel discussions
• ‘Should not have got cold, should not have gone to the neonatal unit, could have ended up breastfeeding.’
• ‘This was a routine admission to the neonatal unit. Breastfeeding was not initiated and unnecessary procedures were done.’
• ‘Blood glucose taken too early. This had an effect on care and the establishment of breastfeeding.’ • ‘If the blood glucose had not been done so soon, mother and baby may not have needed
to be separated.’ • ‘Mother wanted to breastfeed, but paediatric SHO overrode this and made the feed to be
infant formula.’ • ‘No management plan of care when baby transferred to postnatal ward and baby was left for
eight hours without a feed and not enough true blood glucose results.’
12.10 Recommendations
1. All units delivering women with diabetes should have a written policy for the management of the baby. The policy should assume that babies will remain with their mothers in the absence of complications.
2. Mothers with diabetes should be informed antenatally of the benefi cial effects of breastfeeding on metabolic control for both themselves and their babies.
3. Mothers with diabetes should be offered an opportunity for skin-to-skin contact with their babies immediately after delivery. Breastfeeding within one hour of birth should be encouraged.
4. Blood glucose testing performed too early should be avoided in well babies without signs of hypoglycaemia. Testing should be performed before a feed using a reliable method (ward-based glucose electrode or laboratory analysis). For all blood glucose tests, the time it is performed, method used, result, and action taken should be clearly documented in the notes. Further research is needed to defi ne the optimal timing of fi rst blood glucose test in babies of diabetic mothers.
5. Junior paediatric staff should be trained in the management of babies of mothers with diabetes. This should include appreciation of the importance of supporting early breastfeeding, avoidance of early blood glucose testing in the well baby, and formulation of a written plan agreed with the mother.
6. Midwives should recognise the importance of supporting early breastfeeding for women with diabetes, and the need to document this aspect of care.
The concerns described here probably extend beyond the specifi c group of babies of mothers with diabetes. They open a national debate on whether basic neonatal care can be delivered closer to the mother in maternity units in England, Wales and Northern Ireland.

94
References
1. Confi dential Enquiry into Maternal and Child Health. Maternity services in 2002 for women with type 1 and type 2 diabetes in England, Wales and Northern Ireland. CEMACH: London; 2004.
2. Confi dential Enquiry into Maternal and Child Health. Pregnancy in women with type 1 and type 2 diabetes in 2002-03, England, Wales and Northern Ireland. CEMACH: London; 2005.
3. “The Global Criteria for the WHO/UNICEF Baby-Friendly Hospital Initiative.” UNICEF. New York 1992. 4. Macfarlane A, Mungford M. Birth Counts: Statistics of pregnancy and childbirth. 2nd ed. Oxford:
National Perinatal Epidemiology Unit; 2000. 5. Care Recommendation: Recommendations for the management of pregnant women with diabetes
(including Gestational diabetes). Diabetes UK 2005. 6. Management of Diabetes. Scottish Intercollegiate Guidelines Network. 2001. SIGN Publication
No.55. Edinburgh: SIGN. 7. National Service Framework for Diabetes (England) Standards. Department of Health.
The Stationery Offi ce; London; 2001. 8. Broadfoot M, Britten J, Tappin DM, Mackenzie JM. The Baby Friendly Hospital Initiative and breast
feeding rates in Scotland. Arch Dis Child Fetal Neonatal Ed 2005; 90(2):F114-F116. 9. Kramer MS, Chalmers B, Hodnett ED, et al. Promotion of breastfeeding intervention trial (PROBIT).
JAMA 2001; 285(January 24/31):413-420. 10. Levy-Shiff R, Lerman M, Har-Even D, Hod M. Maternal adjustment and infant outcome in medically
defi ned high-risk pregnancy. Dev Psychol. 2002 Jan;38(1):93-103. 11. Christensson K, Siles C, Moreno L, Belaustequi A, De La Fuente P, Lagercrantz H, Puyol P, Winberg
J. Temperature, metabolic adaptation and crying in healthy full-term newborns cared for skin-to-skin or in a cot. Acta Paediatr. 1992 Jun-Jul;81(6-7):488-93.
12. Christensson K, Cabrera T, Christensson E, Uvnas-Moberg K, Winberg J. Separation distress call in the human neonate in the absence of maternal body contact. Acta Paediatr. 1995 May;84(5):468-73.
13. Anderson GC, Moore E, Hepworth J, Bergman N. Early skin-to-skin contact for mothers and their healthy newborn infants. Cochrane Database Syst Rev. 2003;(2):CD003519.
14. Williams AF. Hypoglycaemia of the newborn. Review of the literature. World Health Organisation, Geneva 1997.
15. Hawdon JM, Ward Platt MP, Aynsley-Green A. Patterns of metabolic adaptation for preterm and term infants in the fi rst neonatal week. Arch Dis Child 1992; 67:357-65.
16. Infant feeding survey 2000. The Stationery Offi ce: London; 2002. 17. Deshpande S, Ward Platt M. The investigation and management of neonatal hypoglycaemia.
Seminars in Fetal & Neonatal Medicine (2005). 10, 351-361. 18. de Rooy L, Hawdon Nutritional factors that affect the postnatal metabolic adaptation of full-term
small- and large-for-gestational-age infants. J. Pediatrics 2002 Mar;109 (3): E42. 19. Ellis M, Manandhar DS, Manandhar N, Land JM, Patel N, de L Costello AM. Comparison of two
cotside methods for the detection of hypoglycaemia among neonates in Nepal. Arch Dis Child Fetal Neonatal Ed 1996 Sep; 75(2):F122-5.
20. Dahlberg M, Whitelaw A. Evaluation of HemoCue Blood Glucose Analyzer for the instant diagnosis of hypoglycaemia in newborns. Scand J Clin Lab Invest 1997 Dec; 57(8):719-24.
21. Deshpande SA, Matthews JN, Platt MP. Measuring blood glucose in neonatal units: how does hemocue compare? Arch Dis Child Fetal Neonatal Ed. 1996 Nov;75(3):F202-8.
Neonatal care of term babies
95
External commentary
Patricia Hamilton President, Royal College of Paediatrics and Child Health
I welcome this important study conducted by CEMACH, and in particular their fi ndings relating to the babies of women with diabetes. This work confi rms what many have suspected, namely that the babies of women with diabetes are being admitted needlessly to neonatal units. Not only is there unnecessary separation from the mother, but also this inevitably has a negative impact on the success of breastfeeding. These two fi ndings are against all the principles of child-friendly hospitals that we are trying to endorse and implement, and we hope that as a result of this report we can encourage more babies to remain with their mothers and achieve a higher success rate for breastfeeding.
This having been said, there is also concern regarding the sub-standard neonatal management of hypoglycaemia, as well as early feeding. With the best of intentions, junior trainees have been making estimates of blood glucose concentrations in babies too early and acting unnecessarily at a time when the baby’s metabolism has not yet adjusted to extra uterine life and a low blood glucose concentration may be physiological. We hope that as a result of this report this practice will be improved.
CEMACH are to be congratulated on this careful piece of work, which will have practical implications for the betterment of the health of mothers and their babies.

96
13. Conclusions
The St. Vincent declaration in 19891 that ‘in fi ve years, the outcome of diabetic pregnancy should approximate that of non-diabetic pregnancy’, has not yet been achieved. However, there have been a number of national and local initiatives focusing on improving the care and outcomes of pregnant women with type 1 and type 2 diabetes.
The Diabetes National Service Framework 2, fi rst published by the Department of Health in 2001, set out a series of national standards for the care of people with diabetes. This included a standard for pregnancy which emphasised the importance of tight blood glucose control before conception and during pregnancy in order to optimise the chance of a good pregnancy outcome. The NSF includes key interventions, targets and illustrative service models which are available for NHS organisations to draw upon during the development of their local services, and local NHS performance will be assessed against the three-year and ten-year targets in the NSF’s Delivery Strategy.3 In addition, the Diabetes Commissioning Toolkit4 published by the Department of Health in November 2006 includes best practice quality markers, evidence of improvement, and key outcomes that should be sought by commissioners of services. In particular, it specifi es that there should be evidence of defi ned leadership within specialist services and integration between primary and secondary care for pre-pregnancy care and support.
The CEMACH Diabetes Programme has provided a comprehensive national overview of diabetes maternity services, standards of care for women with diabetes, and the possible reasons underlying suboptimal clinical care and lack of involvement of women in their own care. This should aid health care providers and commissioners in planning the most appropriate services for their local populations. The programme has highlighted a number of areas which need to be addressed. These include poor preparation for pregnancy and the need for effective education programmes for women of childbearing age with diabetes; fragmented preconception care services and variations in the standard of preconception care provided by health professionals; the increasing problem of women with type 2 diabetes and their different needs; and neonatal care policies.
As a response to the fi nding that the majority of women with diabetes are poorly prepared for pregnancy, CEMACH, together with the Royal College of General Practitioners and Diabetes UK, has published a joint information leafl et for GPs and the primary care team. This sets out information about the appropriate care and advice to provide for women of childbearing age with diabetes. The leafl et has been distributed to GPs throughout the UK and is also available for downloading from the CEMACH website.
Poor preparation for pregnancy appears to be the next barrier to overcome for women with diabetes. The CEMACH programme has found that pregnant women with type 2 diabetes, who are also more likely to be from a Black, Asian and Other ethnic minority group and live in a deprived area, appear to be less likely to access preconception care and annual diabetes reviews than women with type 1 diabetes. In order to better understand the reasons and possible solutions to this, CEMACH has commenced a research project with the University College London (UCL) Elizabeth Garrett Anderson Institute for Women’s Health which is funded by Novo Nordisk. This will investigate the issues affecting preconception care in women with type 1 and type 2 diabetes.
It is clear that commissioners and providers of health care in both primary and secondary care settings need to work collaboratively. Their joint aim should be to ensure that women with diabetes are better

97
informed and motivated to manage their diabetes before they become pregnant and that accessible multidisciplinary services are provided for them before pregnancy, during pregnancy and after delivery.
References
1. Workshop Report. Diabetes Care and Research in Europe: The Saint Vincent Declaration. Diabetic Med 1990:7;360.
2. Department of Health. National Service Framework for Diabetes (England) Standards. London: The Stationery Offi ce: 2001.
3. Department of Health. National Service Framework for Diabetes: Delivery Strategy. London: Department of Health: 2002 [http://www.dh.gov.uk/assetRoot/04/03/28/23/04032823.pdf] accessed 17 January 2007.
4. Department of Health. Diabetes Commissioning Toolkit. London: Department of Health: 2006 [http://www.dh.gov.uk/assetRoot/04/14/02/85/04140285.pdf] accessed 17 January 2007.

98
Appendix A: Pre-pregnancy care pro forma

99
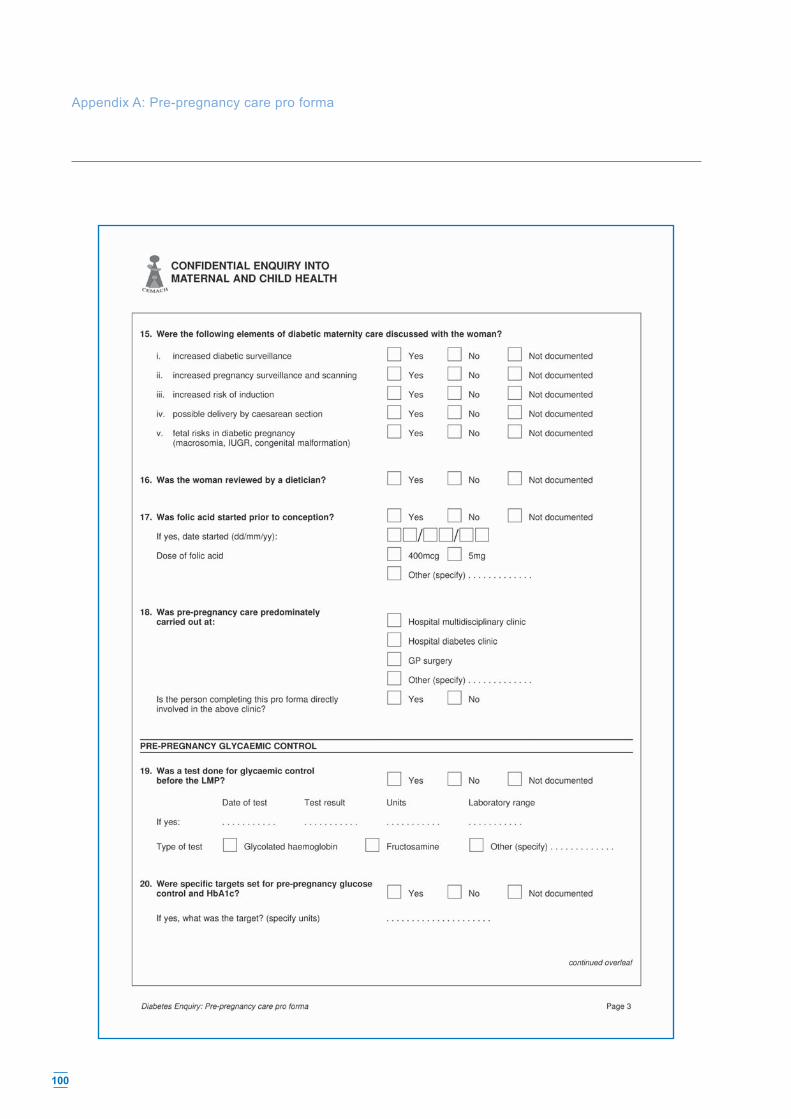
100
Appendix A: Pre-pregnancy care pro forma

101

102
Appendix B: Diabetes enquiry pro forma

103

104
Appendix B: Diabetes enquiry pro forma

105

106
Appendix B: Diabetes enquiry pro forma

107

108
Appendix B: Diabetes enquiry pro forma

109

110
Appendix B: Diabetes enquiry pro forma

111

112
Appendix B: Diabetes enquiry pro forma

113

114
Appendix B: Diabetes enquiry pro forma

115

116
Appendix B: Diabetes enquiry pro forma

117

118
Appendix B: Diabetes enquiry pro forma

119

120
Appendix C
Association between demographic and clinical characteristics, social and lifestyle factors, and clinical care with major fetal congenital anomaly in the offspring of women with type 1 and type 2 diabetes
Association of demographic characteristics with major fetal congenital anomaly in the offspring of women with type 1 and type 2 diabetesDemographic characteristic Cases
n/N (%)Controlsn/N (%)
Crude OR [95% CI]
Adjusted OR
Age - - 1.0 [1.0, 1.1] 1.0 [1.0, 1.1]b
Black, Asian or Other Ethnic Minority group 22/127 (17) 41/220 (19) 0.9 [0.5, 1.6] 0.6 [0.3, 1.2]a
Primigravidity 52/127 (41) 92/220 (42) 1.0 [0.6, 1.5] 1.1 [0.7, 1.8]a
Maternal social deprivationd - - 1.2 [1.0, 1.4] 1.2 [1.0, 1.4]c
a adjusted for maternal age and deprivation.b adjusted for maternal deprivation. c adjusted for maternal age. Odds ratio is for one year increase in maternal age.d Quintile of social deprivation derived from postcode of residence. Odds ratio is for unit increase in deprivation quintile.
Association of clinical characteristics with major fetal congenital anomaly in the offspring of women with type 1 and type 2 diabetesClinical characteristic Cases
n/N (%)Controlsn/N (%)
Crude OR[95% CI]
Adjusted ORa
Body Mass Index (BMI ≥ 30) 53/80 (66) 33/137 (24) 1.6 [0.9, 3.0] 1.3 [0.7, 2.5]Pre-existing diabetes complications 22/104 (21) 16/197 (8) 3.0 [1.5, 6.2] 3.1 [1.5, 6.3]Retinopathy in pregnancy 34/88 (39) 50/167 (30) 1.5 [0.9, 2.5] 1.5 [0.9, 2.7]Diabetic nephropathy in pregnancy 14/103 (13) 14/185 (8) 1.9 [0.9, 4.2] 1.7 [0.7, 3.9]Recurrent episodes of hypoglycaemia during pregnancy 56/109 (51) 105/205 (51) 1.0 [0.6, 1.6] 1.1 [0.6, 1.8]Severe hypoglycaemia during pregnancy (one or more episodes of hypoglycaemia requiring external help)
18/78 (23) 32/167 (19) 1.3 [0.7, 2.4] 1.4 [0.7, 2.8]
Antenatal evidence of fetal growth restriction 15/105 (14) 11/218 (5) 3.1 [1.4, 7.2] 3.0 [1.2, 7.0]Antenatal evidence of macrosomia(fetal size >90th centile) 21/100 (21) 76/216 (35) 0.5 [0.3, 0.9] 0.5 [0.3, 0.9]
a adjusted for maternal age and deprivation.

121
Association of social and lifestyle factors with major fetal congenital anomaly in the offspring of women with type 1 and type 2 diabetesSocial and lifestyle factor Cases
n/N (%)Controlsn/N (%)
Crude OR[95% CI]
Adjusted ORa
Unplanned pregnancy 43/75 (57) 55/144 (38) 2.2 [1.2, 3.9] 2.3 [1.3, 4.3]No contraceptive use in the 12 months before pregnancy 33/55 (60) 54/121 (45) 1.9 [1.0, 3.6] 2.0 [1.0, 4.0]No folic acid commenced prior to pregnancy 49/69 (71) 66/131 (50) 2.4 [1.3, 4.6] 2.3 [1.2, 4.5]Smoking 35/103 (34) 44/182 (24) 1.6 [1.0, 2.8] 2.2 [1.2, 3.9]Assessment of suboptimal approach of the woman to managing her diabetes before pregnancy
80/92 (86) 88/154 (57) 4.6 [2.3, 9.3] 5.0 [2.4, 10.2]
Assessment of suboptimal approach of the woman to managing her diabetes during pregnancy
62/110 (56) 56/207 (27) 3.5 [2.1, 5.8] 3.5 [2.0, 5.9]
a Adjusted for maternal age and deprivation.
Association of glycaemic control factors before and during pregnancy with major fetal congenital anomaly in the offspring of women with type 1 and type 2 diabetesGlycaemic control factor Cases
n/N (%)Controlsn/N (%)
Crude OR [95% CI]
Adjusted ORa
No test of glycaemic control before pregnancy
18/76 (24) 24/139 (17) 1.5 [0.7, 3.0] 1.2 [0.6, 2.6]
No local targets set for glycaemic control 20/43 (47) 28/86 (33) 1.8 [0.8, 3.9] 1.8 [0.8, 4.1]Assessment of suboptimal preconception glycaemic control 96/111 (86) 115/167 (69) 2.9 [1.5, 5.5] 3.6 [1.8, 7.2]Assessment of suboptimal 1st trimester glycaemic control 94/115 (82) 118/192 (61) 2.8 [1.6, 4.0] 3.3 [1.8, 6.0]Assessment of suboptimal glycaemic control after 1st trimester 78/112 (70) 76/209 (37) 4.0 [2.4, 6.8] 5.5 [3.2, 9.6]Assessment of suboptimal blood glucose control during labour and delivery 38/92 (41) 94/202 (47) 0.8 [0.5, 1.3] 0.9 [0.5, 1.5]No intravenous insulin and dextrose during labour and/or delivery 27/115 (23) 31/127 (14) 1.8 [1.0, 3.3] 1.8 [1.0, 3.3]
a Adjusted for maternal age and deprivation.

122
Association of preconception care factors in the 12 months prior to pregnancy with major fetal congenital anomaly in the offspring of women with type 1 and type 2 diabetesPreconception care factor Cases
n/N (%)Controlsn/N (%)
Crude OR [95% CI]
Adjusted ORa
No contraceptive advice provided before pregnancy
16/49 (33) 19/83 (23) 1.6 [0.7, 3.6] 1.6 [0.7, 3.8]
No discussion of the following specifi c diabetes issues:
Alcohol 15/36 (42) 19/66 (29) 1.8 [0.8, 4.2] 2.2 [0.9, 5.7]Diet 10/56 (18) 12/100 (12) 1.6 [0.6, 4.0] 1.6 [0.6, 4.2]Poor glycaemic control 8/66 (12) 14/117 (12) 1.0 [0.4, 2.6] 0.8 [0.3, 2.2]Retinopathy 11/50 (22) 25/96 (26) 0.8 [0.4, 1.8] 0.6 [0.3, 1.6]Nephropathy 13/40 (33) 29/76 (38) 0.8 [0.4, 1.8] 0.5 [0.2, 1.4]Hypertension 12/39 (31) 23/75 (31) 1.0 [0.4, 2.3] 0.6 [0.2, 1.7]
No discussion of the following pregnancy issues:
Increased diabetes surveillance 5/61 (8) 7/124 (6) 1.5 [0.5, 4.9] 1.4 [0.4, 5.0]Increased pregnancy surveillance 5/62 (8) 8/124 (6) 1.3 [0.4, 4.1] 1.2 [0.4, 4.0]Increased risk of induction 10/43 (23) 14/110 (13) 2.1 [0.8, 5.2] 2.3 [0.9, 6.0]Possible caesarean section 7/49 (14) 11/110 (10) 1.5 [0.5, 4.2] 1.8 [0.6, 5.2]Fetal risks in diabetic pregnancy 7/52 (13) 7/114 (6) 2.4 [0.8, 7.3] 2.8 [0.8, 9.3]No dietetic review 24/69 (35) 42/135 (61) 1.2 [0.6, 2.2] 1.2 [0.6, 2.2]
No assessment of the following diabetes complications in the 12 months prior to pregnancy:
Baseline retinal examination 19/80 (24) 18/137 (13) 2.1 [1.0, 4.2] 2.0 [0.9, 4.4]Baseline test of renal function 12/72 (17) 15/133 (11) 1.6 [0.7, 3.6] 1.6 [0.6, 3.9]
Assessment of albuminuria 22/62 (35) 30/109 (28) 1.5 [0.7, 2.8] 1.4 [0.7, 3.0]Assessment of suboptimal preconception care (excluding glycaemic control) 68/75 (91) 80/134 (60) 6.6 [2.7, 16.2] 7.0 [2.9, 17.1]
a Adjusted for maternal age and deprivation.
Appendix C

123
Association of diabetes care factors (excluding glycaemic control) with major fetal congenital anomaly in the offspring of women with type 1 and type 2 diabetesDiabetes care factor Cases
n/N (%)Controlsn/N (%)
Crude OR[95% CI]
Adjusted ORa
No retinal assessment during 1st trimester or at booking if later 43/111 (39) 49/183 (27) 1.7 [1.0, 2.9] 1.5 [0.9, 2.6]No referral to ophthalmologist (if retinopathy present) 4/29 (14) 21/44 (48) 0.2 [0.1, 0.6] 0.1 [0.0, 0.4]No monitoring for nephropathy 27/118 (23) 26/206 (13) 2.1 [1.1, 3.8] 2.0 [1.1, 3.7]No test of renal function (if nephropathy present) 4/12 (33) 5/14 (36) 0.9 [0.2, 4.7] 0.4 [0.1, 3.2]Assessment of suboptimal diabetes care during pregnancy 74/113 (65) 112/204 (55) 1.6 [1.0, 2.5] 1.4 [0.9, 2.3]
a Adjusted for maternal age and deprivation.
Association of maternity care factors with major fetal congenital anomaly in the offspring of women with type 1 and type 2 diabetesMaternity care factor Cases
n/N (%)Controlsn/N (%)
Crude OR[95% CI]
Adjusted ORa
Assessment of suboptimal fetal monitoring (with antenatal evidence of growth restricted baby)
1/13 (8) 1/11 (9) 0.8 [0.0, 16.1] 0.4 [0.0, 8.0]
Assessment of suboptimal fetal monitoring (with antenatal evidence of fetal size >90th centile)
7/20 (35) 27/73 (37) 1.2 [0.4, 3.3] 1.1 [0.3, 3.7]
No discussion of mode and timing of delivery 6/102 (6) 4/202 (2) 3.1 [0.9, 11.3] 2.5 [0.6, 9.8]No administration of antenatal corticosteroidsb 12/34 (35) 12/33 (36) 1.0 [0.4, 2.6] 1.0 [0.3, 2.9]Assessment of suboptimal maternity care during the antenatal period 57/125 (46) 95/215 (44) 1.1 [0.7, 1.7] 1.1 [0.7, 1.8]Assessment of suboptimal maternity care during labour and delivery 44/111 (40) 72/213 (34) 1.3 [0.8, 2.1] 1.3 [0.8, 2.1]
a Adjusted for maternal age and deprivation.b Analysis restricted to babies delivering from 24+0 to 35+6 weeks gestation and excluding antepartum stillbirths.

124
Association of postnatal care factors with major fetal congenital anomaly in the offspring of women with type 1 and type 2 diabetesPostnatal care factor Cases
n/N (%)Controls n/N (%)
Crude OR[95% CI]
Adjusted ORa
No postnatal contraceptive advice 39/83 (47) 26/163 (16) 4.7 [2.5, 3.9] 4.3 [2.3, 8.2]No written plan for post-delivery diabetes management 19/100 (19) 25/188 (13) 1.5 [0.8, 3.0] 1.8 [0.9, 3.5]Assessment of suboptimal postnatal diabetes care 72/116 (62) 106/211 (50) 1.6 [1.0, 2.6] 1.4 [0.9, 2.3]
a Adjusted for maternal age and deprivation.
Appendix C

125
Appendix D
Association of demographic and clinical characteristics, social and lifestyle factors, and clinical care with all fetal and neonatal deaths from 20 weeks of gestation up to 28 days after delivery in babies of women with type 1 and type 2 diabetes
Association of demographic characteristics with fetal and neonatal death from 20 weeks gestation in babies of women with type 1 and type 2 diabetes
Demographic characteristic
Casesn/N (%)
Controlsn/N (%)
Crude OR[95% CI] Adjusted OR
Age - - 1.0 [1.0, 1.0] 1.0 [1.0, 1.0]b
Black, Asian or Other Ethnic Minority group 35/137 (26) 41/220 (19) 1.5 [0.9, 2.5] 1.2 [0.7, 2.2]a
Primigravidity 65/137 (47) 92/220 (42) 1.3 [0.8, 1.9] 1.4 [0.9, 2.3]a
Maternal social deprivationd - - 1.2 [1.0, 1.4] 1.2 [1.0, 1.4]c
a adjusted for maternal age and deprivation.b adjusted for maternal deprivation. c adjusted for maternal age. Odds ratio is for one year increase in maternal age.d Quintile of social deprivation derived from postcode of residence. Odds ratio is for unit increase in deprivation quintile.
Association of clinical characteristics with fetal and neonatal death from 20 weeks gestation in babies of women with type 1 and type 2 diabetes
Clinical characteristicCasesn/N (%)
Controlsn/N (%)
Crude OR[95% CI]
Adjusted ORa
Body Mass Index (BMI ≥ 30) 22/81 (27) 33/137 (24) 1.2 [0.6, 2.2] 1.0 [0.5, 2.1]Pre-existing diabetes complications 25/115 (22) 16/197 (8) 3.1 [1.6, 6.3] 2.7 [1.3, 5.5]
Retinopathy in pregnancy 32/89 (36) 50/167 (30) 1.3 [0.8, 2.3] 1.5 [0.8, 2.6]Diabetic nephropathy in pregnancy 17/108 (16) 14/185 (8) 2.3 [1.1, 4.9] 2.0 [0.9, 4.5]
Recurrent episodes of hypoglycaemia during pregnancy
62/125 (50) 105/205 (51) 0.9 [0.6, 1.5] 1.1 [0.7, 1.8]
Severe hypoglycaemia during pregnancy (one or more episodes of hypoglycaemia requiring external help)
16/90 (18) 32/167 (19) 0.9 [0.5, 1.8] 1.0 [0.5, 2.1]
Antenatal evidence of fetal growth restriction 14/113 (12) 11/218 (5) 2.7 [1.2, 6.1] 2.6 [1.1, 6.2]
Antenatal evidence of macrosomia (fetal size >90th centile)
34/109 (31) 76/216 (35) 0.8 [0.5, 1.4] 0.9 [0.6, 1.5]
a adjusted for maternal age and deprivation.

126
Appendix D
Association of social and lifestyle factors with fetal and neonatal death from 20 weeks gestation in babies of women with type 1 and type 2 diabetes
Social and lifestyle factorCasesn/N (%)
Controlsn/N (%)
Crude OR[95% CI]
Adjusted ORa
Unplanned pregnancy 40/88 (45) 55/144 (38) 1.4 [0.8, 2.3] 1.3 [0.7, 2.4]No contraceptive use in the 12 months before pregnancy 49/72 (68) 54/121 (45) 2.6 [1.4, 5.0] 2.5 [1.3, 4.8]
No folic acid commenced prior to pregnancy 48/74 (65) 66/131 (50) 1.8 [1.0, 3.3] 2.0 [1.1, 3.7]
Smoking 43/115 (37) 44/182 (24) 1.9 [0.1, 3.1] 2.1 [1.2, 3.6]Assessment of suboptimal approach of the woman to managing her diabetes before pregnancy
83/98 (85) 88/154 (57) 4.2 [2.1, 8.1] 4.7 [2.3, 9.3]
Assessment of suboptimal approach of the woman to managing her diabetes during pregnancy
76/124 (61) 56/207 (27) 4.3 [2.6, 7.1] 3.9 [2.4, 6.5]
a adjusted for maternal age and deprivation.
Association of glycaemic control factors with fetal and neonatal death from 20 weeks gestation in babies of women with type 1 and type 2 diabetes
Glycaemic control factorCasesn/N (%)
Controlsn/N (%)
Crude OR [95% CI]
Adjusted ORa
No test of glycaemic control before pregnancy 25/90 (28) 24/139 (17) 1.8 [1.0, 3.5] 1.8 [0.9, 3.4]
No local targets set for glycaemic control 31/61 (51) 28/86 (33) 2.1 [1.1, 4.3] 2.1 [1.0, 4.4]
Assessment of suboptimal preconception glycaemic control
103/115 (90) 115/167 (69) 3.9 [1.9, 7.9] 4.3 [2.1, 8.7]
Assessment of suboptimal 1st trimester glycaemic control 109/129 (85) 118/192 (61) 3.4 [1.9, 6.1] 3.4 [1.9, 6.1]
Assessment of suboptimal glycaemic control after 1st trimester
96/133 (72) 76/209 (37) 4.5 [2.7, 7.5] 5.0 [3.0, 8.4]
Assessment of suboptimal blood glucose control during labour and delivery
47/101 (47) 94/202 (47) 1.0 [0.6, 1.6] 1.1 [0.7, 1.8]
No intravenous insulin and dextrose during labour and/or delivery
31/133 (26) 31/127 (14) 2.1 [1.2, 3.6] 2.0 [1.2, 3.6]
a adjusted for maternal age and deprivation.
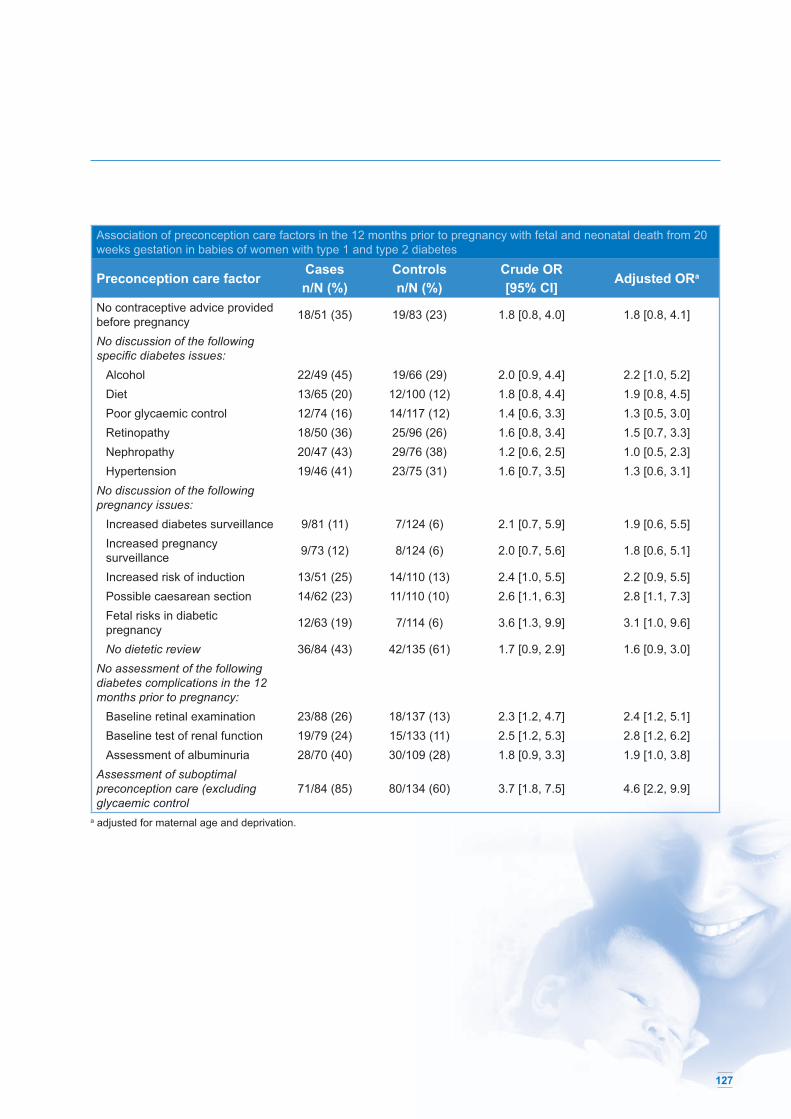
127
Association of preconception care factors in the 12 months prior to pregnancy with fetal and neonatal death from 20 weeks gestation in babies of women with type 1 and type 2 diabetes
Preconception care factorCasesn/N (%)
Controlsn/N (%)
Crude OR[95% CI]
Adjusted ORa
No contraceptive advice provided before pregnancy 18/51 (35) 19/83 (23) 1.8 [0.8, 4.0] 1.8 [0.8, 4.1]
No discussion of the following specifi c diabetes issues:
Alcohol 22/49 (45) 19/66 (29) 2.0 [0.9, 4.4] 2.2 [1.0, 5.2]Diet 13/65 (20) 12/100 (12) 1.8 [0.8, 4.4] 1.9 [0.8, 4.5]Poor glycaemic control 12/74 (16) 14/117 (12) 1.4 [0.6, 3.3] 1.3 [0.5, 3.0]Retinopathy 18/50 (36) 25/96 (26) 1.6 [0.8, 3.4] 1.5 [0.7, 3.3]Nephropathy 20/47 (43) 29/76 (38) 1.2 [0.6, 2.5] 1.0 [0.5, 2.3]Hypertension 19/46 (41) 23/75 (31) 1.6 [0.7, 3.5] 1.3 [0.6, 3.1]
No discussion of the following pregnancy issues:
Increased diabetes surveillance 9/81 (11) 7/124 (6) 2.1 [0.7, 5.9] 1.9 [0.6, 5.5]Increased pregnancy surveillance 9/73 (12) 8/124 (6) 2.0 [0.7, 5.6] 1.8 [0.6, 5.1]
Increased risk of induction 13/51 (25) 14/110 (13) 2.4 [1.0, 5.5] 2.2 [0.9, 5.5]Possible caesarean section 14/62 (23) 11/110 (10) 2.6 [1.1, 6.3] 2.8 [1.1, 7.3]Fetal risks in diabetic pregnancy 12/63 (19) 7/114 (6) 3.6 [1.3, 9.9] 3.1 [1.0, 9.6]
No dietetic review 36/84 (43) 42/135 (61) 1.7 [0.9, 2.9] 1.6 [0.9, 3.0]No assessment of the following diabetes complications in the 12 months prior to pregnancy:
Baseline retinal examination 23/88 (26) 18/137 (13) 2.3 [1.2, 4.7] 2.4 [1.2, 5.1]Baseline test of renal function 19/79 (24) 15/133 (11) 2.5 [1.2, 5.3] 2.8 [1.2, 6.2]Assessment of albuminuria 28/70 (40) 30/109 (28) 1.8 [0.9, 3.3] 1.9 [1.0, 3.8]
Assessment of suboptimal preconception care (excluding glycaemic control
71/84 (85) 80/134 (60) 3.7 [1.8, 7.5] 4.6 [2.2, 9.9]
a adjusted for maternal age and deprivation.

128
Appendix D
Association of diabetes care factors with fetal and neonatal death from 20 weeks gestation in babies of women with type 1 and type 2 diabetes
Diabetes care factorCasesn/N (%)
Controlsn/N (%)
Crude OR[95% CI]
Adjusted ORa
No retinal assessment during 1st trimester or at booking if later
43/120 (36) 49/183 (27) 1.5 [0.9, 2.5] 1.4 [0.8, 2.3]
No referral to ophthalmologist (if retinopathy present) 9/26 (35) 21/44 (48) 0.6 [0.2, 1.6] 0.4 [0.1, 1.3]
No monitoring for nephropathy 27/130 (21) 26/206 (13) 1.8 [1.0, 3.3] 1.8 [1.0, 3.2]No test of renal function (if nephropathy present) 9/16 (56) 5/14 (36) 2.3 [0.5, 10.7] 2.7 [0.5, 13.8]
Assessment of suboptimal diabetes care during pregnancy
90/128 (70) 112/204 (55) 2.0 [1.2, 3.1] 1.8 [1.1, 3.0]
a adjusted for maternal age and deprivation.
Association of maternity care factors with fetal and neonatal death from 20 weeks gestation in babies of women with type 1 and type 2 diabetes
Maternity care factor Casesn/N (%)
Controlsn/N (%)
Crude OR[95% CI]
Adjusted ORa
Assessment of suboptimal fetal monitoring (with antenatal evidence of growth restricted baby)
6/14 (43) 1/11 (9) 7.5 [0.6, 95.5] 4.4 [0.4, 49.9]
Assessment of suboptimal fetal monitoring (with antenatal evidence of fetal size >90th centile)
29/33 (88) 27/73 (37) 15.8 [4.0, 61.5] 18.3 [5.6, 59.6]
No discussion of mode and timing of delivery 11/111 (10) 4/202 (2) 5.45 [1.7, 17.9] 5.0 [1.5, 16.5]
No administration of antenatal corticosteroidsb 6/14 (43) 12/33 (36) 1.3 [0.4, 4.8] 1.1 [0.3, 4.4]
Assessment of suboptimal maternity care during the antenatal period
91/132 (69) 95/215 (44) 2.8 [1.8, 4.5] 2.9 [1.8, 4.7]
Assessment of suboptimal maternity care during labour and delivery
51/125 (41) 72/213 (34) 1.4 [0.9, 2.1] 1.3 [0.8, 2.2]
a Adjusted for maternal age and deprivation.b Analysis restricted to babies delivering from 24+0 to 35+6 weeks gestation and excluding antepartum stillbirths.

129
Association of postnatal care factors with fetal and neonatal death from 20 weeks gestation in babies of women with type 1 and type 2 diabetes
Postnatal care factorCasesn/N (%)
Controls n/N (%)
Crude OR[95% CI]
Adjusted ORa
No postnatal contraceptive advice 41/89 (46) 26/163 (16) 4.5 [2.4, 8.4] 4.8 [2.6, 9.0]
No written plan for post-delivery diabetes management
20/120 (17) 25/188 (13) 1.3 [0.7, 2.5] 1.4 [0.7, 2.8]
Assessment of suboptimal postnatal diabetes care 86/127 (68) 106/211 (50) 2.1 [1.3, 3.3] 2.1 [1.3, 3.5]
a adjusted for maternal age and deprivation.

130
Appendix E
Association between demographic and clinical characteristics, social and lifestyle issues, and clinical care with fetal and neonatal deaths (excluding major fetal congenital anomaly) from 20 weeks of gestation up to 28 days after delivery in babies of women with type 1 and type 2 diabetes
Association between demographic characteristics of fetal and neonatal deaths (excluding major fetal congenital anomaly) from 20 weeks gestation in babies of women with type 1 and type 2 diabetes
Demographic characteristic Casesn/N (%)
Controlsn/N (%)
Crude OR[95% CI] Adjusted OR
Age - - 1.0 [1.0, 1.0] 1.0 [1.0, 1.0]b
Black, Asian or Other Ethnic Minority group 25/95 (26) 41/220 (19) 1.6 [0.9, 2.8] 1.3 [0.7, 2.5]a
Primigravidity 48/95 (51) 92/220 (42) 1.4 [0.9, 2.3] 1.5 [0.9, 2.7]a
Maternal social deprivationd - - 1.2 [1.0, 1.4] 1.2 [1.0, 1.5]c
a adjusted for maternal age and deprivation.b adjusted for maternal deprivation. c adjusted for maternal age. Odds ratio is for one year increase in maternal age.d Quintile of social deprivation derived from postcode of residence. Odds ratio is for unit increase in deprivation quintile.
Association between clinical characteristics of fetal and neonatal deaths (excluding major fetal congenital anomaly) from 20 weeks gestation in babies of women with type 1 and type 2 diabetes
Clinical characteristic Casesn/N (%)
Controlsn/N (%) Crude OR [95% CI] Adjusted ORa
Body Mass Index (BMI ≥ 30) 13/56 (23) 33/137 (24) 1.0 [0.5, 2.0] 0.8 [0.3, 1.7]Pre-existing diabetes complications 15/78 (19) 16/197 (8) 2.7 [1.3, 5.8] 2.1 [0.9, 4.8]
Retinopathy in pregnancy 21/61 (34) 50/167 (30) 1.2 [0.7, 2.3] 1.3 [0.7, 2.6]Diabetic nephropathy in pregnancy 14/71 (20) 14/185 (8) 3.0 [1.3, 6.8] 2.6 [1.1, 6.1]
Recurrent episodes of hypoglycaemia during pregnancy
42/86 (49) 105/205 (51) 0.9 [0.6, 1.5] 1.1 [0.6, 1.9]
Severe hypoglycaemia during pregnancy (one or more episodes of hypoglycaemia requiring external help)
13/66 (20) 32/167 (19) 1.0 [0.5, 2.1] 1.2 [0.5, 2.6]
Antenatal evidence of fetal growth restriction 11/81 (14) 11/218 (5) 3.0 [1.2, 7.2] 3.0 [1.2, 7.5]
Antenatal evidence of macrosomia (fetal size >90th centile)
32/79 (41) 76/216 (35) 1.3 [0.7, 2.1] 1.4 [0.8, 2.4]
a Adjusted for maternal age and deprivation.

131
Association between social and lifestyle factors of fetal and neonatal deaths (excluding major fetal congenital anomaly) from 20 weeks gestation in babies of women with type 1 and type 2 diabetes
Social and lifestyle factor Casesn/N (%)
Controlsn/N (%) Crude OR [95% CI] Adjusted ORa
Unplanned pregnancy 29/66 (44) 55/144 (38) 1.3 [0.7, 2.3] 1.2 [0.6, 2.3]No contraceptive use in the 12 months before pregnancy 38/53 (72) 54/121 (45) 3.1 [1.5, 6.5] 2.7 [1.3, 5.8]
No folic acid commenced prior to pregnancy 34/51 (67) 66/131 (50) 2.0 [1.0, 3.9] 2.1 [1.0, 4.4]
Smoking 28/80 (35) 44/182 (24) 1.7 [1.0, 3.0] 1.7 [0.9, 3.2]Assessment of suboptimal approach of the woman to managing her diabetes before pregnancy
57/67 (85) 88/154 (57) 4.3 [2.0, 9.3] 4.8 [2.1, 10.7]
Assessment of suboptimal approach of the woman to managing her diabetes during pregnancy
56/87 (64) 56/207 (27) 4.9 [2.8, 8.6] 4.4 [2.5, 7.8]
a Adjusted for maternal age and deprivation.
Association between glycaemic control factors of fetal and neonatal deaths (excluding major fetal congenital anomaly) from 20 weeks gestation in babies of women with type 1 and type 2 diabetes
Glycaemic control factor Casesn/N (%)
Controlsn/N (%)
Crude OR [95% CI] Adjusted ORa
No test of glycaemic control before pregnancy 18/63 (29) 24/139 (17) 1.9 [0.9, 3.9] 1.9 [0.9, 4.0]
No evidence of local targets set for glycaemic control 24/47 (51) 28/86 (33) 2.2 [1.0, 4.6] 2.2 [1.0, 4.9]
Assessment of suboptimal preconception glycaemic control
69/76 (91) 115/167 (69) 4.5 [1.9, 10.6] 4.8 [2.0, 11.6]
Assessment of suboptimal 1st trimester glycaemic control 77/89 (87) 118/192 (61) 4.0 [2.0, 8.1] 3.9 [1.9, 7.8]
Assessment of suboptimal glycaemic control after 1st trimester
68/93 (73) 76/209 (37) 4.8 [2.7, 8.4] 5.1 [2.9, 9.1]
Assessment of suboptimal blood glucose control during labour and delivery
35/70 (50) 94/202 (47) 1.2 [0.7, 2.0] 1.2 [0.7, 2.2]
No intravenous insulin and dextrose during labour and/or delivery
21/93 (23) 31/127 (14) 1.8 [0.9, 3.3] 1.8 [0.9, 3.4]
a Adjusted for maternal age and deprivation.

132
Association between preconception care factors in the 12 months prior to pregnancy of fetal and neonatal deaths (excluding major fetal congenital anomaly) from 20 weeks gestation in babies of women with type 1 and type 2 diabetes
Preconception care factor Casesn/N (%)
Controlsn/N (%)
Crude OR[95% CI] Adjusted ORa
No contraceptive advice provided before pregnancy 12/36 (33) 19/83 (23) 1.7 [0.7, 4.0] 1.6 [0.7, 3.8]
No discussion of the following specifi c diabetes issues: Alcohol 16/34 (47) 19/66 (29) 2.2 [0.9, 5.3] 2.7 [1.1, 6.9] Diet 10/47 (21) 12/100 (12) 2.0 [0.8, 5.0] 2.1 [0.8, 5.4] Poor glycaemic control 10/52 (19) 14/117 (12) 1.8 [0.7, 4.3] 1.6 [0.7, 4.0] Retinopathy 14/33 (42) 25/96 (26) 2.1 [0.9, 4.9] 2.0 [0.8, 4.7] Nephropathy 15/34 (44) 29/76 (38) 1.3 [0.6, 2.9] 1.2 [0.5, 2.8] Hypertension 15/32 (47) 23/75 (31) 2.0 [0.8, 4.7] 1.7 [0.7, 4.3]No discussion of the following pregnancy issues: Increased diabetes surveillance 8/62 (13) 7/124 (6) 2.5 [0.8, 7.3] 2.3 [0.8, 6.8]
Increased pregnancy surveillance 8/55 (15) 8/124 (6) 2.5 [0.9, 7.0] 2.2 [0.8, 6.5]
Increased risk of induction 11/40 (28) 14/110 (13) 2.6 [1.1, 6.5] 2.3 [0.9, 6.2] Possible caesarean section 13/46 (28) 11/110 (10) 3.6 [1.4, 8.9] 3.7 [1.4, 10.2] Fetal risks in diabetic pregnancy 10/46 (22) 7/114 (6) 4.3 [1.5, 12.4] 3.6 [1.1, 11.6]
No dietetic review 22/60 (37) 42/135 (61) 1.3 [0.7, 2.4] 1.3 [0.6, 2.5]No assessment of the following diabetes complications in the 12 months prior to pregnancy: Baseline retinal examination 17/61 (28) 18/137 (13) 2.6 [1.2, 5.5] 2.6 [1.2, 5.9]
Baseline test of renal function 14/58 (24) 15/133 (11) 2.5 [1.1, 5.7] 2.6 [1.1, 6.3]
Assessment of albuminuria 19/54 (35) 30/109 (28) 1.4 [0.7, 2.9] 1.6 [0.8, 3.3]Assessment of suboptimal preconception care (excluding glycaemic control)
48/58 (83) 80/134 (60) 3.2 [1.5, 7.1] 4.0 [0.7, 9.4]
a Adjusted for maternal age and deprivation.
Appendix E

133
Association between diabetes care factors of fetal and neonatal deaths (excluding major fetal congenital anomaly) from 20 weeks gestation in babies of women with type 1 and type 2 diabetes
Diabetes care factor Casesn/N (%)
Controlsn/N (%) Crude OR [95% CI] Adjusted ORa
27/83 (33) 49/183 (27) 1.3 [0.8, 2.3] 1.2 [0.7, 2.2]No referral to ophthalmologist (if retinopathy present) 6/16 (38) 21/44 (48) 0.7 [0.2, 2.2] 0.6 [0.2, 2.3]
No monitoring for nephropathy 19/91 (21) 26/206 (13) 1.8 [1.0, 3.5] 1.8 [0.9, 3.5]
No test of renal function (if nephropathy present) 8/14 (58) 5/14 (36) 2.4 [0.5, 11.7] 2.9 [0.5, 15.8]
Assessment of suboptimal diabetes care during pregnancy
67/91 (74) 112/204 (55) 2.3 [1.3, 4.0] 2.2 [1.3, 3.9]
a Adjusted for maternal age and deprivation.
Association between maternity care factors of fetal and neonatal deaths (excluding major fetal congenital anomaly) from 20 weeks gestation in babies of women with type 1 and type 2 diabetes
Maternity care factor Casesn/N (%)
Controlsn/N (%)
Crude OR[95% CI] Adjusted ORa
Assessment of suboptimal fetal monitoring (with antenatal evidence of growth restricted baby)
5/11 (45) 1/11 (9) 8.3 [0.6, 119.3] 5.2 [0.4, 62.8]
Assessment of suboptimal fetal monitoring (with antenatal evidence of fetal size >90th centile)
28/32 (88) 27/73 (37) 15.2 [3.9, 59.2] 17.7 [5.4, 57.6]
No discussion of mode and timing of delivery 9/79 (12) 4/202 (2) 6.7 [1.9, 23.0] 5.9 [1.7, 20.7]
No administration of antenatal corticosteroidsb 2/7 (29) 12/33 (36) 0.7 [0.1, 4.3] 0.4 [0.0, 4.1]
Assessment of suboptimal maternity care during the antenatal period
68/90 (76) 95/215 (44) 3.9 [2.2, 7.0] 4.2 [2.3, 7.4]
Assessment of suboptimal maternity care during labour and delivery
34/88 (39) 72/213 (34) 1.2 [0.7, 2.1] 1.2 [0.7, 2.1]
a Adjusted for maternal age and deprivation.b Analysis restricted to babies delivering from 24+0 to 35+6 weeks gestation and excluding antepartum stillbirths.

134
Association between postnatal care factors of fetal and neonatal deaths (excluding major fetal congenital anomaly) from 20 weeks gestation in babies of women with type 1 and type 2 diabetes
Postnatal care factor Casesn/N (%)
Controls n/N (%) Crude OR [95% CI] Adjusted ORa
No postnatal contraceptive advice 24/60 (40) 26/163 (16) 3.5 [1.8, 7.0] 4.1 [2.0, 8.2]No written plan for post-delivery diabetes management 12/84 (14) 25/188 (13) 1.1 [0.5, 2.3] 1.2 [0.5, 2.6]
Assessment of suboptimal postnatal diabetes care 61/87 (70) 106/211 (50) 2.3 [1.4, 4.0] 2.5 [1.4, 4.3]
a Adjusted for maternal age and deprivation.
Appendix E

135
Appendix F - CEMACH advisory groups & contributors
Appendix F - CEMACH advisory groups & contributors
Diabetes Professional Advisory Group
Stephen Walkinshaw Chair, Consultant Obstetrician, Liverpool Women’s Hospital Jean Chapple Consultant in Perinatal Epidemiology, Westminster Primary Care Trust
Richard Congdon CEMACH Chief Executive Simon Court Consultant Paediatrician, Newcastle General Hospital (Diabetes UK)
Pat Doyle Epidemiologist, London School of Hygiene & Tropical Medicine Kate Fleming CEMACH Senior Data Analyst (until November 2006)
Shona Golightly CEMACH Director of Development and Research Olwen Harrison Diabetes Nurse Specialist, North Hampshire Hospital
Jane Hawdon Consultant Neonatologist, University College London HospitalsGillian Hawthorne Consultant Diabetes Physician, Newcastle General Hospital
Anita Holdcroft Consultant Anaesthetist, Chelsea and Westminster Hospital, LondonJulie Maddocks CEMACH Regional Manager (North West & West Midlands) Mary Macintosh CEMACH Medical Director (Until May 2006)
Rona McCandlish Professor of Midwifery, National Perinatal Epidemiology Unit Jo Modder CEMACH Clinical Director (Obstetrics)
Alison Miller CEMACH Programme Director and Midwifery Lead Mary Pierce Royal College of General Practitioners representative Bob Young Consultant Diabetes Physician, Hope Hospital, Salford
CEMACH Central Offi ce Staff
Dominique Acolet Clinical Director (Perinatal Epidemiology) Naufi l Alam Data Analyst
Jessica Berenston-Shaw National Clinical Projects Advisor John Bolton Accountant
Nicola Cogdell Administrative Assistant Kirshnee Chetty Administrative Assistant (until February 2007)
Richard Congdon Chief Executive Shona Golightly Director of Research and Development
Rosie Houston Assistant Projects Manager Mary Humphreys Offi ce Administrator
Alison Miller Programme Director and Midwifery Lead Jo Modder Clinical Director (Obstetrics)
Iman Mortagy Data Analyst Dharmishta Parmar Data Manager
Gale Pearson Clinical Director (Child Health) Maureen Wilson Committee Administrator

136
Appendix F - CEMACH advisory groups & contributors
CEMACH Regional Managers
Lesley Anson Yorkshire & Humberside (until March 2006) Angela Bell Northern Ireland
Melanie Gompels South East and the Channel Islands Carol Hay East of England
Julie Maddocks North West / West Midlands Marjorie Renwick North East
Dawn Roberts Wales Rachel Thomas London
Rosie Thompson South West Sue Wood East Midlands and Yorkshire & Humberside
Panel Chairs
Carol Axon Midwife, South West Philip Banfi eld Consultant Obstetrician, Wales
Miriam Bonduelle Consultant Obstetrician, Wales Ian Casson Consultant Physician, North West
Jean Chapple Consultant in Perinatal Epidemiology, London Elizabeth Draper Senior Research Fellow in Reproductive and Paediatric Epidemiology, East Midlands
D A Evans Consultant Obstetrician, North East Robert Fraser Reader in Reproductive & Developmental Medicine, Consultant in Obstetrics
& Gynaecology, Yorkshire & Humberside Malcolm Griffi ths Consultant Obstetrician & Gynaecologist, East of England
Paul Jennings Consultant Physician in Diabetes and Endocrinology, Yorkshire & Humberside Boon Lim Consultant Obstetrician, East of England
Michael Maresh Consultant Obstetrician, North West Heulwen Morgan Consultant Obstetrician, London
C M Ritchie Consultant Physician, Northern Ireland A I Traub Consultant Obstetrician, Northern Ireland
Matthew Coleman Consultant Obstetrician, South East Michael Gillmer Consultant Obstetrician, South East
Andrew Johnson Consultant Physician, South West Michael Quinn Consultant Paediatrician, South West
Dorothea Smith Midwife, South East Derek Tuffnell Consultant Obstetrician, Yorkshire & Humberside
Christopher Watts Director of Public Health, London Sarah Wilson Director of Public Health, East Midlands
Christopher Wright Consultant Perinatal Pathologist, North East

137
Peer Reviewers
Tim Clayton Senior Lecturer in Medical Statistics, London School of Hygiene & Tropical Medicine Anne Dornhurst Consultant Physician & Honorary Clinical Senior Lecturer, Imperial College, London
Pat Doyle Epidemiologist, London School of Hygiene & Tropical Medicine Ian Greer Consultant Obstetrician, Dean of Hull York Medical School
Michael Kinsella Consultant Anaesthetist, St Michael’s Hospital, Bristol Michael Maresh Consultant Obstetrician, St Mary’s Hospital for Women and Children, Manchester Mary Macintosh Director, National Chlamydia Screening Programme David McCance Consultant Physician, Royal Victoria Hospital, Belfast
Christopher Watts Director of Public Health, Lewisham Primary Care Trust Joy Williams Senior Diabetes Nurse Specialist, Worthing Hospital
Neonatal Enquiry Steering Group
Jane Hawdon Chair, Neonatologist, University College London Hospitals Dominique Acolet CEMACH Clinical Director (Perinatal Epidemiology)
Kate Fleming Senior Data Analyst, CEMACH (until November 2006) Caron Gooch Diabetes Specialist Midwife, Lewisham
Rosie Houston CEMACH Assistant Projects Manager Alree Hunt Modern Matron, SCBU, Queen Elizabeth, Woolwich
Alison Johns Transitional Care Sister, Neonatal Services, University College London Hospitals Jana Kovar National Projects Manager, CEMACH (until October 2006) Alison Leaf Consultant Neonatologist, Southmead Hospital, Bristol
Alison Miller CEMACH Programme Director and Midwifery Lead Joan Oliver Head Neonatal Nurse, SCBU, Wansbeck General Hospital
Justine Pepperell Family Support Manager, BLISS Laura de Rooy Consultant Neonatologist, St George’s Hospital, London
Martin Ward Platt Consultant Paediatrician, Royal Victoria Infi rmary, Newcastle Anthony Williams Consultant Paediatrician, St George’s Hospital, London
138
CEMACH Board
Michael Weindling Chair Jean Chapple Faculty of Public Health
Griselda Cooper Royal College of Anaesthetists Beverley Fitzsimons Lay representative
Steve Gould Royal College of Pathologists Ian Greer Chair, CEMACH National Advisory Committee for Maternal Health
Sheila Hollins Royal College of Psychiatrists Deirdre Kelly Chair, CEMACH National Advisory Committee for Child Health
Jenni McAughey Chair of RCGP Northern Ireland Council Neil McIntosh Royal College of Paediatrics and Child Health Ann Seymour Lay representative
Louise Silverton Royal College of Midwives Allan Templeton Royal College of Obstetricians & Gynaecologists
Una Rennard Lay representative
Diabetes Enquiry Panel Assessors (can be accessed at www.cemach.org.uk)
Diabetes Multidisciplinary Resource Group (can be accessed at www.cemach.org.uk)
Appendix F - CEMACH advisory groups & contributors


Published February 2007 by CEMACH
CEMACH, Chiltern Court, 188 Baker Street, London, NW1 5SD Tel: 0207 486 1191 Fax: 0207 486 6543 Email: [email protected] Website: www.cemach.org.uk
ISBN: 978-0-9533536-3-7
UK Price £15 Ireland and rest of Europe Price 23€
To obtain further copies of this report please email [email protected] or visit www.cemach.org.uk