the impact of ddr1 on mechanics and mineralization of mice
TRANSCRIPT

The Impact of DDR1 on Mechanics and Mineralization of Mice Femora
THESIS
Presented in Partial Fulfillment of the Requirements for Graduation with Honors
Research Distinction in Biomedical Engineering at The Ohio State University
By
Brent Weiss
B.S. in Biomedical Engineering
The Ohio State University
2017
Thesis Committee:
Dr. Gunjan Agarwal, Advisor
Dr. Alan Litsky

ii
Abstract
Collagen type I is the most abundant extracellular matrix protein and the major
structural component of connective tissues found in the human body. Collagen fibrils
play a critical role in the mineralization and mechanics of bone. The collagen fibril
structure can be modified by certain non-collagenous proteins (NCP) which bind to
collagen, such as the discoidin domain receptor (DDR1). Understanding the role collagen
fibrils play in bone mineralization is relevant to the field of biomaterials as well as in
understanding the pathogenesis of diseases characterized by aberrant mineralization. The
NCP DDR1 has been shown to impact the structure of collagen, but the impact that this
structural change has on bone mineralization and mechanics has yet to be determined.
The Agarwal lab has previously established that by binding to collagen and
disorganizing the fibril structure, the collagen receptor DDR1 modulates collagen
fibrillogenesis and the resulting morphology of collagen fibrils in both in-vitro and in
cell-based assays. This project aims to further the field by analyzing how mineralization
in collagen fibrils is differentially impacted by the presence of DDR1 in the femora of
murine models. Studies were conducted on the femora extracted from six month old
DDR1 Knout-out (KO) and Wild-type (WT) female and male mice. Mechanical
properties of the femora, such as stiffness, were determined from 3-point-bending
experiments and the resulting load vs. displacement data. The broken bone samples were
then cleaned and defatted and subjected to Thermogravimetric analysis (TGA) and
Inductively Coupled Plasma Optical Emission Spectrometry (ICP-OES) protocols to

iii
determine mineral content and relative weight percentages of Calcium (Ca) and
Phosphorous (P) respectively.
Consistent gender specific trends were seen in the collected biomechanical and
mineral data. In female mice, a statistically significant difference was observed with the
DDR1 KO mice femurs showing a higher stiffness than WT mice femurs. The higher
stiffness that was found in female KO mice was consistent with the higher mineral
content found in female KO mice compared to their WT litermates. An opposite trend
was seen in male mice, although the results were not significant. These results show how
DDR1 influences bone mechanics and mineralization in a gender specific manner.

iv
Acknowledgments
I would like to thank my Research Advisor, Dr. Gunjan Agarwal, for her guidance and
support during my entire undergraduate research experience. Dr. Agarwal provided me
with great opportunities in her lab and has been a great encouragement throughout this
entire thesis project. My experiences in her lab and this thesis project have taught me how
to conduct independent and productive work, especially in the field of research. I am
grateful for all of the opportunities and for such a rewarding research experience.
I would also like to thank Dr. Alan Litsky and Dr. Nicole Karn for collaborating on this
research project. Their expertise in their respective fields and their willingness to provide
of their time and resources made the completion of this project possible. Thank you very
much for the crucial parts you both played in this research project.
I would also like to thank all of my lab peers and colleagues in the Agarwal Lab for their
mentorship, advice, and camaraderie: David Yeung, Brook Ollander, Arghavan Farzadi,
Blain Jones, and Rachel Novinc. It has been wonderful to work with you all and an even
greater pleasure getting to know everyone over this last year.

v
Table of Contents Abstract ............................................................................................................................... ii
Acknowledgments.............................................................................................................. iv
Table of Contents ................................................................................................................ v
List of Tables ..................................................................................................................... vi
List of Figures ................................................................................................................... vii
Introduction ......................................................................................................................... 1
Collagen Fibril Structure and Mineralization.................................................................. 1
Discoidin Domain Receptor 1 ......................................................................................... 3
Bone Mineralization and mechanical properties ............................................................. 4
Research Goals and Motivation ...................................................................................... 5
Methodology ....................................................................................................................... 6
Mechanical Testing ......................................................................................................... 6
TGA Protocol .................................................................................................................. 7
ICP-OES Protocol ........................................................................................................... 8
Statistical Analysis .......................................................................................................... 9
Results and Discussion ....................................................................................................... 9
Biomechanics and Percent Mineral Results .................................................................. 10
Mineral Analysis ........................................................................................................... 14
Conclusion ........................................................................................................................ 16
References ......................................................................................................................... 17
Appendix .......................................................................................................................... A1

vi
List of Tables
Table 1. Mechanical Parameters…………………………………………………………12
Tabel 2. Mineral Analysis………………………………………………………………..14
Table A1. Ko Sample’s ICP-OES Mineral Analysis ……………………………………A3
Table A2. Wt Sample's ICP-OES Mineral Analysis…………………………………….A3

vii
List of Figures
Figure 1. Hierachy of Collagen Structure ........................................................................... 2
Figure 2. Collagen Fibril Organization and Mineralization ................................................ 2
Figure 3. Regions of DDR Protein ...................................................................................... 3
Figure 4. Three-point Bending Mechanical Properties……………………………………7
Figure 5. Stiffness of Female and Male Secimens……………………………………….11
Figure 6. TGA Results…………………………………………………………………...13
Figure A1. Female Mechanics Data: Peak Load and Toughness……………………….A1
Figure A2. Male Mechanics Data: Peak Load and Toughness………………………….A2
Figure A3. Parr Microwave Acid Digestion Bomb……………………………………..A4
1
Introduction
Fibrils of collagen type I serve as the biological template for bio-mineralization in
bone tissue, with calcium phosphate minerals in the form of carbonated hydroxyapatite
(HA) being the major inorganic component1. Bone tissue composite is comprised of a
hierarchical structure consisting mostly of an organized collagen fibril scaffold with
nanometer sized crystals of hydroxyapatite2. The biomechanics of bone tissue have been
extensively studied3,4 with recent computer simulations illustrating how the mineral
component of bone is primarily responsible for bearing the stress of loads and how the
collagen fibrils are responsible for bone’s deformation response2. The process of
mineralization in bone tissues has been shown to be dependent on the collagen fibril
structure and the presence of non-collagenous proteins (NCPs) in in-vitro studies5,6
Collagen Fibril Structure and Mineralization
The Collagen fibril is formed through the self-assembly of individual triple helical
collagen molecules7. Collagen fibrils are characterized by a 67 nm periodicity in their
structure that can be seen in electron microscopy images as distinct striations referred to
as the D-period7. These striations are associated with how the individual collagen
molecules assemble in a staggered formation along the axial direction7. The D-period
also consists of 40 nm gap zones that have been associated with the nucleation of apatite
crystals 5. Computer simulations have illustrated how the charged amino acids that lie in
the gap regions are crucially responsible for the promotion of apatite formation in the

2
intrafibrillar mineralization of collagen6. Figures 1 and 2 below detail the periodicity,
hierarchy, and organization of the collagen structure.
Figure 1: Hierarchy of Collagen Structure7.
Figure 2: Collagen fibril organization and location of mineral formation8. Individual collagen molecules of
approximately 300 nm organize into fibrils with a 67 nm D-periodicity in which a 40 nm gap zone exists. It is within this
gap zone that hydroxyapatite crystals composed of calcium and phosphorous nucleate and grow.

3
Changes in the fibril structure have been speculated to influence intrafibrillar
collagen mineralization in diseases such as osteogenesis imperfecta9 but the impact of
collagen fibril structure modulation by non-collagenous proteins (NCPs) have yet to be
correlated with the quality and quantity of collagen mineralization in bone. In this study
we elucidate how the NCP, Discoidin Domain Receptor 1 (DDR1), modulates bone
mechanics and mineralization.
Discoidin Domain Receptor 1
DDR1 is a receptor tyrosine kinase that binds to collagen type I as its ligand10.
DDRs are characterized by three distinct regions: the extracellular domain (ECD), a
transmembrane region (TM), and an intracellular kinase region. A schematic of the three
regions can be seen below in Figure 3.
Figure 3: Three General Regions of DDR proteins10.
DDR1 is expressed as a membrane bound protein in several cell types including
osteoclasts and osteoblasts11. The ECD of DDR1 is also shed as a soluble protein in the
extracellular matrix12. The Agarwal laboratory has extensively characterized how DDR1
ECD modulates the collagen fibril structure by impacting the diameter and organization
of the D-period in the fibril13,14. As a tyrosine kinase, DDR1 is also responsible for

4
downstream signaling events and cell behaviors10 once it becomes phosphorylated upon
binding to collagen15,16.
DDRs have been linked to regulating collagen mineralization in pathological
situations, with DDR1 expression showing a positive correlation with atherosclerotic
calcification in an earlier study17. The Agarwal lab has also reported enhanced matrix
mineralization in cells expressing the DDR1 ECD compared to control cells13. However,
one conflicting study has recently reported enhanced mineralization by vascular smooth
muscle cells lacking DDR118. While these observations indicate that DDR1 modulates
collagen mineralization, it calls for further investigations to understand how DDR1
modulates mineralization across various tissues in health and disease.
Bone Mineralization and mechanical properties
The hierarchical structure of bone consists of macroscopic features such as
osteons and Haversian canals in compact bone and nanoscale features such as
mineralized collagen fibrils18. The unique mechanical properties of bone are primarily
derived from these mineralized collagen fibrils at the nano-structural level18. The
collagen content has been associated with the toughness of bone and mineral content has
been associated with the stiffness of bone3,4. This mechanical association has even been
elucidated on the molecular level. Full-atomistic calculations in computer simulations
have illustrated that an increase in mineral density is associated with an increase in the
tensile modulus, or stiffness, and that collagen is more responsible for bone’s
deformation response2. While the collagen and mineral constituents of bone provide very

5
different mechanical properties in bone tissue, it is the molecular interactions of these two
constituents that ultimately promote the formation of mineralized bone tissue8.
Research Goals and Motivation
The research question that we aim to answer is if expression of DDR1 regulates
mineralization of long bones in-vivo. Our current underlying hypothesis is that the
modulation of the collagen fibril structure by DDR1 will inhibit the intrafibrillar
mineralization of the collagen fibril present in the bone tissue. My individual contribution
to this project is the analysis of biomechanical and mineral data from the femurs of
DDR1 knockout (KO) and wildtype (WT) mice by utilizing three-point bending data and
TGA/ICP-OES analytical techniques respectively. In particular, I focused on correlating
the stiffness of the bone samples with the mineral content (Calcium and Phosphorous) of
the bone samples to determine differences between KO and WT bone samples. This data,
along with additional studies performed in the Agarwal laboratory, will be used to
determine how the collagen fibril structure, when altered by DDR1, affects
mineralization.
Studying and understanding the biomineralization of natural tissues, such as bone,
is of great interest in the context of creating biomimetic materials that can be used for
therapeutic purposes such as the regeneration of natural mineralized tissues1. Studying
novel NCP’s, such as DDR1, and elucidating its role in biomineralization will provide
more comprehensive information regarding the in-vivo mineralization process that could
have potential applications for biomimetic materials.

6
Methodology
Mechanical Testing
Femurs were extracted from age (4 to 6 month) and gender matched KO and WT
mice littermates after euthanasia via the PI’s approved IACUC protocol 2008A232-R1.
The femora were wrapped in PBS soaked gauze and stored at -20oC until use. Three-point
bending tests were performed in conjunction with Dr. Alan Litsky of the Biomedical
Engineering Department on all right femurs to acquire mechanical data such as the
stiffness, peak load, and the toughness of the bone samples.
These parameters were determined from the plots of load vs displacement data for
each sample. The peak load was determined as the highest force applied to the bone
before fracture of the bone occurred. The linear curve fitting capabilities of excel were
utilized to determine the stiffness of each sample, which is the slope of the linear section
of the load-displacement curve occurring just after loading begins and up till the point of
fracture. Approximately 18-20 data points were chosen from this linear region to quantify
stiffness. The toughness of the sample is described as the area under the load-
displacement curve, which was determined using MATLAB software that numerically

7
estimates the area based on the trapezoidal rule. Figure 4 below details how raw load-
displacement data were analyzed for the different biomechanical parameters.
After performing the mechanical tests, the broken bone samples were defatted and
cleaned off of bone marrow. This process involved the physical removal of the excess
tissue, soaking the bone samples in 2:1 and 1:2 chloroform/ethanol solutions for two
consecutive days each and air drying. Then, one-half of the broken sample was subjected
to Thermogravimetric Analysis (TGA) and ICP-OES protocols detailed below while the
other half of the broken sample was utilized for Raman imaging protocols that are not
included in with this thesis project.
TGA Protocol
A TA instrument’s TGA Q50 (SN: 0050-0984) was utilized in conjunction with
Dr. Karn in the OSU chemistry department to ash the bone samples in order to determine
the relative mineral content of the bone sample on a percent mass basis. The principal
behind this procedure is that the organic and other non-mineral components of the bone
Figure 4: Determination of mechanical properties from three point bending data. Picture A details how peak load and
toughness parameters where determined from the raw bending data collected from a sample. Picture B illustrates how a
linear section of the raw bending data was used to determine the stiffness of the sample. The slope of the linear fit,
underlined in red above, was used to approximate the stiffness of the sample.
8
sample will be burned up, leaving only the mineral content of the bone behind. This
allows the mineral content of each sample to be discerned on a percent mass basis.
The protocol performed on each specimen consisted of three sequential heat
ramps followed by a single isothermal hold. The first heat ramp increased the temperature
of the furnace at a rate of 20oC per minute to a target temperature of 100oC. The next two
heat ramps raised the temperature from 100oC to 200oC at a rate of 10oC per minute and
from 200oC to 800oC at a rate of 5oC per minute respectively. An isothermal hold was
then performed at 800oC for an hour, making the total procedure run-time for each
sample approximately 192 minutes. The pre-ashed weight of specimens used in this
procedure ranged from 4.18 to 15.01 mg with an average mass of 10.64± 3.03 mg. A
sterilized platinum tray was used to suspend each specimen in the furnace.
ICP-OES Protocol
This analytical technique was performed in conjunction with the Trace Element
Research Laboratory (TERL) at OSU, and was useful in determining the concentrations
of Calcium (Ca) and Phosphorous (P) mineral in bone samples along with the Ca:P ratio.
This technique utilizes inductively coupled plasma at high temperatures to produce the
characteristic electromagnetic radiation of the target atom or ion. To prepare the bone
samples for this technique, the ashed bone samples (after TGA analysis) were subjected
to acid digestion in 5 ml of concentrated nitric acid by using a Parr Microwave Acid
Digestion Bomb. The sample and acid bomb combination were placed in a microwave for
20 seconds to allow complete digestion. These preparations were done per specifications
9
in the Parr user manual concerning preparation of organic samples20. See the appendix for
a diagram of the Parr Microwave Bomb that was used in this study.
The digested solutions were then diluted to 2:50 and 3:50 concentrations in
purified water, providing two dilutions with which to calculate and compare mineral
percentages. This allowed the percent Ca and P content in each sample to be determined
by TERL using standard curves and ICP-OES equipment once ash weight was taken into
consideration. However, correlating changes in the Ca and P content to decreases in bone
mineral is not a traditionally accepted method since it is the combination of these two
minerals that lead to hydroxyapatite formation21,22. Therefore, the Ca:P ratio was
determined for each sample in order to obtain a metric that better characterized mineral
quality.
Statistical Analysis
A student’s two-tailed unpaired t-test was performed to ascertain statistically
significant differences between samples for both mechanical and mineral parameters. A
p<0.05 was regarded as significant.
Results and Discussion
Biomechanical and percent mineral data were collected from male and female
femurs of the DDR1 KO and WT mice. Data was compiled from 12 samples of the KO
and WT genotype in the female biomechanical tests, and 11 KO and 14 WT samples in
the male biomechanical tests. Percent mineral data was collected from six female mouse

10
pairs and five male mouse pairs using TGA. Additionally, ICP-OES analysis was
performed on 4 female mouse pairs to elucidate the specific mineral percentages of Ca
and P in ashed bone samples.
Biomechanics and Percent Mineral Results
A three-point bending analysis was used to determine the stiffness, peak load, and
toughness of each sample. The compiled data for all mechanical tests excludes sample
outliers (n=4) that were larger than 1.5 standard deviations away from the sample average
for each parameter. Theses outliers could result due to variations in the positioning of the
bone for the mechanical testing, which may have impacted the results. For example, in
the bending tests, one side of the bone was subjected to tension forces and the other to
pressure forces. If different areas of the bone respond differently to tension and pressure
forces, then the results may have been affected. For future tests, it will be important to
standardize which side of the bone, anterior or posterior, will experience these forces.
This will help to minimize any possible changes in mechanics due to how different areas
of bone may respond to tension or pressure forces.
The stiffness of each sample was of particular interest in this study since stiffness
in bone is known to have a positive correlation with the amount of bone mineral. Figure
5 on the next page displays stiffness data for female and male KO and WT mice. Similar
graphs for peak load and toughness can be found in the appendix.

11
Different trends were observed in bone stiffness for male and female mice.
Female KO mice had a higher average stiffness than WT mice (58.65 N/mm and 49.25
N/mm respectively), while male KO mice showed a trend towards lower stiffness than
WT (49.10 N/mm and 52.30 N/mm respectively). A two-tailed t-test was performed and
Figure 5: Stiffness of (A) female and (B) male specimens. for individual mice femora. (C) Bar graphs representing
average stiffness for each gender and genotype. Female KO femora were stiffer than WT while the male femora
showed no significant difference between the two genotypes.
A B
C

12
determined a p-value of 0.025 for the stiffness of female mouse pairs and a p-value of
0.50 for the stiffness of male mouse pairs. A similar statistical analysis was performed for
all mechanical parameters, but the stiffness parameter for female bones was the only
mechanical parameter that showed statistically significant results. Table 1 below details
the statistical analysis that was performed on all mechanical parameters.
Percent mineral in broken femora pieces were analyzed using TGA. The Mineral
to Matrix ratio (MMR) was also determined based on comparing the percent mineral to
the percent organic material. Figure 6 on the next page details results from TGA
performed on female and male mice Femurs.
Table 1: Mechanical parameters.
Ko (Avg.) Wt (Avg) P-value Ko (Avg.) Wt (Avg.) P-value
Peak Load (N) 19.84 ± 2.55 18.44 ± 1.83 0.178 19.18 ± 2.08 20.39 ± 1.79 0.159
Stiffness (N/mm) 58.65 ± 9.64 49.25 ± 6.29 0.025* 49.10 ± 8.62 52.3 ± 12.12 0.500
Toughness (N.mm) 4.13 ± 0.85 4.34 ± 0.47 0.515 5.33 ± 1.35 5.04 ± 1.15 0.606
6 month old FemursFemale Mouse data Male Mouse Data
*denotes Significance

13
Ko (Avg.) Wt (Avg) P-value Ko (Avg.) Wt (Avg.) P-value
% Mineral 67.80 ± 1.86 64.92 ± 3.61 0.154 67.98 ± 0.79 68.37 ± 0.46 0.425
MMR 2.12 ± 0.19 1.88 ± 0.26 0.132 2.13 ± 0.08 2.16 ± 0.05 0.431
6 month old FemursFemale Mouse data Male Mouse Data
Figure 6: Panels A and B show a comparison of typical individual tests for female and male respectively. The percentage
present at 800oC was used to estimate the mineral content in a sample. Panel C compares the average mineral content across
genders and genotypes and Panel D displays statistical analysis for TGA and MMR data. Opposite trends are once again
seen in female and male mice, with female mice showing higher mineral content in KO variants and male KO mice
showing nearly similar mineral content as WT.
A B
C
D

14
The higher stiffness in female KO bones correlates with the higher mineral
content in these bones whereas the mineral content in the male mice was slightly lower
for the KO mice. However, statistical analysis did not reveal any significant difference
between the mineral content of mice variants for either gender.
Mineral Analysis
Mineral analysis was performed on four pairs of female specimens utilizing ICP-
OES to determine the percentage of Calcium (Ca) and Phosphorous (P) present in
samples on a per mass basis. The TERL at OSU determined a concentration (in ppm) of
Ca and P from two dilutions of acid digested ashed bone sample that had already been
subjected to TGA. The known concentrations and dilution factors (2:50 and 3:50) were
used to determine the mass and mineral percentages of Ca and P present in each sample
based on its ashed weight and on its whole bone weight. The mineral percentages
obtained from the two dilutions were averaged to give a single mineral percentage and
Ca:P ratio for each tested sample (see appendix for more details). The results of the
mineral analysis are summarized in Table 2 along with the bulk percent mineral data
from the TGA results.
Table 2: Mineral Analysis
Ko (Avg.) Wt (Avg) P-value
% Mineral 67.80 ± 1.86 64.92 ± 3.61 0.154
MMR 2.12 ± 0.19 1.88 ± 0.26 0.132
% Ca (Ashed Bone) 36.56 ± 2.63 40.21 ± 0.67 0.059
% P (Ashed Bone) 16.18 ± 1.08 17.88 ± 0.31 0.039*
% Ca (Whole Bone) 24.70 ± 2.28 26.62 ± 0.68 0.213
% P (Whole Bone) 11.08 ± 1.00 11.84 ± 0.27 0.25
Ca:P 2.30 ± 0.07 2.23 ± 0.20 0.204
6 month old FemursFemale Mouse data
*denotes Significance
15
It is interesting to note that WT mice have a larger portion of their mineral
percentage composed of both Ca and P than KO mice variants, suggesting that additional
elements would account for the higher mineral content in KO bones. However, the Ca:P
ratio is a standardized representation of the amount of hydroxyapatite contained within
the bone that takes into account both Ca content and P content21. The Ca:P ratio was very
similar for KO mice and WT mice with a ratio of 2.30 for KO mice compared to the WT
ratio of 2.23. In studies conducted on similar murine models, such as rabbits and rats, it
was found that Ca:P ratio’s for osteoporotic femora were closer to 1.82 and 1.29
respectively where as healthy models of rabbit femur had a ratio between 2.08 and
2.1721,22. These ratios very likely indicate that the bones from both genotypes in this
study are physiologically normal and healthy since these ratios are comparable to the
normal states of bones in similar murine models and are higher than the Ca:P ratios
associated with the diseased states of these models. These earlier studies utilized X-ray
absorptiometry, AES, and EDX imaging techniques to determine the Ca:P rather than
techniques such as AAS or ICP-OES.
It should also be noted that the methods used for quantifying Ca and P in this
study, especially concerning sample preparation, are more novel in scope. Other studies
have used acid digestion23 to prepare samples for mineral measurements, but these
preparations were performed over longer time intervals, with the samples hydrolyzing
overnight rather than using a microwave. It is unknown whether our faster approach to
acid digestion would impact the results compared to the gentler acid digestion procedures
that have been used.

16
Conclusion
This study examined the bone mechanics and mineralization of DDR1KO and
WT male and female femurs. A higher stiffness was observed for DDR1 KO female
mice which correlated with its greater percent mineral in KO mice compared to WT
mice. No significant differences were observed in the Ca:P ratio in mouse bones,
indicating that the bones were within the range of physiologically normal bones and
similar in quality across the two genotypes. Our results are consistent with earlier reports,
where a positive correlation in stiffness has been observed in increased mineral content2,3.
Our results also show a gender dependence in the mechanical and material properties of
mice DDR1 KO mice femora. These results merit additional research and investigation
into why gender differences exist between male and female DDR1 KO and WT mice
since there are currently no conclusive explanations explaining the cause of these gender
differences.
Further research studies need to be conducted to fully elucidate the role of DDR1.
Examples of such studies include studies that look at mice in different stages of
development. This study looked at mice around 6 months of age, but perhaps older mice
closer to 12 months of age would show more significant trends with regards to DDR1.
Additional mechanical parameters could also be analyzed, such as parameters related to
the rotational integrity of the bone. Further studies on evaluating DDR1 expression,
collagen content and mineralization in bone diseases could help elucidate the role of
DDR1 in modulating pathological remodeling.

17
References
1. Palmer, L.C., Newcomb, C.J., Kaltz, S.R., Spoerke, E.D., Stupp, S.I., Biomimetic
Systems for Hydroxyapatite Mineralization Inspired By Bone and Enamel, Chem
Rev.108(11), 4754–4783 (2008).
2. Nair, A. K., Gautieri, A., Chang, S.-W. & Buehler, M. J. Molecular mechanics of
mineralized collagen fibrils in bone. Nat. Commun. 4, 1724 (2013).
3. Courtland, H. W., Spevak, M., Boskey, A. L. & Jepsen, K. J. Genetic variation in
mouse femoral tissue-level mineral content underlies differences in whole bone
mechanical properties. in Cells Tissues Organs 189, 237–240 (2008).
4. Wang, X., Bank, R. A., TeKoppele, J. M. & Mauli Agrawal, C. The role of
collagen in determining bone mechanical properties. J. Orthop. Res. 19, 1021–
1026 (2001).
5. Nudelman, F. et al. The role of collagen in bone apatite formation in the presence
of hydroxyapatite nucleation inhibitors. Nat. Mater. 9, 1004–9 (2010).
6. Su, Z. et al. Molecular mechanisms for intrafibrillar collagen mineralization in
skeletal tissues. Biomaterials 39, 59-66 (2015)
7. Orgel, J. P. et al. The in situ supermolecular structure of type I collagen. Structure
9, 1061–9 (2001).
8. W.L. & Jacquet R. Association of calcium and Phosphate Ions with Collagen in
the Mineralization of Vertebrate Tissues. Calcif. Tissue Int. 93, 329-337 (2013).
9. Wassen, M.H.M. et al. Collagen Structure Regulate Fibril Mineralization in
Osteogensis as Revealed by Cross-Link Patterns in Calcifying Callus. J. Bone
Miner. Res. 15, 1776-1785 (2000).
10. Fu, H.-L. et al. Discoidin domain receptors: unique receptor tyrosine kinases in
collagen-mediated signaling. J. Biol. Chem. 288, 7430–7 (2013).
11. Alves, F. et al. Identification of two novel, kinase-deficient variants of discoidin
domain receptor 1: differential expression in human colon cancer cell lines.
FASEB J. 15, 1321–3 (2001).
12. Vogel, W. F. Ligand-induced shedding of discoidin domain receptor 1. FEBS
Lett. 514, 175–80 (2002).
13. Flynn, L. A., Blissett, A. R., Calomeni, E. P. & Agarwal, G. Inhibition of
Collagen Fibrillogenesis by Cells Expressing Soluble Extracellular Domains of
DDR1 and DDR2. J. Mol. Biol. 395, 533–43 (2010).
14. Tonniges, J. R. et al. Collagen Fibril Ultrastructure in Mice Lacking Discoidin
Domain Receptor 1. Microsc. Microanal. 22, 599–611 (2016).
15. Xu, H. et al. Collagen binding specificity of the discoidin domain receptors:
binding sites on collagens II and III and molecular determinants for collagen IV
recognition by DDR1. Matrix Biol. 30, 16–26 (2011).
16. Perumal, S., Antipova, O. & Orgel, J. P. R. O. Collagen fibril architecture,
domain organization, and triple-helical conformation govern its proteolysis. Proc.
Natl. Acad. Sci. U. S. A. 105, 2824–9 (2008).

18
17. Ahmad, P.J. et al. Discoidin domain receptor-1 deficiency attenuates
atherosclerotic calcification and smooth muscle cell-mediated mineralization. Am.
J. Pathol. 175, 2686-96 (2009).
18. Krohn, J.B. et al. Discoidin Domain Receptor-1 Regulates Calcific Extracellular
Vesicle Release in Vascular Smooth Muscle Cell Fibrocalcific Response via
Transforming Growth Factor-β Signaling. 36, 525-33 (2016).
19. Liu Y, Luo D, W.T. Hierarchical Structures of Bone and Bioinspired Bone Tissue
Engineering. Small 12, 4611-32 (2016).
20. Parr Instrument Company. Operating Instructions for Parr Microwave Acid
Digestion Bombs. (2005).
21. Tzaphilidou, Margaret. Bone Architecture: Collagen Structure and
Calcium/Phosphorus Maps. J. Biol. Phys. 34, 39-49 (2008).
22. Kourkoumelis, N., Balatsoukas, I., and Tzaphlidou, M. Ca/P Concentration Ratio
at Different Sites of Normal and Osteoporotic Rabbit bones Evaluated by Auger
and Energy Dispersive X-ray Spectroscopy. J. Biol. Phys. 38, 279-291 (2012).
23. Coleman, R.M. et al. Comparison of Bone Tissue Properties in Mouse Models
with Collagenous and Non-collagenous Genetic Mutations using FTIRI.
A1
Appendix
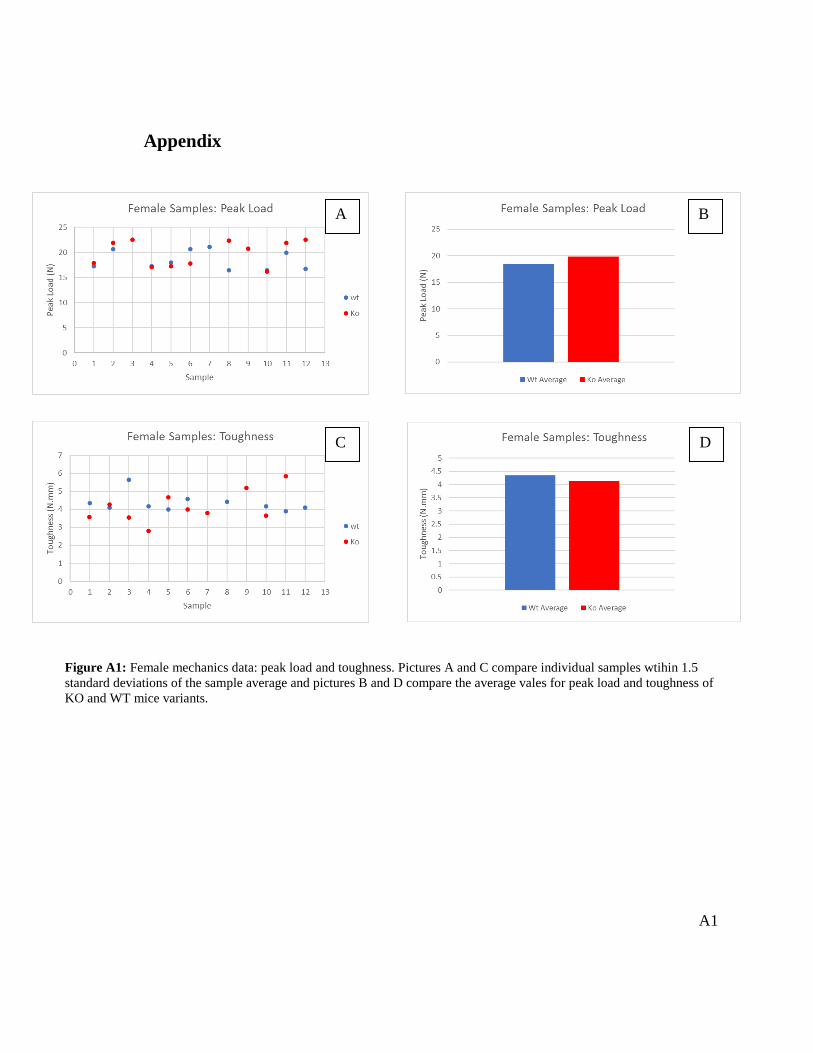
Figure A1: Female mechanics data: peak load and toughness. Pictures A and C compare individual samples wtihin 1.5
standard deviations of the sample average and pictures B and D compare the average vales for peak load and toughness of
KO and WT mice variants.
A
C
B
D

A2
Figure A2: Male mechanics data: peak load and toughness. Pictures A and C compare individual samples within 1.5
standard deviations of the sample average and pictures B and D compare the average vales for peak load and toughness of
KO and WT mice variants.
A B
C D
A3
C71-R 2:50 C71-R 3:50 STDV C87-R 2:50 C87-R 3:50 STDV D23-R 2:50 D23-R 3:50 STDV D27-R 2:50 D27-R 3:50 STDV
% Ca Ash weight 39.02 37.92 0.7778175 37.69 37.80 0.077782 35.896 28.17 5.463107 39.95 36.03 2.7718586
% Ca Average
% P Ash weight 17.44 16.92 0.3676955 16.88 17.17 0.205061 16.24 12.72 2.4890159 15.95 16.11 0.1131371
% P Average
Ca:P
Ko Samples
32.033
14.48
2.36
37.99
16.03
2.37
38.47
17.18
2.239
37.745
17.025
2.22
C84-R 2:50 C84-R 3:50 STDV C88-R 2:50 C88-R 3:50 STDV D25-R 2:50 D25-R 3:50 STDV D28-R 2:50 D28-R 3:50 STDV
% Ca by weight 41.16 39.58 1.1172287 41.56 40.02 1.088944 40.87 40.290 0.4101219 39.19 38.97 0.1555635
% Ca Average
%P Ash weight 18.3 18.04 0.1838478 18.37 17.99 0.268701 17.97 17.490 0.3394113 17.43 17.46 0.0212132
% P average
Ca:P
Wt Samples
40.58
17.730
2.288776086
39.08
17.445
2.24
40.37
18.17
2.22
40.79
18.18
2.17
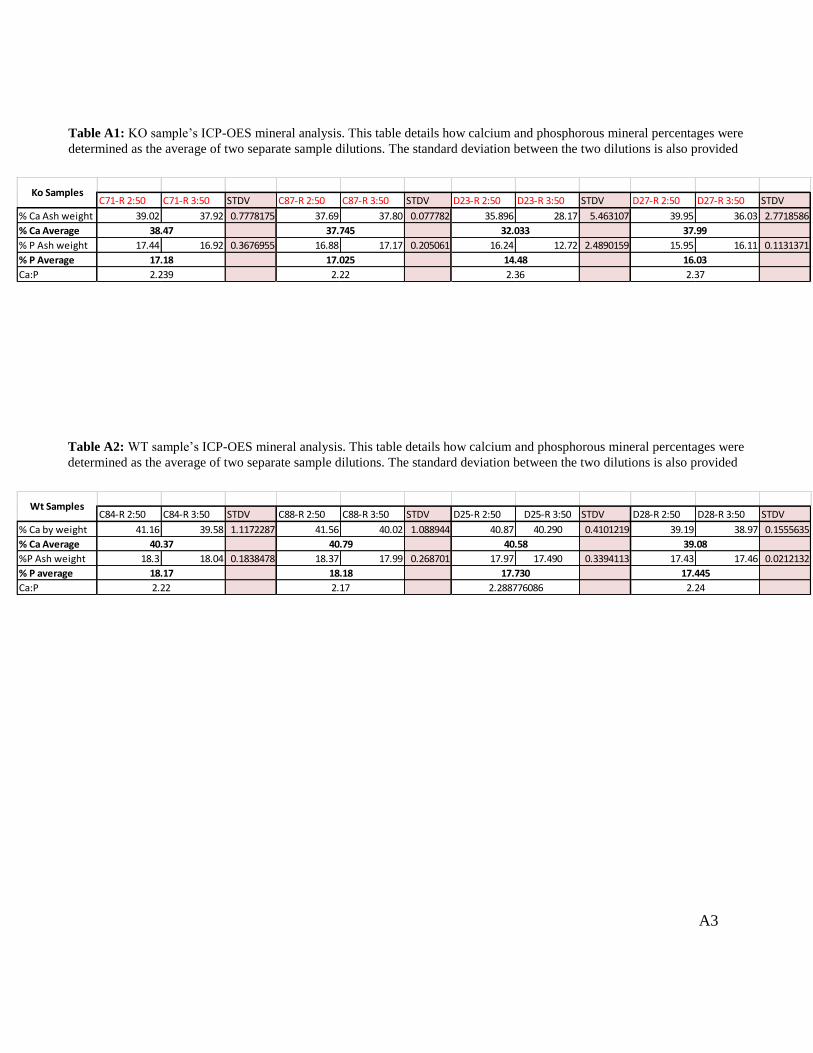
Table A1: KO sample’s ICP-OES mineral analysis. This table details how calcium and phosphorous mineral percentages were
determined as the average of two separate sample dilutions. The standard deviation between the two dilutions is also provided
Table A2: WT sample’s ICP-OES mineral analysis. This table details how calcium and phosphorous mineral percentages were
determined as the average of two separate sample dilutions. The standard deviation between the two dilutions is also provided

A4
Figure A3: Parr Microwave Acid Digestion Bomb20. This product was used along with high concentration nitric acid to
digest the ashed bone samples in preparation for ICP-OES. The sample with nitric acid was contained inside the PTFE
cup.