the impact of culture and economic … · the impact of culture and economic factors on the...
TRANSCRIPT

Accounting & Taxation Vol. 6, No. 2, 2014, pp. 29-47 ISSN: 1944-592X (print) ISSN: 2157-0175 (online)
www.theIBFR.org
THE IMPACT OF CULTURE AND ECONOMIC FACTORS ON THE IMPLEMENTATION OF IFRS
Rogelio J. Cardona, University of Puerto Rico-Río Piedras Karen C. Castro-González, University of Puerto Rico-Río Piedras Carmen B. Ríos-Figueroa, University of Puerto Rico-Río Piedras
ABSTRACT
This paper examines the effects of culture and other economic factors on a country’s decision to implement International Financial Reporting Standards (IFRS). This work extends the previous literature by using a methodology that assigns an implementation score in different countries and its association with Hofstede’s cultural dimensions and economic factors. The results suggest that certain cultural dimensions and economic factors may affect a country’s decision to implement IFRS.
JEL: F23, F60, M41 KEYWORDS: International Financial Reporting Standards, Accounting Standards, Implementation,
Convergence or Adoption, Cultural Dimensions; Economic Factors INTRODUCTION
conomic transactions are measured with accounting standards that vary from country to country but the global economy has created the need for uniform standards. Differences in culture may affect a country’s desire to join a globalized economy (Ding Jeanjean and Stolowy, 2005; Ramanna and
Sletten, 2009, among others). Prior studies on the adoption of IFRS consider a country’s culture, the barriers to adoption, and the impact of the adoption of IFRS on financial reporting. Callao-Gastón, Jarne-Jarne, and Laínez-Gadea (2007), Callao-Gastón, Ferrer-García, Jarne-Jarne, and Laínez-Gadea (2010), Ramanna and Sletten (2009), Armstrong, Barth, Jagolinzer, and Riedl (2010) examine the degree of convergence or adoption of IFRS in Europe, the European Union (E.U.) and the United States (U.S.), respectively. Our study presents an alternative empirical methodology that considers the effect of culture and economic factors on a country’s IFRS implementation decision. The databases used were a survey made by PricewaterhouseCoopers, LLP (PwC) in April 2012 (IFRS Adoption by Country), Hofstede’s (1980, 2001) cultural dimensions, and The Global Competitiveness Report for 2011-2012 published by The World Economic Forum (WEF). Using the aforementioned databases we designed a grading system based on PwC’s survey that assigns an IFRS implementation score to each country. A country’s IFRS implementation decision is expected to have an indirect impact on the required disclosure of financial information by listed companies in each country. Appendix A presents the questions included in PwC’s survey regarding the current stage of the IFRS adoption or conversion process in each country. The next section provides a brief overview of the institutional background and relevant literature. The literature review is followed by the sample selection procedure, the data analysis, and the research methodology. The final section presents the results and our conclusions.
E
29

R. J. Cardona et al | AT ♦ Vol. 6 ♦ No. 2 ♦ 2014
LITERATURE REVIEW The academic and professional literature present diverse explanations regarding the IFRS implementation process in different countries. The IFRS Resources website of the American Institute of Certified Public Accountants (AICPA) defines convergence as the development of compatible international accounting standards over time; adoption means establishing a specific timetable for public companies to implement IFRS on their financial reports. Zeff and Nobes (2010) describe the acceptance of IFRS in a country can be accomplished through the following different methods: adoption of IFRS, endorsement of IFRS allowing for the possibility of some differences, full convergence, partial convergence and allowing the use of IFRS standards. As examples of the different stages of the IFRS implementation process, Carvalho and Salotti (2013) document the case of Brazil as a country that has completely adopted IFRS, whereas, Nie, Collins and Wang (2013) note that China is in the process of convergence to IFRS. Culture and Hofstede’s Cultural Dimensions Prior research suggests that culture plays a central role in accounting decisions. According to Liu and Mackinnon (2002), one of the most cited definitions of culture in recent years was made by Hofstede in 1983. Hofstede defines culture as a collective programming of the mind, difficult to change, that distinguishes a group of people from others, and that cultural programming is hard to change, unless individuals move from their culture. Between 1968 and 1972, Hofstede developed a model to identify cultural patterns consisting of four primary dimensions: individualism versus collectivism (IC), power distance (PD), uncertainty avoidance (UA), and masculinity versus femininity (MF). In 1985, Hofstede added a fifth dimension: long-term versus short-term orientation (LTD). In 2010, Hofstede added a sixth dimension, indulgence versus restraint (IVR), based on data analysis made by Minkov with the World Values Survey for 93 countries (Hofstede G, Hofstede G.J, and Minkov, 2010). The individualism versus collectivism (IC) dimension measures the relationship of an individual with others. Hofstede (1983) concludes that rich countries are more individualistic and poor countries are more collectivistic. In an individualistic country, confrontations are normal, there is less conformity with the “status quo”, and competition is stimulated. The power distance (PD) dimension describes how societies work with people that are not equal in physical and intellectual capacities. In organizations, the PD dimension is related to the degree of centralization of authority and autocratic leadership. The uncertainty avoidance (UA) dimension deals with the basic fact of life: time goes only one way and we are living with uncertainties which we are aware of. The masculinity and femininity (MF) dimension shows the duality of the sexes in society. According to Hofstede (1980, 2001), in a feminine society there is less division of roles between the sexes. Hofstede (1983) asserts that there is a global relationship between PD and collectivism. Collectivist countries always show a high PD index whereas individualistic countries always reflect a low PD index. Latin American countries (LAC) and European countries are averse to uncertainty and show large PD. According to the author, LAC and clusters of some other countries show moderate masculinity. For Hofstede (2001), planning and control in an organization reflect cultural assumptions and are related to the rules of PD and UA of the dominant national culture. The author states that in countries that exhibit a large degree of PD, accounting systems are mostly used to justify the decisions of those in power in the organization. In countries with a high degree of uncertainty, accounting systems will have more detailed rules to work in certain situations. In countries with low UA, accounting systems allow more discretion in organizations or accountants, to work in certain situations (e.g. U.S.). In an environment of high individualism (U.S.), information in the accounting system can be taken more seriously and can be
30

ACCOUNTING & TAXATION ♦ Volume 6♦ Number 2 ♦ 2014
considered more important than in collective countries. In high masculine societies (e.g. U.S. and Germany), accounting systems seek to achieve pure financial goals. Development of International Accounting Standards The first entity responsible for establishing international accounting standards, the International Accounting Standards Committee (IASC) was organized in 1973 through an agreement of the leading professional accounting bodies in 10 countries: Australia, Canada, France, Germany, Ireland, Japan, Mexico, the Netherlands, the United Kingdom, and the U.S. On April 1, 2001, the International Accounting Standards Board (IASB) replaced the IASC (Doupnik and Perera, 2012). In June 2002, the E.U. decided that IFRS implementation would be mandatory for all listed companies starting in 2005 (E.U., 2002, cited in Ding, Jeanjean and Stolowy, 2005). Russia, Australia, and New Zealand followed by introducing similar policies. In October 2002, the Financial Accounting Standards Board (FASB) and the IASB issued a memorandum of understanding to formalize their commitment to the convergence of U.S. and international accounting standards (Ding et. al. 2005). Cultural and Economic Factors Related to the Implementation of IFRS Prior research suggests that culture is a crucial factor in the implementation of IFRS and its success. Ding et al. (2005) find that resistance to implement IFRS is related to cultural dynamics and is not exclusively caused by contractual reasons, alleged technical superiority, or legal origin. Hope, Jin and Kang (2006) observe that countries with lenient investor protection laws and countries that are perceived to provide better access to their domestic capital markets are more likely to adopt IFRS. However, they believe that to obtain the full benefits of adopting IFRS for financial reporting, standard setters must first make changes in the economic and political environments. A similar argument was made by Yalkin, Demir and Demir (2008) who note that the Turkish Accounting Standards Board accepted the harmonization of IFRS to obtain international acceptance for Turkey. Economic and political benefits are also derived from the adoption of IFRS. Using a sample of 102 non-E.U. countries, Ramanna and Sletten (2009), find that the most powerful countries are more resistant to IFRS adoption or surrendering their standard-setting authority to an international organization. The authors find evidence that suggests that a country is more likely to adopt international standards if its trade partners or countries within a geographical region are adopters themselves. Campbell, Doupnik and Tsakumis (2009) address the adoption of IFRS and their relationship with cultural and translation differences. The authors argue that multinational corporations and their auditors must consider the impact of possible biases held by their international staff and by colleagues in their international offices so they can identify their native country’s cultural predispositions and better understand how values affect their interpretations and judgments when applying accounting standards. The authors suggest that education and preparation of future professionals is necessary to overcome the impact of national culture in the application of the international standards. Clements, Nelli and Stovall (2010) examine the relationship between country size and cultural diversity with a country’s IFRS adoption decision. According to the authors, cultural influences do not seem to be a critical factor in the adoption of the international standards. They observe that smaller countries tend to adopt IFRS while larger ones tend not to. This is consistent with the notion that larger countries have well established accounting standards and resist incurring in the costs to adopt IFRS. Horton, Serafeim and Serafeim (2010) examine whether mandatory IFRS adoption improves the information environment. The results suggest that mandatory IFRS adoption has improved the quality of information intermediation in capital markets by increasing information and accounting comparability. The results obtained by Callao-Gastón et al. (2007) suggest that local comparability has worsened with the adoption of IFRS in Spain.
31
R. J. Cardona et al | AT ♦ Vol. 6 ♦ No. 2 ♦ 2014
Bova and Pereira (2012) summarize the current points of view regarding a country’s IFRS adoption decision. According to the authors, one point of view considers that IFRS represent improved financial reporting standards. The resulting uniformity in standards also achieves improved comparability, which results in a better information environment and an expected reduction in the cost of capital. The other point of view is that IFRS do not by themselves, result in improved financial reporting. The latter is achieved through the interaction of economic and political factors. The authors obtain empirical evidence on IFRS adoption observing private and public firms in Kenya, a country they describe as having open capital markets with limited enforcement capabilities. Bova and Pereira (2012) note that the presence of foreign investors is positively associated with the demand for transparency brought by adopting IFRS. Research by Ding et al., 2005; Hope et al., 2006 and Clements et al., 2010, among others, suggests that differences in culture, country size, economic and political factors may influence the adoption and subsequent successful implementation of IFRS. Clements et al. (2010) find that a country’s size seems to have a larger impact than national culture on the IFRS adoption decision, but suggest researchers should revisit their findings with alternative empirical methodology. We decided to use the April 2012 PwC survey to examine the extent of IFRS implementation ten years after the first countries (E.U., Russia, Australia, New Zealand, and the U.S.) decided to start the implementation of IFRS. Our paper is a partial replication of the study done by Clements et al (2010); however, we develop an estimation model that examines the effect of culture and economic factors on a country’s IFRS implementation decision in a sample of 69 countries. DATA AND METHODOLOGY Although our research methodology introduces elements of researcher induced bias, the results provide additional evidence to measure the impact of culture and economic factors on a country’s IFRS implementation decision. In our study, implementation refers to a country’s decision to partially or fully converge towards or adopt IFRS. Based on prior research and our expectations, we developed five testable hypotheses. The first four hypotheses consider the effects Hofstede’s cultural dimensions on a country’s implementation decision. The impact of culture was measured using only four of the six cultural dimensions developed by Hofstede because the values for the fifth and sixth cultural dimensions (long-term versus short-term orientation and indulgence versus restraint, respectively) are not available for the countries in our study sample. Since culture is an exogenous variable that may be correlated with other variables, cultural attributes might be acting as proxies for other omitted country effects. Our study includes other control variables to mitigate the existence of possible omitted country-related variables. Following Hope et al. (2006), we consider that certain economic factors, such as the existence of investor protection mechanisms and unlimited access to capital markets, may also have an impact on a country’s implementation decision. Our fifth research hypothesis examines the possible effects of certain economic factors, including market size on a country’s implementation decision. Prior research by La Porta et al. (1997, 1998 and 2000) considers the effect of economic variables such as investor protection mechanisms, type of legal system and the existence of developed capital markets on corporate valuation and governance. In our study we consider the effect of economic factors with proxies obtained from The Global Competitiveness Report for 2011-2012 published by the World Economic Forum (the WEF Report). The economic factors selected are elements derived from the twelve pillars used to measure the competitiveness of different countries. From the Institutions pillar, we selected the following variables related to investor protection mechanisms: strength of auditing and reporting standards, efficacy of corporate boards, protection of minority shareholders’ interests, and strength of investor protection. From the Financial Market Development pillar, we selected the “regulation of securities exchanges” variable.
32
ACCOUNTING & TAXATION ♦ Volume 6♦ Number 2 ♦ 2014
As a proxy for a country’s size we used its domestic and foreign market size index as reported in the WEF Report. In this report, market size is one element of the twelve pillars used to measure the competitiveness of countries with a domestic and a foreign market index. The domestic market size index is constructed by taking the natural log of the sum of the gross domestic product (GDP) valued at purchased power parity (PPP) plus the total value (PPP estimates) of imports of goods and services, minus the total value (PPP estimates) of exports of goods and services. Data are then normalized on a 1-to-7 scale. PPP estimates of imports and exports are obtained by taking the products of exports as a percentage of GDP and GDP valued at PPP. The foreign market size index is estimated as the natural log of the value (PPP estimates) of goods and services, normalized on a 1-to-7 scale. PPP estimates of exports are obtained by taking the product of exports as a percentage of GDP and GDP valued at PPP. Countries with a large degree of power distance are highly centralized and the roles of supervisors and employees (subordinates) are clearly defined, whereas countries with low power distance are decentralized. For Hofstede (2001), in countries that exhibit a large degree of PD, accounting systems are mostly used to justify the decisions of those occupying positions of power in organizations. Chan, Lin and Lai (2003) found that a company operating in a country with a large degree of power distance, such as the centralization of power in a few individuals, ignoring management controls and less competent staff, may exhibit large accounting errors. This situation could require the use of more structured accounting guidelines. According to Clements et al. (2010) a country may visualize the IASB as the supervisory entity responsible for establishing the required reporting standards. As a result, we can expect that country with a large degree of PD to implement IFRS. H1: A country with a large degree of power distance is more likely to have a higher IFRS implementation score. According to Hofstede (2001), in an environment of high individualism, information in the accounting system can be considered more valuable than in collectivist countries. The literature has mixed results on whether the cultural dimension of individualism/collectivism has an impact on a country’s IFRS implementation decision. Callen, Morel & Richardson (2011) find that earnings management seems to be inversely related to a country’s individualism dimension. Evans, Houston, Peters & Pratt (2012) observe that financial officers in U.S., Europe and Asia that use IFRS for financial reporting consider that IFRS allows them greater flexibility or discretion than officers that use U.S. GAAP. Han, Kang, Salter and Yoo (2013) note that countries with higher levels of individualism are associated with higher levels of earnings discretion. According to Clements et al. (2010), a collectivist country is expected to prefer an external entity such as the IASB to establish its accounting standards because of the perceived long-term benefit for the majority of individuals. In our study, we expect that highly individualistic countries are less likely to implement IFRS. H2: A highly individualistic country is more likely to have a lower IFRS implementation score. Hofstede (1980, 2001) argues that in a masculine society, earnings and money are important. Accounting systems in high masculine societies seek to achieve pure financial goals and present results that portray a responsible manager as a hero. Some authors have associated masculine societies with unethical practices. Scholtens and Dam (2007) suggest that masculinity is negatively related to ethical policies. Davis and Ruhe (2003) find that corruption seems to be predictable in masculine societies. According to Clements et al., (2010) a masculine country is characterized as promoting self-reliance and independence, whereas a feminine country is more dependent on others. In our study we expect that an independent country will be unwilling to accept accounting standards from an external (international) entity. H3: A country with a higher masculinity index is more likely to have a lower IFRS implementation score.
33

R. J. Cardona et al | AT ♦ Vol. 6 ♦ No. 2 ♦ 2014
For Hofstede (1980, 2001), in a society with a higher degree of uncertainty avoidance, management are less likely to make risky decisions. According to Clements et al. (2010), a country with a high degree or tolerance for uncertainty prefers to avoid changes in their laws and regulations, i.e. accounting standards, and will not be inclined to accept a change from their own known reporting standards to adopt new (unknown) standards. A country that displays strong or high uncertainty avoidance prefers rules over principles, whereas IFRS are principles-based accounting standards that allow greater flexibility in financial reporting (Schipper, 2005; Forgeas, 2008). Therefore, a country that exhibits weaker or lower uncertainty avoidance is more open to the use of principles over rules. H4: A country with a higher degree of uncertainty avoidance is more likely to have a lower IFRS implementation score. Prior research has examined the relationship between economic factors and the size of a country with the probability of IFRS implementation. La Porta et al. (2000) indicate that investor protection rights include disclosure and accounting rules. These rules supply investors with the necessary information to exercise their rights. They also indicate that in different jurisdictions, investors’ protection comes from different sources, including stock exchange regulations and accounting standards. Following La Porta et al. (2000), we consider that strength of auditing and reporting standards, efficacy of corporate boards, protection of minority shareholders' interests, strength of investor protection and regulation of securities exchanges represent components of the overall investor protection mechanisms. Hope et al. (2006) find that countries with lenient investor protection laws and countries that are perceived to provide better access to their domestic capital markets are more likely to adopt IFRS. Horton et al. (2010) suggests that mandatory IFRS adoption has improved the quality and comparability of the accounting information in capital markets. Clements et al. (2010) consider the effect of a country’s size in the IFRS adoption process, and uses two different measures for size. One measure considers the natural logarithm of a country’s total population, and the second measure considers the natural logarithm of a country’s total market capitalization. Regardless of the measure used, Clements et al. find that large countries are not expected to be inclined to adopt IFRS, whereas smaller countries are expected to be adopters because they do not have the necessary resources or infrastructure to develop their own accounting standards. In our study we develop the following hypothesis for economic factors: H5: A country with higher values for its economic factors (Strength of auditing and reporting standards, Efficacy of corporate boards, Protection of minority shareholders' interests, Strength of investor protection, Regulation of securities exchanges, Domestic market size index, and foreign market size index) is more likely to have a lower IFRS implementation score. To test our hypotheses we selected a study sample, designed an IFRS implementation scoring system for each country and used regression analyses to examine the association between cultural and economic factors and the country’s implementation decision. The following section explains the sample selection and the tests used. Sample Selection As presented on Table 1, the study sample consists of 69 countries with the information on the status of each country’s IFRS implementation decision pursuant to the PwC Survey and their cultural dimensions as measured by Hofstede (1980, 2001). The 69 countries are located in the following six regions: North America, South America, Asia, Europe, Africa and Oceana. We obtained the values for Hofstede’s cultural dimensions for the countries in our study sample (http://geert-hofstede.com/countries.html.). Based on these dimensions some LAC, like Ecuador, Guatemala and Panama, are in the bottom three for the IC dimension. This implies that they are highly collectivistic. Conversely, the United States, the United
34
ACCOUNTING & TAXATION ♦ Volume 6♦ Number 2 ♦ 2014
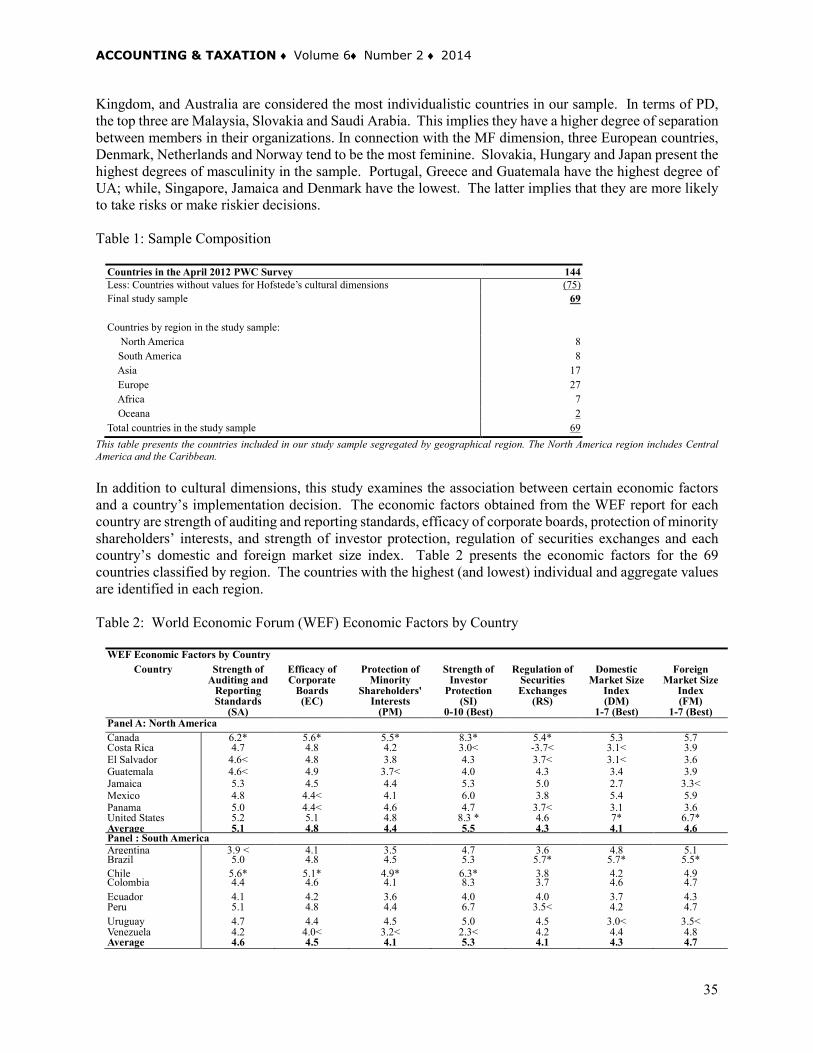
Kingdom, and Australia are considered the most individualistic countries in our sample. In terms of PD, the top three are Malaysia, Slovakia and Saudi Arabia. This implies they have a higher degree of separation between members in their organizations. In connection with the MF dimension, three European countries, Denmark, Netherlands and Norway tend to be the most feminine. Slovakia, Hungary and Japan present the highest degrees of masculinity in the sample. Portugal, Greece and Guatemala have the highest degree of UA; while, Singapore, Jamaica and Denmark have the lowest. The latter implies that they are more likely to take risks or make riskier decisions. Table 1: Sample Composition
Countries in the April 2012 PWC Survey 144 Less: Countries without values for Hofstede’s cultural dimensions (75)
Final study sample 69 Countries by region in the study sample: North America 8 South America 8 Asia 17 Europe 27 Africa 7 Oceana 2 Total countries in the study sample 69
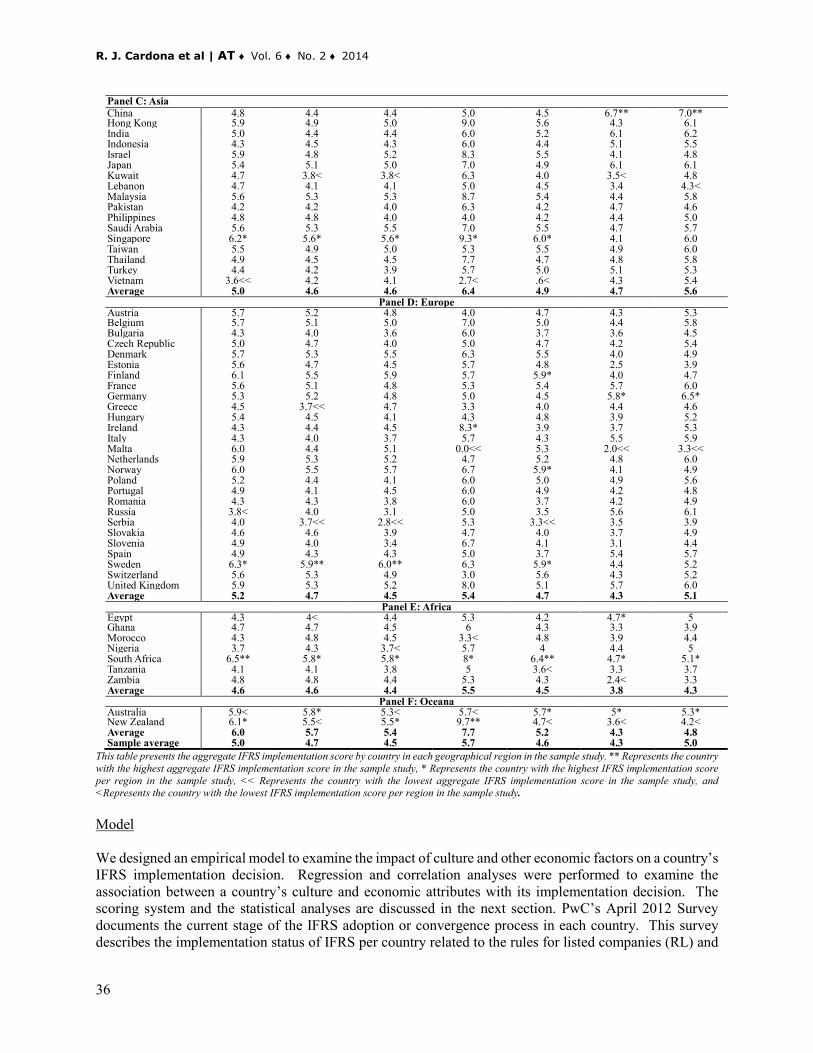
This table presents the countries included in our study sample segregated by geographical region. The North America region includes Central America and the Caribbean. In addition to cultural dimensions, this study examines the association between certain economic factors and a country’s implementation decision. The economic factors obtained from the WEF report for each country are strength of auditing and reporting standards, efficacy of corporate boards, protection of minority shareholders’ interests, and strength of investor protection, regulation of securities exchanges and each country’s domestic and foreign market size index. Table 2 presents the economic factors for the 69 countries classified by region. The countries with the highest (and lowest) individual and aggregate values are identified in each region. Table 2: World Economic Forum (WEF) Economic Factors by Country
WEF Economic Factors by Country Country Strength of
Auditing and Reporting Standards
(SA)
Efficacy of Corporate
Boards (EC)
Protection of Minority
Shareholders' Interests
(PM)
Strength of Investor
Protection (SI)
0-10 (Best)
Regulation of Securities Exchanges
(RS)
Domestic Market Size
Index (DM)
1-7 (Best)
Foreign Market Size
Index (FM)
1-7 (Best) Panel A: North America Canada 6.2* 5.6* 5.5* 8.3* 5.4* 5.3 5.7 Costa Rica 4.7 4.8 4.2 3.0< -3.7< 3.1< 3.9 El Salvador 4.6< 4.8 3.8 4.3 3.7< 3.1< 3.6 Guatemala 4.6< 4.9 3.7< 4.0 4.3 3.4 3.9 Jamaica 5.3 4.5 4.4 5.3 5.0 2.7 3.3< Mexico 4.8 4.4< 4.1 6.0 3.8 5.4 5.9 Panama 5.0 4.4< 4.6 4.7 3.7< 3.1 3.6 United States 5.2 5.1 4.8 8.3 * 4.6 7* 6.7* Average 5.1 4.8 4.4 5.5 4.3 4.1 4.6 Panel : South America Argentina 3.9 < 4.1 3.5 4.7 3.6 4.8 5.1 Brazil 5.0 4.8 4.5 5.3 5.7* 5.7* 5.5* Chile 5.6* 5.1* 4.9* 6.3* 3.8 4.2 4.9 Colombia 4.4 4.6 4.1 8.3 3.7 4.6 4.7 Ecuador 4.1 4.2 3.6 4.0 4.0 3.7 4.3 Peru 5.1 4.8 4.4 6.7 3.5< 4.2 4.7 Uruguay 4.7 4.4 4.5 5.0 4.5 3.0< 3.5< Venezuela 4.2 4.0< 3.2< 2.3< 4.2 4.4 4.8 Average 4.6 4.5 4.1 5.3 4.1 4.3 4.7
35
R. J. Cardona et al | AT ♦ Vol. 6 ♦ No. 2 ♦ 2014
Panel C: Asia China 4.8 4.4 4.4 5.0 4.5 6.7** 7.0** Hong Kong 5.9 4.9 5.0 9.0 5.6 4.3 6.1 India 5.0 4.4 4.4 6.0 5.2 6.1 6.2 Indonesia 4.3 4.5 4.3 6.0 4.4 5.1 5.5 Israel 5.9 4.8 5.2 8.3 5.5 4.1 4.8 Japan 5.4 5.1 5.0 7.0 4.9 6.1 6.1 Kuwait 4.7 3.8< 3.8< 6.3 4.0 3.5< 4.8 Lebanon 4.7 4.1 4.1 5.0 4.5 3.4 4.3< Malaysia 5.6 5.3 5.3 8.7 5.4 4.4 5.8 Pakistan 4.2 4.2 4.0 6.3 4.2 4.7 4.6 Philippines 4.8 4.8 4.0 4.0 4.2 4.4 5.0 Saudi Arabia 5.6 5.3 5.5 7.0 5.5 4.7 5.7 Singapore 6.2* 5.6* 5.6* 9.3* 6.0* 4.1 6.0 Taiwan 5.5 4.9 5.0 5.3 5.5 4.9 6.0 Thailand 4.9 4.5 4.5 7.7 4.7 4.8 5.8 Turkey 4.4 4.2 3.9 5.7 5.0 5.1 5.3 Vietnam 3.6<< 4.2 4.1 2.7< .6< 4.3 5.4 Average 5.0 4.6 4.6 6.4 4.9 4.7 5.6
Panel D: Europe Austria 5.7 5.2 4.8 4.0 4.7 4.3 5.3 Belgium 5.7 5.1 5.0 7.0 5.0 4.4 5.8 Bulgaria 4.3 4.0 3.6 6.0 3.7 3.6 4.5 Czech Republic 5.0 4.7 4.0 5.0 4.7 4.2 5.4 Denmark 5.7 5.3 5.5 6.3 5.5 4.0 4.9 Estonia 5.6 4.7 4.5 5.7 4.8 2.5 3.9 Finland 6.1 5.5 5.9 5.7 5.9* 4.0 4.7 France 5.6 5.1 4.8 5.3 5.4 5.7 6.0 Germany 5.3 5.2 4.8 5.0 4.5 5.8* 6.5* Greece 4.5 3.7<< 4.7 3.3 4.0 4.4 4.6 Hungary 5.4 4.5 4.1 4.3 4.8 3.9 5.2 Ireland 4.3 4.4 4.5 8.3* 3.9 3.7 5.3 Italy 4.3 4.0 3.7 5.7 4.3 5.5 5.9 Malta 6.0 4.4 5.1 0.0<< 5.3 2.0<< 3.3<< Netherlands 5.9 5.3 5.2 4.7 5.2 4.8 6.0 Norway 6.0 5.5 5.7 6.7 5.9* 4.1 4.9 Poland 5.2 4.4 4.1 6.0 5.0 4.9 5.6 Portugal 4.9 4.1 4.5 6.0 4.9 4.2 4.8 Romania 4.3 4.3 3.8 6.0 3.7 4.2 4.9 Russia 3.8< 4.0 3.1 5.0 3.5 5.6 6.1 Serbia 4.0 3.7<< 2.8<< 5.3 3.3<< 3.5 3.9 Slovakia 4.6 4.6 3.9 4.7 4.0 3.7 4.9 Slovenia 4.9 4.0 3.4 6.7 4.1 3.1 4.4 Spain 4.9 4.3 4.3 5.0 3.7 5.4 5.7 Sweden 6.3* 5.9** 6.0** 6.3 5.9* 4.4 5.2 Switzerland 5.6 5.3 4.9 3.0 5.6 4.3 5.2 United Kingdom 5.9 5.3 5.2 8.0 5.1 5.7 6.0 Average 5.2 4.7 4.5 5.4 4.7 4.3 5.1
Panel E: Africa Egypt 4.3 4< 4.4 5.3 4.2 4.7* 5 Ghana 4.7 4.7 4.5 6 4.3 3.3 3.9 Morocco 4.3 4.8 4.5 3.3< 4.8 3.9 4.4 Nigeria 3.7 4.3 3.7< 5.7 4 4.4 5 South Africa 6.5** 5.8* 5.8* 8* 6.4** 4.7* 5.1* Tanzania 4.1 4.1 3.8 5 3.6< 3.3 3.7 Zambia 4.8 4.8 4.4 5.3 4.3 2.4< 3.3 Average 4.6 4.6 4.4 5.5 4.5 3.8 4.3
Panel F: Oceana Australia 5.9< 5.8* 5.3< 5.7< 5.7* 5* 5.3* New Zealand 6.1* 5.5< 5.5* 9.7** 4.7< 3.6< 4.2< Average 6.0 5.7 5.4 7.7 5.2 4.3 4.8 Sample average 5.0 4.7 4.5 5.7 4.6 4.3 5.0
This table presents the aggregate IFRS implementation score by country in each geographical region in the sample study. ** Represents the country with the highest aggregate IFRS implementation score in the sample study, * Represents the country with the highest IFRS implementation score per region in the sample study, << Represents the country with the lowest aggregate IFRS implementation score in the sample study, and <Represents the country with the lowest IFRS implementation score per region in the sample study. Model We designed an empirical model to examine the impact of culture and other economic factors on a country’s IFRS implementation decision. Regression and correlation analyses were performed to examine the association between a country’s culture and economic attributes with its implementation decision. The scoring system and the statistical analyses are discussed in the next section. PwC’s April 2012 Survey documents the current stage of the IFRS adoption or convergence process in each country. This survey describes the implementation status of IFRS per country related to the rules for listed companies (RL) and
36

ACCOUNTING & TAXATION ♦ Volume 6♦ Number 2 ♦ 2014
the adopted version of IFRS (VI), similarities and differences in rules for subsidiaries of foreign companies or foreign companies listed in local exchanges (DR), rules for statutory filings, the locally accepted version of IFRS, additional regulatory financial statement requirements that permit or require the use of IFRS, IFRS convergence plans, type of tax regime and plans for IFRS convergence as the basis of tax reporting. The focus of this study is on the accounting standards that apply to public companies only. Four questions were excluded from the original survey because they did not apply to publicly held companies. We added a time-related dimension for the implementation date (ID) to measure the speed of the implementation process. The relevant variable is the date in which public companies began using IFRS. Based on the responses on the PwC survey, we designed a grading system to determine an IFRS implementation score for each country (the country’s implementation score). Table 3 presents the scoring system used. We assigned a point value to each of the responses that fluctuated from 0 to 3. We assigned a value of 0 to those countries to which the IFRS requirement for listed companies did not apply because the country had no local stock exchange. A value of 1 was assigned to countries that had no IFRS requirement but its use is permitted. A value of 2 was given to countries that require IFRS for listed companies with certain exceptions. Some exceptions include: all or some financial institutions are not required to use IFRS; only financial institutions are required to use IFRS; some companies have additional reporting requirements using local standards and/or are using locally adopted IFRS. A value of 3 was assigned to countries that require IFRS for all listed companies with no exceptions. Table 3: Description of the Grading System Used For the Answers to the PWC Survey Questions
Question Points
Assigned IFRS requirement for listed
companies (RL) Version of IFRS for listed
companies (VI) Implementation Date
(ID) Different Rules for
subsidiaries of FC and FC listed locally (DR)
0 Not applicable Not applicable Not applicable Not applicable 1 No requirement Locally adopted IFRS In process Yes, or the use of other
standards are permitted
2 Required with exceptions such as: except for some financial
institutions, additional reporting using local standards, and/or using IFRS-Country’s language version.
IFRS as published by IASB and as locally adopted or IFRS as published by IASB with the exception of some financial
institutions
2010-2013 Yes, but reconciliations are required
3 Required IFRS as published by IASB or IFRS Country’s language
version
Before 2010 No
This table presents the grading system developed in this study using the answers to the questions in the April 2012 “PwC Survey: IFRS Adoption by Country Survey”. The values assigned to each response represent the IFRS implementation score. A value of “0” was assigned to a response to reflect the lowest degree of IFRS implementation. The highest value assigned represents the highest degree of IFRS implementation for that country. With respect to the version of IFRS adopted by listed companies in each country, we assigned a value of 0 to those countries to which this requirement did not apply because the country had no local stock exchange. A value of 1 was assigned to countries that apply locally adopted IFRS. A value of 2 was given to countries that adopted IFRS as published by IASB and use, in some respects, locally adopted IFRS. We also assigned a value of 2 to countries that applied IFRS as published by the IASB with the exception of some financial institutions or that have additional reporting requirements using local standards and/or are using locally adopted IFRS. A value of 3 was assigned to countries that require IFRS for all listed companies with no exceptions. The adoption date measures the speed of IFRS implementation in each country. If a country had not implemented IFRS, a value of 0 was assigned. A value of 1 was assigned to a country in the process of implementing IFRS for public companies but not yet decided. A value of 2 was given to those countries
37

R. J. Cardona et al | AT ♦ Vol. 6 ♦ No. 2 ♦ 2014
that implemented IFRS on or after 2010. Countries that implemented IFRS before 2010 received a value of 3. The last element in our scoring system refers to the existence of different rules for foreign companies and foreign locally listed companies. A value of 0 was given to those countries where this requirement did not apply because the country had no local stock exchange. A value of 1 was assigned if different rules apply for foreign companies or if these companies were permitted to use different rules. A value of 2 was assigned to those countries where different rules apply but reconciliation to IFRS is required. Countries where foreign companies are subject to the same accounting rules as other companies received a value of 3. In other words, if the country adopted IFRS for public companies, the same rules apply whether it is a local or foreign company. Table 4 presents the responses obtained by PwC in the April 2012 “PwC Survey: IFRS Adoption by Country Survey” regarding the implementation of IFRS by listed companies in each country in our study sample. After analyzing the responses, values were assigned to each response according to each country’s degree of implementation and added to obtain a final IFRS implementation score per country. As expected, the United States has the lowest score in the North America region, which is consistent with its ongoing convergence process since 2002. Tests We used three regression models to test our hypotheses regarding the impact of cultural and economic factors on the implementation decision in each country. The first model considered Hofstede’s cultural dimensions as the possible determinants of a country’s implementation score. The regression model is as follows: 𝑆𝑆𝑆𝑆𝑆𝑆𝑆𝑆𝑆𝑆𝑖𝑖 = 𝛼𝛼𝑖𝑖 + 𝑏𝑏𝑖𝑖 𝐼𝐼𝐼𝐼 + ℎ𝑖𝑖 𝑃𝑃𝑃𝑃 + 𝑠𝑠𝑖𝑖 𝑀𝑀𝑀𝑀 + 𝑆𝑆𝑖𝑖 𝑈𝑈𝐴𝐴 + 𝜀𝜀𝑖𝑖 (1) where Scorei represents a country’s IFRS implementation score, IC represents the value of a country’s Individualism/Collectivism dimension, PD is the value of a country’s Power Distance value, MF represents the value of a country’s Masculinity/Femininity dimension, and UA is the value of a country’s Uncertainty Avoidance dimension Our second regression model was used to test our five research hypotheses regarding the impact of economic factors on a country’s implementation decision. The regression model is as follows: 𝑆𝑆𝑆𝑆𝑆𝑆𝑆𝑆𝑆𝑆𝑖𝑖 = 𝛼𝛼𝑖𝑖 + 𝑛𝑛𝑖𝑖𝑆𝑆𝐴𝐴 + 𝑙𝑙𝑖𝑖 𝐸𝐸𝐼𝐼 + 𝑘𝑘𝑖𝑖 𝑃𝑃𝑀𝑀 + 𝑝𝑝𝑖𝑖 𝑆𝑆𝐼𝐼 + 𝑡𝑡𝑖𝑖RS + 𝑔𝑔𝑖𝑖FT + 𝑣𝑣𝑖𝑖DM + 𝑧𝑧𝑖𝑖FM + 𝜀𝜀𝑖𝑖 (2) where Scorei represents a country’s IFRS implementation score, SA represents strength of auditing and reporting standards, EC means efficacy of corporate boards, PM represents protection of minority shareholders' interests, SI represents a system’s strength of investors protection, RS is related to regulation of securities exchanges, DM is related to the size of the domestic market and FM to the foreign market size. A third regression model was used to examine whether a country’s cultural dimensions and its economic factors, when taken together, explain better the implementation scores assigned to our countries in our study sample. The third regression model is as follows: 𝑆𝑆𝑆𝑆𝑆𝑆𝑆𝑆𝑆𝑆𝑖𝑖 = 𝛼𝛼𝑖𝑖 + 𝑏𝑏𝑖𝑖𝐼𝐼𝐼𝐼 + ℎ𝑖𝑖𝑃𝑃𝑃𝑃 + 𝑠𝑠𝑖𝑖𝑀𝑀𝑀𝑀 + 𝑆𝑆𝑖𝑖𝑈𝑈𝐴𝐴 + 𝑛𝑛𝑖𝑖𝑆𝑆𝐴𝐴 + 𝑙𝑙𝑖𝑖 𝐸𝐸𝐼𝐼 + 𝑘𝑘𝑖𝑖 𝑃𝑃𝑀𝑀 + 𝑝𝑝𝑖𝑖 𝑆𝑆𝐼𝐼 + 𝑡𝑡𝑖𝑖RS + (3) 𝑔𝑔𝑖𝑖FT + 𝑣𝑣𝑖𝑖DM + 𝑧𝑧𝑖𝑖FM + 𝜀𝜀𝑖𝑖 The following section presents and discusses the tests results. Initially we discuss the results of the regression analyses and their possible interpretations, followed by the Pearson (Spearman) correlations between the variables and the related explanations.
38

ACCOUNTING & TAXATION ♦ Volume 6♦ Number 2 ♦ 2014
Table 4: PWC’s Survey Answer Values and the Final IFRS Implementation Scores by Country
PwC’s Survey Questions Country IFRS requirement for
listed companies Version of
IFRS Implementation
Date (ID) Different Rules for subsidiaries of FC and FC listed locally avoidance
IFRS Implementation Score
Panel A: North America Canada 2 2 2 1 7
Costa Rica 3 3 3 3 12 El Salvador 2 2 2 3 9 Guatemala 3 3 3 3 12
Jamaica 3 3 3 3 12 Mexico 2 3 2 2 9 Panama 3 2 2 3 10
United States 1 0 0 1 2 Panel : South America
Argentina 2 3 2 3 10 Brazil 3 2 2 3 10 Chile 2 2 2 3 9
Colombia 1 0 1 0 2 Ecuador 2 3 2 3 10
Peru 2 2 2 3 9 Uruguay 2 2 2 3 9
Venezuela 3 3 2 3 11 Panel C: Asia
China 1 0 0 0 1 Hong Kong 1 3 3 1 8
India 1 3 1 3 8 Indonesia 1 0 1 3 5
Israel 2 2 3 1 8 Japan 1 1 1 1 4
Kuwait 3 3 3 3 12 Lebanon 3 3 3 3 12 Malaysia 3
1 2 3 9
Pakistan 3 1 3 3 10 Philippines 3 1 3 1 8
Saudi Arabia 1 3 1 3 8 Singapore 2 1 1 1 5
Taiwan 1 0 2 2 5 Thailand 1 1 1 1 4 Turkey 3 3 3 3 12
Vietnam 0 0 0 0 0 Panel D: Europe
Austria 3 1 3 3 10 Belgium 3 1 3 3 10 Bulgaria 3 1 3 3 10
Czech Republic 3 1 3 1 8 Denmark 3 1 3 1 8 Estonia 3 1 3 3 10 Finland 3 1 3 3 10 France 3 1 3 1 8
Germany 3 1 3 1 8 Greece 3 1 3 3 10
Hungary 3 1 3 3 10 Ireland 3 1 3 3 10
Italy 3 1 3 3 10 Malta 3 1 3 0 7
Netherlands 3 1 3 1 8 Norway 3 1 3 1 8 Poland 3 1 3 1 8
Portugal 3 1 3 3 10 Romania 3 1 3 3 10 Russia 3 3 2 3 11 Serbia 3 1 3 3 10
Slovakia 3 1 3 3 10 Slovenia 3 1 3 3 10
Spain 3 1 3 3 10 Sweden 3 1 3 3 10
Switzerland 1 2 3 1 7 United Kingdom 3 1 3 3 10
Panel E: Africa Egypt 0 0 0 0 0 Ghana 3 3 3 3 12
Morocco 2 1 3 3 9 Nigeria 3 3 1 3 10
South Africa 3 3 3 3 12 Tanzania 3 3 3 3 12 Zambia 3 3 3 3 12
Panel F: Oceana Australia 3 2 3 1 9
New Zealand 3 2 3 3 11 This table presents the responses obtained by PwC in the April 2012 “PwC Survey: IFRS Adoption by Country Survey” regarding the implementation of IFRS by listed companies in each country based on the grading system developed in this study.
39

R. J. Cardona et al | AT ♦ Vol. 6 ♦ No. 2 ♦ 2014
RESULTS AND DISCUSSION Regression and Correlation Analyses We tested our hypotheses using regression analyses and three different models. The first regression model uses Hofstede’s cultural dimensions as dependent variables of the implementation score. Table 5 presents the results obtained, which suggest that none of the cultural dimensions appear to have a significant impact on a country’s implementation decision. As predicted, MF has an inverse but not a significant relation with the dependent variable. The low explanatory power of the adjusted R2 of this model suggests that a country’s cultural dimensions do not help to explain its implementation decision. Table 6 summarizes the results using our second regression model. Results suggest that the PM and FM variables have significant explanatory power since they are negatively related and statistically significant. This implies that, the lower the score related to the protection of minority shareholders' interests, the higher the probability of implementation. As to FM, the smaller the foreign market size, the higher the probability of implementation. These results partially support our hypothesis that economic factors are inversely related to the probability of implementation. Both variables seem to have a significant impact on a country’s implementation decision. The explanatory power of the model as explained by the adjusted R2 is higher than for the first model. Table 5: Regression Analysis Results for Model 1: Hofstede’s Cultural Dimensions and Their Relationship with The Implementation of IFRS by Country
Regression Analysis Results
Alpha Individualism/ Collectivism
(IC)
Power Distance (PD)
Masculinity/ Femininity
(MF)
Uncertainty Avoidance
(UA)
Coefficient 6.358 0.019 0.011 -0.015 0.025 p-value 0.006 0.357 0.632 0.430 0.106 Adj. R2 -0.003
This table presents the results obtained for regression model 1 that examines the association between Hofstede’s cultural dimensions and the IFRS implementation score by country. The estimated model is: 𝑆𝑆𝑆𝑆𝑆𝑆𝑆𝑆𝑆𝑆𝑖𝑖 = 𝛼𝛼𝑖𝑖 + 𝑏𝑏𝑖𝑖 𝐼𝐼𝐼𝐼 + ℎ𝑖𝑖 𝑃𝑃𝑃𝑃 + 𝑠𝑠𝑖𝑖 𝑀𝑀𝑀𝑀 + 𝑆𝑆𝑖𝑖 𝑈𝑈𝐴𝐴 + 𝜀𝜀𝑖𝑖. Scorei represents a country’s IFRS implementation score, IC represents the value of a country’s Individualism/Collectivism dimension, PD is the value of a country’s Power Distance value, MF represents the value of a country’s Masculinity/Femininity dimension, and UA is the value of a country’s Uncertainty Avoidance dimension. Table 7 presents the relationship between Hofstede’s cultural dimensions, economic factors and the IFRS implementation scores. The results show a positive significant relation between the IC cultural dimension and the implementation score (significant at the 0.05 level). These results do not support our prediction that highly individualistic countries will have lower implementation scores. The results also suggest a significant negative relation of PM and FM with the implementation score (significant at the .05 level). These results support our hypothesis that higher values for economic factors are inversely related to implementation scores. The explanatory power of the model, as explained by the adjusted R2, is higher than for the previous two models.
40

ACCOUNTING & TAXATION ♦ Volume 6♦ Number 2 ♦ 2014
Table 6: Regression Analysis Results for Model 2: Economic Factors and Their Relationship with the Implementation of IFRS by Country
Economic Factors Alpha Strength of
Auditing And Reporting Standards
Efficacy of Corporate
Boards
Protection of Minority
Shareholders' Interests
Strength of Investor
Protection
Regulation Of Securities Exchanges
Domestic Market Size
Index
Foreign Market Size
Index
Coefficient 14.467 1.655 0.789 -2.945 0.158 0.644 -0.012 -1.669 p-value 0.000 0.108 0.467 0.004* 0.425 0.372 0.987 0.047* Adj. R2 0.254
This table presents the results obtained for regression model 2 that examines the association between certain economic factors obtained from the WEF Report and the IFRS implementation score by country. The estimated model is: 𝑆𝑆𝑆𝑆𝑆𝑆𝑆𝑆𝑆𝑆𝑖𝑖 = 𝛼𝛼𝑖𝑖 + 𝑛𝑛𝑖𝑖𝑆𝑆𝐴𝐴 + 𝑙𝑙𝑖𝑖 𝐸𝐸𝐼𝐼 + 𝑘𝑘𝑖𝑖 𝑃𝑃𝑀𝑀 + 𝑝𝑝𝑖𝑖 𝑆𝑆𝐼𝐼 + 𝑡𝑡𝑖𝑖RS + 𝑔𝑔𝑖𝑖FT + 𝑣𝑣𝑖𝑖DM + 𝑧𝑧𝑖𝑖FM + 𝜀𝜀𝑖𝑖. Scorei represents a country’s IFRS implementation score, SA represents strength of auditing and reporting standards, EC means efficacy of corporate boards, PM represents protection of minority shareholders' interests, SI represents a system’s strength of investors protection, RS is related to regulation of securities exchanges, DM is related to the size of the domestic market and FM to the foreign market size. * represents a p-value significant at the 0.05 level, and ** represents a p-value significant at the 0.10 level. Table 7: Regression Analysis Results For Model 3: Hofstede’s Cultural Dimensions, Economic Factors, and Their Relationship with the Implementation of IFRS by Country
Hofstede's Cultural Dimensions Economic Factors Alpha IC PD MF UA SA EC PM SI RS DM FM
Coefficient 13.238 0.041 0.016 -0.006 0.015 0.615 1.05 -2.512 0.235 0.715 -0.392 -0.536 p-value 0.003 0.041* 0.422 0.748 0.339 0.594 0.349 0.019* 0.248 0.334 0.606 0.083** Adj. R2 0.27
This table presents the relationship between Hofstede’s cultural dimensions, certain economic factors obtained from the WEF Report and the IFRS implementation scores by country. The estimated model is:𝑆𝑆𝑆𝑆𝑆𝑆𝑆𝑆𝑆𝑆𝑖𝑖 = 𝛼𝛼𝑖𝑖 + 𝑏𝑏𝑖𝑖𝐼𝐼𝐼𝐼 + ℎ𝑖𝑖𝑃𝑃𝑃𝑃 + 𝑠𝑠𝑖𝑖𝑀𝑀𝑀𝑀 + 𝑆𝑆𝑖𝑖𝑈𝑈𝐴𝐴 + 𝑛𝑛𝑖𝑖𝑆𝑆𝐴𝐴 + 𝑙𝑙𝑖𝑖 𝐸𝐸𝐼𝐼 + 𝑘𝑘𝑖𝑖 𝑃𝑃𝑀𝑀 + 𝑝𝑝𝑖𝑖 𝑆𝑆𝐼𝐼 +𝑡𝑡𝑖𝑖RS + 𝑔𝑔𝑖𝑖FT + 𝑣𝑣𝑖𝑖DM + 𝑧𝑧𝑖𝑖FM + 𝜀𝜀𝑖𝑖. Scorei represents a country’s IFRS implementation score, IC represents the value of a country’s Individualism/Collectivism dimension, PD is the value of a country’s Power Distance value, MF represents the value of a country’s Masculinity/Femininity dimension, and UA is the value of a country’s Uncertainty Avoidance dimension. SA represents strength of auditing and reporting standards, EC means efficacy of corporate boards, PM represents protection of minority shareholders' interests, SI represents a system’s strength of investors’ protection, RS is related to regulation of securities exchanges, DM is related to the size of the domestic market and FM to the foreign market size. * represents a p-value significant at the 0.05 level, and ** represents a p-value significant at the 0.10 level. Countries included in the European region implemented IFRS almost at the same time and at the same level, based on the implementation score. Most of these countries adopted IFRS as part of the association agreements of the European Union. Since these countries represent almost 40 percent of the sample, we ran a regression analysis excluding the European countries as a robustness test. Table 8 presents the results for this regression that reflects a positive significant relation between the IC dimension and the implementation score (significant at the 0.10 level). The results also suggest a significant negative relation of PM and a positive relation of SA and RS with the implementation score (significant at the .05 level). The results for IC and PM concur with our findings of the regression for the whole sample. The explanatory power of the model, as explained by the adjusted R2, is higher than for the previous models. Pearson (Spearman) correlations between the ranked variables and Hofstede’s four cultural dimensions for our study sample are shown below (above) the diagonal in Tables 9a and 9b. Some of the variables seem to be correlated. We performed multicollinearity tests and the results obtained from the variance inflation factors do not suggest significant multicollinearity problems.
41

R. J. Cardona et al | AT ♦ Vol. 6 ♦ No. 2 ♦ 2014
Table 8: Regression Analysis Results For Model 3: Hofstede’s Cultural Dimensions, Economic Factors and Their Relationship with the Implementation of IFRS by Country
Hofstede's Cultural Dimensions Economic Factors Alpha IC PD MF UA SA EC PM SI RS DM FM
Coefficient 13.180 0.055 0.044 -0.020 0.019 3.053 0.586 -5.485 0.096 1.947 -0.850 -1.777 p-value 0.016 0.069** 0.118 0.561 0.360 0.046* 0.698 0.002* 0.764 0.028* 0.497 0.199 Adj. R2 0.535
This table presents results obtained for regression model 3 that examines the association between Hofstede’s cultural dimensions, certain economic factors obtained from the WEF Report and the IFRS implementation scores by country, excluding the European countries. The estimated model is: 𝑆𝑆𝑆𝑆𝑆𝑆𝑆𝑆𝑆𝑆𝑖𝑖 = 𝛼𝛼𝑖𝑖 + 𝑏𝑏𝑖𝑖𝐼𝐼𝐼𝐼 + ℎ𝑖𝑖𝑃𝑃𝑃𝑃 + 𝑠𝑠𝑖𝑖𝑀𝑀𝑀𝑀 + 𝑆𝑆𝑖𝑖𝑈𝑈𝐴𝐴 + 𝑛𝑛𝑖𝑖𝑆𝑆𝐴𝐴 + 𝑙𝑙𝑖𝑖 𝐸𝐸𝐼𝐼 + 𝑘𝑘𝑖𝑖 𝑃𝑃𝑀𝑀 + 𝑝𝑝𝑖𝑖 𝑆𝑆𝐼𝐼 + 𝑡𝑡𝑖𝑖RS + 𝑔𝑔𝑖𝑖FT + 𝑣𝑣𝑖𝑖DM + 𝑧𝑧𝑖𝑖FM + 𝜀𝜀𝑖𝑖 Scorei indicates a country’s IFRS implementation score, IC equals a country’s Individualism/Collectivism dimension, PD is the value of a country’s Power Distance value, MF equals the value of a country’s Masculinity/Femininity dimension, and UA equals a country’s Uncertainty Avoidance dimension. SA represents strength of auditing and reporting standards, EC means efficacy of corporate boards, PM represents protection of minority shareholders' interests, SI represents a system’s strength of investors’ protection, RS is related to regulation of securities exchanges, DM relates to the domestic market size and FM to the foreign market size. * represents significant at the 0.05 level, and ** represents significant at the 0.10 level. Table 9a: Pearson (Spearman) Correlation Matrix for Our Study Sample
Pearson (Spearman) Correlation Results Variables RL VI ID DR SCORE IC PD MF
RL 0.13 0.74** 0.41** 0.69** 0.29* -0.07 -0.11 -0.29 0.00 0.00 0.00 -0.01 -0.59 -0.36
VI 0.22 0.07 0.44** 0.58** -0.15 0.16 0.00 -0.08 -0.56 0.00 0.00 -0.22 -0.20 -0.98
ID 0.78** 0.20 0.24 0.52** 0.38** -0.31 -0.08 0.00 -0.10 -0.05 0.00 0.00 -0.01 -0.49
DR 0.45** 0.46** 0.36** 0.8** -0.14 0.16 -0.11 0.00 0.00 0.00 0.00 -0.25 -0.20 -0.37
SCORE 0.8** 0.64** 0.76** 0.78** -0.05 0.09 -0.09 0.00 0.00 0.00 0.00 -0.71 -0.46 -0.45
IC 0.25* -0.20 0.29* -0.17 0.04 -0.65 0.21 -0.04 -0.11 -0.02 -0.18 -0.74 0.00 -0.09
PD -0.07 0.16 -0.26 0.17 0.01 -0.66 0.00 -0.55 -0.18 -0.03 -0.18 -0.91 0.00 -1.00
MF -0.12 0.02 -0.12 -0.04 -0.08 0.13 0.12 -0.33 -0.87 -0.33 -0.75 -0.50 -0.28 -0.34
UA 0.15 0.06 0.15 0.22 0.19 -0.24 0.23 -0.06 -0.23 -0.65 -0.21 -0.73 -0.11 -0.05 -0.05 -0.65
SA 0.11 -0.11 0.23 -0.24 -0.02 0.55** -0.51 -0.10 -0.39 -0.36 -0.05 -0.05 -0.87 0.00 0.00 -0.40
EC 0.00 -0.08 0.08 -0.22 -0.09 0.47** -0.45 -0.09 -1.00 -0.50 -0.53 -0.07 -0.48 0.00 0.00 -0.49
PM -0.09 -0.20 0.03 -0.28 -0.19 0.47** -0.52 -0.16 -0.49 -0.11 -0.82 -0.02 -0.12 0.00 0.00 -0.18
SI -0.12 -0.06 -0.13 -0.02 -0.11 0.19 -0.15 -0.02 -0.34 -0.63 -0.29 -0.87 -0.39 -0.12 -0.23 0.87
RS -0.01 -0.07 0.13 -0.27 -0.09 0.49** -0.41 -0.06 -0.96 -0.56 -0.31 -0.03 -0.49 0.00 0.00 -0.63
DM -0.35 -0.25 -0.44 -0.30 -0.44 0.29* -0.06 0.27* 0.00 -0.04 0.00 -0.01 0.00 -0.02 -0.60 -0.03
FM -0.34 -0.32 -0.38 -0.37 -0.47 0.34** -0.07 0.25* 0.00 -0.01 0.00 0.00 0.00 -0.01 0.60 -0.04
This table presents Pearson Spearman correlation results. Pearson correlation results are below the diagonal; Spearman correlations are above the diagonal. ***, ** and * indicate significance at the 0.01, 0.05 and 0.10 levels respectively. Variable definitions are as follows: Scorei represents a country’s IFRS implementation score, IC represents the value of a country’s Individualism/Collectivism dimension, PD is the value of a country’s Power Distance value, MF represents the value of a country’s Masculinity/Femininity dimension, and UA is the value of a country’s Uncertainty Avoidance dimension. SA represents strength of auditing and reporting standards, EC means efficacy of corporate boards, PM represents protection of minority shareholders' interests, SI represents a system’s strength of investors’ protection, RS is related to regulation of securities exchanges, DM is related to the size of the domestic market and FM to the foreign market size.
42

ACCOUNTING & TAXATION ♦ Volume 6♦ Number 2 ♦ 2014
Table 9b: Pearson (Spearman) Correlation Matrix for Our Study Sample
Pearson (Spearman) Correlation Results Variables UA SA EC PM SI RS DM FM
RL 0.12 0.05 -0.07 -0.11 -0.15 -0.01 -0.29 -0.31 -0.31 -0.67 -0.56 -0.37 -0.23 -0.93 -0.01 -0.01
VI 0.07 -0.10 -0.07 -0.19 -0.08 -0.08 -0.23 -0.28 -0.59 -0.40 -0.56 -0.12 -0.53 -0.52 -0.05 -0.02
ID 0.07 0.21 0.06 0.04 -0.12 0.16 -0.38 -0.32 -0.57 -0.09 -0.61 -0.73 -0.33 -0.20 0.00 -0.01
DR 0.21 -0.29 -0.26 -0.31 -0.07 -0.29 -0.33 -0.40 -0.08 -0.02 -0.03 -0.01 -0.57 -0.02 -0.01 0.00
SCORE 0.17 -0.24 -0.27 -0.34 -0.16 -0.26 -0.43 -0.50 -0.17 -0.05 -0.03 0.00 -0.19 -0.03 0.00 0.00
IC -0.22 0.52** 0.38** 0.42** 0.17 0.48** 0.27* 0.35** -0.06 0.00 0.00 0.00 -0.15 0.00 -0.03 0.00
PD 0.22 0.52** -0.45 -0.53 -0.16 -0.42 -0.08 -0.08 -0.07 0.00 0.00 0.00 -0.20 0.00 -0.54 -0.52
MF -0.19 -0.03 0.00 -0.06 -0.05 0.07 0.33** 0.31* 0.12 -0.82 -1.00 -0.61 -0.70 -0.59 -0.01 -0.01
UA -0.28 -0.41 -0.36 -0.27 -0.38 -0.11 -0.26 -0.02 0.00 0.00 -0.02 0.00 -0.38 -0.03
SA -0.30 0.81** 0.86** 0.40** 0.79* 0.08 0.25* -0.01 0.00 0.00 0.00 0.00 -0.53 -0.04
EC -0.43 0.82** 0.81** 0.34** 0.68** 0.14 0.27* 0.00 0.00 0.00 -0.01 0.00 -0.25 -0.02
PM -0.41 0.87** 0.84** 0.42** 0.76** 0.14 0.26* 0.00 0.00 0.00 0.00 0.00 -0.24 -0.03
SI -0.34 0.37** 0.37** 0.39** 0.32** 0.21 0.30* -0.01 0.00 0.00 0.00 -0.01 -0.09 -0.01
RS -0.40 0.80** 0.71** 0.79** 0.29* 0.21 0.33** 0.00 0.00 0.00 0.00 -0.02 -0.08 -0.01
DM -0.09 0.05 0.16 0.12 0.27* 0.18 0.86** -0.45 -0.71 -0.20 -0.31 -0.03 -0.14 0.00
FM 0.24 0.20 0.25* 0.23 0.35** 0.30* 0.89** -0.05 -0.10 -0.04 -0.05 0.00 -0.01 0.00
This table presents the Pearson – Spearman correlation results. Pearson correlation results are below the diagonal; Spearman correlations are above the diagonal. *** Represent significant results at the 0.01 level; ** Represent significant results at the 0.05 level; *Represent significant results at the 0.10 level. Variable definitions are as follows: Scorei represents a country’s IFRS implementation score, IC represents the value of a country’s Individualism/Collectivism dimension, PD is the value of a country’s Power Distance value, MF represents the value of a country’s Masculinity/Femininity dimension, and UA is the value of a country’s Uncertainty Avoidance dimension. SA represents strength of auditing and reporting standards, EC means efficacy of corporate boards, PM represents protection of minority shareholders' interests, SI represents a system’s strength of investors’ protection, RS is related to regulation of securities exchanges, DM is related to the size of the domestic market and FM to the foreign market size. CONCLUDING COMMENTS The purpose of this study is to examine the effects of culture and economic factors on a country’s decision to implement IFRS. We develop an estimation model that assigns an implementation score based on the April 2012 PwC Survey in a sample of 69 countries. We developed three regression models to examine the association between the IFRS implementation score and Hofstede’s cultural dimensions and certain economic factors obtained from the WEF report. Prior research (Ding et al., 2005; Hope et al., 2006; and Clements et al., 2010, among others) suggests that differences in culture, country size, economic and political factors may influence the adoption and implementation of IFRS. Ramanna and Sletten (2009) observe that language, economic, geographical, and political characteristics and common trade agreements influence a country’s implementation decision. Hope et al. (2006) also note that other economic factors, such as the existence of investor protection mechanisms and unlimited access to capital markets, may also have an impact on a country’s implementation decision.
43

R. J. Cardona et al | AT ♦ Vol. 6 ♦ No. 2 ♦ 2014
Initially we find that none of the cultural dimensions seem to have a significant impact on a country’s implementation decision. Our second model considers the effect of certain economic factors on a country’s implementation decision. The results obtained suggest that countries with better protection of minority shareholders' interests and a larger foreign market size are less inclined to implement IFRS. These results partially support our research hypothesis that economic factors are inversely related to the possibility of implementation. Our third model includes Hofstede’s cultural dimensions, economic factors and the implementation scores by country. The results suggest that countries that tend to be more individualistic are more inclined to implement IFRS. These results do not support our expectation that highly individualistic countries will have lower implementation scores. With respect to economic factors, the evidence obtained suggests that countries with better protection of minority shareholders' interests and a larger foreign market size are less inclined to implement IFRS. These results support our hypothesis that higher values for economic factors are inversely related to a country’s implementation score. The expected benefits from the use of alternative empirical methodology in estimating how countries implement IFRS may assist standard setters and researchers develop mechanisms to facilitate this process and should outweigh the aforementioned limitations. The decision to implement IFRS is also expected to have an indirect impact on the required disclosure of financial information by listed companies in each country. This study has several limitations. First, the grading system used to construct an implementation score represents a researcher induced bias. A second limitation is that the impact of culture was measured using only four of the six cultural dimensions developed by Hofstede because the values for the fifth and sixth cultural dimensions (long-term versus short-term orientation and indulgence versus restraint, respectively) are not available for all the countries in our study sample. In addition, the selection of the proxies used as economic factors (obtained from the WEF Report) is another element of researcher induced bias. Future research should consider other methodologies that can measure the extent to which countries have implemented IFRS. APPENDIX A PwC Survey Title: IFRS Adoption by Country PwC Survey Questions: Rules for listed filings
1. IFRS required or permitted for listed companies? 2. Version of IFRS 3. Are subsidiaries of foreign companies or foreign companies listed on local exchanges subject to
different rules? Rules for Statutory filings
4. Is IFRS or IFRS for SMEs required, permitted or prohibited for statutory filings? 5. Version of IFRS 6. In addition to local GAAP statutory financial statements, are there other regulatory financial
statement requirements that permit or require the use of IFRS? IFRS conversion plans
7. Plans for converging. Tax information
8. Type of tax regime 9. Plans for IFRS converging as the basis of tax reporting.
Note: We excluded two questions from the survey. Question 6 is related to additional regulatory financial statement requirements that permit or require the use of IFRS. This question does not provide any new information that is not otherwise included in the other survey questions. Question 8 refers to the type of
44

ACCOUNTING & TAXATION ♦ Volume 6♦ Number 2 ♦ 2014
tax regime in each country. This question was excluded because it refers to differences between books to taxable income, and not necessarily related to IFRS adoption. REFERENCES Accounting Today Staff, (2010). IFRS – Convergence or adoption? Web CPA: Tools and resources for the electronic accountant. Retrieved January 27, 2012, from http://accountingtoday.com/news/IFRS-Convergence-Adoption-55554-1.html Armstrong, C., M.E. Barth, A. Jagolinzer, & E.J. Riedl. (2010). Market reaction to the adoption of IFRS in Europe. The Accounting Review, 85: 31-61. Bova, F. & Pereira, R. (2012). The Determinants and Consequences of Heterogeneous IFRS Compliance Levels Following Mandatory IFRS Adoption: Evidence from a Developing Country. Journal of International Accounting Research, 11(1): 83-111. Callao-Gastón, S., Jarne-Jarne, J.I. & Laínez-Gadea, J.A. (2007). Adoption of IFRS in Spain: Effect on the comparability and relevance of financial reporting. [Electronic version]. Journal of International Accounting, Auditing and Taxation, 16, 148-178. Callao-Gastón, S., Ferrer-García, C., Jarne-Jarne, J.I. & Laínez-Gadea, J.A. (2010). IFRS adoption in Spain and the United Kingdom: Effects on accounting numbers and relevance. [Electronic version]. Advances in Accounting, Incorporating Advances in International Accounting, 26, 304-313. Callen, J.L., Morel, M., & Richardson, G. (2011). Do culture and religion mitigate earnings management? Evidence from a cross-country analysis. International Journal of Disclosure and Governance, 8, 2, 103-121. Campbell, D.R., Doupnik, T.S & Tsakumis, G.T. (2009). IFRS: Beyond the Standards. [Electronic version]. Journal of Accountancy, February, 34-39. Carvalho, L.N. & Salotti, B.M. (2013). Adoption of IFRS in Brazil and the Consequences to Accounting Education. Issues in Accounting Education, 28(2): 235-242. Chan, K. Lin, K. & Lai Lan Mo, P. (2003). An Empirical Study on the Impact of Culture on Audit-Detected Accounting Errors. Auditing: A Journal of Practice and Theory, 22 (2), September, 281-295. Clements, C.E., Neil, J.D. & Stovall, S.O., (2010), Cultural Diversity, Country Size, and the IFRS Adoption Decision. [Electronic version]. The Journal of Applied Business Research, 26(2), March/April, 115-126. Davis, J. & Ruhe, J. (2003). Perceptions of Country Corruption: Antecedents and Outcomes. Journal of Business Ethics, 43(4), 275-288. Ding, Y., Jeanjean, T. & Stolowy, H. (2005). Why do national GAAP differ from IAS? The role of culture. [Electronic version]. The International Journal of Accounting, 40, 325-350. Ding, Y., Jeanjean, T. & Stolowy, H. (2005). Reply to discussion of “Why do national GAAP differ from IAS? The role of culture. [Electronic version]. The International Journal of Accounting, 40, 359-362.
45

R. J. Cardona et al | AT ♦ Vol. 6 ♦ No. 2 ♦ 2014
Doupnik, T & Perera, H. (2012). International Accounting (3rd Ed.) New York; McGraw-Hill/Irwin. Evans, M., Houston, R., Peters, M & Pratt, J. (2012), The Financial Reporting Environment, Reporting Discretion, and Earnings Management: US GAAP vs. IFRS, Forgeas, R. (2008). Is IFRS That Different from U.S. GAAP? [Electronic version]. CPA Insider, June 16. Retrieved July 9, 2013, from http://www.ifrs.com/overview/General/differences.html Hans, S., Kang, T., Salter, S. & Yoo, Y.K. (2010). A cross-country study on the effects of national culture on earnings management. Journal of International Business Studies, 41, 123-141. Hofstede, G. (1980). Culture’s consequences, international differences in work-related values. Beverly Hills, CA; Sage Publications. Hofstede, G. (1983 A). The cultural relativity of organizational practices and theories. [Electronic version]. Journal of International Business Studies, 14 (2), Autumn, 75-89. Hofstede, G. (1983 B). National cultures in four dimensions. [Electronic version]. International Studies of Management & Organizations, 13(1-2), 45-74. Hofstede, G. (2001). Culture’s Consequences (2nd ed.). Thousand Oaks, CA; Sage Publications. Hofstede, G., Hofstede G.J. & Minkov M. (2010). Cultures and Organizations: Software of the Mind. 3rd Edition, McGraw-Hill USA. Hope, O.K., Jin, J. & Kang, T. (2006). Empirical evidence on jurisdictions that adopt IFRS. Journal of International Accounting Research, 5(2): 1-20. Horton, J., Serafeim, G. & Serafeim, I. (2010). Does Mandatory IFRS Adoption Improve the Information Environment? (Working Paper).Retrieved January 27, 2012, from http://ssrn.com/abstract=1264101. La Porta, R., López, F., Shleifer, A. & Vishny, R. (1997). Legal Determinants of External Finance. Journal of Finance, 52 (3), 1131-1150.
La Porta, R., López, F., Shleifer, A. & Vishny, R. (1998). Law and Finance. Journal of Political Economy, 106 (6), 1113-1155.
La Porta, R., López, F., Shleifer, A. (1999). Corporate ownership around the world. Journal of Finance, 54 (2), 471-–517.
La Porta, R., López, F., Shleifer, A. & Vishny, R. (1999a). The Quality of Government. Journal of Law, Economics and Organization, 15 (1), 222-279.
La Porta, R., López, F., Shleifer, A. & Vishny, R. (2000). Investor Protection and Corporate Governance. Journal of Financial Economics, 58 (1), 3-27.
Liu, J. & Mackinnon, A. (2002). Comparative management practices and training: China and Europe. [Electronic version]. The Journal of Management Development, 21 (2) 118-132. Nie, P., Collins, A.B. & Wang, S. (2013). China’s Progress with IFRS Convergence: Interviews with Chinese Professors, Issues in Accounting Education, 28 (2): 277-290.
46

ACCOUNTING & TAXATION ♦ Volume 6♦ Number 2 ♦ 2014
PricewaterhouseCoopers, LLP, (2012), IFRS Adoption by Country, Retrieved June 18, 2013, from http://www.pwc.com/en_US/us/issues/ifrs-reporting/publications/assets/pwc-ifrs-by-country-apr-2012.pdf Ramanna, K. & Sletten, E. (2009). Why Do Countries Adopt International Financial Reporting Standards? (Working Paper 09-012). Retrieved January 27, 2012, from http://www.hbs.edu/faculty/Publication%20Files/09-102.pdf Schipper, K. (2005). The introduction of International Accounting Standards in Europe: Implications for international convergence. European Accounting Review, 14(1), 101-126, DOI: 10.1080/0963818042000338013 Scholtens, B. & L. Dam. 2007. Cultural values and international differences in business ethics. Journal of Business Ethics 75 (3): 273-284 World Economic Forum (2011). The Global Competitiveness Report 2011-2012. Retrieved on September 7, 2012, from http://www.weforum.org/reports Yalkin, Y.K., Demir, V. & Demir, L.D., (2008). International Financial Reporting Standards (IFRS) and the development of Financial Reporting Standards in Turkey. [Electronic version]. Research in Accounting Regulation, 20, 279-294. Zeff, S.A. & Nobes, C.W. (2010). Commentary: Has Australia (or Any Other Jurisdiction) ‘Adopted’ IFRS? Australian Accounting Review, 53(20), Issue 2: 178-184. ACKNOWLEDGMENTS This study was financially supported by a summer research grant from the School of Business Administration of the University of Puerto Rico-Río Piedras. We appreciate helpful suggestions and recommendations received from the Editor and two anonymous reviewers, Aníbal Báez-Díaz, Francesco Bova, José J. Cao-Alvira, Mark C. Dawkins and Wanda Rivera-Ortiz on this version and an earlier version of this paper. BIOGRAPHY Rogelio J. Cardona, Ph.D., CPA, Esq., is an Associate Professor of Accounting at the School of Business Administration, University of Puerto Rico-Río Piedras. He can be contacted via e-mail at: [email protected], or at (787) 764-0000, ext. 3326 or 3330. Karen C. Castro-González, Ph.D., CPA, is an Assistant Professor of Accounting at the School of Business Administration, University of Puerto Rico- Río Piedras. She can be contacted via e-mail at: [email protected], or at (787) 764-0000, ext. 3326 or 3330. Carmen B. Ríos-Figueroa, Ph.D., CPA, is an Assistant Professor of Accounting at the School of Business Administration, University of Puerto Rico- Río Piedras. She can be contacted via e-mail at: [email protected], or at (787) 764-0000, ext. 3326 or 3330.
47
