the economic impact of nonprofit arts and culture
TRANSCRIPT

ECONOMICPROSPERITY
ARTS &The Economic Impact of Nonprofit
Arts and Culture Organizations and Their Audiences
IVs u m m a r y r e p o r t
B_ARTS_AEP4_Summary_cc.indd 1B_ARTS_AEP4_Summary_cc.indd 1 5/9/12 9:40 AM5/9/12 9:40 AM
Arts & Economic Prosperity IV is our fourth study of the nonprofit arts and culture industry’s impact on the economy. The most comprehensive study of its kind ever conducted, it features customized findings on 182 study regions representing all 50 states and the District of Columbia as well as estimates of economic impact nationally. Despite the economic headwinds that our country faced in 2010, the results are impressive. Nationally, the industry generated $135.2 billion of economic activity—$61.1 billion by the nation’s nonprofit arts and culture organizations in addition to $74.1 billion in event-related expen-ditures by their audiences. This economic activity supports 4.1 million full-time jobs. Our industry also generates $22.3 billion in revenue to local, state, and federal governments every year—a yield well beyond their collective $4 billion in arts allocations.
Arts and culture organizations are resilient and entrepreneurial businesses. They employ people locally, purchase goods and services from within the community, and market and promote their regions. Arts organizations are rooted locally; these are jobs that cannot be shipped overseas. Like most industries, the Great Recession left a measurable financial impact on the arts—erasing the gains made during the pre-recession years and leaving 2010 expenditures 3 percent behind the 2005 levels. The biggest effect of the recession was on attendance and audience spending. Inevitably, as people lost jobs and worried about losing their homes, arts attendance—like attendance to sports events and leisure travel—waned as well. Yet, even in a down economy, some communities saw an increase in their arts spending and employment. As the economy rebounds, the arts are well poised for growth. They are already producing new and exciting work—performances and exhibitions and festivals that entertain, inspire, and increasingly draw audiences.
Arts & Economic Prosperity IV shows that arts and culture organizations leverage additional event-related spending by their audiences that pumps revenue into the local economy. When patrons attend an arts event, they may pay for parking, eat dinner at a restaurant, shop in local retail stores, and have dessert on the way home. Based on the 151,802 audience surveys conducted for this study, the typical arts attendee spends $24.60 per person, per event, beyond the cost of admission.
Communities that draw cultural tourists experience an addi-tional boost of economic activity. Tourism industry research has repeatedly demonstrated that arts tourists stay longer and spend more than the average traveler. Arts & Economic Prosperity IV reflects those findings: 32 percent of attendees live outside the county in which the arts event took place, and their event-related spending is more than twice that of their local counterparts (nonlocal: $39.96 vs. local: $17.42). The message is clear: a vibrant arts community not only keeps residents and their discretionary spending close to home, but it also attracts visitors who spend money and help local businesses thrive.
Arts & Economic Prosperity IV demonstrates that America’s arts industry is not only resilient in times of economic uncertainty, but is also a key component to our nation’s economic recovery and future prosperity. Business and elected leaders need not feel that a choice must be made between arts funding and economic prosperity. This study proves that they can choose both. Nationally as well as locally, the arts mean business.
The Arts Mean Businessby americans for the arts president & ceo robert l. lynch
America’s artists and arts organizations live and work in every community coast-to-coast—fueling
creativity, beautifying our cities, and improving our quality of life. In my travels across the country,
business and government leaders often talk to me about the challenges of funding the arts amid
shrinking resources and alongside other pressing needs. They worry about jobs and the economy.
Is their region a magnet for attracting and retaining a skilled and innovative workforce? How well
are they competing in the high-stakes race to attract new businesses? The findings from Arts &
Economic Prosperity IV send a clear and welcome message: leaders who care about community
and economic vitality can feel good about choosing to invest in the arts.
©Americans for the Arts • Arts & Economic Prosperity is a registered trademark • page 2
B_ARTS_AEP4_Summary_cc.indd 2B_ARTS_AEP4_Summary_cc.indd 2 5/14/12 11:59 AM5/14/12 11:59 AM

economic impact of the nonprofit arts & culture industry (2010)
A R E A O F I M PA C T O R G A N I Z AT I O N S A U D I E N C E S TOTA L
TOTA L D I R E C T E X P E N D I T U R E S $61.12 BIL $74.08 BIL $135.20 BIL
F U L L - T I M E E Q U I VA L E N T J O B S 2.24 MIL 1.89 MIL 4.13 MIL
R E S I D E N T H O U S E H O L D I N C O M E $47.53 BIL $39.15 BIL $86.68 BIL
L O C A L G O V E R N M E N T R E V E N U E $2.24 BIL $3.83 BIL $6.07 BIL
STAT E G O V E R N M E N T R E V E N U E $2.75 BIL $3.92 BIL $6.67 BIL
F E D E R A L I N C O M E TA X R E V E N U E $5.26 BIL $4.33 BIL $9.59 BIL
+
+
+
+
+
+
=
=
=
=
=
=
organizations In 2010, nonprofit arts and culture organizations pumped an
estimated $61.1 billion into the economy. Nonprofit arts and
culture organizations are employers, producers, consumers,
and key promoters of their cities and regions. Most of all,
they are valuable contributors to the business community.
audiencesDinner and a show go hand-in-hand. Attendance at arts
events generates income for local businesses—restaurants,
parking garages, hotels, retail stores. An average arts
attendee spends $24.60 per event in addition to the cost
of admission. On the national level, these audiences pro-
vided $74.1 billion of valuable revenue for local merchants
and their communities. In addition, data shows nonlocal
attendees spend twice as much as local attendees ($39.96
vs. $17.42), demonstrating that when a community attracts
cultural tourists, it harnesses significant economic rewards.
average per person audience expenditures: $24.60
$
$1.31CLOTHING &
ACCESSORIES
$0.36CHILD CARE
$0.89OTHER
$2.74GIFT/SOUVENIRS
$2.65LOCAL GROUND
TRANSPORTATION
$3.51OVERNIGHT
LODGING
$13.14MEALS, SNACKS,& REFRESHMENTS
Americans for the Arts • Arts & Economic Prosperity IV • page 3
B_ARTS_AEP4_Summary_cc.indd 3B_ARTS_AEP4_Summary_cc.indd 3 5/9/12 9:40 AM5/9/12 9:40 AM

Nonprofit arts and culture organizations pay their employ-
ees, purchase supplies, contract for services, and acquire
assets from within their communities. Their audiences
generate event-related spending for local merchants such
as restaurants, retail stores, hotels, and parking garages.
This study sends an important message to community
leaders: support for the arts is an investment in
economic well-being as well as quality of life.
Nationally, the nonprofit arts and culture industry
generates $135.2 billion in economic activity every year—
$61.1 billion in spending by organizations and an addi-
tional $74.1 billion in event-related spending by their
audiences. The impact of this activity is significant;
these dollars support 4.1 million U.S. jobs and generate
$22.3 billion in government revenue.
Arts & Economic Prosperity IV is the most comprehensive
study of the nonprofit arts and culture industry ever
conducted. It documents the economic impact of the
nonprofit arts and culture industry in 182 communities
and regions (139 cities and counties, 31 multi-county or
multi-city regions, 10 states,
and two arts districts), rep-
resenting all 50 states and
the District of Columbia.
The diverse communities
range in population from
1,600 to 4 million and from
small rural to large urban.
Researchers collected
detailed expenditure and
attendance data from 9,721
nonprofit arts and culture
Economic Impact of America’s Nonprofit Arts & Culture Industry
Every day, more than 100,000 nonprofit arts and culture organizations populate America’s
cities and towns and make their communities more desirable places to live and work.
They provide inspiration and enjoyment to residents, beautify shared public spaces, and
strengthen the social fabric of our communities. This study demonstrates that the nonprofit
arts and culture industry is also an economic driver—an industry that supports jobs,
generates government revenue, and is the cornerstone of our tourism industry.
economic impact of the nonprofit arts & culture industry (2010)(Combined spending by both nonprofit arts and culture organizations AND their audiences)
TOTA L D I R E C T E X P E N D I T U R E S $135.2 BIL
F U L L - T I M E E Q U I VA L E N T J O B S 4.13 MIL
R E S I D E N T H O U S E H O L D I N C O M E $86.68 BIL
L O C A L G O V E R N M E N T R E V E N U E $6.07 BIL
STAT E G O V E R N M E N T R E V E N U E $6.67 BIL
F E D E R A L I N C O M E TA X R E V E N U E $9.59 BIL
Americans for the Arts • Arts & Economic Prosperity IV • page 4
B_ARTS_AEP4_Summary_cc.indd 4B_ARTS_AEP4_Summary_cc.indd 4 5/9/12 9:40 AM5/9/12 9:40 AM

organizations and 151,802 of their attendees to measure
total industry spending. Project economists from the
Georgia Institute of Technology customized input-output
analysis models for each study region to provide specific
and reliable economic impact data. This study uses four
economic measures to define economic impact: full-time
equivalent jobs, resident household income, and revenue
to local and state government.
• Full-Time Equivalent (FTE) Jobs describe the total
amount of labor employed. Economists measure FTE
jobs, not the total number of employees, because it is
a more accurate measure that accounts for part-time
employment.
• Resident Household Income (often called Personal
Income) includes salaries, wages, and entrepreneurial
income paid to local residents. It is the money residents
earn and use to pay for food, mortgages, and other
living expenses.
• Revenue to Local and State Government includes
revenue from taxes (income, property, or sales) as well
as funds from license fees, utility fees, filing fees, and
other similar sources.
The Arts & Economic Prosperity IV study focuses on
nonprofit arts and culture organizations and their audi-
ences, but takes an inclusive approach that accounts
for the uniqueness of different localities. These include
government-owned and government-operated cultural
facilities and institutions, municipal arts agencies, private
community arts organizations, unincorporated arts
groups, living collections (such as zoos, aquariums and
botanical gardens), university presenters, and arts programs
that are embedded under the umbrella of a non-arts
organization or facility (such as a community center
or church). The study excludes spending by individual
artists and the for-profit arts and entertainment sector
(e.g., Broadway or the motion picture industry).
Americans for the Arts 2011 Public Art Network Year in Review selection Portland Acupuncture Project by Adam Kuby in Portland, OR
B_ARTS_AEP4_Summary_cc.indd 5B_ARTS_AEP4_Summary_cc.indd 5 5/14/12 12:00 PM5/14/12 12:00 PM

Arts & Economic Prosperity III was completed in 2005,
and while study-to-study comparisons should be made
cautiously, it is clear that the same economic headwinds
that affected all industries in 2010 also impacted the
nonprofit arts. Between 2005–2010, unemployment rose
from 5.1 percent to 9.7 percent. Consumer confidence
dropped from 101 to 54. Home foreclosures tripled to 2.9
million. As people lost their jobs and houses, arts atten-
dance—like tourism, attendance to sporting events, and
leisure travel—declined as well.
Like most industries, the Great Recession left a measurable
financial impact on the arts—erasing the gains made
during the pre-recession years and leaving 2010 organiza-
tional expenditures 3 percent behind their 2005 levels. The
more noticeable decrease was in total audience spending.
Both the 2010 and 2005 studies boast large and reliable
survey samples. The 94,478 audience surveys collected for
the 2005 study showed an average event-related expenditure
of $27.79, per person per event, not including the cost of
admission. The 151,802 audience surveys conducted for this
report showed an 11 percent decrease to $24.60 (-21 percent
when adjusted for inflation). Compounding that drop was
a decrease in the share of nonlocal attendees. In 2005, 39
percent of attendees were nonlocal, versus 32 percent for
this study. Finally, average per person spending declined for
both locals ($19.53 in 2005 vs. $17.42 in 2010) as well as for
nonlocals ($40.19 in 2005 vs. $39.96 on 2010). Thus, not only
was there a decrease in the share of nonlocal arts attend-
ees—both groups also spent less per person, per event.
The Arts in the Great Recession
economic impact of the nonprofit arts & culture industry
O R G A N I Z AT I O N E X P E N D I T U R E S A U D I E N C E E X P E N D I T U R E S
$61.1 BIL
$74.1 BIL
$63.1 BIL
$103.1 BIL
2005
2010
B_ARTS_AEP4_Summary_cc.indd 6B_ARTS_AEP4_Summary_cc.indd 6 5/9/12 9:40 AM5/9/12 9:40 AM

Direct & Indirect Economic Impact: How a Dollar Is Represented in a Community
Arts & Economic Prosperity IV uses a sophisticated
economic analysis called input-output analysis
to measure economic impact. It is a system of
mathematical equations that combines statistical
methods and economic theory. Input-output analy-
sis enables economists to track how many times a
dollar is “re-spent” within the local economy, and
the economic impact generated by each round of
spending. How can a dollar be re-spent? Consider
the following example:
A theater company purchases a gallon of paint
from the local hardware store for $20, generating
the direct economic impact of the expenditure. The
hardware store then uses a portion of the afore-
mentioned $20 to pay the sales clerk’s salary; the
sales clerk re-spends some of the money for groceries;
the grocery store uses some of the money to pay its
cashier; the cashier then spends some for the utility
bill; and so on. The subsequent rounds of spending
are the indirect economic impacts.
Thus, the initial expenditure by the theater
company was followed by four additional rounds
of spending (by the hardware store, sales clerk,
grocery store, and the cashier).
• The effect of the theater company’s initial
expenditure is the direct economic impact.
• The subsequent rounds of spending are all
of the indirect economic impacts.
• The total economic impact is the sum of all
of the direct and indirect impacts.
Note: Interestingly, a dollar “ripples” very differently
through each community, which is why each study
region has its own customized economic model.
sn
ap
sh
ot
B_ARTS_AEP4_Summary_cc.indd 7B_ARTS_AEP4_Summary_cc.indd 7 5/14/12 1:06 PM5/14/12 1:06 PM
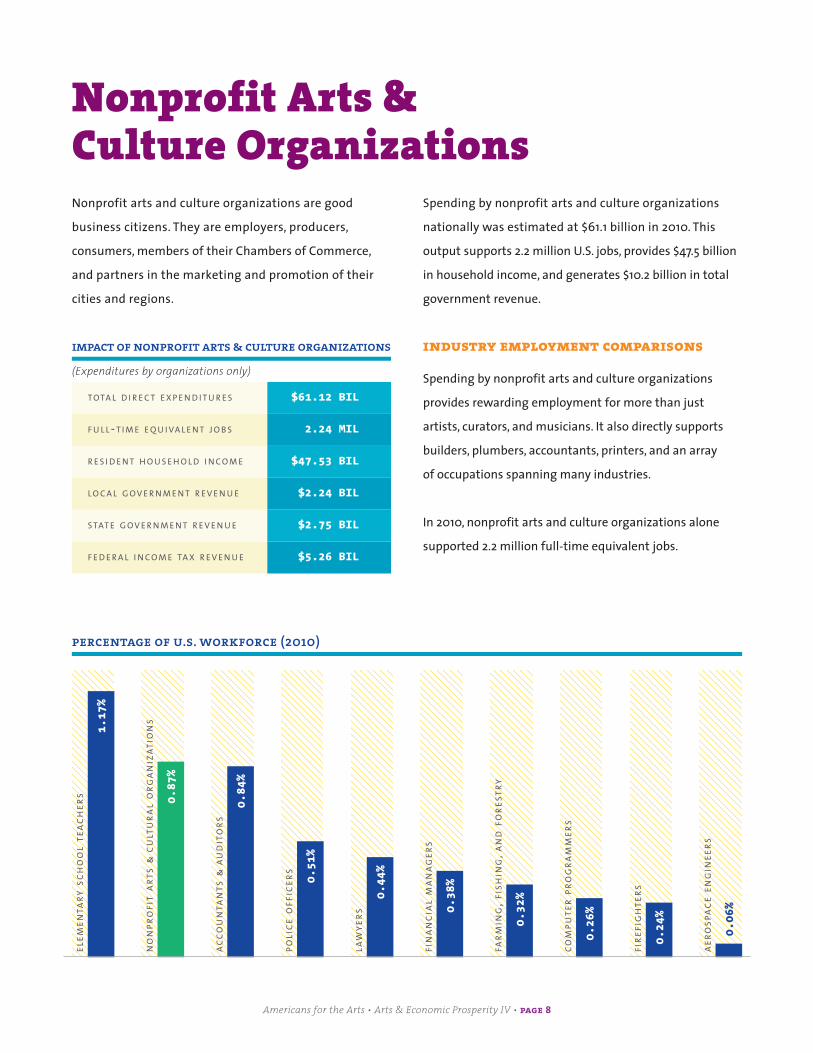
Nonprofit arts and culture organizations are good
business citizens. They are employers, producers,
consumers, members of their Chambers of Commerce,
and partners in the marketing and promotion of their
cities and regions.
Spending by nonprofit arts and culture organizations
nationally was estimated at $61.1 billion in 2010. This
output supports 2.2 million U.S. jobs, provides $47.5 billion
in household income, and generates $10.2 billion in total
government revenue.
industry employment comparisons
Spending by nonprofit arts and culture organizations
provides rewarding employment for more than just
artists, curators, and musicians. It also directly supports
builders, plumbers, accountants, printers, and an array
of occupations spanning many industries.
In 2010, nonprofit arts and culture organizations alone
supported 2.2 million full-time equivalent jobs.
Nonprofit Arts & Culture Organizations
1.17%
ELEM
ENTA
RY S
CH
OO
L TE
AC
HER
S 0.87%
NO
NPR
OFI
T A
RTS
& C
ULT
UR
AL
OR
GA
NIZ
ATI
ON
S
0.84%
AC
CO
UN
TAN
TS &
AU
DIT
OR
S
0.51%
POLI
CE
OFF
ICER
S
0.44%
LAW
YER
S 0.38%
FIN
AN
CIA
L M
AN
AG
ERS
0.32%
FAR
MIN
G, F
ISH
ING
, AN
D F
OR
ESTR
Y
0.26%
CO
MPU
TER
PR
OG
RA
MM
ERS
0.24%
FIR
EFIG
HTE
RS
0.06%
AER
OSP
AC
E EN
GIN
EER
S
percentage of u.s. workforce (2010)
impact of nonprofit arts & culture organizations
(Expenditures by organizations only)
TOTA L D I R E C T E X P E N D I T U R E S $61.12 BIL
F U L L - T I M E E Q U I VA L E N T J O B S 2.24 MIL
R E S I D E N T H O U S E H O L D I N C O M E $47.53 BIL
L O C A L G O V E R N M E N T R E V E N U E $2.24 BIL
STAT E G O V E R N M E N T R E V E N U E $2.75 BIL
F E D E R A L I N C O M E TA X R E V E N U E $5.26 BIL
Americans for the Arts • Arts & Economic Prosperity IV • page 8
B_ARTS_AEP4_Summary_cc.indd 8B_ARTS_AEP4_Summary_cc.indd 8 5/9/12 9:40 AM5/9/12 9:40 AM

Americans for the Arts 2011 Public Art Network Year in Review selection Wildgarden/Talking Fence by Ladies Fancy Work Society in Denver, CO
Of this total, 1.1 million jobs were a result of “direct”
expenditures by nonprofit arts organizations, represent-
ing 0.87 percent of the U.S. workforce. Compared to the
size of other sectors of the U.S. workforce, this figure is
significant. Nonprofit arts and culture organizations
support more U.S. jobs than there are accountants and
auditors, public safety officers, and even lawyers.
a labor-intensive industry
Dollars spent on human resources typically stay within
a community longer, thereby having a greater local
economic impact. The chart below demonstrates the
highly labor-intensive nature of the arts and culture
industry. Nearly half (48.4 percent) of the typical organi-
zation’s expenditures are for artists and personnel costs.
arts volunteerism
While arts volunteers may not have an economic impact
as defined in this study, they clearly have an enormous
impact on their communities by helping arts and culture
organizations function as a viable industry.
• The average city and county in the study had 5,215 arts
volunteers who donated 201,719 hours to nonprofit arts and
culture organizations, a donation valued at $4.3 million.
• The participating organizations had an average of 116.2
volunteers who volunteered an average of 44.8 hours
each, for a total of 5,204 hours per organization.
The Independent Sector places the value of the average 2010 volunteer hour at $21.36.
value of in-kind contributions
The organizations that participated in this study provided
data about their in-kind support (e.g., donated assets, office
space, airfare, or advertising space). Sixty-five percent of
the participating organizations received in-kind support,
averaging $55,467 each during the 2010 fiscal year.
expenditures by nonprofit arts & culture organizations
%40.6%PAYROLL/PERSONNEL
6.6%FACILITY EXPENSES
7.5%CAPITAL EXPENDITURES/ASSET ACQUISITION
7.8%PAYMENTS
TO/FOR ARTISTS
37.5%PROGRAMMATIC
EXPENSES/ADMINISTRATIVE
OVERHEAD
Americans for the Arts • Arts & Economic Prosperity IV • page 9
B_ARTS_AEP4_Summary_cc.indd 9B_ARTS_AEP4_Summary_cc.indd 9 5/9/12 9:40 AM5/9/12 9:40 AM

The arts and culture industry, unlike most industries, lever-
ages a significant amount of event-related spending by its
audiences. For example, a patron attending an arts event
may pay to park the car in a garage, purchase dinner at a
restaurant, eat dessert after the show, and return home
to pay the babysitter. This generates related commerce
for local businesses such as restaurants, parking garages,
hotels, and retail stores.
Total event-related spending by nonprofit arts and culture
audiences was an estimated $74.1 billion in 2010. This
spending supports 1.9 million full-time equivalent jobs
in the United States, provides $39.2 billion in household
income, and generates $12.1 billion in government revenue.
Nationally, the typical attendee spends an average of
$24.60 per person, per event, in addition to the cost of
admission. Businesses that cater to arts and culture
audiences reap the rewards of this economic activity.
local vs. nonlocal audiences
In addition to spending data, researchers asked each of
the 151,802 survey respondents to provide his/her home
ZIP code. Analysis of this data enabled a comparison of
event-related spending by local and nonlocal attendees.
Previous economic and tourism research has shown that
nonlocal attendees spend more than their local counter-
parts. This study reflects those findings.
Nonprofit Arts & Culture Audiences
impact of nonprofit arts & culture audiences(expenditures by attendees to arts events only)
TOTA L D I R E C T E X P E N D I T U R E S $74.08 BIL
F U L L - T I M E E Q U I VA L E N T J O B S 1.89 MIL
R E S I D E N T H O U S E H O L D I N C O M E $39.15 BIL
L O C A L G O V E R N M E N T R E V E N U E $3.83 BIL
STAT E G O V E R N M E N T R E V E N U E $3.92 BIL
F E D E R A L I N C O M E TA X R E V E N U E $4.33 BIL
average per person audience expenditures: $24.60
$
$1.31CLOTHING &
ACCESSORIES
$0.36CHILD CARE
$0.89OTHER
$2.74GIFT/SOUVENIRS
$2.65LOCAL GROUND
TRANSPORTATION
$3.51OVERNIGHT
LODGING
$13.14MEALS, SNACKS,& REFRESHMENTS
Americans for the Arts • Arts & Economic Prosperity IV • page 10
B_ARTS_AEP4_Summary_cc.indd 10B_ARTS_AEP4_Summary_cc.indd 10 5/14/12 12:03 PM5/14/12 12:03 PM

While the ratio of local to nonlocal attendees is different
in every community, the national sample revealed that
31.8 percent of attendees traveled from outside of the
county in which the event took place (nonlocal) and 68.2
of attendees percent were local (resided inside the county).
Local attendees spent an average of $17.42 per
person, per event in addition to the cost of admission.
Nonlocal attendees spent twice this amount, or
$39.96 per person.
*Why exclude the cost of admission? The admissions paid by attendees are excluded from this analysis because those dollars are captured in the operating budgets of the nonprofit arts and culture organizations, and, in turn, are spent by the organization. This methodology avoids “double-counting” those dollars in the study analysis.
E V E N T - R E L AT E D S P E N D I N G L O C A L AT T E N D E E S N O N L O C A L AT T E N D E E S AV E R A G E AT T E N D E E S
M E A L S , S N A C K S , & R E F R E S H M E N T S $11.16 $17.39 $13.14
L O D G I N G (O N E N I G H T O N LY ) $0.29 $10.39 $3.51
G I F T S /S O U V E N I R S $2.25 $3.78 $2.74
G R O U N D T R A N S P O R TAT I O N $1.63 $4.83 $2.65
C L OT H I N G & A C C E S S O R I E S $1.16 $1.62 $1.31
C H I L D C A R E $0.35 $0.38 $0.36
OT H E R /M I S C E L L A N E O U S $0.58 $1.57 $0.89
TOTA L (P E R P E R S O N , P E R E V E N T ) $17.42 $39.96 $24.60
average event-related spending(Expenditures made specifically as a result of attending a cultural event—excludes admission cost*)
local vs. nonlocal audiences
2010
$17.42
$39.96
L O C A L A U D I E N C E S N O N L O C A L A U D I E N C E S
%
31.8%NON-RESIDENTS
68.2%LOCALRESIDENTS
event-related spending by local vs. nonlocal audiences
Nonprofit Arts & Culture Audiences Spend $24.60 Per Person, Per Event
Americans for the Arts • Arts & Economic Prosperity IV • page 11
B_ARTS_AEP4_Summary_cc.indd 11B_ARTS_AEP4_Summary_cc.indd 11 5/14/12 12:03 PM5/14/12 12:03 PM

Nationally, 59.4 percent of all nonlocal arts attendees
reported that the primary reason for their trip is
“specifically to attend this arts/culture event.”
In addition, 28.5 percent of nonlocal arts attendees report
that they spent at least one night away from home in
the community where the cultural event took place.
Not surprisingly, the nonlocal attendees who reported
any overnight lodging expenses spent more money
during their visit, an average of $170.58 per person, per
event (four times more than the national nonlocal arts
attendee average of $39.96). In fact, nonlocal attendees
who reported overnight lodging expenses spent more
per person, per event in every expenditure category (e.g.,
food, gifts and souvenirs, ground transportation, etc.) than
nonlocals who did not stay overnight in paid lodging.
For this analysis, only one night of lodging expenses is
counted toward the audience expenditure analysis.
cultural events attract new dollars and retain local dollars
Nearly one-half of local cultural attendees (41.9 percent) say
that if the cultural event or exhibit during which they were
surveyed were not happening, they would have traveled
to a different community in order to attend a similar
cultural experience. More than half of nonlocal attendees
(52.4 percent) reported the same. These figures demonstrate
the economic impact of the nonprofit arts and culture in
its truest sense. If a community fails to provide a variety
of artistic and cultural experiences, it will not attract the
new dollars of cultural tourists. It will also lose discretionary
spending by local residents traveling elsewhere for an
arts experience. When a community attracts nonlocal arts
attendees and other cultural tourists, it harnesses signifi-
cant economic rewards.
E V E N T - R E L AT E D S P E N D I N GW I T H O V E R N I G H T
L O D G I N G E X P E N S E SW I T H O U T O V E R N I G H T
L O D G I N G E X P E N S E SAV E R A G E N O N L O C A L
AT T E N D E E S
M E A L S , S N A C K S , & R E F R E S H M E N T S $41.81 $14.41 $17.39
L O D G I N G (O N E N I G H T O N LY ) $95.49 $0.00 $10.39
G I F T S /S O U V E N I R S $10.72 $2.94 $3.78
G R O U N D T R A N S P O R TAT I O N $14.11 $3.70 $4.83
C L OT H I N G & A C C E S S O R I E S $4.66 $1.25 $1.62
C H I L D C A R E $0.72 $0.34 $0.38
OT H E R /M I S C E L L A N E O U S $3.07 $1.38 $1.57
TOTA L (P E R P E R S O N , P E R E V E N T ) $170.58 $24.02 $39.96
nonlocal cultural audiences with overnight lodging expenses (28.5 percent) spend the most(Expenditures made specifically as a result of attending a cultural event)
non-resident primary reason for trip
%59.4%SPECIFICALLY TO ATTEND THIS ARTS/CULTURE EVENT
23.7%VACATION/
HOLIDAY
7.0%VISIT FRIENDS/
RELATIVES
5.6%OTHER/MISC.
4.3%WORK/BUSINESS
Americans for the Arts • Arts & Economic Prosperity IV • page 12
B_ARTS_AEP4_Summary_cc.indd 12B_ARTS_AEP4_Summary_cc.indd 12 5/14/12 12:03 PM5/14/12 12:03 PM

Arts and Culture Tourists Spend More and Stay Longer
participation in the arts
One-half of cultural attendees (50.1 percent) actively
participate in the creation of the arts (e.g., sing in a
choir, act in a play, paint or draw).
survey: how far will you go for a cultural experience?(“If this event or exhibit were not happening, would you have traveled to another community to attend a similar cultural experience?”)
L O C A L AT T E N D E E S N O N L O C A L AT T E N D E E S A L L C U LT U R A L AT T E N D E E S
N O , I W O U L D H AV E S K I P P E D T H E C U LT U R A L E X P E R I E N C E A LTO G E T H E R 30.5% 27.0% 29.4%
N O , I W O U L D H AV E R E P L A C E D I T W I T H A N OT H E R N E A R B Y C U LT U R A L E X P E R I E N C E 27.5% 20.6% 25.4%
Y E S , I W O U L D H AV E T R AV E L E D TO A D I F F E R E N T C O M M U N I T Y 41.9% 52.4% 45.2%
As communities compete for a tourist’s dollar, arts and culture have proven to be magnets for travelers and their money. Local businesses are able to grow because travelers extend the length of their trips to attend cultural events. Travelers who include arts and culture events in their trips differ from other U.S. travelers in a number of ways. Arts and culture travelers:
• Spend more than other travelers.
• Are more likely to stay in overnight lodging.
• Are more likely to spend $1,000 or more during their stay.
• Travel longer than other travelers.
Two-thirds of American adult travelers say they included a cultural, artistic, heritage, or historic activity or event while on a trip of 50 miles or more, one-way, in 2001. This equates to 92.7 mil-lion cultural travelers. Of this group, 32 percent
(29.6 million travelers) added extra time to their trip because of a cultural, artistic, heritage, or his-toric or event. Of those who extended their trip, 57 percent did so by one or more nights.
U.S. cultural destinations help grow the U.S. economy by attracting foreign visitor spending. There has been steady growth in the percentage of tourists who fly to the United States and attend arts activities as a part of their visit, according to International Trade Commission in the Department of Commerce. Arts destinations help grow the economy by attracting foreign visitor spending—effectively making the arts an export industry.
Marketing of cultural destinations and events accounts for the largest portion of all marketing expenditures (26 percent) by national tourism organizations.
Source: U.S. Travel Association; U.S. Department of Commerce.
sn
ap
sh
ot
Americans for the Arts • Arts & Economic Prosperity IV • page 13
B_ARTS_AEP4_Summary_cc.indd 13B_ARTS_AEP4_Summary_cc.indd 13 5/14/12 1:09 PM5/14/12 1:09 PM

ConclusionNonprofit arts and culture organizations in the United
States drive a $135.2 billion industry—an industry that sup-
ports 4.1 million full-time equivalent jobs and generates
$22.3 billion in government revenue annually. Arts and
culture organizations—businesses in their own right—
leverage significant event-related spending by their audi-
ences that pumps vital revenue into restaurants, hotels,
retail stores, parking garages, and other local merchants.
This study puts to rest a common misconception that
communities support arts and culture at the expense of
local economic development. In fact, communities are
investing in an industry that supports jobs, generates
government revenue, and is the cornerstone of tourism.
This report shows conclusively that, locally as well as
nationally, the arts mean business.
learn more about arts & economic prosperity iv
Visit www.AmericansForTheArts.org/EconomicImpactto access free resources you can use to help make the economic case for arts funding and arts-friendly policies in your community:
• A downloadable and customizable PowerPoint presentation that effectively communicates this study’s findings
• Arts & Economic Prosperity IV Highlights Pamphlet
• Arts & Economic Prosperity IV Summary Report
• Arts & Economic Prosperity IV National Report, complete with national and local findings, back-ground, scope, and methodology
• A press release announcing the study results
• Sample opinion-editorials (op-eds)
• The Arts & Economic Prosperity Calculator that enables users to estimate the economic impact of their organization
Americans for the Arts 2011 Public Art Network Year in Review selection Hands by Christian Moeller in San Jose, CA
B_ARTS_AEP4_Summary_cc.indd 14B_ARTS_AEP4_Summary_cc.indd 14 5/9/12 9:40 AM5/9/12 9:40 AM

About This StudyAmericans for the Arts conducted Arts & Economic
Prosperity IV to document the economic impact of the
nation’s nonprofit arts and culture industry. The study
focuses on nonprofit arts and culture organizations
and their audiences. It excludes spending by individual
artists and the for-profit arts and entertainment sector
(e.g., Broadway or the motion picture industry). Detailed
expenditure data was collected from 9,721 arts and culture
organizations and 151,802 of their attendees. Project econ-
omists from the Georgia Institute of Technology customized
input-output analysis models for each study region to
provide specific and reliable economic impact data about
the nonprofit arts and culture industries, specifically full-
time equivalent jobs, household income, and local and
state government revenue. This allows for the uniqueness
of each local economy to be reflected in the findings.
studying economic impact using input-output analysis
To derive the most reliable economic impact data, input-
output analysis was used to measure the impact of expen-
ditures by nonprofit arts and culture organizations and
their audiences. This is a highly regarded type of economic
analysis that has been the basis for two Nobel Prizes in
economics. The models are systems of mathematical
equations that combine statistical methods and economic
theory in an area of study called econometrics. The analysis
traces how many times a dollar is re-spent within the local
economy before it leaves the community, and it quantifies
the economic impact of each round of spending.
Project economists customized an input-output model
for each of the 182 participating study regions based on
the local dollar flow between 533 finely detailed industries
within its economy. This was accomplished by using
detailed data on employment, incomes, and government
revenues provided by the U.S. Department of Commerce,
local tax data, as well as the survey data from the
responding nonprofit arts and culture organizations
and their audiences.
calculation of the national estimates
To derive the national estimates, the 139 city and county
study participants only—multi-city and multi-county
regions, states, and individual arts districts are excluded
from this analysis—were first stratified into six population
groups, and an economic impact average was calculated
for each group. Second, the nation’s largest 13,366 cities
were assigned to one of the six groups based on their
population, as supplied by the U.S. Census Bureau. Third,
each of the 13,366 largest cities was assigned the eco-
nomic impact average for its population group. Finally, the
values of the cities were added together to determine the
national economic impact findings. Several outlier regions
were removed when calculating the national estimates
due to their comparably high levels of economic activity
in their population categories.
Americans for the Arts • Arts & Economic Prosperity IV • page 15
B_ARTS_AEP4_Summary_cc.indd 15B_ARTS_AEP4_Summary_cc.indd 15 5/14/12 12:04 PM5/14/12 12:04 PM

About Local & Regional Study PartnersThe 182 study regions include 139 individual cities and
counties, 31 multi-city or multi-county regions, 10 states,
and two arts districts. They represent all 50 U.S. states and
the District of Columbia. The diverse communities range
in population from 1,600 to 4 million and from small rural
to large urban. The research partners agreed to complete
four participation criteria: 1) identify and code the com-
prehensive universe of nonprofit arts and culture orga-
nizations located in their study region; 2) assist with the
collection of detailed financial and attendance informa-
tion from those organizations and review the information
for accuracy; 3) conduct audience-intercept surveys at a
broad, representative sample of cultural events that take
place in their study region; and 4) pay a modest cost-
sharing fee. No community was refused participation
for an inability to pay.
data from organizations
To collect the required financial and attendance informa-
tion from eligible organizations, researchers implemented
a multi-pronged data collection process.
In 131 of the 182 study regions, researchers used a web-
based organizational expenditure survey instrument
designed to collect detailed information about each
organization’s fiscal year that ended during 2010. The
remaining 51 study regions are located in one of 10 states
(Arizona, California, Illinois, Maryland, Massachusetts,
Michigan, New York, Ohio, Pennsylvania, and Rhode
Island), each of which participated in the Cultural Data
Project (CDP) during fiscal year 2010. The CDP is a unique
system that enables arts and culture organizations to
enter financial, programmatic, and operational data into
a standardized online form. The primary data collection
efforts were supplemented with an abbreviated one-page
version of the survey which requested category totals only
(rather than detailed, itemized financial information). In
order to increase the overall response rates, all 182 study
communities distributed the abbreviated one-page survey
to eligible organizations that declined to participate in
either the full organizational expenditure survey or the
Cultural Data Project.
Using all three methods of data capture, information was
collected from a total of 9,721 organizations for this study.
Response rates among all eligible organizations located
in the 182 study regions averaged 43.2 percent and ranged
from 5.3 percent to 100 percent. Responding organiza-
tions had budgets ranging from as low as $0 to as high
as $239.7 million. It is important to note that each study
region’s results are based solely on the actual survey data
collected. There are no estimates made to account for non-
respondents. Therefore, the less-than-100 percent response
rates suggest an understatement of the economic impact
findings in most of the individual study regions.
data from audiences
Audience-intercept surveying, a common and accepted
research method, was completed in all 182 study regions
in order to capture information about spending by audi-
ences at nonprofit arts and culture events. Patrons were
asked to complete a short survey while attending an
event. A total of 151,802 attendees completed the survey.
The randomly selected respondents provided itemized
Americans for the Arts • Arts & Economic Prosperity IV • page 16
B_ARTS_AEP4_Summary_cc.indd 16B_ARTS_AEP4_Summary_cc.indd 16 5/14/12 12:04 PM5/14/12 12:04 PM
travel party expenditure data on attendance-related
activities such as meals, souvenirs, transportation, and
lodging. Data was collected throughout the year to guard
against seasonal spikes or drop-offs in attendance as well
as at a broad range of events—a night at the opera will
typically yield more spending than a Saturday children’s
theater production, for example. Using total attendance
data for 2010 collected from the participating eligible
organizations, standard statistical methods were then
used to derive a reliable estimate of total expenditures
by attendees in each community. The survey respondents
provided information about the entire party with whom
they were attending the event. With an average travel
party size of 2.69 people, this data actually represents the
spending patterns of more than 408,000 attendees.
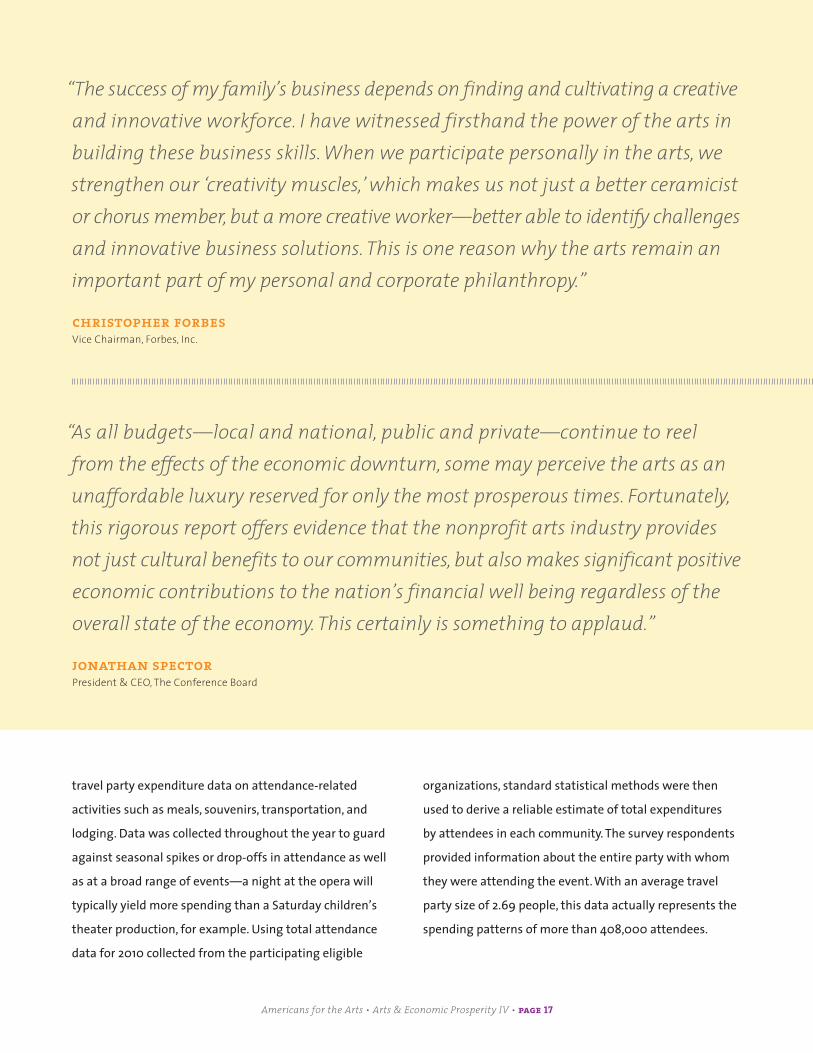
“The success of my family’s business depends on finding and cultivating a creative and innovative workforce. I have witnessed firsthand the power of the arts in building these business skills. When we participate personally in the arts, we strengthen our ‘creativity muscles,’ which makes us not just a better ceramicist or chorus member, but a more creative worker—better able to identify challenges and innovative business solutions. This is one reason why the arts remain an important part of my personal and corporate philanthropy.”
christopher forbesVice Chairman, Forbes, Inc.
“As all budgets—local and national, public and private—continue to reel from the effects of the economic downturn, some may perceive the arts as an unaffordable luxury reserved for only the most prosperous times. Fortunately, this rigorous report offers evidence that the nonprofit arts industry provides not just cultural benefits to our communities, but also makes significant positive economic contributions to the nation’s financial well being regardless of the overall state of the economy. This certainly is something to applaud.”
jonathan spectorPresident & CEO, The Conference Board
Americans for the Arts • Arts & Economic Prosperity IV • page 17
B_ARTS_AEP4_Summary_cc.indd 17B_ARTS_AEP4_Summary_cc.indd 17 5/9/12 9:40 AM5/9/12 9:40 AM

alabamaCultural Alliance of Greater Birmingham
alaskaFairbanks Arts AssociationJuneau Arts & Humanities CouncilKetchikan Area Arts and Humanities Council
arizonaFlagstaff Cultural PartnersMesa Arts CenterPhoenix Office of Arts and CultureTucson Pima Arts CouncilWest Valley Arts Council
arkansasWalton Arts Center
californiaArtPulseArts Council Silicon ValleyCity of Glendale Cultural Affairs DivisionCity of Los Angeles Department of Cultural AffairsCity of Oakland Cultural Arts & Marketing DepartmentCity of San Diego Commission for Arts and CultureCity of Santa Clarita Arts & Events OfficeCity of Walnut Creek Arts, Recreation, and Community Services DepartmentCity of West HollywoodLaguna Beach Arts CommissionRiverside Arts CouncilSacramento Metropolitan Arts CommissionSan Francisco Arts CommissionSan Jose Office of Cultural AffairsSanta Barbara County Arts Commission
coloradoBeet StreetBoulder Arts CommissionCenter for the ArtsCommunity Concert Hall at Ft. Lewis CollegeCultural Office of the Pikes Peak Region (COPPeR)Telluride Council for the Arts and Humanities
connecticutConnecticut Commission on Culture and Tourism
Cultural Alliance of Fairfield CountyGreater Hartford Arts Council
delawareDelaware Division of the Arts
district of columbiaCultural Alliance of Greater WashingtonDC Commission on the Arts and Humanities
floridaArts and Cultural Alliance of Sarasota CountyBroward County Cultural DivisionCity of Gainesville Cultural Affairs DivisionCity of OrlandoCity of Winter ParkCultural Council of Palm Beach CountyLee County Alliance for the ArtsMiami-Dade County Department of Cultural AffairsOrange County Arts & Cultural AffairsOsceola Center for the ArtsPolk Arts AllianceSeminole Cultural Arts CouncilUnited Arts of Central FloridaVolusia County Parks, Recreation, and Culture
georgiaAthens Area Arts CouncilCity of Atlanta Office of Cultural Affairs
hawaii Hawai’i Arts Alliance
idaho Boise City Department of Arts and History
illinois Arts Alliance IllinoisArtsPartners of Central IllinoisRockford Area Arts Council
indiana Arts Council of Indianapolis City of Bloomington Department of Economic and Sustainable Development
iowa ArtsLIVECity of DubuqueIowa Cultural Corridor Alliance
kansas City of Wichita Division of Arts & Cultural Services
kentucky LexArts, Inc.
louisiana City of Slidell Department of Cultural and Public AffairsSt. Tammany Parish Department of Cultural and Governmental Affairs
maine Creative Portland Corporation
maryland Arts & Humanities Council of Montgomery CountyBaltimore Office of Promotion and the ArtsPrince George’s County Arts Council
massachusetts City of Pittsfield Office of Cultural Development
michigan Cultural Alliance of Southeastern Michigan
minnesota Rochester Arts Council
mississippiGreater Jackson Arts Council
missouri Allied Arts Council of St. JosephArts Council of Metropolitan Kansas CitySt. Louis Regional Arts Commission
montana Missoula Cultural Council
nebraska Adams County Convention and Visitors BureauColumbus Area Arts Council Lincoln Arts CouncilMuseum of Nebraska ArtNebraskans for the Arts
nevada Metro Arts Council of Southern Nevada
Thank You to Our Partner Organizations
Americans for the Arts • Arts & Economic Prosperity IV • page 18
B_ARTS_AEP4_Summary_cc.indd 18B_ARTS_AEP4_Summary_cc.indd 18 5/9/12 9:40 AM5/9/12 9:40 AM

new hampshire Art-Speak—The City of Portsmouth’s Cultural CommissionArts Alliance of Northern New HampshireCity of Rochester Department of Economic DevelopmentGreater Concord Chamber of CommerceNew Hampshire State Council on the ArtsNewmarket Heritage and Cultural Center Committee (a subcommittee of the Lamprey Arts & Culture Alliance)
new jersey Arts Council of Princeton Bergen County Division of Cultural and Historic AffairsNewark Arts Council
new mexico City of Albuquerque Cultural Services Department
new york ArtsWestchester Auburn Historic and Cultural Sites CommissionChenango County Council of the ArtsCommunity Arts PartnershipLe Moyne College Division of Management
north carolina Arts Council of Fayetteville/Cumberland CountyArts Council of Moore CountyArts Council of Wayne CountyArts Council of Winston-Salem/Forsyth CountyArts & Science CouncilCity of Asheville Cultural Arts DivisionCommunity Council for the ArtsDurham Arts CouncilNorth Carolina Arts CouncilOrange County Arts CommissionPitt County Arts Council at EmergeRutherford County Department of Recreation, Culture, and HeritageTown of Cary Department of Parks, Recreation & Cultural ResourcesTransylvania Community Arts CouncilUnited Arts Council of Greater Greensboro
United Arts Council of Raleigh and Wake County (in partnership with the City of Raleigh Arts Commission)Watauga County Arts Council
north dakota Minot Area Council of the Arts
ohio Athens Municipal Arts CommissionGreater Columbus Arts CouncilPower of the Arts
oklahoma Greater Enid Arts and Humanities Council
oregon Arts and Business Alliance of Eugene (a project of the Eugene Area Chamber of Commerce)Regional Arts and Culture Council
pennsylvania ArtsErieCentral Pennsylvania Festival of the ArtsCitizens for the Arts in Pennsylvania, (in partnership with the Pennsylvania Council on the Arts)Greater Philadelphia Cultural AllianceGreater Pittsburgh Arts CouncilIndiana Arts CouncilJump StreetLackawanna County Department of Arts and CultureLehigh Valley Arts CouncilNorthern Tier Cultural AlliancePennsylvania Rural Arts Alliance
rhode island Providence Department of Art, Culture & Tourism
south carolina Cultural Council of Richland and Lexington Counties
south dakota Aberdeen Area Arts CouncilSioux Falls Arts CouncilSouth Dakota Arts Council
tennessee Allied Arts of Greater ChattanoogaArtsMemphis
texas Arts Council of Forth Worth & Tarrant County City of Austin Cultural Arts DivisionCity of Dallas Office of Cultural AffairsCity of San Antonio Office of Cultural AffairsHouston Arts AllianceMcKinney Arts CommissionNorth Texas Business Council for the Arts
utah Cedar City Arts Council
vermontArts Council of Windham County
virginia Arlington County Cultural Affairs DivisionArts Council of Fairfax CountyCity of Alexandria Office of the ArtsCity of Fairfax Commission on the ArtsLoudoun Arts Council Piedmont Council for the Arts
washington Allied Arts of Whatcom County Seattle Office of Arts & Cultural AffairsTacoma Arts Commission
west virginia Helianthus LLC Parkersburg Area Community Foundation
wisconsinCreative Alliance MilwaukeeDane County Arts & Economic Prosperity CollaborativeEau Claire Regional Arts CouncilFox Cities Performing Arts CenterPerforming Arts Foundation Inc. (dba The Grand)Viterbo University Fine Arts CenterWisconsin Arts Board
wyomingCenter for the Arts
Americans for the Arts • Arts & Economic Prosperity IV • page 19
B_ARTS_AEP4_Summary_cc.indd 19B_ARTS_AEP4_Summary_cc.indd 19 5/9/12 9:40 AM5/9/12 9:40 AM

Glossarycultural tourism
Travel directed toward experiencing the arts, heritage,
and special character of a place.
direct economic impact
A measure of the economic effect of the initial
expenditure within a community. For example, when
the symphony pays its players, each musician’s salary,
the associated payroll taxes paid by the nonprofit, and
full-time equivalent employment status represent the
direct economic impact.
direct expenditures
The first round of expenditures in the economic cycle.
A paycheck from the symphony to the violin player and
a ballet company’s purchase of dance shoes are examples
of direct expenditures.
econometrics
The process of using statistical methods and economic
theory to develop a system of mathematical equations
that measures the flow of dollars between local indus-
tries. The input-output model developed for this study
is an example of an econometric model.
full-time equivalent (fte) jobs
A term that describes the total amount of labor employed.
Economists measure FTE jobs—not the total number of
employees—because it is a more accurate measure of
total employment. It is a manager’s discretion to hire
one full-time employee, two half-time employees, four
quarter-time employees, etc. Almost always, more people
are affected than are reflected in the number of FTE jobs
reported due to the abundance of part-time employment,
especially in the nonprofit arts and hospitality industries.
indirect impact
Each time a dollar changes hands, there is a measurable
economic impact. When people and businesses receive
money, they spend much of that money locally. Indirect
impact measures the effect of this re-spending on jobs,
household income, and revenue to local and state govern-
ment. It is often referred to as secondary spending or the
dollars “rippling” through a community. When funds are
eventually spent nonlocally, they are considered to have
“leaked” out of the community and cease having a local
economic impact. Indirect impact is the sum of all the
rounds of re-spending.
input-output analysis
A system of mathematical equations that combines statis-
tical methods and economic theory in an area of economic
study called econometrics. Economists use this model
(occasionally called an inter-industry model) to m easure
how many times a dollar is re-spent in, or “ripples”
through, a community before it leaks out (see Leakage).
The model is based on a matrix that tracks the dollar flow
between 533 finely detailed industries in each community.
It allows researchers to determine the economic impact of
local spending by nonprofit arts and culture organizations
on jobs, household income, and government revenue.
Americans for the Arts • Arts & Economic Prosperity IV • page 20
B_ARTS_AEP4_Summary_cc.indd 20B_ARTS_AEP4_Summary_cc.indd 20 5/9/12 9:40 AM5/9/12 9:40 AM

leakage
The money that community members spend outside of
a community. This nonlocal spending has no economic
impact within the community. A ballet company purchas-
ing shoes from a nonlocal manufacturer is an example of
leakage. If the shoe company were local, the expenditure
would remain within the community and create another
round of spending by the shoe company.
resident household income (or personal income)
The salaries, wages, and entrepreneurial income residents
earn and use to pay for food, mortgages, and other living
expenses. It is important to note that resident household
income is not just salary. When a business receives money,
for example, the owner usually takes a percentage of the
profit, resulting in income for the owner.
revenue to local and state governments
Local and state government revenue is not derived
exclusively from income, property, sales, and other taxes.
It also includes license fees, utility fees, user fees, and
filing fees. Local government revenue includes funds
to governmental units such as a city, county, township,
school district, and other special districts.
“In Nebraska, we understand that cultural excellence is crucial to economic development. The economic impact of arts organizations on our state is significant, and without the quality and diversity of the arts, it would be difficult to attract and promote business development. Arts-related industries create jobs, attract investments, and enhance tourism. Additionally, the arts connect us to each other and add richness to our lives.”
lt. governor rick sheehy Chair, National Lt. Governors Association
“Americans for the Arts continues to develop the tools for arts advocates and the evidence to persuade decision-makers that the arts benefit all people in all communities.”
janet brownExecutive Director, Grantmakers in the Arts
B_ARTS_AEP4_Summary_cc.indd 21B_ARTS_AEP4_Summary_cc.indd 21 5/9/12 9:40 AM5/9/12 9:40 AM

1 How is the economic impact of arts and culture organizations different from other industries?
Any time money changes hands, there is a measurable economic impact. Social service organizations, libraries, and all entities that spend money have an economic impact. What makes the economic impact of arts and culture organizations unique is that, unlike most other industries, they induce large amounts of event-related spending by their audiences. For example, when patrons attend a performing arts event, they may purchase dinner at a restaurant, eat dessert after the show, and return home and pay the babysitter. All of these expenditures have a positive and measurable impact on the economy.
2 Will my local legislators believe these results?
Yes, this study makes a strong argument to legislators, but you may need to provide them with some extra help. It will be up to the user of this report to educate the public about economic impact studies in general and the results of this study in particular. The user may need to explain (1) the study methodology used; (2) that econo-mists created an input-output model for each community and region in the study; and (3) the difference between input-output analysis and a multiplier (see question 9). The good news is that as the number of economic impact studies completed by arts organizations and other special interest areas increases, so does the sophistication of community leaders whose influence these studies are meant to affect. Today, most decision-makers want to know what methodology is being used and how and where data was gathered. You can be confident that the input-output analysis used in this study is a highly regarded model in the field of economics (the basis of two Nobel Prizes in economics). However, as in any professional field, there is disagreement about procedures, jargon, and the best way to determine results. Ask 12 artists to define art and you will get 12 answers; expect the same of economists. You may meet an economist who believes that these studies should be done differently (for example, a cost-benefit analysis of the arts).
3 How can a community not participating in the Arts & Economic Prosperity IVstudy apply these results?
Because of the variety of communities studied and the rigor with which the Arts & Economic Prosperity IV study was conducted, nonprofit arts and culture organizations located in communities that were not part of the study can estimate their local economic impact. Estimates can be derived by using the Arts & Economic Prosperity IV Calculator (found at www.AmericansForTheArts.org/EconomicImpact). Additionally, users will find sample PowerPoint presentations, press releases, op-eds, and other strategies for proper application of their estimated economic impact data.
4 How were the 182 participating communities and regions selected?
In 2010, Americans for the Arts published a call for participants for communities interested in participating in the Arts & Economic Prosperity IV study. Of the more than 200 participants that expressed interest, 182 agreed to participate and complete four participation criteria (see page 16 for more information).
5 How were the eligible nonprofit arts organizations in each community selected?
Each of the 182 study regions identified the comprehensive uni-verse of eligible nonprofit arts and culture organizations located in their regions. Eligibility was determined using the Urban Institute’s National Taxonomy of Exempt Entities (NTEE) coding system as a guideline. Communities were encouraged to include other types of eligible organizations if they play a substantial role in the cultural life of the community or if their primary purpose is to promote participation in, appreciation for, and understanding of the visual, performing, folk, and media arts. These include government-owned or -operated cultural facilities and institutions, municipal arts agencies and councils, private community arts organizations, unincorporated arts groups, living collections (such as zoos and botanical gardens), university presenters, and arts programs that are embedded under the umbrella of a non-arts organization or facility. For-profit businesses were strictly excluded from this study. In short, if it displays the characteristics of a nonprofit arts and culture organization, it was included.
6 What type of economic analysis was done to determine the study results?
An input-output analysis model was customized for each of the participating communities and regions to determine the local economic impact their nonprofit arts and culture organizations and arts audiences. Americans for the Arts, which conducted the research, worked with a highly regarded economist from the Georgia Institute of Technology to design and customize the input-output models used in this study (see page 15 for more information).
Frequently Asked Questions
Americans for the Arts • Arts & Economic Prosperity IV • page 22
B_ARTS_AEP4_Summary_cc.indd 22B_ARTS_AEP4_Summary_cc.indd 22 5/9/12 9:40 AM5/9/12 9:40 AM

7 What other information was collected in addition to the arts surveys?
In addition to detailed expenditure data provided by the participat-ing eligible organizations, extensive wage, labor, tax, and commerce data were collected from local, state, and federal governments for use in the input-output model.
8 Why are admission/ticket expenses excluded from the analysis of audience spending?
Researchers make the assumption that any admission fees paid by attendees are typically collected as revenue by the organization that is presenting the event. The organizations then spend those dollars. Thus, the ticket fees are captured in the operating budgets of the eligible nonprofit arts and culture organizations that participate in the organizational data collection effort. Therefore, the admissions paid by audiences are excluded from the audience spending analysis in order to avoid “double-counting” those dollars in the overall analysis.
9 Why doesn’t this study use a multiplier?
When many people hear about an economic impact study, they expect the result to be quantified in what is often called a mul-tiplier or an economic activity multiplier. The economic activity multiplier is an estimate of the number of times a dollar changes hands within the community (e.g., a theater pays its actor, the actor spends money at the grocery store, the grocery store pays the cashier, and so on). It is quantified as one number by which expen-ditures are multiplied. The convenience of the multiplier is that it is one simple number. Users rarely note, however, that the multiplier is developed by making gross estimates of the industries within the local economy and does not allow for differences in the charac-teristics of those industries. Using an economic activity multiplier usually results in an overestimation of the economic impact and therefore lacks reliability.
Acknowledgements
Americans for the Arts wishes to express its
gratitude to the many people across the country
who made Arts & Economic Prosperity IV possible
and assisted with its development, coordination,
and production. A study of this size and scope
cannot be completed without the collaboration
of many partnering organizations.
Special thanks to the John D. and Catherine T.
MacArthur Foundation and The Ruth Lilly Fund
for Americans for the Arts for their financial
support. Thanks also to Cultural Data Project
for their research partnership.
Finally, each of our 182 local, regional, and state-
wide research partners contributed both time and
financial support toward the completion of this
study. Thanks to all of you. This study would not
have been possible without you.
A study of this magnitude is a total organizational
effort; appreciation is extended to the entire board
and staff of Americans for the Arts. The Research
Department responsible for the production of
this study includes Randy Cohen, Ben Davidson,
Amanda Alef, and Sam Myett.
Americans for the Arts 2011 Public Art Network Year in Review selection Cloudbreak by Catherine Widgery in Denver, CO
B_ARTS_AEP4_Summary_cc.indd 23B_ARTS_AEP4_Summary_cc.indd 23 5/14/12 12:06 PM5/14/12 12:06 PM

pa
rt
ne
rs
1000 Vermont Avenue, NW, 6th Floor Washington, DC 20005
t 202.371.2830f 202.371.0424e [email protected]
www.AmericansForTheArts.org
Americans for the Arts is the nation’s leading nonprofit
organization for advancing the arts in America. Established
in 1960, we are dedicated to representing and serving local
communities and creating opportunities for every American
to participate in and appreciate all forms of the arts.
The following national organizations partner with Americans for the Arts to help public- and private-sector leaders understand the economic and social benefits that the arts bring to their communities, states, and the nation.
B_ARTS_AEP4_Summary_cc.indd 24B_ARTS_AEP4_Summary_cc.indd 24 5/14/12 12:06 PM5/14/12 12:06 PM