the impact of bim/vdc on roi - välkommen till kth/menu/general/column... · title the impact of...
TRANSCRIPT

Department of Real Estate and Construction Management Thesis no. 177
Name of programme: Real Estate Development and Financial Services Master of Science, 30 credits
Name of track: Architectural Design and Construction Project Management
The Impact of BIM/VDC on ROI
Developing a Financial Model for Savings and ROI Calculation of Construction Projects
Author: Supervisor: Salih Sen Stockholm 2012
Väino K Tarandi

1
Master of Science thesis
Title The Impact of BIM/VDC on ROI; Developing a
Financial Model for Savings and ROI Calculation of Construction Projects.
Authors Salih Sen Department Real Estate and Construction Management Master Thesis number Supervisor Väino K Tarandi Keywords BIM, VDC, return on investment (ROI), savings,
construction

2
Abstract Building Information Modeling (BIM) or Virtual Design and Construction (VDC) recently has been regarded as crucial by the architecture, engineering, and construction (AEC) industry. The use of BIM/VDC represents the creation and use of a three-dimensional (3D) virtual model that amplifies the design, construction, and operation of a building. This technological improvement fundamentally changes the process of how the buildings are designed and constructed. However, the approach to the use of advanced technology in the AEC industry does not seem to be welcomed by the majority of the industry regarding high initial cost of implementation. This study presents data gathered from meetings, interviews and a case study which was a construction project run in Sweden to determine the savings implementing BIM/VDC and to reveal the return on investment (ROI) from a general contractor (GC) perspective. The potential savings to the GC to invest in BIM/VDC were estimated based on the PENG model, measurable cost benefits associated with reduced schedule overruns and reduced change order cost.
This thesis confirmed that BIM/VDC results in vast savings and positive impacts on ROI based on the results from the case study which deployed it successfully.

3
Sammanfattning Byggnadsinformationsmodellering (BIM) eller Virtual Design and Construction (VDC) har nyligen börjat betraktas som ytterst viktigt i de dagliga processerna för AEC – industrin (Architecture, Engineering and Construction). Användandet av BIM/VDC representerar skapandet och användningen av en tre-dimensionell virtuell modell som förstärker och visualiserar design, konstruktion samt drift och underhåll av en byggnad. Denna teknologiska förbättring förändrar processen av hur byggnader designas och konstrueras fundamentalt. Sättet att använda av avancerad teknologi i AEC industrin verkar dock inte vara välkommet av majoriteten i industrin på grund av höga initiala kostnader i implementeringen. Denna studie presenterar data från möten, intervjuer och en fallstudie av ett svenskt byggprojekt för att finna eventuella kostnadsbesparingar vid implementering av BIM/VDC samt bedöma dess avkastning (Return on Investment, ROI) från byggentreprenörens perspektiv. De eventuella besparingarna byggentreprenören kan göra vid en investering i BIM/VDC är baserade på PENG modellen, mätbara kostnadsfördelar associeras med färre tidsöverskridanden och lägre kostnader på grund av färre inkommande ändrings och tilläggsarbeten.
Detta arbete bekräftar att BIM/VDC resulterar i omfattande besparingar samt en positiv påverkan på avkastning (ROI), vilken är baserad på resultaten i fallstudien.

4
Acknowledgement This thesis would not have been possible without the help and contributions of many people. First of all, my greatest debt goes to my thesis supervisor Väino Tarandi. This thesis could not be realized without the efforts, understanding, support and guidance of Väino Tarandi, who has always been there to encourage and help me in every step of the formation of this thesis. I am indebted to Fredrik Wincent from Veidekke as he provided an insightful approach to make progress on this thesis. He has been very influential for this present thesis as his knowledge has provided a good basis. I wish to express my thanks to Ulrika Sohlenius from Veidekke for her efforts and kind assistance. I am also obliged to Stefan Söderberg and Mikael Lilliesköld from Veidekke for their help. I owe my deepest gratitude to my mother Aytan Akcay for her endless support, caring and for providing a loving environment for me. I also feel obliged to Asin who has assisted and supported me during the period of thesis writing. He has always been there to motivate me in the process of writing. I wish to convey my sincere and warm thanks to my friends Umut and Umit brothers for always sharing my ideas and providing feedback during thesis writing process. I want to thank also to Frida and Michael for their valuable feedback to the thesis. I owe thanks to Murat and Nazmiye for their support and friendship. I never felt homesick in the environment of their restaurant. I also wish to express my thanks to Cane whose empathy made this process of thesis writing more bearable. Most importantly, I feel indebted to Emma who has assisted and supported me during the period of thesis writing. I also thank for all the camaraderie she provided in life, and sharing both the sufferings and all the lovely moment of life. I offer my regards and blessings to all the respondents who supported me in any respect during the completion of the thesis.
5
List of Abbreviation
BIM Building Information Modeling/ Building Information Model
VDC Virtual Design and Construction
ROI Return on Investment
CAD Computer Aided Design
AEC Architecture, Engineering and Construction
GC General Contractor
RFI Request for Information
CO Change Order
CIFE Center for Integrated Facility Engineering
ICE Integrated Concurrent Engineering
IFC Industry Foundation Classes
TEI Total Economic Impact

6
Table of Content
Master of Science thesis .......................................................................................................................... 1
Abstract ................................................................................................................................................... 2
Sammanfattning ...................................................................................................................................... 3
Acknowledgement ................................................................................................................................... 4
List of Abbreviation ................................................................................................................................. 5
Table of Content ...................................................................................................................................... 6
List of Tables ........................................................................................................................................... 8
List of Figures ......................................................................................................................................... 8
Foreword ................................................................................................................................................. 9
1. Introduction ................................................................................................................................... 10
1.1. Background ........................................................................................................................... 10
1.2. Purpose .................................................................................................................................. 11
1.3. Research Question ................................................................................................................. 12
1.4. Research Approach ................................................................................................................ 12
1.5. Research Limitations ............................................................................................................. 12
2. Methodology ................................................................................................................................. 13
2.1. Literature Survey ................................................................................................................... 13
2.2. Previous Studies .................................................................................................................... 13
2.3. Interviews .............................................................................................................................. 14
2.4. Meetings ................................................................................................................................ 14
2.5. Case Study ............................................................................................................................. 14
3. Theoretical background/Literature review .................................................................................... 17
3.1. Historical development .......................................................................................................... 17
3.1.1. Parametric Modeling in BIM......................................................................................... 18
3.2. BIM and the confusion of concepts ....................................................................................... 18
3.2.1. Definition – What is BIM? ............................................................................................ 18
3.2.2. BIM vs. 2D CAD ........................................................................................................... 20
3.2.3. BIM vs. VDC ................................................................................................................ 20
3.3. Previous Studies on Business Aspect .................................................................................... 22
3.3.1. ROI Analysis ................................................................................................................. 23
3.3.2. Comparative studies by Giel et al. (2009) ..................................................................... 25
3.3.3. ROI with Autodesk Revit .............................................................................................. 25

7
3.3.4. PENG Model for quantifying the benefits of BIM ........................................................ 27
3.3.5. Total Economic Impact ................................................................................................. 28
4. Analysis/Results/Discussions ........................................................................................................ 29
4.1. Previous studies ..................................................................................................................... 29
4.1.1. Holder construction records:......................................................................................... 29
4.1.2. Comparative studies by Giel et al. (2009) ..................................................................... 30
4.1.3. Autodesk Revit ROI analysis .......................................................................................... 31
4.1.4. The PENG Model ........................................................................................................... 32
4.1.5. Total Economic Impact .................................................................................................. 32
5. Developing a Financial Model for ROI calculation ........................................................................ 33
6. Case Study – The ALFA Residential Project ................................................................................... 37
6.1. Meetings ................................................................................................................................ 37
6.2. Savings calculations in ALFA Residential Project ................................................................... 38
6.2.1. Cost of iRoom in the ALFA Project................................................................................. 42
6.2.2. Summary of calculations ............................................................................................... 43
6.3. VDC/BIM in design phase: ................................................................................................... 44
6.4. VDC/BIM in production phase ............................................................................................. 45
7. Conclusion and recommendation .................................................................................................. 46
References ............................................................................................................................................. 49
Appendixes ............................................................................................................................................ 51
Appendix A: Comparative Study ROI Analysis; Project A vs. Project B ............................................. 51
Appendix B: Comparative Study ROI Analysis; Project C vs. Project D ............................................. 53
Appendix C: Autodesk Revit ROI Calculation..................................................................................... 55
Appendix D: Interviews questions .................................................................................................... 56
a) VDC/BIM impact on Design phase ........................................................................................ 56
b) VDC/BIM Impact on Production phase ................................................................................. 57

8
List of Tables
Table 2-1: The ALFA Project Information ........................................................................................... 15 Table 3-1: A sample of Holder Construction’s BIM ROI (source: CIFE, 2007 in Azhar, 2011) ......... 24 Table 3-2: Sensitivity Analysis (Source: Autodesk, 2012) ................................................................... 27 Table 3-3: Potential savings considering Life Cycle cost ..................................................................... 27 Table 3-4: Simple TEI model (Source (Kunz and Fischer, 2012) ) ...................................................... 28 Table 3-5: Representative costs to implement basic VDC (source (Kunz and Fischer, 2012)). ........... 29 Table 4-1: Holder Construction records over its 10 projects. Source CIFE, 2007 in (Azhar, 2011) .... 30 Table 4-2: Project A vs. Project B ......................................................................................................... 31 Table 4-3: Project C vs. Project D ......................................................................................................... 31 Table 5-1: PENG Model template used for the Financial Model to calculate ROI ............................... 35 Table 5-2: Financial model for ROI of BIM ......................................................................................... 36 Table 6-1: Project Information .............................................................................................................. 38 Table 6-2: Project Development Saving calculation ............................................................................. 39 Table 6-3: Design and production cost savings ..................................................................................... 39 Table 6-4: Savings resulted from reduction in change orders ............................................................... 40 Table 6-5: Summary of saving calculation in ALFA Residential ......................................................... 40 Table 6-6: Daily costs of variables in case of schedule overrun (source: Giel et al 2009) ................... 41 Table 6-7: Assumption on the figures for ALFA to estimate schedule improvement savings. ............. 41 Table 6-8: The cost of iRoom for ALFA project .................................................................................. 42 Table 6-9: ROI calculation of ALFA Project ........................................................................................ 43 Table 6-10: Potential savings considering lifecycle costs in ALFA Project. ........................................ 44 Table 7-1: Summary of calculations for ALFA Project ........................................................................ 47
List of Figures Figure 1-1: Information Exchange before BIM and with BIM (Source:(AllenConsultingGroup, 2010)) ............................................................................................................................................................... 10 Figure 2-1: Visualization of ALFA Residential Project (Veidekke, 2012) .......................................... 16 Figure 3-1: Different types of information models, source (VBLab/ Jiri Hietanen, in (Tarandi, 2011)) ............................................................................................................................................................... 17 Figure 3-2: Virtual Design and Construction (VDC) ( source: (Fischer et al., 2012)t .......................... 21 Figure 3-3: iRoom in CIFE (source, (Fischer et al., 2004)) .................................................................. 22 Figure 3-4: Design investment and productivity Curve (Source: Autodesk 2012) ............................... 26 Figure 5-1: The evaluation of financial model for ROI of BIM ............................................................ 33 Figure 5-2: PENG Model ...................................................................................................................... 33 Figure 5-3: Comparative study for ROI analysis .................................................................................. 34 Figure 6-1: Visualization of ALFA Project with BIM/VDC ................................................................. 37 Figure 6-2: VDC/BIM tools used in ALFA Project ( Source : (Sohlenius and Söderberg, 2012) ........ 44
9
Foreword The idea of studying the impact of BIM/VDC on ROI has been initiated by several factors. One of them is an article that I read during a course taken from Väino Tarandi namely Building Informatics and Logistics, (Code: AI2805 Spring 2011). The article was written by Cannistraro (2010) to reveal the savings achieved through collaboration via use of BIM in which it led to fewer RFIs and less change orders. This point is noteworthy since having a couple of years of experience from industry I have seen that it is a great challenge for the construction industry to decrease costs of change orders and number of RFIs. Another factor is that during a visit to the carrier fair at Kungliga Tekniska Högskola (KTH) called LAVA1 in which most of the leading companies from the AEC industry running projects mainly in Scandinavian countries, I have come up to the conclusion that that limited amount of firms use BIM/VDC. To me, more surprisingly, among the companies which implemented BIM/VDC, none of them were doing return on investment analysis of BIM/VDC in their projects. Then I have started searching to learn if there are any studies done by the academia. There, I have found out that, there are several studies which approached the subject from different aspects to reveal investment value of using BIM/VDC. But all of them have both strengths and weakness. Therefore I have been motivated enough to go over the subject in detail to find out how the impact of using BIM/VDC on ROI can be calculated more precisely.
1 LAVA is a career fair organized by the students in Built Environment Faculty, KTH gathering around 100 companies from the construction
industry every year (http://lava2012.se/student)

10
1. Introduction
1.1. Background Traditionally the information exchange between parties involved in a project was held linearly, which caused the information to be open to interpretation and clarification (Garber, 2009). However, the advanced improvements in technologies providing software and tools make it possible to have analysis, simulation and digital fabrication in which stakeholders now can understand how the virtual ideas are realized and how to manage them (Garber, 2009). Today, what is called BIM or VDC has the potential to create a single model that offers visualization, clash detection, construction phases, and materials and testing together (Azhar, 2011). US National Institute of Building Sciences (NIBS) defines that BIM is “the use of the concepts and practices of open and interoperable information exchanges, emerging technologies, new business structures and influencing the re-engineering of processes in ways that dramatically reduce multiple forms of waste in the building industry” (Garber, 2009). As it is seen from figure 1-1, through BIM, the relation and information exchange between stakeholders can be organized in a more structured way.
Figure 1-1: Information Exchange before BIM and with BIM (Source:(AllenConsultingGroup, 2010))
Architects were using 3-D modeling to communicate with clients by renderings, which were empty shells wrapped in texture maps. Now it is turned into a situation that is called an information model that provides real-time data and visualization of what the building looks like (Sharples, 2009). Here the important point is that BIM makes it possible for each participant to have the right information that meets their needs. Sharples (2009) also states that those who are part of the team making the model need to be in the same environment during the design phase in order to anticipate potential conflicts, understand sequencing issues, and recognize when a constructed element looks wrong or out of place. This is called Integrated Concurrent Engineering (ICE) by the Center for Integrated Facility Engineering (CIFE), a unit focusing on (VDC) in Stanford University (Kunz and Fischer, 2012). Finding

11
the conflicts and solving them in the early phases are crucial for construction projects in order to prevent greater cost in terms of delays and correction of the work.
Azhar (2011) stated that with VDC/BIM technology, an accurate virtual model of a building is digitally constructed in which it helps architects, engineers, and constructors to visualize what is to be built in a simulated environment to identify any potential design, construction, or operational issues. What Azhar (2011) indicated is that BIM represents a new paradigm within AEC, one that encourages integration of the roles of all stakeholders in a project.
Considerations have become a challenge for a long time for the architecture, engineering, and construction (AEC) industry to find techniques to decrease project cost, increase productivity and quality. Through BIM technology, it becomes possible to have precise geometry and relevant data needed to support the design, procurement, fabrication, and construction activities required to realize the building (Azhar, 2011). It is because BIM contains the geometry, spatial relationships, geographic information, quantities and properties of building elements, cost estimates, material inventories, and the project schedule (Azhar, 2011). Furthermore, according to Azhar (2011), there are certain effects of BIM for the AEC industry which can be summarized as:
• Quantities and shared properties of materials can be readily extracted • Scope of work can be isolated and defined • Systems, assemblies, and sequences can be shown • Construction documents such as drawings, procurement details, submittal processes
and other specifications can be interrelated
1.2. Purpose BIM/VDC has been regarded crucially by the architecture, engineering, and construction (AEC) industry due to the fact that it provides a revolutionary era to the industry (Giel et al., 2009). Considering complex construction processes, BIM seems to provide advanced improvements to the environment in which different actors from different disciplines collaborate to achieve project goals successfully. For the complex processes of the construction projects, the use of BIM provides computer generated models to simulate the planning, design, construction and operation of a facility (Giel et al. 2010). BIM helps to visualize what is to be constructed in a virtual environment and determine the threats, weak points, clashes etc. Today, the use of BIM/VDC becomes more widespread in the AEC industry and it is used in all phases of design and construction (Howard and Bjork, 2007) .The studies show that most of the respondents perceive high value but cannot quantify the benefits (Howard and Bjork, 2007). Departing from this point, the research aims to capture how the BIM adds value, and to what extent it contributes to the return on investment from a GC point of view. Along with the investment point of view, it is also aimed to have basic BIM concepts, and how it is hailed by the construction industry through a case study and interviews.

12
1.3. Research Question This study evaluates the impact of BIM on the construction projects from the point of view of investment based on analysis of previous studies carried out by the academia and industry and a case study supported by interviews and meetings. The main research question is:
What is the impact of BIM/VDC on ROI from a General Contractor perspective?
Together with the research question, the following sub-questions are also studied:
1. What is the rationale behind BIM/VDC technology?
2. What methods are available to calculate the ROI of using BIM?
3. How can a financial model be developed for the calculation of ROI in the projects assisted by BIM from the point of GC?
3.1. What is the cost of implementing BIM for the construction projects?
3.2. What are the possible estimated savings achieved by the use of BIM?
4. What are the benefits of BIM in a construction projects considering the design and production phase from the point of GC?
5. What is the impact of BIM on people’s behavior working with BIM?
1.4. Research Approach The methodology to study the effect of BIM/VDC on ROI was based on both a qualitative and a quantitative approach. The first question was analyzed through literature survey. The second question was analyzed through previous studies in literature survey and studies done in the AEC industry. The third question was answered through literature survey, previous studies, interviews and a case study from the construction industry in Sweden. The fourth and fifth questions were studied through interviews done by the representative managers from the industry. In developing the model for the calculation of ROI, the essential part was to determine the parameters that could be used to quantify the profitability of BIM. In doing so, the previous studies were analyzed.
1.5. Research Limitations The thesis uses a case study from the Swedish construction industry to reveal the impact of BIM/VDC on ROI. In doing so, the assumptions to do saving calculations are based mostly on a previous study which is called PENG model. The PENG model quantifies the effect of BIM via assumptions derived from studies done over wide a range of respondents from different professions and industry though surveys and interviews over several years. The results derived from the PENG model are dependent mainly on Swedish construction companies. Therefore the model is limited to the Swedish construction industry even if the theories and analysis can be applied to companies around the world implementing BIM. The assumptions should be reconsidered when it is applied to a project that has a different location, different contract type and project use.

13
2. Methodology The objective of this research is to have full understanding of BIM/VDC concepts, to analyze the previous studies focusing on the ROI analyses, to analyze the business processes of a construction company during the implementation of a project from industry and eventually set up a financial model for the calculation of ROI when using BIM in construction projects from the general contractor perspective. In doing so, the literature review, interviews, questionnaire, and previous studies are essential means and methods to achieve the research objectives. Both quantitative and qualitative methods are useful in different stages for this research (Ghauri and Grønhaug, 2010). Firstly, it is relevant to start with qualitative methods since the problem is unstructured in the thesis. Through meetings, interviews and informal communications, the aim is to understand individuals’ personal experience or behavior and to know more about phenomenon which are not very well known (Ghauri and Grønhaug, 2010). Then, quantitative methods can be used appropriately to verify and test the results and hypothesis derived from qualitative methods. By using quantitative methods, it becomes possible to accept or reject the hypothesis in a logical way.
2.1. Literature Survey Through a literature survey, the aim is to understand the rationale behind BIM technology, to have a sense of historical development of BIM, and to comprehend the basic implementation strategies handled in the research environment and industry. It is important to have a review of the literature since it helps to display history of the theories: who initiated and who contributed, the relations of the theories, opponents and proponents, the background, how the problem evolved, frame of the research, the position of the study and to what extent it contributed to the solution (Ghauri and Grønhaug, 2010).
The literature consists of articles, books and related papers, reports, and publications by academia and industry. There are several sources that are to be used primarily for the literature survey. BIM Handbook written by Eastman et al consists of quite deep explanations about the rationale of BIM. Through the book, CAD systems development, parametric modeling and design are going to be studied. Furthermore, another book titled BIM: A strategic implementation guide for architects, engineers, constructors, and real estate asset managers will also provide relevant information about the implementation strategies and business point of view. The studies done by CIFE from Stanford University provide a wide foundation in the research. Besides, some other publications directly handling the ROI analysis of using BIM in projects were also considered in the research.
2.2. Previous Studies The implementation of BIM is always regarded skeptically by the industry considering if it is profitable to their company or not. Several studies have been done to reveal the effect of BIM on ROI. In this part, the aim is to capture how researchers handled the problem and what perspectives are developed through their conclusions. Some of the studies are: a mathematical model developed by Autodesk Revit to calculate ROI, ROI analysis done by Giel B, Issa, R R A and Olbina, S from University of Florida, USA, and Salman Azhar, assistant professor from McWhorter School of Building Science, College of Architecture, Design and Construction,

14
USA. In addition, the studies done by Martin Fischer, Professor at Stanford University and director of the Center for Integrated Facility Engineering, are also taken into consideration in the research to capture the current VDC and BIM issues. The final model is the PENG model that was modified and applied by Roger Jongeling to the Swedish construction industry.
2.3. Interviews The interviews were done with managers from Veidekke Construction Company which is a pioneering engineering and construction company in Sweden implementing VDC and BIM in projects. Veidekke puts a lot of effort into the use of VDC, ICE, and interactive planning. The company’s know-how and current focus on issues about VDC and BIM provided fundamental understanding for my research on investigating the impact of BIM on ROI and sub-questions under my research subject. The interviews were conducted within Veidekke Construction Company to analyze in general the effect of BIM on business process, and in particular to find out about BIM/VDC implementation in their projects. The interviews provided feedback from the respondents’ opinion and then helped to find the solutions to improve the process.
2.4. Meetings The meetings were done with managers from Veidekke Construction Company in order to provide primary data for the research to analyze the effect of BIM/VDC in their projects. The aim was to determine the method to select, to understand the problem and how to proceed. The progress of the research was analyzed together with managers to find out which method is applicable to which project. At the beginning the aim was to have a research over several projects to find out how the impact of VDC/BIM would be over them. Since the time was limited, it was decided to include only one project that was recently completed where VDC/BIM tools were implemented (Meeting, 2012). The meetings were quite helpful to be on the right track for the sake of the study with the information provided by the managers.
2.5. Case Study Case studies are useful to use when it is difficult to investigate the phenomenon and quantify, and it is also qualitative since it is based on a process model (Ghauri and Grønhaug, 2010). In case studies data are collected by verbal reports, interviews and observations as primary data sources. It also considers the secondary data sources like financial reports, archives, budget and operational statements. Case studies are useful for developing the theory and testing it, and using case studies is one of the best ways to have a better understanding of organizations when we want study the effect of certain factors on certain units within an organization (Ghauri and Grønhaug, 2010). Through the case study, the project’s records were tested on the financial model developed to calculate ROI of BIM/VDC use in the project. Past projects’ records are also important to determine the continuous calculation of ROI in the model.
Veidekke is a Scandinavian construction company and property developer based in Oslo. It has around 6 000 employees in Scandinavia. It was established in 1936 and is listed on the main list on the Oslo Stock Exchange since 1986. In 2009, the turnover was NOK 15.5 billion (Veidekke, 2012).

15
Veidekke Construction constructed an apartment block with 57 units in Stockholm. The project was called “The ALFA Residential Project”. The project information can be seen from table 2-1. The ALFA project is the first VDC implemented project within the company. In this project, Veidekke, together with consultants and clients cooperated in the early phase to build the virtual model of the project. The visualization of the project by BIM/VDC can be seen in figure 2-1.
The ALFA Residential Project Use Residential Time June 2010 – Nov 2011 Developer Veidekke Bostad (Property) AB Architect/Consultant Bergkrantz Arkitekter AB Contract type Turnkey Location Stockholm Project Manager Ulrika Sohlenius Design Manager Stefan Söderberg BIM/VDC tools Autodesk Naviswork, Revit, Archicad, Visco Office,
ICE Total Construction Cost (VAT and Land cost excluded)
97 187 000 kr
Project Development Cost 39 000 000 kr Turnkey Contract Value 82 287 000 kr
Table 2-1: The ALFA Project Information
In the company’s website, concerning the costs and earnings of implementing VDC in ALFA project, both managers Stefan Söderberg and Ulrika Sohlenius have stated that they could not answer the question of how much earnings were achieved through the use of VDC. However, they believed that they have achieved lots of benefits from it (Veidekke, 2012). Therefore the study at the end will inform managers of how much they have saved with the help of the project’s records from the contractor’s perspective. On the other hand, Veidekke has seven more projects in its agenda to run with VDC in the future. Therefore, the results derived from figures of ALFA project would make it more explicit for the managers in order to evaluate the possible impact of VDC in their upcoming projects. Therefore, continuous ROI analysis can be done over projects in the future so that it will be possible to evaluate the effect of the BIM/VDC systems over a long period of time and to have valuable feedback in terms of improvement in implementation.

16
Figure 2-1: Visualization of ALFA Residential Project (Veidekke, 2012)

17
3. Theoretical background/Literature review The historical development of CAD systems is essential for this study in order to understand the rationale behind BIM. How it has evolved and been developed is essential to provide relevant information to capture the BIM technology as a whole concept.
3.1. Historical development In early CAD drawings, there were files that consisted of vectors, associated line types, and layer identification. Then, improvements added additional information to these files to allow for blocks of data and associated text (Eastman et al., 2012). By the development of 3D modeling, CAD systems became more intelligent in which it has led to have more focus on data contained in the drawings and 3D images. Therefore, a building model formed by BIM tools made it possible to have multiple different views of the data contained within a drawing set including 2D and 3D (Eastman et al., 2012). A building model can now be described by its content (what objects it describes) or its capabilities (what kinds of information requirements it can support) in which capabilities define what you can do with the model rather than how the database is constructed (Eastman et al., 2012). Different types of information models can be seen from figure 3-1. It can be seen also how the information models evolved from the figure 3-1.
Figure 3-1: Different types of information models, source (VBLab/ Jiri Hietanen, in (Tarandi, 2011))

18
3.1.1. Parametric Modeling in BIM Object based parametric modeling originally was developed in the 1980s for manufacturing (Eastman et al., 2012). It indicates objects by parameters and rules that control the geometry as well as non-geometric properties and features (Eastman et al., 2012). The parameters and rules can be expressions that relate to other objects, thus allowing the objects to automatically update according to user control or changing context (Eastman et al., 2012). The interrelation provided by object classes determines what is a wall, slab, or roof in terms of how they interact with other objects. Object attributes are necessary to interface with analyses, cost estimations, and other applications (Eastman et al., 2012, p. 32).
Building modeling based on 3D solid modeling was first developed in the late 1970s and early 1980s (Eastman et al., 2012, p. 36). Solid modeling CAD systems were functionally powerful but often overwhelmed the available computing power. Some production issues in building, such as drawing and report generation, were not developed (Eastman et al., 2012, p.37). The manufacturing and aerospace industries worked with CAD companies to resolve the early shortcomings and led efforts to develop new capabilities. At that time the building industry was far from the discussions and did not recognize these benefits (Eastman et al., 2012, p. 37). Another step in the evolution from CAD to parametric modeling was the recognition that multiple shapes should share parameters. If a single wall is moved, all those that are linked to it should update as well (Eastman et al., 2012, p. 37).
The parameters defining shapes could be automatically reevaluated and the shape rebuilt. The software was given flags to mark what was modified, so only the changed parts were rebuilt. Because one change could propagate to other objects, the development of a “resolver” capability analyzed the changes and choose the most efficient order to update them (Eastman et al., 2012). The ability to support such automatic updates is the current state-of-the-art in BIM and parametric modeling (Eastman et al., 2012, p. 38).
3.2. BIM and the confusion of concepts
3.2.1. Definition – What is BIM? Definitions provide clarification and precision. It is essential to point out what the concept means since it can be misunderstood if there is not enough explanatory information in the definition. The clarity in definitions leads to effective communication among readers. Definitions create a language of the terms used so that it has the same meaning for everybody and makes easier it to capture the whole picture (Ghauri and Grønhaug, 2010).
In order to make it clear, it is important to clarify the concepts regarding BIM that are articulated both in the AEC industry and academia, since minds seem to be quite blurred if BIM is only a technology or a new working culture, or a 3D model. For the first time in 1970, the concept of Building Information Model was introduced theoretically by academia (Jongeling, 2008). Afterwards, the major CAD vendors such as Autodesk, Bentley Systems and Graphisoft began using BIM concepts (Jongeling, 2008). Autodesk defines BIM as “3D, object-oriented, AEC-specific CAD”. Azhar goes further and states that BIM is not only software; it is a process and software (Azhar, 2011). According to this explanation it is clear

19
that BIM means not only using 3D intelligent models but also making significant changes in the workflow and project delivery. Besides, BIM supports the concept of integrated project delivery, which is a novel project delivery approach to integrate people, systems, and business structures and practices into a collaborative process to reduce waste and optimize efficiency through all phases of the project life cycle (Azhar, 2011).
A broader definition of BIM is all information that is generated and managed during a building’s life cycle represented by (3D) objects, where objects may be building components but also more abstract objects such as spaces (Jongeling, 2008). According to Jongeling (2008) BIM modeling is the process of generating and managing this information. So, it can be said that BIM tools are composed of IT tools to create and manage this information.
Jongeling (2008) also states that many of today’s 3D models are only built for visualization and consist of “dead” graphics, such as surfaces or solids. According to him, these 3D models cannot be defined as BIM because the models lack an object-oriented structure that contains information about what the different objects represent in the physical world.
Eastman et al. (2012) in their book (BIM Handbook) makes a more detailed description of BIM which is also going to be the basis for this study. Therefore, BIM is a modeling technology and associated sets of processes to produce, communicate, and analyze building models. Eastman et al (2012) put some dimensions into BIM such as:
• Building components that are represented with digital representations (objects) that carry computable graphic and data attributes that identify them to software applications, as well as parametric rules that allow them to be manipulated in an intelligent fashion.
• Components that include data that describe how they behave, as needed for analyses, and work processes, for example, take off, specification, and energy analysis.
• Consistent and non-redundant data such that changes to component data are represented in all views of the component and the assemblies of which it is a part.
• Coordinated data such that all views of a model are represented in a coordinated way (Eastman et al., 2012)
Eastman et al. highlights also the vision and definition of BIM made by the National Building Information Modeling Standard (NBIMS) Committee of the National Institute of Building Sciences (NIBS) Facility Information Council (FIC). That is “an approved planning, design, construction, operation, and maintenance process using a standardized machine-readable information model for each facility, new or old, which contains all appropriate information created or gathered about that facility in a format useable by all throughout its lifecycle.” (NIBS, 2008 in Eastman et al 2012)

20
3.2.2. BIM vs. 2D CAD In the use of 2D CAD in the AEC industry, a drawing presents the project as a floor, sections and details. The models are created by 2D lines, dimensions and symbols from a library (Jongeling, 2008). Various types of lines and symbols are used to display various building elements in the model (Jongeling, 2008). In order to visualize, the type of the element or structural part is highlighted. The problem with 2D models is that for example when a wall with a door has a revision in a project, it means that all the drawings must be updated. Furthermore, all the descriptions and lists of quantities of materials must also be updated due to the revision of the wall and the door.
Although BIM is based to some extent on the same principle as 2D CAD, it is also possible to produce different types of surfaces (Jongeling, 2008). The major difference with BIM compared to 2D CAD is that it is possible to work with a model consisting of 3D objects which contain the computer interpretable parameters such as length, height, area, volume, materials, properties, etc., but also information about the location and what the object represents (Jongeling, 2008). This means that visualization in different scales, plans and sections can be done automatically by the CAD program.
Contrary to 2D CAD, a BIM application more readily “understands” that the objects created by users represent real-world components of actual buildings, such as doors, windows, walls, and roofs (Smith and Tardif, 2009). BIM objects can be filled with characteristics of their real-world counterparts, so that, for example, a window “knows” that it can exist only in a wall, and a wall “understands” that one of its essential attributes is thickness (Smith and Tardif, 2009).
3.2.3. BIM vs. VDC VDC term was introduced by CIFE at Stanford University in 2001 (Kunz and Fischer, 2012). The definition made by CIFE is that Virtual Design and Construction is the use of integrated multi-disciplinary performance models of design-construction projects to support explicit and public business objectives (Kunz and Fischer, 2012). The VDC project model emphasizes those aspects of the project that can be designed and managed i.e., the product (typically a building or plant), the organization that will define, design, construct and operate it, and the process that the organization teams follow (Kunz and Fischer, 2012).
Projects require developing and then relating design definitions, actual design and design analyses, and then linking design and construction project management with product management and financial management systems (Kunz and Fischer, 2012). In practice today, multiple teams perform most of this linking manually and socially, with great cost, interaction latency, and confusion (Kunz and Fischer, 2012). Motivated by these business drivers and technical work in integrated concurrent engineering (ICE), which tried to integrate product, organization and process modeling and analysis tightly, the goal for interoperability emerged for multiple computer systems to exchange information and to use the exchanged information effectively (Kunz and Fischer, 2012). Integrated Concurrent Engineering environment in VDC enables all of the project’s stakeholders to access the

21
integrated project database, and individual designers can modify and analyze details of current designs in local data spaces (Kunz and Fischer, 2012).
Industry Foundation Classes (IFC) standards work of the International Alliance for Interoperability (IAI) discusses semantic models for data exchange (Kunz and Fischer, 2012). The large Building Lifecycle Interoperable Software (BLIS) demonstration project defined hundreds of “views” and about 100 “concepts”, which were a “practical” subset of the IFC standard at the time (Kunz and Fischer, 2012). The BLIS project was the first major demonstration by multiple software vendors to create an integrated set of project design models based on a shared IFC-based architectural model (Kunz and Fischer, 2012).
Computer applications generated most of the paper documents such as the project schedule which is the output of a scheduling program, and drawings which are the output of a CAD program (Kunz and Fischer, 2012). However, the discrete paper based documents do not help integration of different disciplines and making even simple changes requires hours to days to make the initial change, print and review the updated documents and do even simple updates to related documents of functionally related disciplines (Kunz and Fischer, 2012). In addition, the format of today’s paper document is often difficult for diverse stakeholders to understand: for example, users can rarely make meaningful comments about 2D architectural drawings or Gantt charts (Kunz and Fischer, 2012).
Virtual Design and Construction (VDC)
Client/Business Objectives Figure 3-2: Virtual Design and Construction (VDC) ( source: (Fischer et al., 2012)t
On the other hand, BIM focuses on the building elements of the VDC model, see figure 3-2, which are useful but limiting because management issues usually involve building –organization-process interactions (Kunz and Fischer, 2012). BIM today is enabling many AEC professionals to improve performance. However, even using best BIM practices, projects do not normally model, visualize or analyze the organization and process accurately and effectively, and methods to manage and communicate multidisciplinary information and processes remain ad-hoc (Kunz and Fischer, 2012).
ICE BIM Process
Client/Business Objectives
Project Objectives

22
iRoom in VDC Inexpensive computers and large, high definition and inexpensive projection devices enable social sharing of VDC computer models, and the modeling, simulation and applications are now powerful and affordable (Kunz and Fischer, 2012). CIFE created an interactive workspace called iRoom in which it can be used to point out and graphically represent the relationships between the different tasks that have to be accomplished in the planning and design process of a building (Fischer et al., 2004).
Figure 3-3: iRoom in CIFE (source, (Fischer et al., 2004))
iRoom provides three interactive, wide screens that display with projectors, see figure 3-3. These wide screens display a number of different applications with their project views of the overall model simultaneously. A major advantage with iRoom is that engineers can work and collaborate within a meeting environment with the applications they are used to, and contribute and work with a shared project model (Fischer et al., 2004).
3.3. Previous Studies on Business Aspect Clients will only pay more for something if they perceive that it has greater value, and the values of BIM models
to clients, for now, can be difficult to demonstrate as hypothetical future benefit.
(Smith and Tardif, 2009)
The reason to implement a new technology is to increase productivity and efficiency across the entire lifecycle of a building. The current business idea is to construct faster, cheaper and with higher quality. Smith and Tardif (2009) believe that an investment should increase productivity, increase the quality of goods and services produced, reduce operating costs, and increase profits; otherwise it does not meet the definition of a technological advancement and should not be deployed (Smith and Tardif, 2009).
On the other hand, the AEC has an approach to BIM from a cost perspective rather than an investment. According to Smith and Tardif (2009) the perception through BIM as a cost rather that as an investment is problematic. The reason is that this perception leads many

23
firms to put less effort into measuring the return on investment in BIM in order to recognize that the cost of BIM is only a small fraction of the total investment in BIM (Smith and Tardif, 2009).
During the literature survey on the previous studies, it is found that there are several methods that analyze the BIM from an investment perspective. The most prominent of them are: return on investment analysis, PENG model, and the Total Economic Impact (TEI) model. ROI analysis is done by CIFE over several projects of Holder Construction, by Giel et al. (2009) as comparative study, and by Autodesk Revit to calculate first year ROI for design activities. The PENG model is used by (Jongeling, 2008) in the Swedish construction industry to calculate savings resulting from the use of BIM. TEI model is another method used by CIFE to reveal the impact of using VDC over the whole company and to determine the payback time of the system.
Studies have different approaches to analyze the business aspect of BIM. ROI analysis done by CIFE over projects run by Holder Construction in USA measures ROI continuously over ten projects that implemented BIM, calculates their ROI and quantifies benefits into savings. Another method is to make a comparative study (Giel et al., 2009) in which two similar projects’ (one with-BIM and another without-BIM) records are compared to reveal the impact of BIM on ROI. Furthermore, Autodesk Revit also provide the model to calculate the first year calculation of ROI considering software cost, labor cost, productivity loss, productivity gain, and training time. Jongeling (2008) used the PENG model to quantify the benefits of BIM via a study on 5 construction projects in several years. Center for Integrated Facility Engineering from Stanford University usually use Total Economic Impact (TEI) to make the benefits of VDC explicit. This method is more based on the payback time for the investment done on BIM/VDC. Furthermore, McGraw-Hill Construction also publishes annual reports in order to reveal the ROI of BIM. The results are qualitative and more based on the survey and interviews from the wide range of respondents in the AEC industry.
3.3.1. ROI Analysis The return on investment analysis is one of the many ways to evaluate a proposed investment. It compares the gain anticipated (or achieved) from an investment against the cost of the investment (i.e. ROI = earning/cost) (Azhar, 2011).
Two-thirds of BIM users say that they see positive ROI on their overall investment in BIM according to a survey done by McGraw Hill construction (McGraw-Hill-Construction, 2009). Almost half of the users (48%) measure ROI on at least a moderate level (McGraw-Hill-Construction, 2008). Users who measure the ROI focus on six key factors which are (McGraw-Hill-Construction, 2008):
• improved project outcomes such as reduced request for information-RFIs2 and field coordination problems,
2 RFIs - Request for Information: “In most Construction Documents, it is inevitable that the agreement, drawings, and specifications will not adequately address every single matter. There may be gaps, conflicts, or subtle ambiguities. The goal of the Request For Information (RFI) is

24
• better communication through 3D visualization, • productivity improvement of personnel, • positive impact of winning projects, • lifecycle values of BIM, • initial cost of staff training
Holder Construction in 2006 has continuously measured the ROI based on the tracking of construction clashes discovered in Autodesk NavisWorks on 10 BIM assisted projects, shown in the table 3-1 (Azhar, 2011). Results from the projects ranged from 229% to 39 900% which are quite high figures, see table 3-1. The reason for such a high interval is the varying scope of BIM in different projects. The BIM savings were measured by using “real” construction phase “direct” collision detection cost avoidance in some of the projects. However in some other projects, BIM savings were measured by using “planning” or “value analysis” phase cost avoidance. Furthermore, the indirect, design, construction, administrative or other cost savings were not included into calculations. So, the actual BIM ROI can be higher than the figures reported in the table below (Azhar, 2011).
year Cost ($M)
Project BIM Cost ($) Direct BIM Savings ($)
Net BIM Savings ($)
BIM ROI (%)
2005 30 Ashley Overlook 5.000 135.000 130.000 2600% 2006 54 Progressive Data Center 120.000 395.000 275.000 229% 2006 47 Raleigh Marriott 4.288 500.000 495.712 11560% 2006 16 GSU Library 10.000 74.120 64.120 641% 2006 88 Mansion on Peachtree 1.440 15.000 13.560 942% 2007 47 Aquarium Hilton 90.000 800.000 710.000 789% 2007 58 1515 Wynkoop 3.800 200.000 196.200 5163% 2007 82 HP Data Center 20.000 67.500 47.500 238% 2007 14 Savannah State 5.000 2.000.000 1.995.000 39900% 2007 32 NAU Science Lab 1.000 330.000 329.000 32900%
Table 3-1: A sample of Holder Construction’s BIM ROI (source: CIFE, 2007 in Azhar, 2011)
In the Journal of Building Information Modeling, (Cannistraro, 2010) analyzes a case study in his article to reveal the economic aspect of using BIM. According to the article, a project run by Boston-based mechanical construction firm J.C Cannistraro LLC achieved 10-20 percent of the project’s finance savings through the use of collaborative BIM. In this case the firm used the number of change orders3 as determinant factors to measure how it affects the budget of particular projects comparing the use of 2-D, 3-D lonely BIM (lonely BIM is building models for internal use only) projects and collaborative BIM projects. By achieving a project team embracing collaboration and high level of BIM use, it is possible to have significant cost savings (Cannistraro, 2010). By the use of collaborative BIM, it also helps a project team to recognize costly errors during pre-construction that results in additional time savings and money for the owner. to act as a partnering tool to resolve these gaps, conflicts, or subtle ambiguities during the bidding process or early in the construction process to eliminate the need for costly corrective measures” (ACEC-American Council of Engineering Companies (electronic) 09-01-2012).
3 “A change order is a written agreement between the client and the general contractor to change a building construction contract. Change orders add to, delete from, or otherwise alter the work set forth in the contract documents at the time that the construction contract was bid. As the legal means for changing contracts, change orders are standard in the construction industry “(The Mississippi Legislature, electronic, 09-01-2012).

25
3.3.2. Comparative studies by Giel et al. (2009) It is also possible to measure ROI by comparing two similar projects: one without BIM and another with BIM. (Giel et al., 2009) from Florida University have done studies over several projects through comparative studies. The methodology followed there was to derive data from RFI and change order logs supported with interviews provided by a mid-sized general contractor (GC). The chosen software platform was Autodesk Revit Architecture, Structure, and MEP. Selected projects were called Project A and C (without BIM) and project B and D (BIM-assisted). Projects were comparable in terms of size, scope, contract value, delivery method, and construction type; see appendixes A, B.
ROI calculation of project A and C were based on analysis of what BIM preventable conflicts occurred and their associated direct and indirect costs.
Direct costs that were preventable by BIM on project A and C included:
• Subcontracting out the task • Change orders
Indirect costs of schedule overruns associated with BIM preventable issues were based on four major cost categories.
1. Daily cost of the contractor’s general conditions 2. Daily costs for developer administration based on the contract size 3. Daily costs of the architect’s contract administration based on the contract size 4. Daily costs of interest on the owner’s construction loan
The calculated ROI for project A and project C were used as model rubric for the measurement of BIM-assisted project B and project D, see appendixes A,B. Due to a lack of recorded data on the direct costs avoided in project B, its ROI was estimated based solely on indirect costs.
3.3.3. ROI with Autodesk Revit Autodesk developed a calculation model to reveal first year ROI of BIM products applied to design activities. The analysis identifies areas such as training and system cost where spending and savings make the most sense (Autodesk, 2012).
In calculating ROI for a design system, Autodesk finds it relevant to consider not only the cost of the system but also the changes in user productivity. When a new system is purchased there is an immediate down in productivity as the users get up to speed with the system. Later on by time and training, the productivity curve climbs up as it can be seen from figure 3-4 (Autodesk, 2012).

26
Figure 3-4: Design investment and productivity Curve (Source: Autodesk 2012)
The first year ROI for a system is then calculated according to the formula, see equation 1, considering the system cost, labor, training, and productivity changes, see also appendix C.
Equation 1: The formula for the first year ROI calculation (Source: Autodesk 2012).
The variables used in the formula are:
• A= cost of hardware and software ($) • B= monthly labor cost ($): in the design world, the monthly labor cost is usually
defined as Direct Personnel Expense (DPE) which is the hourly wage of an employee plus 30-40 percent to account for benefits and other employee specific overheads.
• C= training time (months) • D= productivity lost during training (%) • E= productivity gain after training (%)
The denominator represents the cost or investment that consists of cost of the system (A) and the cost of the productivity loss, in terms of labor cost, as the user learns how to use the system (BxCxD). The numerator shows the earnings which is the increase in human productivity.

27
Autodesk also runs a sensitivity analysis to measure the impact of each variable on the ROI, see table 3-2.
Variable Range Impact on ROI average A System Cost $ 4 000 $ 6 000 $ 8 000 72 - 50% B Monthly DPE $ 8 400 $ 4 200 $ 2 100 81 - 50%
C Training time (months) 1 3 6 83 - 40% D Productivity loss 25% 50% 100% 115 - 25%
E Productivity gain 50% 25% 0% 102 - 0% Table 3-2: Sensitivity Analysis (Source: Autodesk, 2012)
Results from sensitivity analysis show that productivity loss and productivity gain have the greatest impact on ROI. However, the system cost has least effect on ROI.
3.3.4. PENG Model for quantifying the benefits of BIM Jongeling (2008) made a study to quantify the benefits of BIM by using PENG model. PENG is a method used to analyze the outcome of planned, ongoing or already done investments. PENG is a Swedish abbreviation “Prioritering Efter NyttoGrunder” that means “prioritizing based the contribution of benefits”. Jongeling (2008) used interviews with respondents to measure the effect of BIM on the construction sub-process (Jongeling, 2008). He measured the benefits according to the results derived from the respondents.
The PENG model is the method which makes it possible to quantify the benefits from an investment perspective. On the other hand, the calculations that are based on solely respondents’ assumptions can decrease the level of reliability of the outcomes as well.
Jongeling (2008) also made a calculation that takes into account life cycle costs that make an assessment of potential savings. Based on the fact that the design and construction process together account for only 5% of the total life cycle costs (Romm, 1994 in Jongeling, 2008), the remaining 95% is for the operation and maintenance, and half of the energy consumption. As an illustrative example, to apply the figures for a 1% saving by BIM in a project with 127 MSEK and 2 400 MSEK in life cycle cost resulted in a 24MSEK saving in total, see Table 3-3. And if the saving using BIM could be 5%, then the total cost that is saved is around 121MSEK.
Construction cost
Lifecycle cost Saving
% Total % total Energy Other % Total % Energy % Other 5% 127 95% 2 414 1 207 1 207 1% 24,14 1% 12,07 1% 12,07 5% 127 95% 2 414 1 207 1 207 5% 120,7 5% 60,35 5% 60,35
10% 127 90% 1 144 572 572 1% 11,44 1% 5,72 1% 5,72 10% 127 90% 1 144 572 572 5% 57,2 5% 28,6 5% 28,6 20% 127 80% 508 254 254 1% 5,08 1% 2,54 1% 2,54 20% 127 80% 508 254 254 5% 25,4 5% 12,7 5% 12,7
Table 3-3: Potential savings considering Life Cycle cost

28
3.3.5. Total Economic Impact Center for Integrated Facility Engineering uses Total Economic Impact to make value proposition for the VDC. The method makes value proposition explicit and quantitative, not just the costs, and it establishes quantitative assumptions and specific measurable objectives for business performance that responsible parties track and manage to achieve (Kunz and Fischer, 2012).
Total Economic Impact Rate Baseline(K$) change Year-1($K) Revenue 100 000 2,0% 102 000 Cost of contracted work 85% 85 000 -2,0% 84 660 Cost of self-performed work 10% 10 000 2,0% 12 240 Gross Margin 5 000 5 100 Sales, G&A 2% 2 000 2 040 IT investment 70 Amortized costs of IT/yr. 33% 23 Net income 3 000 3 037 Time to payback (years) 1,9 Net Income change (%) 1,2%
Table 3-4: Simple TEI model (Source (Kunz and Fischer, 2012) )
Table 3-4 is a simple TEI model applied to a simple pro forma financial summary of a representative general contractor (GC). This model assumes typical revenue, costs of business and relatively comfortable baseline net income for a typical GC. With the assumptions given, following the investment, the company must both predict and commit to increasing revenue by at least 2%, reducing cost of contracted work at least 2% and increasing cost of self-performed work no more than 2%. The team making this commitment constitutes the coalition in favor of the innovation. If the team makes its numbers, the investment will pay for itself in slightly less than two years (Kunz et al, 2012).

29
Cost for Implementing basic VDC iRoom hardware PC 2 500 4 10 000 Projector 3 000 3 9 000 Smart Board 2 000 3 6 000 installation 2 000 1 2 000 Software 4D 10 000 1 10 000 CIFE infrastructure 0 1 0 MS Project 1 000 1 1 000 Organization Model 10 000 1 10 000 Training(days) 2 500 4 10 000 Internal staff development 500 20 10 000 Total 68 000 Budget($) 70 000
Table 3-5: Representative costs to implement basic VDC (source (Kunz and Fischer, 2012)).
The figures in the table 3-5 are representative costs to implement basic VDC capabilities in a company. These costs assume purchase of three-screen iRoom, such as that shown in Table 3-5, purchase of 4D and organizational modeling software at certain assumed prices, some staff time, and availability of good CAD modeling software. The cost of $70 000 is the bottom line for investment in deploying VDC for TEI model.
4. Analysis/Results/Discussions
4.1. Previous studies The analysis and findings from previous studies provides a fundamental framework to create a model for the ROI calculation in the case study project. The strength and weakness of each method are discussed, and they are all integrated in order to generate an ideal model for ROI calculation.
4.1.1. Holder construction records: The ROI calculation in this method is based on data collection of 10 projects run by Holder Construction in USA, see table 4-1. The range in ROI varies due to different scopes of BIM in different projects. The calculation is based on direct cost measured from clash detection during the construction phase or planning phase by doing value analysis to estimate cost avoidance.

30
year Cost ($M)
Project BIM Cost ($) DirectBIM Savings ($)
Net BIM Savings ($)
Cost of BIM (%)
Savings/ Cost
BIM ROI (%)
2005 30 Ashley Overlook 5.000 135.000 130.000 0,02% 0,45% 2600% 2006 54 Progressive Data Center 120.000 395.000 275.000 0,22% 0,73% 229% 2006 47 Raleigh Marriott 4.288 500.000 495.712 0,01% 1,06% 11560% 2006 16 GSU Library 10.000 74.120 64.120 0,06% 0,46% 641% 2006 88 Mansion on Peachtree 1.440 15.000 13.560 0,00% 0,02% 942% 2007 47 Aquarium Hilton 90.000 800.000 710.000 0,19% 1,70% 789% 2007 58 1515 Wynkoop 3.800 200.000 196.200 0,01% 0,34% 5163% 2007 82 HP Data Center 20.000 67.500 47.500 0,02% 0,08% 238% 2007 14 Savannah State 5.000 2.000.000 1.995.000 0,04% 14,29% 39900% 2007 32 NAU Science Lab 1.000 330.000 329.000 0,00% 1,03% 32900% Average 0,06% 2,02%
Table 4-1: Holder Construction records over its 10 projects. Source CIFE, 2007 in (Azhar, 2011)
The weakness in the model is that it does not include indirect savings. If indirect, design, construction, or owner administrative or other “second wave” savings also are put into calculations then the figures would be even higher (Azhar, 2011). The BIM cost in table 4-1 is not specified and explained in detail in the study. That is, it is not clear what the cost comprises. So, cost of BIM in percentage of cost of project is added as a new column to table 4-1 to see relation between them. Through 10 projects it can be seen that the average cost of BIM is 0, 06% of the cost of the project and the average saving is 2, 02% of cost of project. The important finding is that the cost of BIM over the project cost significantly differs from the assumption made in the study done by (Giel et al., 2009), see 4.1.2. The assumption for the cost of BIM is 0, 5% of project cost on average, see 4.1.2. Therefore it can be said that the average 0, 5% is a quite a lot higher compared to findings in this method.
4.1.2. Comparative studies by Giel et al. (2009) Studies were based on comparison between two similar projects in terms of size, scope, contract, delivery method, and construction type. One of the projects was with BIM and another one was without BIM. For detailed ROI calculation see appendix A, B. ROI calculation was based on what BIM preventable conflicts occurred and their associated direct and indirect costs.
In this method, the cost of BIM is roughly taken as 0, 5% which seemed not to be a reliable assumption considering the figures of Holder Construction, see 4.1.1. Both this study and the study on Holder Construction revealed no information on the following cost categories:
• Hardware and Software • Training • Developing process • Interoperability solutions • Developing custom 3D libraries • Consultant Hiring
In addition, unquantifiable parameters could be considered. Unquantifiable parameters were presented from the Smart Market report done by (McGraw-Hill-Construction, 2009). To improve the model in the future, the focus should be more on unquantifiable parameters to calculate ROI as it is stated also by (Jongeling, 2008).

31
The unquantifiable parameters:
• Visualization • Productivity Improvement • Process improvement; such as reduced rework and field coordination problems • Competitive advantage • Communication and collaboration improvements • The summary of ROI calculation for project A and B can be seen from table 4-2. The
saving calculation for project B is based on solely the schedule improvement and subcontracting out panel shop drawings. The ROI varies from 36,7% to 16,2% for project A and project B respectively. Detailed calculations can be seen from appendix A and appendix B.
Project A (No-BIM)
Project B (BIM-Assisted)
Total Estimated Savings $48 723 $51 365 Cost of BIM(0,5% of contact value) $35 640 $44 220 Net BIM savings $13 083 $7 145 ROI 36,7% 16,2%
Table 4-2: Project A vs. Project B
The obvious fact that can be seen from this method is that a project with BIM can save a remarkable cost which can be seen from tables above. As a result ROI differs between 16% - 1654% based on the scale and size of a project with the use of BIM/VDC; see table 4-2 and table 4 – 3. It also showed that it is possible to reduce RFIs, fewer change orders, and reduced project delay.
Project C (No-BIM)
Project D (BIM-Assisted)
Total Estimated Savings $3 662 009 $887 700 Cost of BIM(0,5% of contact value) $208 788 $222 000 Net BIM savings $3 453 221 $665 700 ROI 1 653,9% 299,9%
Table 4-3: Project C vs. Project D
4.1.3. Autodesk Revit ROI analysis
Another study is done by Autodesk Revit (Autodesk, 2012) to show the first year ROI of its product. Comparing to other methods it is the weakest one since it analyzes only the design phase and only for the first year. On the other hand, it helps to understand how the profitability of a system can be measured through some parameters. The parameters used are:
• The cost of hardware and software • Monthly labor cost • Productivity lost during training

32
• Productivity gained after training
The model developed by Autodesk is relevant to simply understand the financial concept of return on investment and to learn how to calculate the first-year ROI for a technology investment. However, the model needs to be developed more to be able to capture the whole project process. A sample calculation can be seen in Appendix C.
4.1.4. The PENG Model The PENG model among all is the method which penetrates into more details of project processes, and focuses on each of the sub processes and stakeholders to measure the savings done by BIM. So, to calculate savings in the case study, the most appropriate model to use is the PENG model since the model already has built strong assumptions and findings that are based on interviews, meetings and surveys with wide range of respondents from the Swedish AEC industry (Jongeling, 2008).
The model is quite successful in terms of qualitative results of BIM since it reveals the opinion about each of the sub processes, and actors how they are affected by the system and the benefits they get from the system. In calculating the saving, the model takes both direct and indirect savings into consideration. However it does not put the indirect cost of schedule overrun or saving by schedule improvement into the calculation. Therefore it decreases the quality of the model. It could be better to consider them also to have a more significant result. In addition, the model does not handle any issue for the cost of BIM system. In calculating case study figures, the PENG model is integrated with the ROI calculation model used in comparative study, see 4.1.2. The cost of BIM/VDC is also calculated more precisely and put in the model drawing from TEI model, see 3.3.5. Furthermore, the schedule improvement in the case study is also determined and calculated into the saving in the integrated model.
4.1.5. Total Economic Impact Total Economic Impact method is mostly used by CIFE to track the value proposition of implementing VDC to construction projects. In this model, it is essential to make assumptions for the revenue, costs and baseline net income for the general contractor. Then it becomes possible to find out payback time for the investment done. However, it follows a different pattern comparing to previous methods. With this method, it is not possible to have detailed cost savings calculations stem from direct and indirect savings.
On the other hand, through this method it is possible to have representative costs to implement basic VDC capabilities in a company. These costs assume the purchase of three-screen iRoom, which includes purchase of 4D and organizational modeling software at certain assumed prices, some staff time, and availability of good CAD modeling software.

33
5. Developing a Financial Model for ROI calculation The financial model is developed based on the parts of all the methods analyzed in the previous section, see 4.1. In other words, the model is generated by integration of the methods to provide a framework in which the variables are formulized to achieve a more reliable and rational result for ROI calculation. Three methods that have been the base for the framework are; the PENG model, comparative approach calculations, and TEI model iRoom, see figure 5-1. The important part of the calculation is to estimate savings. In PENG model the savings calculations are done in detail for each sub process of a construction project. The formulization of how to calculate schedule overrun or early completion is taken from the comparative study. Besides, the cost calculation of iRoom in TEI model will provide a more precise estimation for the model to consider the cost of BIM/VDC.
Figure 5-1: The evaluation of financial model for ROI of BIM
The PENG model calculation consists of three main parts which can be seen from figure 5-2. Design and construction calculation considers the actors and activities done during the project phases and provides assumptions of how much the BIM/VDC affected the process.
Figure 5-2: PENG Model
Integrated Model
TEI, iRoom
Comp. ROI
PENG
PENG Model
Calculations
Project Development
Savings
Desing and Construction
Savings
Change Order Savings

34
Comparative study calculation consists of three main parts, see figure 5-3. The Indirect savings calculation part is going to be used as a part of the financial model.
Figure 5-3: Comparative study for ROI analysis
The development of the financial model is mainly based on the saving calculations. So, the PENG model that is used and adopted to the construction industry by (Jongeling, 2008) plays a crucial role in the integrated model. The template to calculate saving from the PENG model can be seen from table 5-1. This template is used to calculate case study savings, see 6.2. The table starts with basic information of how much the cost of construction (excluding purchase of land and value added taxes, VAT), total development cost, and total design construction cost is. Then the detail of the project’s development phase is presented. Here the cost for several activities can be seen such as architecture, structural, HVAC consultant, electrical (EL) consultant, sale and visualization, calculations and other costs. This phase is also called “System Handling (SH)”. The design and construction part, on the other hand, is called “Bygg Handling (BH)”. Here the activities are the works of architecture, structural, HVAC consultant, EL consultant, calculations and quantifying, installation of works, and others. Change order calculations consist of three parts that come from installation, painting, material base and additional work. The final part is the summary table which puts together all savings calculated from each part, see table 5-1.
Comparative ROI
Calculation
Direct Savings
Indirect Savings
ROI Summary

35
PENG Model
Construction cost (excluding VAT and the purchase of land) Project Development Cost Total Contract Project Development Cost Saving Motivation
Design - SH (System Handling) Arkitekt-Architect
Konstruktör-Engineer VVS-konsult – HVAC Consultant
EL-konsult – EL consultant Försäljning: visualisering – Sale and visualization Kalkyl & Mängdning – Calculation & Quantifying
Övriga byggherrekostnader – Other costs total Design and construction Cost Saving Motivation
Design BH Arkitekt-Architect
konstruktör-Engineer VVS-konsult – HVAC Consultant
EL-konsult – EL Consultant Kalkyl & Mängdning - Calculation& Quantifying
UE VVS – HVAC sub-contractor UE EL – EL sub-contractor
UE målning & kompl.-Painting&complemantary sub-contractor UE blandade -Mixed sub-contractor
UE mark- Earthwork, Excavation, Landscape Sub-Contractor Byggnadsmaterial: bas- Building Material base
Varor: sammansatta –Goods: Composite Arbetskostnader-Labor costs
Tjänstemän & gemens.-Officials community Etablering, m.m-Establishment
Admin+Vinst+Risk – Admin+Win+Risk Total Change Order (CO) Costs- (ÄTA) Cost Saving Motivation
ÄTA UE installation –CO installation ÄTA UE målning – CO painting sub-contractor
Material bas: spill-Material base:Overflow Extra arbete Entr. – Extra work
total Summary Savings
From Proj. Dev. - kr From Turnkey Contract - kr From Change Order(ÄTA) - kr
Total savings including reduction costs - kr Table 5-1: PENG Model template used for the Financial Model to calculate ROI

36
The savings calculation template developed from the PENG model is shown in table 5-1. As it can be seen from the table, there are four main parts: project development, design and construction, change order costs and summary table. The saving calculation is based on how much motivation is achieved by use of BIM/VDC for each sub process of a construction project. The motivation figures are based on assumptions done in the study by (Jongeling, 2008) over several projects for several years and from a variety of actors from industry running projects with BIM/VDC.
Financial Model for Return On Investment Analysis Cost of BIM
Cost of iRoom
Total
Estimated Savings
Direct Costs
PENG Model total savings
Indirect Costs
Estimated improved schedule
Daily cost of contractor time overrun(General conditions)
Daily cost of 5% interest on construction loan for time overrun
Daily cost of developer administration for time overrun
Estimated cost of architect's contract administration for time overrun
Total - kr
ROI Analysis Total Estimated Savings 0 kr
Total Cost of BIM 0 kr
Net BIM savings 0 kr
ROI Table 5-2: Financial model for ROI of BIM
Financial model for return on investment analysis in table 5-2 is the summary table of all calculations including savings from PENG model, indirect savings from schedule improvement, and cost of BIM/VDC. Table 5-2 is the final template for ROI analysis from a general contractor perspective.

37
6. Case Study – The ALFA Residential Project This thesis uses ALFA Residential Project which is a project completed by Veidekke Construction AB with implementing VDC, see figure 6-1. The ROI of the project with VDC/BIM application is calculated in the integrated model based on the PENG model and the ROI calculation model used in the comparative studies. The case study figures are collected with the project manager, production manager and design manager via several meetings, interviews, and e-mail communication.
Figure 6-1: Visualization of ALFA Project with BIM/VDC
Through the case study, the thesis evaluates the beneficial effects and calculates savings. From 6.2 direct savings calculations resulted by use of VDC can be seen. The project’s savings consists of project development phase, design and construction phase, change order calculations and schedule improvement. The assumptions showing the effect of VDC on each variable are based on the PENG model and have been developed together with managers during the meetings. The assumptions are considered to be conservative to keep clarity of the calculations.
6.1. Meetings Meetings provided fundamental improvement for the thesis. From meeting together with managers from different divisions, lots of issues are revealed and discussed. First of all, it is observed that quantifying the benefits in projects that VDC/BIM is implemented is new for Veidekke (Meeting, 2012). Therefore to see the effect of the new system over their projects would enable them to evaluate the system and have a better motivation (Meeting, 2012). The company’s way of working is also presented via meeting. The point where VDC/BIM activities took place heavily is during the design phase (Meeting, 2012). Veidekke outsources all design works, and the design manager steers all consultants. Then all the works done by consultants are put into the model via Autodesk Naviswork by VDC engineers. Then during integrated concurrent engineering (ICE), all the models analyzed and activities such as clash
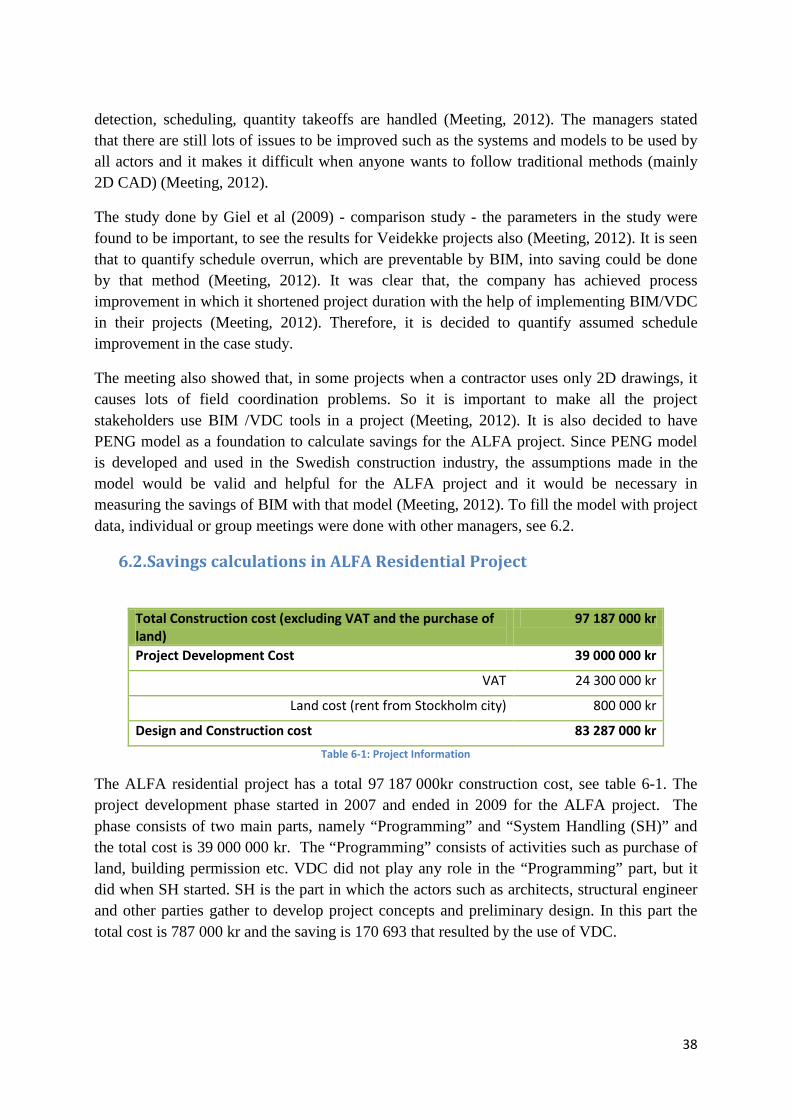
38
detection, scheduling, quantity takeoffs are handled (Meeting, 2012). The managers stated that there are still lots of issues to be improved such as the systems and models to be used by all actors and it makes it difficult when anyone wants to follow traditional methods (mainly 2D CAD) (Meeting, 2012).
The study done by Giel et al (2009) - comparison study - the parameters in the study were found to be important, to see the results for Veidekke projects also (Meeting, 2012). It is seen that to quantify schedule overrun, which are preventable by BIM, into saving could be done by that method (Meeting, 2012). It was clear that, the company has achieved process improvement in which it shortened project duration with the help of implementing BIM/VDC in their projects (Meeting, 2012). Therefore, it is decided to quantify assumed schedule improvement in the case study.
The meeting also showed that, in some projects when a contractor uses only 2D drawings, it causes lots of field coordination problems. So it is important to make all the project stakeholders use BIM /VDC tools in a project (Meeting, 2012). It is also decided to have PENG model as a foundation to calculate savings for the ALFA project. Since PENG model is developed and used in the Swedish construction industry, the assumptions made in the model would be valid and helpful for the ALFA project and it would be necessary in measuring the savings of BIM with that model (Meeting, 2012). To fill the model with project data, individual or group meetings were done with other managers, see 6.2.
6.2. Savings calculations in ALFA Residential Project
Total Construction cost (excluding VAT and the purchase of land)
97 187 000 kr
Project Development Cost 39 000 000 kr
VAT 24 300 000 kr
Land cost (rent from Stockholm city) 800 000 kr
Design and Construction cost 83 287 000 kr Table 6-1: Project Information
The ALFA residential project has a total 97 187 000kr construction cost, see table 6-1. The project development phase started in 2007 and ended in 2009 for the ALFA project. The phase consists of two main parts, namely “Programming” and “System Handling (SH)” and the total cost is 39 000 000 kr. The “Programming” consists of activities such as purchase of land, building permission etc. VDC did not play any role in the “Programming” part, but it did when SH started. SH is the part in which the actors such as architects, structural engineer and other parties gather to develop project concepts and preliminary design. In this part the total cost is 787 000 kr and the saving is 170 693 that resulted by the use of VDC.
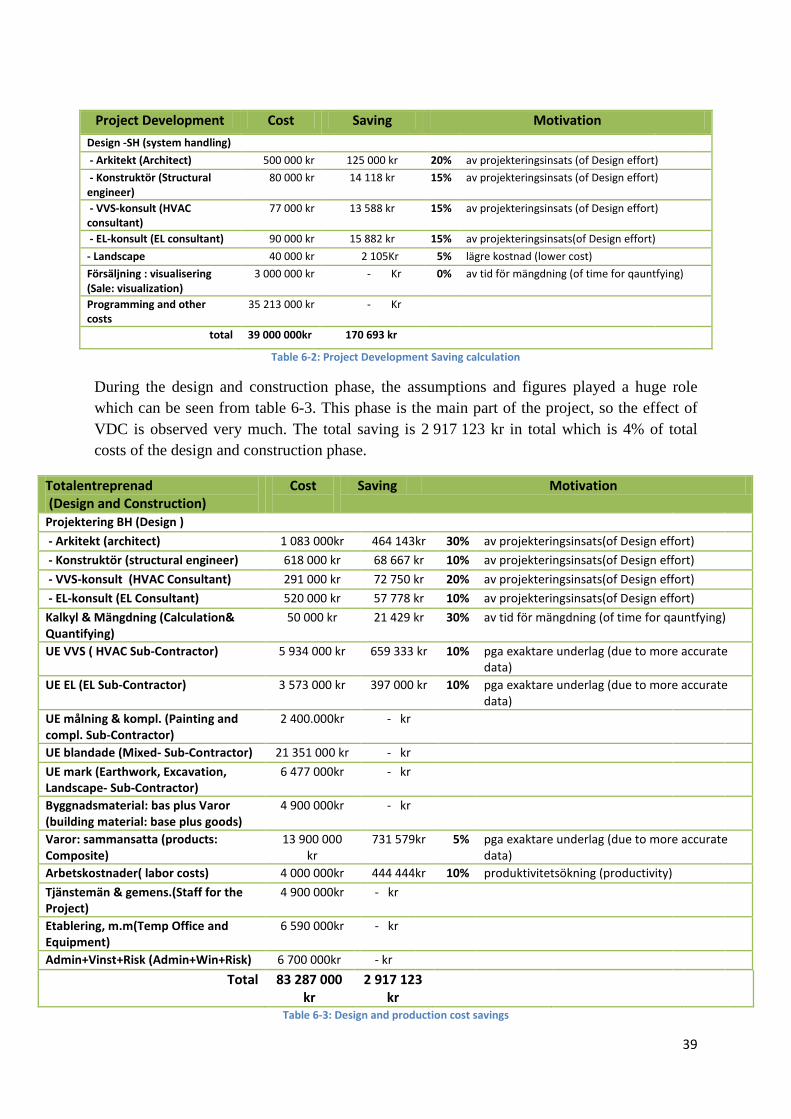
39
Project Development Cost Saving Motivation Design -SH (system handling)
- Arkitekt (Architect) 500 000 kr 125 000 kr 20% av projekteringsinsats (of Design effort) - Konstruktör (Structural engineer)
80 000 kr 14 118 kr 15% av projekteringsinsats (of Design effort)
- VVS-konsult (HVAC consultant)
77 000 kr 13 588 kr 15% av projekteringsinsats (of Design effort)
- EL-konsult (EL consultant) 90 000 kr 15 882 kr 15% av projekteringsinsats(of Design effort) - Landscape 40 000 kr 2 105Kr 5% lägre kostnad (lower cost) Försäljning : visualisering (Sale: visualization)
3 000 000 kr - Kr 0% av tid för mängdning (of time for qauntfying)
Programming and other costs
35 213 000 kr - Kr
total 39 000 000kr 170 693 kr
Table 6-2: Project Development Saving calculation
During the design and construction phase, the assumptions and figures played a huge role which can be seen from table 6-3. This phase is the main part of the project, so the effect of VDC is observed very much. The total saving is 2 917 123 kr in total which is 4% of total costs of the design and construction phase.
Totalentreprenad (Design and Construction)
Cost
Saving Motivation
Projektering BH (Design ) - Arkitekt (architect) 1 083 000kr 464 143kr 30% av projekteringsinsats(of Design effort) - Konstruktör (structural engineer) 618 000 kr 68 667 kr 10% av projekteringsinsats(of Design effort) - VVS-konsult (HVAC Consultant) 291 000 kr 72 750 kr 20% av projekteringsinsats(of Design effort) - EL-konsult (EL Consultant) 520 000 kr 57 778 kr 10% av projekteringsinsats(of Design effort) Kalkyl & Mängdning (Calculation& Quantifying)
50 000 kr 21 429 kr 30% av tid för mängdning (of time for qauntfying)
UE VVS ( HVAC Sub-Contractor) 5 934 000 kr 659 333 kr 10% pga exaktare underlag (due to more accurate data)
UE EL (EL Sub-Contractor) 3 573 000 kr 397 000 kr 10% pga exaktare underlag (due to more accurate data)
UE målning & kompl. (Painting and compl. Sub-Contractor)
2 400.000kr - kr
UE blandade (Mixed- Sub-Contractor) 21 351 000 kr - kr UE mark (Earthwork, Excavation, Landscape- Sub-Contractor)
6 477 000kr - kr
Byggnadsmaterial: bas plus Varor (building material: base plus goods)
4 900 000kr - kr
Varor: sammansatta (products: Composite)
13 900 000 kr
731 579kr 5% pga exaktare underlag (due to more accurate data)
Arbetskostnader( labor costs) 4 000 000kr 444 444kr 10% produktivitetsökning (productivity) Tjänstemän & gemens.(Staff for the Project)
4 900 000kr - kr
Etablering, m.m(Temp Office and Equipment)
6 590 000kr - kr
Admin+Vinst+Risk (Admin+Win+Risk) 6 700 000kr - kr Total 83 287 000
kr 2 917 123
kr
Table 6-3: Design and production cost savings
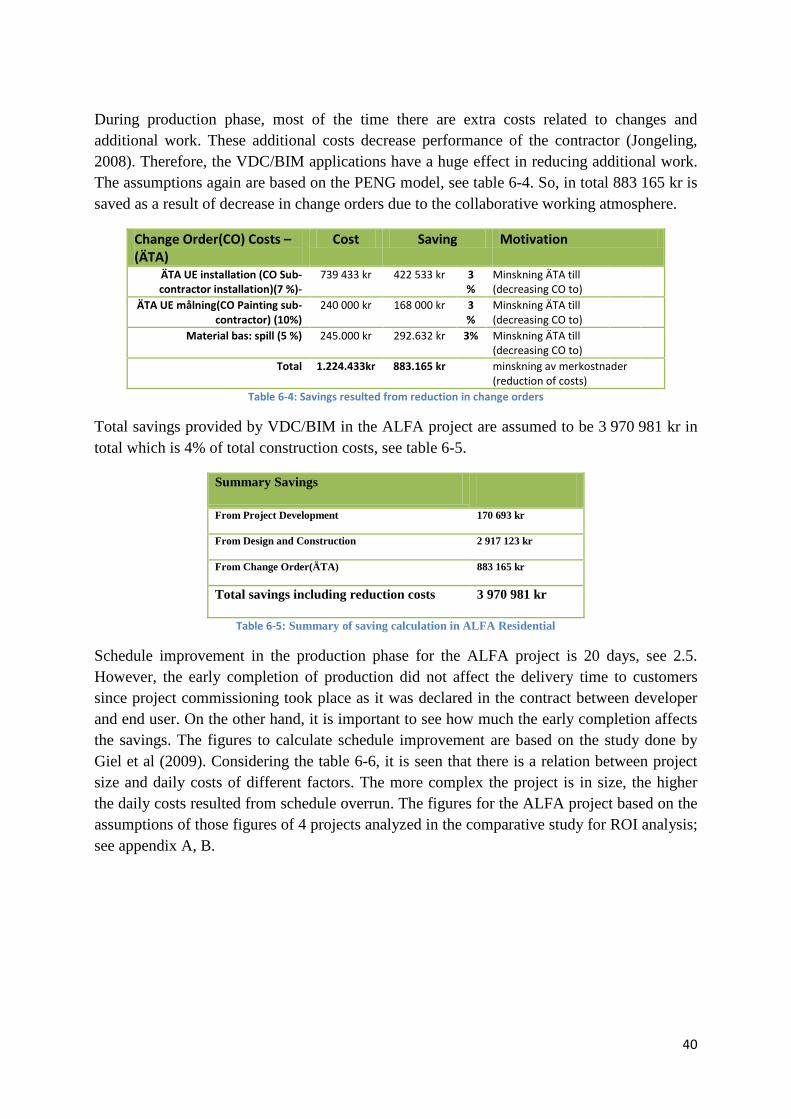
40
During production phase, most of the time there are extra costs related to changes and additional work. These additional costs decrease performance of the contractor (Jongeling, 2008). Therefore, the VDC/BIM applications have a huge effect in reducing additional work. The assumptions again are based on the PENG model, see table 6-4. So, in total 883 165 kr is saved as a result of decrease in change orders due to the collaborative working atmosphere.
Change Order(CO) Costs – (ÄTA)
Cost Saving Motivation
ÄTA UE installation (CO Sub-contractor installation)(7 %)-
739 433 kr 422 533 kr 3 %
Minskning ÄTA till (decreasing CO to)
ÄTA UE målning(CO Painting sub-contractor) (10%)
240 000 kr 168 000 kr 3 %
Minskning ÄTA till (decreasing CO to)
Material bas: spill (5 %) 245.000 kr 292.632 kr 3% Minskning ÄTA till (decreasing CO to)
Total 1.224.433kr 883.165 kr minskning av merkostnader (reduction of costs)
Table 6-4: Savings resulted from reduction in change orders
Total savings provided by VDC/BIM in the ALFA project are assumed to be 3 970 981 kr in total which is 4% of total construction costs, see table 6-5.
Summary Savings
From Project Development 170 693 kr
From Design and Construction 2 917 123 kr
From Change Order(ÄTA) 883 165 kr
Total savings including reduction costs 3 970 981 kr
Table 6-5: Summary of saving calculation in ALFA Residential
Schedule improvement in the production phase for the ALFA project is 20 days, see 2.5. However, the early completion of production did not affect the delivery time to customers since project commissioning took place as it was declared in the contract between developer and end user. On the other hand, it is important to see how much the early completion affects the savings. The figures to calculate schedule improvement are based on the study done by Giel et al (2009). Considering the table 6-6, it is seen that there is a relation between project size and daily costs of different factors. The more complex the project is in size, the higher the daily costs resulted from schedule overrun. The figures for the ALFA project based on the assumptions of those figures of 4 projects analyzed in the comparative study for ROI analysis; see appendix A, B.

41
Projects Proj A Proj B Proj C Proj D Proj ALFA
Contract Value ($) $7 128 000 $8 844 073 $41 757 617 $44 400 000 $12 180 805
Contract Value (SEK) 48 741 707 kr 60 481 435 kr 285 585 189 kr
303 634 753 kr 83 287 000 kr
Daily cost of contractor time overrun(General conditions)
$855 $888 $5 425 $5 425 $1 000
Daily cost of 5% interest on construction loan for time
overrun
$976 $1 212 $5 720 $6 082 $1 500
Daily cost of developer administration for time
overrun
$446 $544 $2 466 $2 466 $750
Estimated cost of architect's contract administration for
time overrun
$149 $181 $822 $822 $300
Table 6-6: Daily costs of variables in case of schedule overrun (source: Giel et al 2009)
The figures assumed for the ALFA project were determined from a conservative approach to be on the safe side compared to four projects analyzed in table 6-6. Table 6-6 showed that the contract value of the ALFA project is between project B and project C. So the daily costs of factors in the ALFA project were determined to be in between but closer to project B, see table 6-6.
ALFA Project schedule improvement savings exchange rate early completion
$1 7 kr 20 days
Contract Value $12 180 805 83 287 000 kr Saving
Daily cost of contractor time overrun(General conditions)
$1 000 7 000 kr 140 000 kr
Daily cost of 5% interest on construction loan for time overrun
$1 500 10 500 kr 210 000 kr
Daily cost of developer administration for time overrun
$750 5 250 kr 105 000 kr
Estimated cost of architect's contract administration for time overrun
$300 2 100 kr 42 000 kr
Total Saving 497 000 kr
Table 6-7: Assumption on the figures for ALFA to estimate schedule improvement savings.
The calculation in the table 4-12 shows that 20 days of early completion resulted in 497 000 kr.

42
6.2.1. Cost of iRoom in the ALFA Project The cost of iRoom consists of purchase of hardwares, softwares, training cost and etc. Hardwares are items such as: PC, projector, smart board, white board. Softwares are the tools such as, Vico Office, Revit, Archicad and Naviswork. Furthermore, the training cost, fitout cost and other infrastructural IT cost are included. The total cost of iRoom is 535 000 kr as it is calculated in table 6-8.
iRoom Hardware PC for Smart board 5 000 kr Projector 5 000 kr Smart Board 40 000 kr Whiteboard (for Scheduling) 10 000 kr Software (Vico Office, Autodesk Revit, Archicad, Naviswork)
300 000 kr
Training 100 000 kr Furniture 75 000 kr IT (Switches, wires) 5 000 kr Total 535 000 kr Budget 535 000 kr
Table 6-8: The cost of iRoom for ALFA project
The cost of iRoom is 0, 55% of total construction cost. Comparing this figure to the assumptions derived from results of Holder construction and study of Giel et al, it is seen that this figure is higher than both, but closer to the latter. The study of Holder construction showed that the average cost was 0, 02% of total cost and Giel assumed 0,5% of total contract value for the cost of BIM. Furthermore, the iRoom is going to be used for future projects, which means that the cost can be separated over all projects using iRoom. Therefore, the cost share over the ALFA project will be less than 0, 55 % and fortunately the ROI of the project will be even higher.

43
6.2.2. Summary of calculations Considering all the savings and costs of VDC implemented in the ALFA project, it can be seen from table 6-9 that a total of 4 467 981 kr is saved and the return on investment via VDC is 735%. Considering the final savings, it can be said that in the ALFA project, 5% of total construction cost is saved.
Financial Model for Return On Investment Analysis Cost of BIM
Cost of iRoom ( 0,55 % of Construction Cost) 535 000 kr Total 535 000 kr
Estimated Savings From Direct Costs
PENG Model total savings 3 970 981 kr From Indirect Costs
Estimated improved schedule : 20 days early completion Daily cost of contractor time overrun(General conditions) 140 000 kr
Daily cost of 5% interest on construction loan for time overrun 210 000 kr Daily cost of developer administration for time overrun 105 000 kr
Estimated cost of architect's contract administration for time overrun 42 000 kr total saving from schedule improvement 497 000 kr
Total 4 467 981 kr
ROI Analysis Total Estimated Savings 4 467 981 kr
Total Cost of BIM 535 000 kr Net BIM savings 3 932 981
ROI 735% Table 6-9: ROI calculation of ALFA Project
Finally, the potential savings calculations are done considering lifecycle costs. According to assumptions made by Romm (1994, in Jongeling, 2008) design and construction cost is only 5% of total lifecycle costs. So the remaining 95% is for the operation and maintenance, and half of the energy consumption. The design and construction cost of the ALFA project is 97MSEK, so the life cycle cost is 1 843MSEK. When applying these figures to calculations, the result can be seen from table 6-10. That is to say, if a 1% saving by VDC/BIM in ALFA project can be saved, it results in 18,4MSEK potential savings in total. The calculations showed that ALFA projects saved 5% of total construction cost. Therefore, the potential saving is to be 92,2MSEK considering lifecycle cost.

44
Construction cost
Lifecycle cost Saving
% Total % total Energy Övrigt(other) % Total % Energy % Övrigt 5% 97 95% 1 843 922 922 1% 18,4 1% 9,2 1% 9,2 5% 97 95% 1 843 922 922 5% 92,2 5% 46,1 5% 46,1
10% 97 90% 922 461 461 1% 9,2 1% 4,6 1% 4,6 10% 97 90% 922 461 461 5% 46,1 5% 23,0 5% 23,0 20% 97 80% 461 230 230 1% 4,6 1% 2,3 1% 2,3 20% 97 80% 461 230 230 5% 23,0 5% 11,5 5% 11,5
Table 6-10: Potential savings considering lifecycle costs in ALFA Project.
6.3. VDC/BIM in design phase: It is widely known that poor design has a very strong impact on the level of efficiency of the project during the construction stage as well as the quality of the final product (Coates et al., 2010). The tools used during design phases varied for different purposes, see figure 6-2. Naviswork is used for visualization of the combined models and clash detection; Revit and Archicad are used when the designer showed their own models and the current progress of work (Interview, 2012a). For the documentation, Revit, Archicad and Magicad are used (Interview, 2012a).
Figure 6-2: VDC/BIM tools used in ALFA Project ( Source : (Sohlenius and Söderberg, 2012)
Vico Office was used for cost analysis and quantity takeoff. Scheduling, material order and fabrication were done by Vico Office together with Excel. The interesting finding was that there was no tool to check code review such as legal requirements and fire regulations. Code review also should be integrated into the VDC/BIM for improvement in its implementation.
The interview showed that lots of benefits were achieved using VDC/BIM tools. Clash detection provided better communication between consultants (Interview, 2012a). Progress errors in design became more visible and clearer. Reduced amount of reworks are achieved. Higher quality in documentation is provided. There is less revision in drawings, and the design process becomes more efficient in terms of communication, coordination, time, cost
Navis
ArchiCad
Revit
MagiCad
Vico Office

45
and quality compared to previous projects in which BIM/VDC was not deployed (Interview, 2012a).
It is also revealed that there are still some problems generated from software. The interviewee claimed that sometimes software may not work properly, which is a case of maturity in the modeling that needs to be focused on and solved (Interview, 2012a). Furthermore, he believes that if all the parties get used to working with the same VDC/BIM tools, it will definitely lead to a more efficient design process. Over all, the interviewee thinks that VDC/BIM has positive impact on return on investment and the design team finds it more inspiring and attractive to work with.
6.4. VDC/BIM in production phase The impact of VDC/BIM on the production phase is captured via an interview with the Production Manager of ALFA residential project from Veidekke Construction AB. One of the results showed that definition of the BIM/VDC is limited more to a tool for visualization, cost and quantity estimations, and clash detection (Interview, 2012b). However the nature of VDC itself is more about the idea of ICE and POP model which represents Product, Organization and Process (Kunz and Fischer, 2012). That is to say, the definition from theory is focused on the fact that it is more a new process rather than hardware and tools. The confusion may come from conceptual definition, because what really is done during the production process is directly consistent with the literal definition of VDC. The project implemented ICE (integrated concurred engineering) in which all stakeholders gathered in the early phase to build the virtual construction of the product.
Another result showed that one of the main purposes of VDC in the production phase is visualization, quantity takeoffs, scheduling and clash detection. Due to visualization and clash detection, the number of RFIs, change orders and field communication problems reduced remarkably. Besides, better collaborations were achieved with actors involved in the project including subcontractors. According to the production manager of ALFA project, it could be hard for people who get used to work traditionally with 2-D drawings to trust the model and to use it. It is easier for those people to simply open a 2D drawing and fix the problem compared with a situation to open the model and analyze with their limited computer knowledge (Interview, 2012b). Another dimension the interviewee stated is that through VDC it is possible to generate a “real time” model of the product, and it provides lots of benefits but still some problems might be missed. In order to improve VDC application, he believes that it is possible with more learning and experience. Considering the overall outcome of VDC, he believes that it has positive ROI on the production process and it is more inspiring and attractive to work with VDC.

46
7. Conclusion and recommendation Transition from linearly exchange of information to the object-oriented fashion had a huge impact on the construction processes. The whole strategy transition to an object-orient manner is covered under BIM/VDC concepts which bring about the creation and use of a three-dimensional (3D) virtual model that represents the design, construction, and operation of a building. Therefore the new concept is worth considering to be studied in detail. This thesis bases its main concern on the impact of BIM/VDC on ROI developed and completed through several stages and with the help of several methodologies.
The research question was: what is the impact of BIM/VDC on ROI from GC perspective? The answer has been found through the case study, meetings, interviews and previous studies. The case study showed that the use of BIM/VDC on ROI is 735%.
First of all, a literature survey is conducted to capture the rationale behind BIM/VDC implementation from theoretical point of view. This section was helpful in understanding the conceptual framework. Then the previous studies section analyzed the up-to-now studies aimed at finding the investment point of view. This section created an important framework to develop a financial model which was also one of the main concerns of the thesis. Along with developing the financial model it was aimed to test the model via a case study. With the help of meetings and interviews done with people from industry, the model was finalized and data of the case study was tested.
The study showed that, BIM/VDC not only has huge impact on ROI but also completely changes the processes and the way of working in the construction industry. It also revealed that considering successful implementation of BIM/VDC, it is a worthy investment which is proved through the case study, meetings with managers from industry, and the previous studies done on return on investment analysis. The savings calculated in the case study were mainly based on the PENG model which developed assumptions over several years via case studies, interviews and meetings from a wide range of respondents: architects, engineers, constructors, HVAC specialists, subcontractors etc. from the Swedish AEC industry. One of previous studies showed that ROI varies from 16% to 1654% based on the scale and size of a project with the use of BIM/VDC. The Holder Construction records showed that in their projects, ROI varies from 229% to 39900%. It also showed that it is possible to reduce RFIs; fewer change orders, and reduce project delay. The cost of BIM is 0,5% of contract value in the study done by Giel et al. (2009), and the average cost of BIM is 0,02% of total cost in study done over the Holder Construction projects. Therefore, the cost of iRoom that is found for the cost of VDC/BIM in the case study, which is 0, 55% of total construction cost, is consistent with the previous studies. The Autodesk Revit ROI analysis revealed that productivity loss and productivity gain have greatest impact on ROI. There is a productivity loss at the beginning when the system is first implemented but then it increases and reaches an optimum point after training time and when users get used to system. The PENG model calculates project savings regarding VDC/BIM in more detail. That is why it is considered the most appropriate method together with managers from Veidekke Construction AB to quantify the benefits the case study.
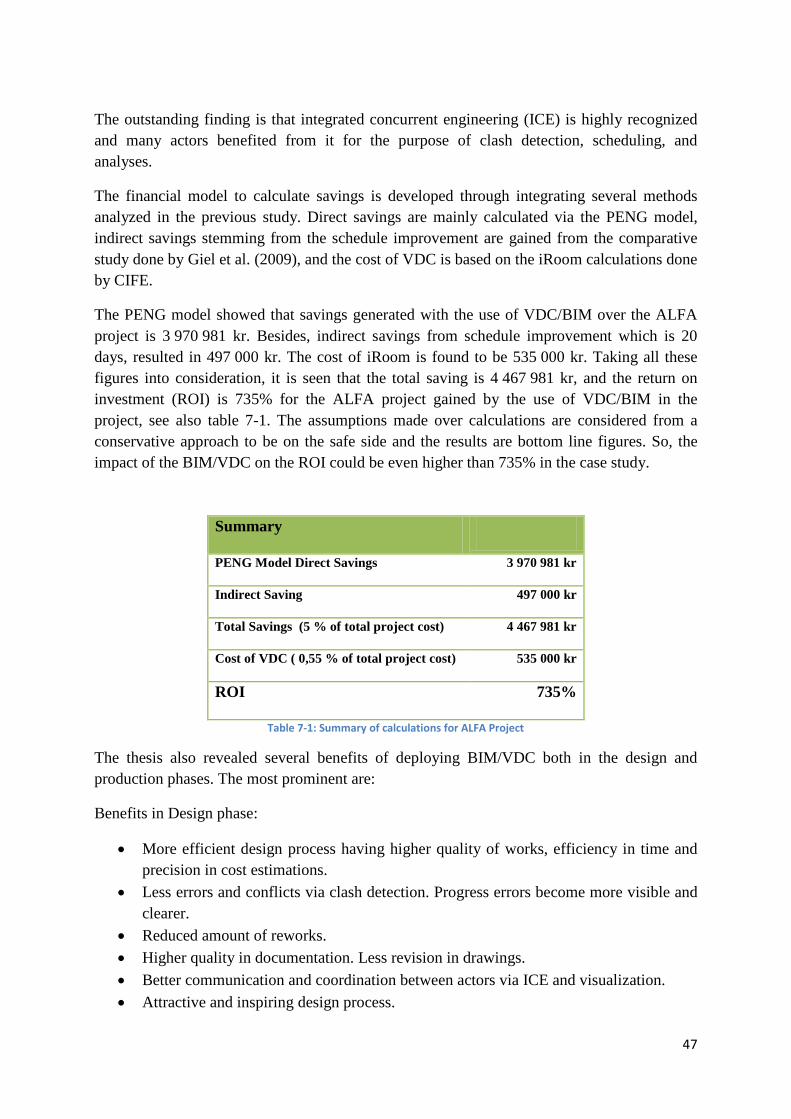
47
The outstanding finding is that integrated concurrent engineering (ICE) is highly recognized and many actors benefited from it for the purpose of clash detection, scheduling, and analyses.
The financial model to calculate savings is developed through integrating several methods analyzed in the previous study. Direct savings are mainly calculated via the PENG model, indirect savings stemming from the schedule improvement are gained from the comparative study done by Giel et al. (2009), and the cost of VDC is based on the iRoom calculations done by CIFE.
The PENG model showed that savings generated with the use of VDC/BIM over the ALFA project is 3 970 981 kr. Besides, indirect savings from schedule improvement which is 20 days, resulted in 497 000 kr. The cost of iRoom is found to be 535 000 kr. Taking all these figures into consideration, it is seen that the total saving is 4 467 981 kr, and the return on investment (ROI) is 735% for the ALFA project gained by the use of VDC/BIM in the project, see also table 7-1. The assumptions made over calculations are considered from a conservative approach to be on the safe side and the results are bottom line figures. So, the impact of the BIM/VDC on the ROI could be even higher than 735% in the case study.
Summary
PENG Model Direct Savings 3 970 981 kr
Indirect Saving 497 000 kr
Total Savings (5 % of total project cost) 4 467 981 kr
Cost of VDC ( 0,55 % of total project cost) 535 000 kr
ROI 735%
Table 7-1: Summary of calculations for ALFA Project
The thesis also revealed several benefits of deploying BIM/VDC both in the design and production phases. The most prominent are:
Benefits in Design phase:
• More efficient design process having higher quality of works, efficiency in time and precision in cost estimations.
• Less errors and conflicts via clash detection. Progress errors become more visible and clearer.
• Reduced amount of reworks. • Higher quality in documentation. Less revision in drawings. • Better communication and coordination between actors via ICE and visualization. • Attractive and inspiring design process.

48
Benefits in Production phase:
• 3D visualization provides a better production flow • Quantity takeoff with higher quality and less time • Construction scheduling becomes easier • Clash detection leads fewer conflicts • Reduced field coordination problems and rework • Reduced change order costs • Reduced RFIs • Better collaboration with other actors • More attractive and inspiring production environment among team
Future studies should be more focused on the continuous calculation of savings through BIM/VDC. It is also very important to have continuous analysis of ROI over projects to evaluate the impact of VDC/BIM. The savings calculations should include unquantifiable variables such as productivity improvement, effect of visualization, process improvement, competitive advantage, and communication and collaboration improvements. Periodical surveys should be conducted in companies implementing BIM/VDC in order to have control over the process, track and analyze in order to observe the impact.
Furthermore, for the future study the scope can be enlarged from a contractor perspective to other actors such as clients, society etc. It would be interesting to reveal how the impact of BIM/VDC is on the industry as a whole considering long term effects.

49
References
ALLENCONSULTINGGROUP 2010. Productivity In The Buildings Network: Assessing The Impacts Of
Building Information Models, report to the Built Environment Innovation and Industry
Council, Sydney,
October. http://www.innovation.gov.au/Industry/BuildingandConstruction/BEIIC/Documents
/BIMProductivity_FinalReport.pdf.
AUTODESK. 2012. Return On Investment with Autodesk Revit
[Online]. http://usa.autodesk.com/adsk/servlet/pc/index?siteID=123112&id=17905120:
Autodesk. [Accessed January 2012].
AZHAR, S. 2011. Building Information Modeling (BIM): Trends, Benefits, Risks, and Challenges for the
AEC Industry. Leadership and Management in Engineering, 11, 241-252.
CANNISTRARO, P. M. 2010. Saving through collaboration: A case study on the value of BIM. Journal of
Building Information Modeling, Fall 2010.
COATES, P., ARAYICI, Y., KOSKELA, K., KAGIOGLOU, M., USHER, C. & O'REILLY, K. 2010. The key
performance indicators of the BIM implementation process.
EASTMAN, C. M., TEICHOLZ, P., SACKS, R. & LISTON, K. 2012. BIM handbook: A Guide to Building
Information Modeling for Owners, Managers, Designers, Engineers and Contractors., Wiley
Online Library.
FISCHER, M., HARTMANN, T., RANK, E., NEUBERG, F., SCHREYER, M., LISTON, K. & KUNZ, J. 2004.
Combining different project modelling approaches for effective support of multi-disciplinary
engineering tasks. INCITE, 167-182.
FISCHER, M., RANDALL, T. & ARBULU, R. 2012. Virtual Design and Construction
[Online]. http://www.veidekke.se/kompetenser/projektering/article78368.ece?q=Fischer&so
urce=3634. [Accessed january 2012].

50
GARBER, R. 2009. Optimisation Stories: The Impact of Building Information Modelling on
Contemporary Design Practice. Architectural Design, 79, 6-13.
GHAURI, P. & GRØNHAUG, K. 2010. Research Methods In Business Studies, Pearson Education India.
GIEL, B. K., ISSA, R. & OLBINA, S. 2009. Return on investment analysis of building information
modeling in construction. University of Florida.
HOWARD, R. & BJORK, B. C. Building Information Models–Experts’ view on BIM/IFC developments.
2007.
INTERVIEW 2012a. 1 manager in Veidekke, 1 February - 10 May 2012.
INTERVIEW 2012b. 1 manager in Veidekke, 1 February - 10 May.
JONGELING, R. 2008. BIM istället för 2D-CAD i byggprojekt. Forskningsrapport. Luleå, Luleå tekniska
universitet. ISSN 1402, 1528.
KUNZ, J. & FISCHER, M. 2012. Virtual design and construction: themes, case studies and
implementation suggestions. CIFE, Stanford University, Stanford, CA, CIFE Working Paper.
MCGRAW-HILL-CONSTRUCTION 2008. Building information modeling: Transforming design and
construction to achieve greater industry productivity. New York.
MCGRAW-HILL-CONSTRUCTION 2009. The Business Value of BIM-Getting Building Information
Modeling to the Bottom Line. SmartMarket Report.
MEETING 2012. 4 Managers in Veidekke, 1 February - 10 May.
SHARPLES, C. 2009. Unified Frontiers: Reaching Out with BIM. Architectural Design, 79, 42-47.
SMITH, D. K. & TARDIF, M. 2009. Building information modeling: a strategic implementation guide for
architects, engineers, constructors, and real estate asset managers, John Wiley & Sons Inc.
SOHLENIUS, U. & SÖDERBERG, S. 2012. RE: VDC hos Vediekke.
TARANDI, V. 2011. Building Informatics and Logistics, Course code: A12805.
VEIDEKKE. 2012. Kista Gård, det första VDC-projektet [Online]. http://www.veidekke.se/nyheter-och-
media/nyheter/article66841.ece?q=Kista+G%C3%A5rd&source=3634. [Accessed April 2012].

51
Appendixes
Appendix A: Comparative Study ROI Analysis; Project A vs. Project B Project A and B Results Project A(pre-BIM) Project B (BIM-Assisted) Contract Value $7 128 000,00 $8 844 073,00 Cost of Change Orders $376 837,67 $271 851,83 Schedule Duration(months) 12 12 Schedule Delay(days) 7 0 Delivery Method Negotiated Bid Negotiated Bid Contract Type GMP GMP Square footage 123,000 SF 81,000 SF bldgs. Use Com. Warehouse w. leasable mixed use space Com. Warehouse w. leasable mixed use space Construction type Tilt-up wall with steel framing Tilt-up wall with steel framing Scope CM-all concrete-work self-performed CM-all concrete-work self-performed
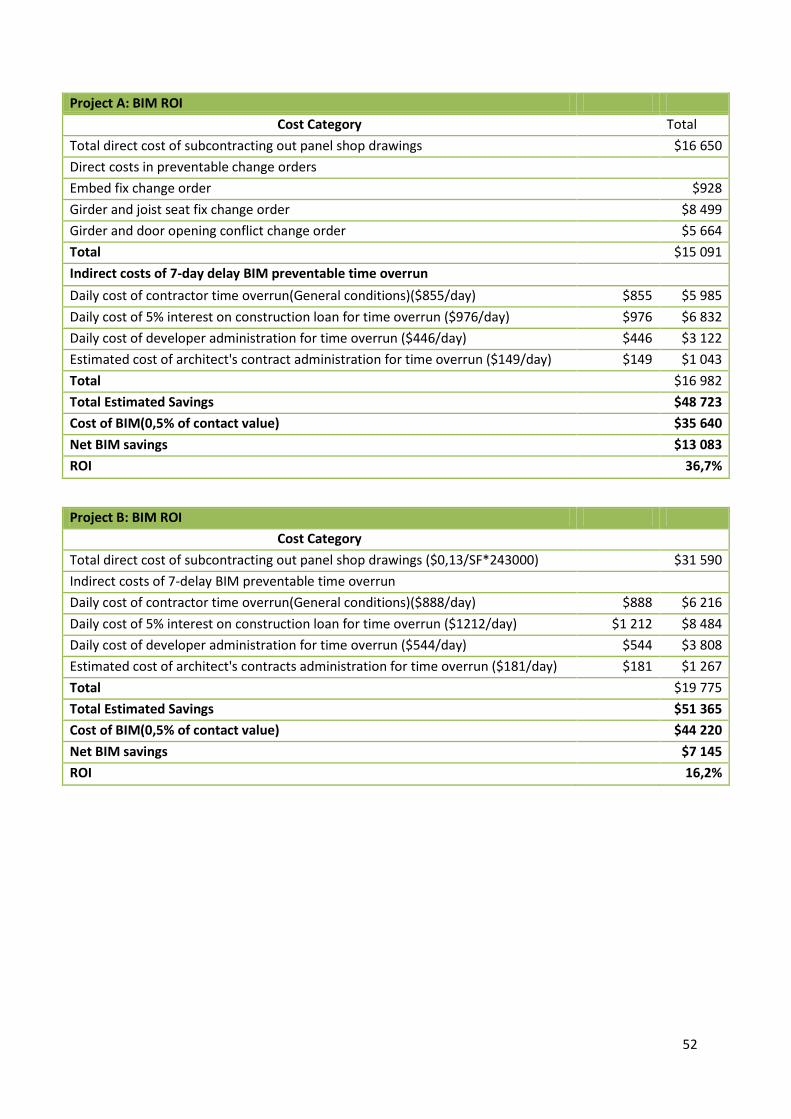
52
Project A: BIM ROI Cost Category Total
Total direct cost of subcontracting out panel shop drawings $16 650 Direct costs in preventable change orders Embed fix change order $928 Girder and joist seat fix change order $8 499 Girder and door opening conflict change order $5 664 Total $15 091 Indirect costs of 7-day delay BIM preventable time overrun Daily cost of contractor time overrun(General conditions)($855/day) $855 $5 985 Daily cost of 5% interest on construction loan for time overrun ($976/day) $976 $6 832 Daily cost of developer administration for time overrun ($446/day) $446 $3 122 Estimated cost of architect's contract administration for time overrun ($149/day) $149 $1 043 Total $16 982 Total Estimated Savings $48 723 Cost of BIM(0,5% of contact value) $35 640 Net BIM savings $13 083 ROI 36,7%
Project B: BIM ROI Cost Category
Total direct cost of subcontracting out panel shop drawings ($0,13/SF*243000) $31 590 Indirect costs of 7-delay BIM preventable time overrun Daily cost of contractor time overrun(General conditions)($888/day) $888 $6 216 Daily cost of 5% interest on construction loan for time overrun ($1212/day) $1 212 $8 484 Daily cost of developer administration for time overrun ($544/day) $544 $3 808 Estimated cost of architect's contracts administration for time overrun ($181/day) $181 $1 267 Total $19 775 Total Estimated Savings $51 365 Cost of BIM(0,5% of contact value) $44 220 Net BIM savings $7 145 ROI 16,2%

53
Appendix B: Comparative Study ROI Analysis; Project C vs. Project D
Project C and D Project C(pre-BIM Project D (BIM-Assisted) Contract Value $41 757 617,00 $44 400 000,00 Cost of Change Orders $5 097 222,00 $513 632,00 Schedule Duration (days) 601 652 Schedule Delay (days) 221 -60 Delivery Method Negotiated Bid Negotiated Bid Contract Type GMP GMP Square footage (sqf) 439 760 456 594 Use Mixed use - res. Condo/garage Mixed use - res. Condo/garage # of Stories (Towers) 14 7 # of Units 311 218 Construction type(Towers) Conv. Formwork w. Conv. Reinf. Conv. Formwork w. Conv. Reinf. Construction type(Garage) Post-tens. Conc. W.conc. Cols. (DB) Post-tens. Conc. W.conc. Cols. Scope CM-all concrete-work self-performed CM-all concrete-work self-performed

54
Project C: BIM ROI Cost Category Total
Direct costs in preventable change orders: (COR 00004) Revised Boundary survey $24 862 (COR 00013) Added beam in shear wall $787 (COR 00014) Shear wall # 1 revision $3 396 (COR 00015) Movement of (2) columns due to grid mis-alignment $419 (COR 00025) Addition of (16) 3" deck drains : $19 158 (COR 00095) Readjustment of fire sprinkler heads for ceiling height changes $1 777 (COR 00092) Window reorder/install due to conflict with exterior columns $2 632 (COR 00104) Sliding glass doors mislabeled as window type $2 208 (COR 00146) Revised ceiling heights to conceal drop panels $13 062 (COR 00151) Additional framing of roof drains $19 081 (COR 00178) Re-routing of mechanical ductwork around electrical panels $2 722 (COR 00213) Additional soffits to accommodate return air ductwork $14 115 (COR 00231) Additional fire sprinkler heads adjustment for dropped ceiling $1 285 (COR 00175) Demolition and repair of elevator door beams $66 812 (CO 17) Materials escalation due to 221-delay based on survey and structural plan errors $300 000 Total $472 316 Indirect costs of 221-day delay BIM preventable time overrun Daily cost of contractor time overrun(General conditions)($5 425/day) $1 198 925 Daily cost of 5% interest on construction loan for time overrun ($5 720/day) $1 264 120 Daily cost of developer administration for time overrun ($2 466/day) $544 986 Estimated cost of architect's contract administration for time overrun ($822/day) $181 662 Total $3 189 693 Total Estimated Savings $3 662 009 Cost of BIM(0,5% of contact value) $208 788 Net BIM savings $3 453 221 ROI 1653,9% Project D: BIM ROI of Indirect Time Savings
Cost Category Indirect costs of 60-day early completion Daily cost of contractor time overrun(General conditions)($5 425/day) $325 500 Daily cost of 5% interest on construction loan for time overrun ($6 082/day) $364 920 Daily cost of developer administration for time overrun ($2466/day) $147 960 Estimated cost of architect's contract administration for time overrun ($822/day) $49 320 Total $887 700 Total Estimated Savings $887 700 Cost of BIM(0,5% of contact value) $222 000 Net BIM savings $665 700 ROI 299,9%

55
Appendix C: Autodesk Revit ROI Calculation
Revit ROI Calculator
Average Monthly DPE by Activity
DPE of Employee $35 Hours per month DPE Rate Per Hour Monthly DPE Cost Design 52 35% $35 $1 820 Documentation 68 46% $35 $2 380 Project Management 22 15% $35 $770 All other Tasks 5 3% $35 $175 Total Per Month 147 100% $140 $5 145 A $6 000 Hardware and Software Costs B $4 200 Monthly DPE Costs for Design and Documentation C 3 Training Time in Months D 50% Productivity Loss E 25% Productivity Gain 61% First Year Revit ROI

56
Appendix D: Interviews questions
a) VDC/BIM impact on Design phase The purpose of the interview:
• To capture how BIM/VDC is defined within company from different actors. • To learn which BIM/VDC tools are implemented in the project • To learn the purpose of use of BIM/VDC tools • To learn cost of implementation of BIM/VDC • To collect data for ROI calculation in the model done by Florida univ • To collect data for PENG model to calculate project savings by BIM/VDC. • To find out benefits that gained via BIM/VDC • To find out how BIM/VDC implementation can be improved and current drawbacks • To find out if the people involved into the projects find more inspiring and attractive
to work with BIM/VDC
The following questions are to be considered from Design manager perspective.
1. For how long have you been working with VDC/BIM? 2. What BIM tools do you use in design process? 3. For what purpose do you use which BIM tools? Explain
a. Visualization b. Documentation c. Cost analysis d. Quantity takeoff e. Scheduling f. Clash detection; such as piping does not intersect with steel beams. g. Code reviews: legal requirements such as fire.
4. What benefits have you gained?
a. Clash detection b. Progress and errors in design are visible and clear c. Reduced amount of uncertainties d. Reduced amount of reworks e. Quality in documentation f. Revision of the drawings g. Design Processes
i. Coordination ii. Communication
iii. Time iv. Cost v. Quality
5. What are the drawbacks in use of BIM/VDC in design phase? 6. What can be improved with BIM/VDC to have a more efficient design process?

57
7. Considering overall design process, do you see positive return on investment (ROI) in BIM/VDC?
8. Considering your colleagues-design team, is it more inspiring and attractive to work with BIM/VDC?
b) VDC/BIM Impact on Production phase The purpose of the interview:
• To capture how BIM/VDC is defined within company from different actors. • To learn which BIM/VDC tools are implemented in the project • To learn the purpose of use of BIM/VDC tools • To learn cost of implementation of BIM/VDC • To collect data for ROI calculation in the model done by Florida univ • To collect data for PENG model to calculate project savings by BIM/VDC. • To find out benefits that gained via BIM/VDC • To find out how BIM/VDC implementation can be improved and current drawbacks • To find out if the people involved into the projects find more inspiring and attractive
to work with BIM/VDC
The following questions are to be considered from Production perspective.
1. For how long have you been working with VDC/BIM? 2. How do you define BIM/VDC? 3. What BIM tools do you use in Production process? 4. For what purpose do you use BIM tools mostly? Explain
a. Visualization b. Cost analysis c. Quantity takeoff d. Scheduling e. Clash detection
5. What benefits have you gained during the production phase? Explain each. a. Reduced number of RFIs b. Reduced number of change orders (ÄTA) c. Reduced field communication problems d. Reduced re-work
Yes see answer c e. Better collaborations with other actors involved
i. Subcontractor ii. Architects
iii. Engineers iv. MEP consultants v. …
f. Production process i. Coordination
ii. Communication

58
iii. Time iv. Quality v. Cost
vi. Sub-contractor management 6. What are the drawbacks in use of BIM/VDC during production phase? 7. What can be improved with BIM/VDC to have a more efficient production process? 8. Considering overall Production process, do you see positive return on investment
(ROI) in BIM/VDC? 9. Considering your colleagues-production team, is it more inspiring and attractive to
work with BIM/VDC?