ipads® and bim in construction: what is the roi? -...
TRANSCRIPT

© 2011 Autodesk
iPads® and BIM in Construction: What Isthe ROI? – A Case Study
Will Senner, Assistant Project Manager, Skanska USA BuildingJosh Kanner, Cofounder, VP Marketing & BD, Vela Systems

© 2011 Autodesk
Agenda
Introduction (Josh – 5 min.)
Case Study and ROI framework (Will – 35 min.)
What’s Next? Field BIM – Interactive (Josh – 5 min.)
Q+A (both – 15 min.)

© 2011 Autodesk
Class Summary
Results of iPads, BIM, and field software on the Hunt Libraryproject, Raleigh, NC.
Focus is on quality assurance, commissioning of systemsand equipment, punch listing, and material tracking of curtainwall.
An ROI framework developed as a part of graduate-levelresearch at North Carolina State University will also bepresented.

© 2011 Autodesk
Learning Objectives
At the end of this class, you will be able to:
Understand specific applications of BIM, iPads and field managementsoftware for potential use on your projects
Leverage an ROI framework for translating both soft and hard benefits oftechnology into dollar terms
Avoid common stumbling blocks when implementing technologies ofthese types on a project


NC State Centennial Campus

NC State Centennial Campus

NC State Centennial Campus
Technology Overview− BIM in Estimating & Preconstruction
− Visualization & Smart Boards
− Logistics Planning & 4D Scheduling
− Field Mobility & Mobile Electronic Resource Stations
− Material Tracking
− MEP Coordination & As-Built BIM Handover
ROI / Cost-Benefit Research− Research Methodology/Approach
− Direct & Indirect Costs
− Benefits
− Efficiency Gains & Rework Reductions
− ROI Calculations

Estimating & Preconstruction

Quantification using BIM

Visualization & Smart Boards
Uses:
• Constructability review during designphases producing electronic reviewcomments
• Shop drawing review and teamcoordination meetings
Benefits:
• Improved understanding of difficultproject conditions
• Increased ability to convey design intentto subcontractors
• Ability to engage and collaborate withremotely located team members

Vela Systems Overview

Vela Systems Overview

Quality Control & Safety – Field Mobility

Quality Control –Mobile Electronic Resource Stations

Exterior Envelope

Material Tracking for Unitized Curtainwall

0
5
10
15
20
25
30
35
40
45
50
16-Feb 26-Feb 8-Mar 18-Mar 28-Mar 7-Apr 17-Apr 27-Apr 7-May 17-May 27-May
Nu
mb
er
of
Un
its
Fabrication and Installation Production
Fabrication
Installation
Material Tracking for Unitized Curtainwall

Quality Control –Verification of Door Frame Installation

MEP Systems & Technology Strategies

MEP Systems

Innovation Grant Research Project:ROI of Innovation
Identify KeyFeatures ofTechnology
Implementation
Quantify Benefits& Evaluate ROI
DevelopRecommendations for
FutureImplementations
− Abstract: Innovative Technologies increase the effectiveness of operations & field personnel.

Research Assumptions
Assumptions
• Construction Manager at Risk delivery model
• 100% of project “savings” (General Conditions,Contingency, etc) returned to the owner at the endof the project
• 2 year schedule, $100M overall project cost
• No self-perform work by the CM
• Limited sample size due to “emerging” technologies

Research Framework
Calculate Return on Investment
“Owner” ROI “Project” ROI
Translate Benefits to Real Dollars
Determine Typical Rework CostsRework Avoided by Increasing Efficiency of CM
Staff
Determine Benefits
Observe Changes in Durations of Weekly Activities Use data to determine efficiency gains
Determine Total Implementation Costs
Direct Costs Indirect Costs

Direct Costs Summary –Field Mobility & Related Infrastructure
SINGLE PURCHASE(CAN BE REUSED)
AVOIDABLE COST(TRIAL AND ERROR)
RECURRING PURCHASE(PER PROJECT)
TOTALMARKET COST
(RETAIL)
$ 57,487.54 $ 2,270.00 $ 30,720.00 $ 90,477.54
SinglePurchase:
63.5%
AvoidableCost: 2.5%
RecurringPurchase:
34.0%
Breakdown of Costs

Indirect Costs
− 16 hour initial set up: uploading of electronic documents, development of location hierarchy, templates, etc
0
2
4
6
8
10
12
14
16
UPLOADING CONTRACT
DOCUMENTS/PLANS
ELECTRONIC MARK-UPS TRAINING
Ho
urs
Pe
rW
ee
k
Weekly Implementation Costs

Benefits
How are wereally usingthe tools?
What’schanged from
before?
What value arewe really
adding to theproject/owner?
To otherparties?
How do wetranslate that“value” to real
dollars?

Benefits - Step 1:
How are we operating nowand actually using thesetools day to day?

Distribution of Weekly Management Time
ManagementSector
ColorDesignation
Reaction
Assessment
Planning
Administration
ActivityAvg. DurationPrevious (Hrs.)
Avg. DurationNew (Hrs.)
Coordinate with PMs of Trades for the weeks activities-Reaction 2.30 2.50
Follow up statuses of past week's issues-Reaction 2.30 1.40
Monitor productivity of installation/construction-Reaction 2.00 1.60
Verify last week's issues have been corrected/addressed-Reaction 1.20 1.20
Conduct Meetings with Sub and A/E on rolling punchlist issues-Reaction 2.40 1.80
Document/Photograph unresolved issues and their location 2.00 1.10
Email/Phone other trades about coordination issues/construction sequence-Reaction 2.80 2.40
React to any issues/discrepancies which have arisen in the field 3.80 3.00
Follow up statuses of past week's issues-Assessment 2.60 1.00
Monitor productivity of installation/construction-Assessment 3.20 2.80
Verify last week's issues have been corrected/addressed-Assessment 2.00 2.20
Conduct Meetings with Sub and A/E on rolling punchlist issues-Assessment 2.60 1.80
Go to field to verify progress and quality 4.20 4.40
Assess productivity of past week/month 2.20 1.40
Walking with Owner/Commissioning Agent 2.75 2.50
CM Team Meeting 1.60 1.60
OAC Meeting 1.60 1.60
Review Plans/Specs/Shop Drawings/Submittals 5.60 5.60
Coordinate with PMs of Trades for the week's activities-Planning 3.20 3.50
Email/Phone fabrication shop to verify sequence and number of units 1.38 1.13
Determine what productivity for following week must be to stay on schedule 1.60 1.60Email/Phone other trades about coordination issues/construction sequence-Planning 1.60 1.60
Plan for next week's construction/installation 2.80 4.00
Pay Apps 1.80 1.80
Update information in the BIM to serve as electronic deliverable to Owner 2.50 1.00
Total Weekly Hours: 62.03 54.53

Benefits - Step 2:
What’s changed from theold way?

Efficiency Gains
− 62 hrs/wk to 54.5 hrs/wk on average
− 16.7% of time savings is returned to the project resulting in an increase in value-added planning
Reaction:18.80 Hrs.
(30%)
Assessment:19.55 Hrs.
(32%)
Planning:19.38 Hrs.
(31%)
Admin.:4.30 Hrs. (7%)
Previous
Reaction:15.00 Hrs.
(27%)
Assessment:16.10 Hrs.
(30%)
Planning:20.63 Hrs.
(38%)
Admin.: 2.80Hrs. (5%)
New

Efficiency Gains
− Equivalent to an additional 5.6%-11.3% of additional field supervision (50hrs/wk) [Avg.= 8.5%] excluding punch list operations
− With punch list efficiency: 8.2%-13.8% [Avg.=11.0%]
* “Earned” Hours are defined as time spent on planning and assessment activities
Metric: Previous (Baseline) New
“Earned” Hours * 38.93 40.43
Actual Hours 38.93 36.23
Efficiency 1.000 1.116
Metric: Time Savings
Increase in “Value Added” Planning 1.5 hours/week
Travel Efficiency 1.33 - 4.17 hours/week
Punch list Efficiency 2.0 hours/day during punch list operations

Benefits - Step 3:
What part(s) of this changereally result in added valueto the project/owner?To other parties?

Root Causes of Rework
HumanResourceCapability
UnclearInstructions to
Workers
InadequateSupervision &Job Planning
ExcessiveOvertime
Insufficient SkillLevels
Engineering &Reviews
Late DesignChanges
Poor DocumentControl
Scope Changes
Errors andOmissions
Leadership AndCommunications
IneffectiveManagement ofProject Team
Lack ofOperations (EndUser) Persons
Buy-in
Lack of Safetyand QA/QCcommitment
PoorCommunications
ConstructionPlanning &Scheduling
ConstructabilityProblems
Late DesignerInput
UnrealisticSchedules
InsufficientTurnover &
CommissioningResourcing
Material &Equipment
Supply
UntimelyDeliveries
Prefab. & Constr.Not to Project
Req.
Non-compliancewith
Specification
Materials not inRight Place
when Needed

Breakdown of Rework Causes
*(COAA study of over 100 constr. Projects)
Engineering &Reviews55.41%
HumanResourceCapability
18.28%
Material &Equipment
Supply 23.46%
Leadership &Communication
0.38%
Const. Planning& Scheduling
2.47%
Construction Owners Association of Alberta
DocumentControl
40%
Quality &Managerial
60%
Skanska Specific

Benefits - Step 4:
How do we translate that“value” into real dollars?

Mobile Technology Research Conclusions
− Estimated 5% of overall project cost spent on rework− $5M Total on a $100M project
− 50% Trade Costs
− 50% Project Costs/Contingency
90%
10%
Document Control Rework:
Trade Costs
Project Costs/ Contingency
23%
77%
Quality / ManagerialRework:

0
10
20
30
40
50
60
70
80
90
100
0 100 200 300 400 500 600 700 800
%o
fR
ew
ork
Avo
ided
Additional Hours Spent (weekly)
Opportunity to Avoid Reworkthrough Additional Planning & Supervision

Mobile Technology Research Conclusions
− 1/3 of all rework could be avoided with an additional 50 hours/week of field supervision & planning− 90% avoided quality control items
− 10% avoided document control items
Potential Savings fromAdditional 50 hours of Field Supervision
Trade Cost Savings $500 K
Project Cost / Contingency Savings $1.17 M
Total Savings $1.67 M

Mobile Technology Research Conclusions
− Mobile Technology (excluding MERS) allows CM employees to be 8.5% more efficient on average
− Equates to $142K in avoided total rework− $99.5K in avoided project costs
− Hypothesis: In the long term, reductions in trade cost rework will reduce bids, translating into further ownersavings.
Return on Investment Summary
Project Costs Only 17%
Overall Costs 67%

Research Framework Review
Time Savings and Efficiency Gains
Decreased Weekly HoursWorked
Increased “Value Added”Planning
Reduced Rework
Contingency /Owner Savings
SubcontractorSavings

Mobile Technology Research Conclusions
− Mobile Electronic Resource Station Benefits: − 45% reduction in “Document Control” related rework (approx.
18% of all rework)
− Positive ROI for projects valued over $7.5M
Realized Savings from Mobile Electronic Resource Station
Trade Cost Savings $810 K
Project Cost / Contingency Savings $ 90 K
Overall Savings $900 K
Return on Investment Summary
Project Costs Only 1540%
Overall Costs 16300%
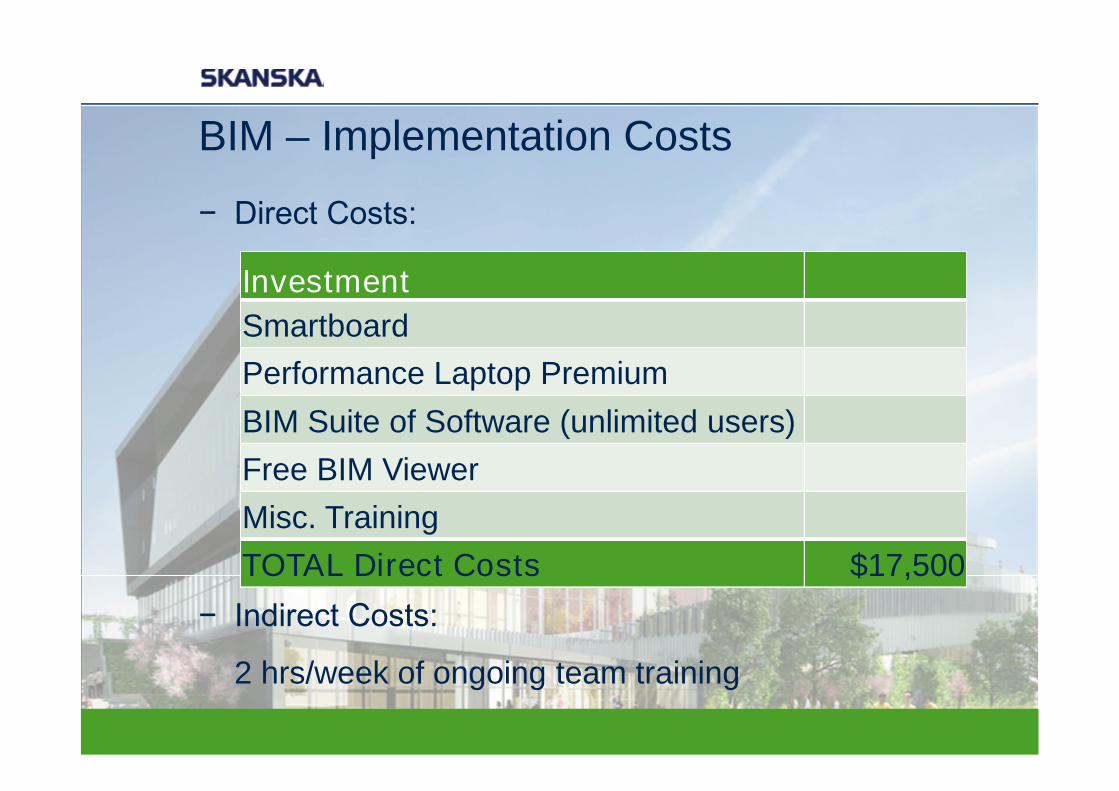
− Direct Costs:
− Indirect Costs:
2 hrs/week of ongoing team training
BIM – Implementation Costs
Investment
Smartboard
Performance Laptop Premium
BIM Suite of Software (unlimited users)
Free BIM Viewer
Misc. Training
TOTAL Direct Costs $17,500

BIM – Realized Benefits
− Pre-Construction Benefits:− 3-4 Days saved through model quantity verification
− Clash Detection & Coordination Benefits− 33% reduction in MEP coordination time
− $90K in overall avoided rework
BIM Coordination Savings from Avoided Rework
Trade Cost Savings $40 K
Project Cost / Contingency Savings $50 K
Total Rework Savings $90 K

BIM – Return on Investment
Return on Investment Summary
Project Costs Only 186%
Overall Costs 414%
− Not inclusive of additional benefits resulting from additional time which is no longer spent supervisingrework

Return on Investment Summary
ROI
Project Total
Mobile Technology 17% 67%
Mobile Electronic ResourceStation
1540% 16300%
BIM 186% 414%
Overall TechnologyImplementation
122% 948%

ROI Projections for Future Projects
0%
200%
400%
600%
800%
1000%
1200%
1400%
Retu
rno
nIn
vestm
en
t
Total Project Cost
OverallImplementation -Project Benefits
OverallImplementation -Total Benefits


© 2011 Autodesk
Autodesk, AutoCAD* [*if/when mentioned in the pertinent material, followed by an alphabetical list of all other trademarks mentioned in the material] are registered trademarks or trademarks of Autodesk, Inc., and/or its subsidiaries and/or affiliates in the USA and/or other countries. All other brand names, product names, or trademarks belong to their respective holders. Autodeskreserves the right to alter product and services offerings, and specifications and pricing at any time without notice, and is not responsible for typographical or graphical errors that may appear in this document. © 2011 Autodesk, Inc. All rights reserved.