the impact of an urban wal-mart store on area businesses
TRANSCRIPT

Loyola University Chicago Loyola University Chicago
Loyola eCommons Loyola eCommons
Center for Urban Research and Learning: Publications and Other Works Centers
12-2009
The Impact of an Urban Wal-Mart Store on Area Businesses: An The Impact of an Urban Wal-Mart Store on Area Businesses: An
Evaluation of One Chicago Neighborhood's Experience Evaluation of One Chicago Neighborhood's Experience
Center for Urban Research and Learning Loyola University Chicago
Julie Davis Loyola University Chicago, [email protected]
David Merriman University of Illinois at Chicago, [email protected]
Lucia Samayoa Loyola University Chicago, [email protected]
Brian Flanagan Loyola University Chicago
See next page for additional authors
Follow this and additional works at: https://ecommons.luc.edu/curl_pubs
Part of the Community-Based Research Commons, Demography, Population, and Ecology Commons,
Labor Relations Commons, and the Urban Studies and Planning Commons
Recommended Citation Recommended Citation Center for Urban Research and Learning; Davis, Julie; Merriman, David; Samayoa, Lucia; Flanagan, Brian; Baiman, Ron; and Persky, Joseph, "The Impact of an Urban Wal-Mart Store on Area Businesses: An Evaluation of One Chicago Neighborhood's Experience" (2009). Center for Urban Research and Learning: Publications and Other Works. 3. https://ecommons.luc.edu/curl_pubs/3
This Technical Report is brought to you for free and open access by the Centers at Loyola eCommons. It has been accepted for inclusion in Center for Urban Research and Learning: Publications and Other Works by an authorized administrator of Loyola eCommons. For more information, please contact [email protected].
This work is licensed under a Creative Commons Attribution-Noncommercial-No Derivative Works 3.0 License.

Authors Authors Center for Urban Research and Learning, Julie Davis, David Merriman, Lucia Samayoa, Brian Flanagan, Ron Baiman, and Joseph Persky
This technical report is available at Loyola eCommons: https://ecommons.luc.edu/curl_pubs/3

The Impact of an Urban Wal-Mart Store on Area Businesses:
An Evaluation of One Chicago Neighborhood’s Experience
By
Julie Davis,† David Merriman, †† Lucia Samayoa, † Brian Flanagan, † Ron Baiman, †† and Joe Persky††
December 2009
Research report prepared and published by the
Center for Urban Research and Learning
Loyola University Chicago.
The authors gratefully acknowledge financial support for this research from the
Woods Fund of Chicago.
†
Center for Urban Research and Learning, Loyola University Chicago †† University of Illinois Chicago

For more information contact: David Merriman, Economics Department, University of Illinois Chicago, m/c 144, 601 S. Morgan St., Chicago, IL 60607 MC-144 (312) 413-2368, [email protected]; or Julie Davis. Center for Urban Research and Learning, Loyola University Chicago, 820 N. Michigan Ave., Chicago, IL 60611, 312-915-7529, [email protected]
The Center for Urban Research and Learning (CURL) of Loyola University Chicago seeks to promote equality and to improve people's lives in communities throughout the Chicago metropolitan region. CURL pursues this goal by building and supporting collaborative university-community research and education efforts. These partnerships connect Loyola faculty and students with community and nonprofit organizations, civic groups, and government agencies. Such collaborations link the skills and knowledge present within every community with the specialized knowledge and academic discipline of a vital urban university.
More information on CURL and an electronic version of this report are available at: www.luc.edu/curl.

i
Executive Summary
Having achieved nearly complete coverage of non-urban and suburban markets, mega-retailer Wal-Mart has turned its attention to urban expansion. Evaluations of Wal-Mart’s impact on urban retail businesses and local employment are necessary to inform policy makers, scholars, and community activists looking to improve economic opportunities for inner-city residents. This study focuses on the Wal-Mart store that opened on the West Side of Chicago in September 2006. The research team conducted a series of three surveys of retail businesses in an area within a four-mile radius of the Wal-Mart location at 4650 W. North Ave, Chicago IL 60639. This area is roughly bounded by Irving Park Avenue to the north, Western Avenue on the east, Roosevelt Avenue on the south, and Harlem Avenue on the west. The surveys were administered in the summers of 2006 (before the Wal-Mart opening), 2007 and 2008. The basic sample follows 306 enterprises 82 of which went out of business over the study period. A key finding of the survey is that the probability of going out of business during the study period was significantly higher for establishments close to the Wal-Mart location. This probability fell off at a rate of 6 percent per mile in all directions from the Wal-Mart store. The relationship to distance was particularly strong for establishments in electronics, toys, office supplies, general merchandise, hardware, home furnishings, and drugs. Closings for apparel stores, shoe stores, sporting goods, children’s stores and video/music showed no statistically significant relation to distance. Based on the estimated relationship between probability of store closings and proximity to Wal-Mart, the research team estimates that Wal-Mart’s opening has resulted in the loss of about 300 full-time equivalent jobs in its own and nearby zip codes. There is considerable uncertainty attached to these calculations. However, they suggest a loss about equal to Wal-Mart’s own addition to employment in the area. These estimates support the contention that large-city Wal-Marts absorb retail sales from other city stores without significantly expanding the market. There was no evidence from the sample that stores remaining in business suffered employment losses. In addition to the surveys of West Side establishments, the research team obtained sales tax data from the Illinois Department of Revenue. These data from 2000 through 2008 are used to estimate quarterly taxable sales for the Wal-Mart zip code (60639) and neighboring zip codes. A trend analysis is performed for each zip code. In each case, the question is whether trends in sales changed after the Wal-Mart opening. For Wal-Mart’s own zip code, 60639, there is no evidence of an overall upturn in sales. Indeed, if the sample is limited to the six quarters (18 months) before and after Wal-Mart opened there is a significant decline in the trend of zip code sales. For this same period, zip code 60651, the closest neighbor to the Wal-Mart zip code, also shows a significant negative break-in-trend as does zip code 60622. No other city zip codes in the area show significant changes. Unfortunately these data include sales in a range of establishments not directly competing with Wal-Mart. (The Illinois Department of Revenue refused to

ii
release more detailed data.) Nevertheless, the results on sales are broadly consistent with the estimates based on the survey data. Data from the Illinois Department of Employment Security on retail employment in Wal-Mart’s own zip code and nearby zip codes are also broadly consistent with the survey findings. Retail employment levels in Wal-Mart’s own zip code show no significant change, presumably because of the addition of Wal-Mart’s own employees. But retail employment trends in neighboring zip codes show a negative effect after Wal-Mart’s opening. This effect is significant in the period 2003-2008. Overall, the weight of evidence suggests that the Wal-Mart opening on the West Side led to the displacement of a range of businesses. There is no evidence that Wal-Mart sparked any significant net growth in economic activity or employment in the area. The study findings must be interpreted cautiously. The data used are often not ideal, although the best currently available. Still the conclusions reached here are similar to those other researchers have found for Wal-Mart impacts in small towns and suburbs. Under the circumstances, claims that the Chicago Wal-Mart has led to significant economic development in nearby areas must be considered skeptically.
iii
Community Leader Perspectives on the Study
The Center for Urban Research and Learning convened two small gatherings of
community leaders to review this report and provide their perspectives on its implications
for the ongoing discussion of economic development in Chicago communities –
particularly low-income communities. Although significant input was received from
local businesses in the course of completing research for this report, we felt that it was
valuable to receive further input from community-based leaders -- especially those active
in neighborhoods on Chicago’s West Side, where the current Wal-Mart store is located,
and the South Side where there have been many discussions about the possible location
of a new Wal-Mart store. The comments below are not intended to be a survey of
“community opinion,” rather they are provided as an initial reaction from leaders who
have been active in economic development work in Chicago’s low- and moderate-income
communities for many years. Those involved in these discussions included leaders from
Lawndale Christian Development Corporation, West Humboldt Park Development
Council, Enlace Chicago, Erie Neighborhood House, Good Jobs Chicago, and Centers
for New Horizons.
While community leaders recognized the contribution that Wal-Mart was providing at its new store on Chicago’s West Side in terms of retail shopping and employment opportunities, they were particularly impressed with the report’s finding that these contributions did not represent additions to existing local economic opportunities. Wal-Mart’s sales were replacing, but not enhancing, the retail activity in the community, as indicated by relatively steady sales tax revenues before and after the addition of the store. Similarly Wal-Mart was replacing, but not enhancing, employment opportunities in the community. The fact that Wal-Mart is “a wash” in terms of sales revenue for the city and jobs for local residents has particular relevance to current policy debates about the need for new Wal-Mart stores, or for that matter, more big box developments in Chicago’s neighborhoods. Such stores are not producing the new opportunities and a financial boon for the city as was promised or forecast by some. As Tom Otto at the West Humboldt Park Development Council, commented, “What this study confirms [is that]… there is a pie and you’re just divvying it up differently in terms of sales, number of jobs; it’s just shifting.” This means that communities should not be so quick to see Wal-Mart as a panacea to local economic struggles. The development of such a store is one alternative, but not the only one. Leaders suggested that big box developments should be view as one strategy in the city’s arsenal to address economic development, but not the only one. There were numerous suggestions that additional strategies be considered in addition to big box developments. Maureen Hellwig from Erie Neighborhood House recommended that just as the city has an ordinance that requires so many units of affordable housing to be included in certain kinds of multi-family development, maybe a similar “inclusionary business” ordinance should be enacted insuring that nearby small

iv
businesses can be enhanced by such new development. Wal-Mart has indicated that it is reaching out to local businesses on a voluntary basis, but community leaders felt that a stronger government role in structuring and mandating these benefits would be appropriate. Other leaders suggested that we should not be so quick to “put all of our eggs in one basket.” In some communities maintaining a diversity of shopping options, rather than building one big store, may be the more desirable development avenue. Dhyia Thompson from Southsiders Organizing for Unity and Liberation (SOUL), part of the Good Jobs Chicago coalition, responded that Wal-Mart is not the “economic engine” that will push urban community economic development forward. Specifically referencing Chatham and Austin, Thompson states: “Plopping a rural model store into an urban community doesn't support a diversity of retail & commercial businesses. A community with one big box that displaces existing jobs and businesses is not a desirable solution. I feel that this study is just a confirmation that Wal-Mart will just end up replacing the resources that already exist.” There are economic engines in some communities that might be better enhanced by strategies other than big box developments. Cesar Nunez from Enlace Chicago recognized that business ownership succession is a problem in many Chicago communities; in some cases communities lose businesses when aging owners do not have someone to whom to sell the business they have developed. It is possible that where significant patterns of such business closures have taken place, big box developments are a50 logical solution. However, Nunez notes that in communities such as Little Village where there has been a steady growth of new immigrants and demand for new businesses, small retailers have found ways to continue their business. There is a healthy entrepreneurial energy to develop new small businesses – an energy that could be lost if a big box development was given any particular advantages over small businesses. Other suggested alternatives or complements to Wal-Mart-scale developments were retail business incubators. These have been used in some Chicago neighborhoods and could be more systematically used in local retail development. Related to this are small business “malls,” such as the Azteca Mall where 100 local vendors created their own mall and bought an old industrial building to house it. Similarly, the experience and resource represented by local chambers of commerce in promoting local business should not be ignored in the race to attract the big developments. These chambers, particularly with government and foundation assistance, have the local credibility and local experience to strengthen the local retail climate. The overall community leader response emerging from our discussions is that elected officials should not be so quick to invite in larger corporate retailers into communities, under the assumption that these large businesses will produce more tax revenue, better retail options for residents, and more jobs. This study shows that some of these promises of growth may not be realized after stores are built. Where the long-term impact will not
v
be one of growth, but merely a process of replacing small retailers with a larger retailer, government leaders need to be more cautious. Among the community leaders attending these meetings, there was not a knee-jerk opposition to Wal-Mart or any other big box store moving into Chicago communities. Rather, the message they conveyed was that we are a diverse city with diverse needs. We are a city of 77 community areas, many different income groups, and many different racial, ethnic, and cultural groups, so one size of development does not fit all. Given the report’s findings, we should not be rushing into economic development strategies with the assumption that big stores will always be better for local residents and the city as a whole.

vi
Table of Contents
I. Introduction II. Studies of Wal-Mart’s Economic Development Impact III. The Chicago Wal-Mart Study IV. Methodology
a. Survey Data b. Other Sources of Information about Wal-Mart’s Impact
V. Findings a. Findings from Survey Data
i. 2006 baseline survey and response rate ii. 2007 survey response rate
iii. 2008 survey response rate iv. Distance from Wal-Mart and Retail Closures v. Estimated job loss from Wal-Mart
b. Findings from Sales tax data c. Findings from Retail Employment data
VIII. Summary and Conclusions
Appendix 1
Jobs and Opportunity Zones
Appendix 2
Analyses of D&B data Figures and Tables
Figures
Figure 1 Survey results 2006-2009 Figure 2 Plot of survey firms by distance and direction to Wal-Mart and out-of-
business status Figure 3 Study area in its larger regional context Figure 4 Map of zip codes in the Wal-Mart area
Tables
Table 1 Descriptive statistics from 2006 survey Table 2 Response Rates for 2007 and 2008 Table 3 Descriptive statistics from the 2007 and 2008 Surveys Table 4 Status of business by quadrant Table 5 Distance from Wal-Mart and Probability of Going Out of Business

vii
Table 6 Probability firm went out of business between 2006 and 2008 surveys as a function of distance to Wal-Mart, by line of business
Table 7 Percent change in employment and wages between 2006 and 2007 survey as a function of distance to Wal-Mart
Table 8 Wal-Mart impact on taxable sales in home zip code Table 9 Wal-Mart impact on taxable sales all zip codes Table 10 Wal-Mart impact on retail employment in home zip code Table 11 Wal-Mart impact on retail employment in home zip code and all other
zip codes Appendix Tables
Table A2.1 Business status by SIC code for Wal-Mart area firms Table A2.2 Basic Descriptive Statistics about Firms in the Wal-Mart area from the
Dun & Bradstreet data Table A2.3 Business status by compete status for Wal-Mart area firms Table A2.4 Business status by relative location for Wal-Mart area firms Table A2.5A Regressions to predict out-of-business status for Wal-Mart area firms Table A2.5B Regression to predict out-of-business status for Wal-Mart area firms Table A2.6 Distance (in miles) to Wal-Mart of existing and new businesses in
2007 Dun & Bradstreet survey Table A2.7A OLS Regressions to predict change in employment for Wal-Mart area
firms Table A2.7B Regression to predict percentage change in employment for Wal-Mart
area firms Table A2.8A OLS Regressions to predict change in sales for Wal-Mart area firms Table A2.8B Regression to predict percentage change in sales for Wal-Mart area
firms

viii

1
The Impact of an Urban Wal-Mart Store on Area Businesses:
An Evaluation of One Chicago Neighborhood’s Experience
Introduction
Since opening its first store in Bentonville, Arkansas in 1962, Wal-Mart Stores Inc. has expanded to more than 3,400 Wal-Mart stores and 550 Sam’s Clubs domestically and has become the largest retailer and private employer in the U.S. (Basker, 2007). Wal-Mart expanded in concentric circles from its Bentonville hub through rural, small town, and then suburban and small city areas of the south-central, southeast, northeast, and finally western regions of the U.S. Wal-Mart has achieved nearly complete coverage of these non-urban markets. Consequently, large inner city areas represent Wal-Mart’s last frontier for virgin expansion in the U.S., and the company has embarked on an aggressive effort in this direction. However, Wal-Mart’s big city urban expansion plans have roused strong local political opposition. As of October 2007, there were only two big-city Wal-Mart’s among the three largest cities, one in Los Angeles and one in Chicago (Wal-Mart Store Locator, 2008). New York City has not yet allowed any Wal-Mart stores within its city limits (Jones 2007), although the retailer is still eager to enter that market (Massey, 2009). Recently, Wal-Mart has indicated that it is hoping to expand across the City of Chicago, starting with a store on the South Side (Bustillo, 2009). The economic policy debates, in Chicago and elsewhere, have centered on Wal-Mart’s impact on local jobs and wages, as well as consumer prices and community retail development needs. Evaluations of the community development impact of the next phase of the company’s continued expansion are necessary to inform efforts by decision makers and community activists to respond to Wal-Mart’s employment and investment policies. So far as we know, this is the first empirical study of the local economic impact of a Wal-Mart in a large city. As such its conclusions should be highly relevant for scholars, public officials, and community activists seeking to understand consumer choices and improve economic opportunity for inner city residents.
2
Studies of Wal-Mart’s Economic Development Impact
Kenneth Stone published the earliest and most direct studies of Wal-Mart’s impact on local economic development (1998, 1995A).1 Using local retail sales tax data, Stone evaluated the impact of Wal-Mart’s growth in small towns in Iowa between 1983 and 1993. Breaking the data down by two-digit SIC code, Stone computed “pull factors” (PF) equal to “per capita sales for a community” divided by “per capita sales for the state” in current dollars for different communities and industries. He measured percentage changes in these pull factors over time relative to a base year – one year before the Wal-Mart opened. Stone’s results show clear evidence of a very large localized and specialized Wal-Mart impact causing: a) PF declines in all non-General Merchandise sectors except for Home Furnishings and Eat and Drink in Wal-Mart towns, b) generally larger PF declines in all retail categories with the exception of “Food” (not sold by Wal-Mart during this period) in non-Wal-Mart towns, c) Across all categories, a five year 6.0 percent increase in the PF for total sales in Wal-Mart towns versus a -10.4 percent decline in Non-Wal-Mart towns, d) Larger market share losses for non-Wal-Mart towns that were within 20 miles of Wal-Mart towns than for non-Wal-Mart towns that were farther away, e) An estimated 23 percent decline in the number of retail stores in Iowa, based on PF losses by store category and average sales per store by retail category in 19932, and f) an overall decline in the value of retail sales, over the 1983 to 1993 period in Iowa in addition to this large substitution effect. Stone has generalized his work to rural communities (1997) and shown similar results for Wal-Mart Supercenters in Mississippi (Stone, Artz and Myles 2002). Other regional studies of Wal-Mart’s impact (all looking at rural areas) have come to similar conclusions (see citations in Neumark, Zhang and Ciccarella , 2007). One critique made of Stone’s work, and other similar regional studies, is that the “before and after” methodology employed does not take possible endogeneity of the location and timing of Wal-Mart store openings into account (Neumark, Zhang and Ciccarella, 2007, Basker, 2007). One response to this criticism is that it ignores the differential effects of Wal-Mart on merchandise categories sold by Wal-mart (“general merchandise” and “department store”) and not sold by Wal-mart (food).in Stone’s study. It seems unlikely that these impacts cannot be attributed to an “endogenous” effect of Wal-Mart store location. Stone’s results show that Wal-Mart stores in rural areas gain market share at the expense of both other in-town stores and nearby (up to 20 miles away in rural Iowa) retail stores. This results in large market share losses for other stores, and a large reduction in the number of retail outlets overall. If the large PF increases found in “Wal-Mart towns” and the large declines in “non-Wal-Mart towns” were the result of a very successful Wal-Mart site selection process that targeted fast growing retail markets, there is little reason to believe high relative growth rates would be confined to the general merchandise and department store categories.
1 Stone’s well-known simple and direct analysis is not included in Basker’s (2007) otherwise comprehensive review of the literature on the “causes and consequences of Wal-Mart’s growth”. 2 Calculated from Table 4, p. 68 (Stone, 1995).

3
Recent econometric studies using national level data over a 20- to 30-year time period have had mixed results. Some studies corroborate Stone’s analysis by showing retail employment and payroll losses in counties where a Wal-Mart opened relative to counties with no Wal-Mart (Neumark, Zhang and Ciccarella, 2007 and Dube and Wertheim, 2005), but others show retail and wholesale employment gains in these counties (Basker, 2005)3. All of these studies use time-series and spatial regression with an “instrumental variable” that attempts to control for the impact of the possible endogenous site selection effect discussed above. Two studies done by Neumark, Zhang and Ciccarella (2007) and Dube and Wertheim (2005) exploit the pattern of Wal-Mart’s spatial expansion to construct their instrumental variable. Neumark, Zhang and Ciccarella (2007) estimate that each new Wal-Mart store reduces county-level retail employment by about 150 workers so that each Wal-Mart worker replaces about 1.4 non-Wal-Mart retail workers. In addition, they determine that a new Wal-Mart reduces county-level retail earnings by 1.3 percent. Dube and Wertheim (2005) find that in urban counties with a Wal-Mart, the wage bill for workers in the general merchandise and grocery sectors declines by 1.3 percent, whereas the wage bill in rural (non-MSA) counties with a Wal-Mart does not change. In another study, Basker (2005b) finds that the number of retail jobs in a county with a Wal-Mart store increases by 50 after five years; however, this is partially offset by a 30 worker wholesale job decline in these counties over the same period. Basker (2005) uses planned Wal-Mart opening dates as an instrumental variable for the timing of Wal-Mart openings in her estimations and drops small and historically declining counties from her sample to control site location selection bias. She does not find a statistically significant effect in counties that are adjacent to Wal-Mart counties. In a more recent survey article, Basker (2007) highlights Wal-Mart’s efficiency gains, noting that the McKinsey Global Institute estimated in 2001 that Wal-Mart’s real value added per worker was more than 40 percent higher than that of other General Merchandise retailers. This is consistent with Neumark, Zhang and Ciccarella’s (2007) finding that every Wal-Mart worker replaces at least 1.4 non-Wal-Mart retail workers. Basker’s (2005) econometric results showing employment gains, however, appear inconsistent with the McKinsey study. This finding may be due to Basker’s elimination of small and declining counties from her sample and her choice of instrumental variable4. Dube and Wertheim’s (2005) results are also consistent with Stone’s (1988, 1995) findings that the job loss and total wage bill decline as a result of Wal-Mart’s efficiency gains. Both effects could be mitigated in urban areas because, in these heavily-developed areas, there are few opportunities to draw consumers from nearby cities and towns. In this context, we note that since Wal-Mart only sells certain retail commodities, evaluations of the welfare impact of Wal-Mart’s overall wage and price effects should not be based on simple comparisons of wage and price reductions. Direct comparisons of wage and price reduction
3 Sobel and Dean’s (2007) recent study finds that finds that, after controlling for other variables, US states with more Wal-Marts did not have a smaller or less profitable small business sector. 4 It is unclear why “planned” opening dates should be any less correlated with retail market (and employment) growth than “actual” opening dates.

4
estimates such as those made by Basker (2007) can be misleading if they do not take other rising costs such as health care, education, housing, and costs of other consumer goods, such as cars and gas, into account in assessing actual “real” wage increase or decrease.

5
The Chicago Wal-Mart Study
In the spring of 2004, Wal-Mart submitted zoning applications to locate stores in two different Chicago neighborhoods. After a number of highly contentious Zoning Board and City Council meetings, Wal-Mart was given approval for a store on Chicago’s West Side.5 This controversial decision was followed by an effort to enact a “big box living wage” ordinance in Chicago that would require Wal-Mart and other large retailers to pay a “living wage” and provide health benefits (Baiman, 2006). The Big Box Living Wage Ordinance was passed by City Council but provoked a heated debate and led to the first Mayoral veto in 17 years. The new Wal-Mart opened at the end of September 2006. At present Wal-Mart is considering opening a number of other outlets in the city of Chicago. The goal of our study is to evaluate the local employment, wage, and sales impact of a Wal-Mart store in an inner-city area. In an urban context, unlike a rural or suburban setting, a Wal-Mart store has limited ability to attract customers from outside the political jurisdiction where it is located because there are many alternative retailers. We therefore expect much of the retail spending going to a Wal-Mart store to replace spending that would have otherwise gone to stores in the neighborhood.
A Wal-Mart store has a higher sales-to-employee ratio than the smaller stores whose customers it attracts. This means that it may employ fewer workers to sell merchandise that would otherwise be sold by less efficient stores. The result is that Wal-Mart may reduce, rather than increase, local retail employment.
5 The exact location of the store is 4650 W. North Ave, Chicago IL 60639.
6
Methodology
In order to study the effect of Wal-Mart on economic activity in the West Side neighborhood where it is located, we gathered baseline (“pre-Wal-Mart”) information and measure post-Wal-Mart changes in activity over two years. We attribute changes in economic activity to Wal-Mart’s presence by comparing (1) pre-Wal-Mart activity and trends to post-Wal-Mart activity and trends, (2) changes in activity near Wal-Mart to changes further away and (3) changes in product lines that directly compete with Wal-Mart to those that do not. We use a variety of data to make these comparisons.
Survey Data
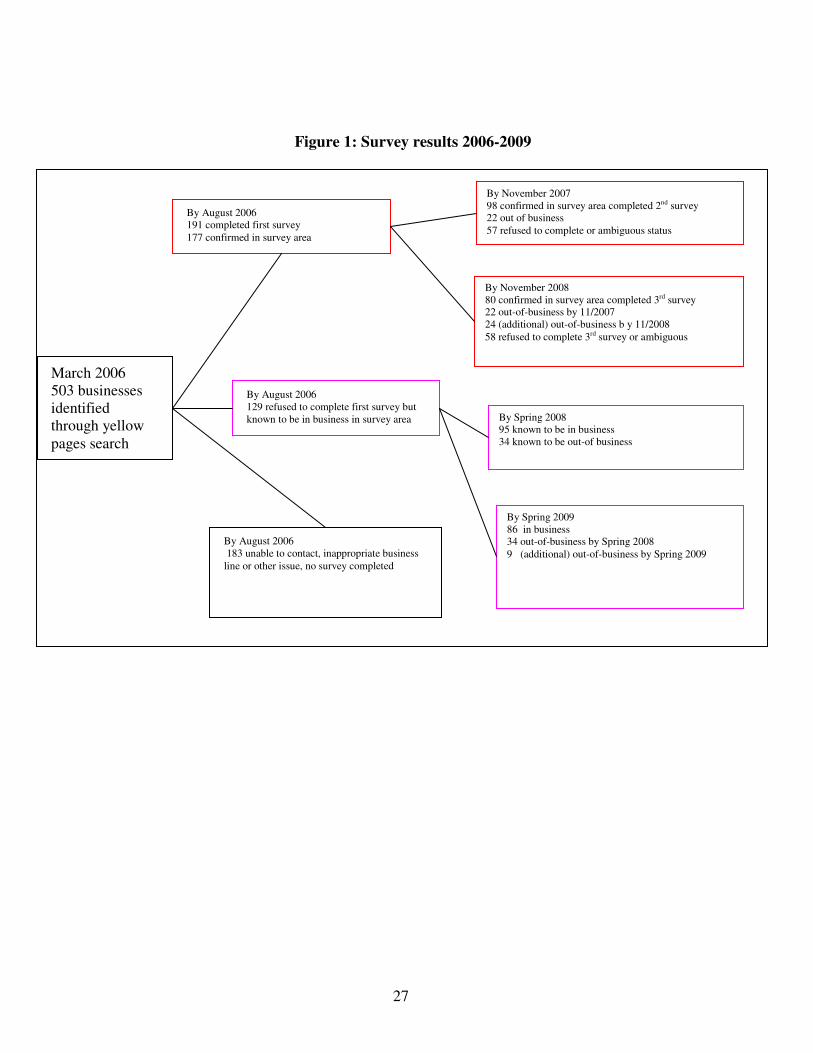
We obtained our main source of data about business activity in the neighborhood of the new Wal-Mart store by conducting a series of phone surveys of local businesses.6 Figure 1 outlines the three waves of surveying and associated follow up investigations. Using geographically coded MSN Yellow Pages listings for retail stores, we assembled a list of 503 businesses in the major retail categories that compete with Wal-Mart. Our target area covered businesses within a four-mile radius of Wal-Mart, and in an area roughly bounded by Irving Park Avenue to the north, Western Avenue on the east, Roosevelt Avenue on the south, and Harlem Avenue on the west. From March through late August 2006, we implemented our telephone survey and were able to obtain baseline (pre-Wal-Mart opening) data on the number of hours worked by owners and employees, number of employees, starting and average wages, whether benefits are offered, and some prices. In early summer 2006, we began supplementing our phone surveys with on-site visits to businesses that had not responded by telephone. We particularly concentrated on stores in the “Washington Square Mall” located only one block away from the new Wal-Mart. At the very least, these in-person visits allowed us to collect price data even if businesses did not respond to our other questions. In an effort to get a wider array of stores and more pricing information we expanded our original sample of general merchandise store, discount store, apparel stores, drug stores, and hardware stores, to include baby and infant stores, electronic stores, toy stores, shoe stores, and office supply stores. By the end of our first survey period, we obtained 191 unique completed surveys of which 177 were verified as in the survey area. Beginning in March 2007, we re-surveyed those stores that completed surveys in 2006. Again these were mostly telephone surveys, involving multiple calls to the same store until someone answered or explicitly asked not to be contacted again, followed by a few site visits. This second
6 We originally considered conducting a quasi-experimental study, to compare the West Side Wal-Mart neighborhood
to a similar Chicago neighborhood without a Wal-Mart. After an intensive effort to find a “control” region within the City of Chicago, we concluded that no other area of the city could serve as an appropriate control, because no other area had experienced such a large recent decline in retail and overall employment in recent years. We therefore elected to survey a larger “target” area as than we had originally anticipated. This methodological change was based on an a judgment that spatial regression techniques that attempt to capture patterns of employment, property value, wage, and price, change as distance from the Wal-Mart increases, would better control for Wal-Mart’s effects than a survey of a completely different area in the city.

7
wave of surveying continued through early November 2007, when surveying was discontinued to avoid the potential that holiday seasonal employment could distort employment data.. Our third wave of data collection began in March 2008 and ran through early November 2008. In addition to the basic sample followed forward, the ongoing status (i.e. in business/out of business) of the initial stores as of 2007 and 2008 was established. In addition to the initial 177 interviewed stores, 136 stores were followed in this manner of which 129 stores were verified as in the survey area. This yields a sample of 306 (177+129) retail establishments for which line of business and ongoing status as of 2006, 2007 and 2008 are known. Other Sources of Information about Wal-Mart’s Impact
1. Sales tax data by zip code We obtained zip code-level data on taxable sales from the Illinois Department of Revenue (IDOR), by quarter, from the first calendar quarter of 2000 through the third quarter of 2008. The dataset included the zip code in which Wal-Mart is located, 60639, and nine surrounding zip codes. We analyze these data to determine whether Wal-Mart has increased taxable sales in its own zip code and/or suppressed taxable sales in nearby zip codes. 2. Employment data from Illinois Department of Employment Services (IDES). Through its operation of the state’s unemployment compensation system, the IDES collects detailed data about employment, total earnings and other aspects of firm operation at the establishment level. The IDES publishes some aggregations of data about total employment by zip code and industry for March of each year. We have constructed a data set about employment by retail firms in the Wal-Mart neighborhood based on this publicly released annual data through March 2008. 3. We attempted a qualitative study of Wal-Mart’s small “Jobs and Opportunity Zones” program which was designed to aid area businesses. Our research and findings about this program are discussed in the Appendix 1 4. Finally in appendix 2 we present information on our analysis of Dun and Bradstreet data.

8
Findings from Survey Data
2006 Baseline Survey and Response Rate
We had a total of 503 retail businesses in our original “universe.” In our first round of calling in 2006 (baseline data collection), we completed surveys of 191 unique businesses for a response rate of about 38 percent. 177 of these were verified as in the sample area. Descriptive information about some our findings from the first survey are contained in Table 1. On average, the firms we surveyed in 2006 had about ten employees and paid a wage of $8.08 per hour. Fifty-one of the firms reported offering health care coverage to their employees. About half were owned by Chicagoans while the rest had dispersed ownership. Many of the businesses had owners that worked directly in the store for many hours (an average of almost 49) each week. Many of the businesses had women or minority owners. As part of our survey, we asked each business to indicate the product lines in which they operated. All businesses in our survey had product lines that overlapped with Wal-Mart’s. Many businesses carried multiple product lines – among the most popular were apparel (48 percent) and drugs (31 percent). We also geo-coded the location of all the stores in our sample and measured the distance from each business to Wal-Mart. Businesses ranged from as little as one-tenth of a mile from Wal-Mart to as far as four miles from Wal-Mart with the average business about two and one-third miles from Wal-Mart. 2007 Survey Response Rate In our 2007 survey, we were able to complete repeat surveys for 98 of the original 177 area businesses, for a 2007 repeat-survey response rate of about 55 percent. As shown in Table 2, about one-third (32 percent) of the 177 businesses we originally surveyed refused to participate a second time. In addition we conclude that 22 businesses went out-of-business sometime between our 2006 survey and our 2007 survey attempt. These included nine businesses that had disconnected phone numbers, six businesses that had become different stores since 2006, and seven businesses that completed surveys in 2006 but that we were unable to contact despite repeated attempts in 2007.
2008 Survey Response Rate For part A of our 2008 survey, we attempted to contact all the 155 businesses in the 2007 sample which had not yet gone out of business (i.e. 155=177-22). We were able to complete repeat surveys for 80 of these, for a 2008 repeat-survey response rate of about 52 percent. As shown in Table 2, 58 of the businesses we resurveyed refused to participate in the 2008 survey. In addition we conclude that 24 businesses went out-of-business sometime between our 2007 survey and our 2008 survey attempt. These included 17 businesses that had disconnected phone numbers, two businesses that had become different stores since 2006, and seven businesses that completed surveys in 2006 but that we were unable to contact despite many repeated attempts in 2008.

9
Part B of the 2008 survey, generates an additional sample of 129 businesses that were in the original 2006 sampling universe of 503 retail businesses and in the sample area, but never before contacted. For these businesses, we were able to ascertain only whether they were in business as of 2007 and 2008 and in what line of goods they specialized. For firm survival this means a total sample of 306 (306=177+129; see Figure 1). The top of Table 3 contains some summary statistics about businesses that responded to both the 2006 and 2007 surveys. On average, these businesses had about ten employees and had 14 percent more employees in 2007 than they had in 2006. The firms paid an average wage of $8.47 per hour, which was about four percent higher than the average wage they reported in the 2006 survey. The bottom of Table 3 shows the same statistics for businesses that responded to both the 2007 and 2008 surveys. These businesses had 12.4 full-time equivalent employees in 2008, a fall on average of about 5 percent since 2007.7 Wage movements between 2007 and 2008 are small, going from $8.66 to $9.02 or a 4.0 percent increase.8 Distance from Wal-Mart and Retail Closures
Figure 2 plots the location of the 306 businesses in the overall survival sample relative to Wal-Mart and identifies those that went out of businesses between 2006 and 2008. Table 4 presents evidence on the probability of going out of business by geographic relation to Wal-Mart in tabular form. Although there is some variance in the rate at which firms went out-of-business across quadrants—from a high of 29.5 percent in the northeast quadrant to a low of 22.4 percent in the southwest—the differences are not statistically significant. Table 5 reports on several regression specifications that test the hypothesis that proximity to Wal-Mart influences the probability a competing business will fail. Column (1) reports the results of a simple ordinary least squares regression of distance to Wal-Mart (in miles) on a dummy variable that equals one if the respondent business closed between our 2006 and 2007 surveys. The constant suggests that in the immediate vicinity of the Wal-Mart location about 25 percent of competing businesses closed in this first year. The negative and significant coefficient indicates that each one-mile increase in distance to Wal-Mart reduced the probability of closing by about four percent. Thus at three miles, a competing business had only a 13 percent chance of closing in that year. The ordinary least squares regression in column (3) suggests that these effects continued at much the same pace in the second year of the 2006-2008. A business in the immediate proximity of Wal-Mart had about a 40 percent chance of closing some time over the two year period. This chance fell at a significant rate of almost 6 percent per mile. Thus at three miles, a competing business had only a 22 percent chance of closing in the two year period. Columns (2) and (4) replicate columns (1) and (2) using the probit functional form to constrain the predicted probability to be between zero and one. The results of these tests essentially replicate the simpler
7 The small sample (29 retailers) for which employment figures are available for all three years show modest declines from 9.5 full-time equivalents in 2006 to 8.8 in 2008. 8 The small sample with wage rates for each of the three years (11 retailers) shows a small decrease from $8.85 to $8.55, 3.4 percent.

10
forms in columns (1) and (2). Column (5) shows results when the sample is limited to three miles. For this smaller sample, the coefficient on the distance parameter is consistent with the other estimates. The general decline of closures with distance from Wal-Mart seems independent of direction. None of the simple models of business closure is significantly altered by the introduction of quadrant variables. Similarly, base-year employment fails to enter the regression as significant. Including this variable leaves distance insignificant as well. Table 6 breaks down the going-out-of-business regression (2006-2008) by retail line of business. All of these lines show negative distance effects and for a majority these effects are statistically significant. The largest distance effect is found for toy stores at 25 percent per mile. A hypothetical toy store adjacent to Wal-Mart had a 75 percent chance of going out of business. A toy store three miles away had almost no chance. A similarly large impact was found for electronics stores, starting at 62 percent and falling off 22 percent per mile. Office supply stores had much the same pattern. Estimated Job Loss from Wal-Mart
Business closures generated by a Wal-Mart “distance effect” result not only in losses to business owners, but also in declines in employment that would not otherwise have occurred. An estimate of these employment declines builds from the basic linear equation in Table 5 restricted to establishments within four miles of Wal-Mart (Column 1, Table 5a). The expected employment
loss for each establishment is estimated as regression coefficient × (4 - distance from Wal-Mart)
× (average employment in 2006 of establishments that closed by 2008). Average employment of the sampled establishments that closed by 2008 was 6.05 full-time equivalent workers. This gives an estimate of 189 full-time equivalent jobs lost through the Wal-Mart effect on the 306 sampled stores. If we adjust this estimate for stores which were never contacted (482/306), the estimated loss increases to 298. With some adjustments, the job-loss figures estimated here can be compared to the assertion that Wal-Mart employed some 426 workers at its Chicago store, 310 of whom were “sales associates.”(Mitts, 2008) Many of the latter were undoubtedly part-time workers. An estimate of about 320 full-time equivalent workers (assuming half the 426 workers were part-time) would very likely be generous. Table 7 reports on additional regressions with dependent variables that measure the change in employment and wages in surviving stores that responded to both the 2006 and 2007 surveys and surviving stores that responded to both the 2006 and 2008 survey. Distance to Wal-Mart was not significantly correlated with either of these variables in either sample.

11
Summary:
In our data we find evidence that proximity to Wal-Mart was correlated with the probability
that businesses closed during the first and second years of Wal-Mart’s operation. The observed
effect grows over the two years suggesting that it is persistent and more significant than the first
year data of the preliminary report suggested. Rough comparisons of employment losses
associated with Wal-Mart’s opening and Wal-Mart’s own labor force suggest that Wal-Mart had
little or no net effect on total employment in the area.

12
Findings from Sales Tax Data
We obtained quarterly data about taxable sales for the zip codes mapped in Figure 4 from calendar quarter 1 of 2000 through calendar quarter 2 of 2009, but we only use data through quarter 2 of 2008 to avoid confounding trends with the financial crisis that began in September of that year. These data were provided by the Illinois Department of Revenue. As noted on the map, the Wal-Mart store lies in zip code 60639 just across the border from zip code 60651. In 2005, zip code 60639 had taxable sales of about $743 million. These sales were growing at a healthy 7.5 percent per year before the opening of Wal-Mart. We do not have data on the annual sales of the Chicago Wal-Mart, but according to the “Two-Year Economic Report Card” (Mitts, 2008) on the impact of the Wal-Mart store issued by Alderman Emma Mitts, Wal-Mart paid $10.4 million in sales taxes (all levels) in its first two years of operations. This figure implies sales of at least $55 million per year.9 Alternatively, we know that, according to Wikinvest (2008), in 2005 US sales by Wal-Mart averaged $438 per square foot. Since Chicago’s Wal-Mart is 142,000 square feet (Jones 2008), we might expect its sales to be about to be about $61 million dollars per year. Using a figure of $60 million, these sales amount to about eight percent of the sales in the zip code.
Table 8 reports the results of some simple regressions that attempt to measure the impact of Wal-Mart’s opening on total sales in zip code 60639. In these regressions the dependent variable is the natural log of taxable sales measured in millions (i.e. 100*sales taxes/1,000,000). In Model 1_1 and 1_2 the sample is restricted to the period prior to Wal-Mart’s opening in the third quarter of 2006. Independent variables in Model 1 include dummy variables for each quarter and a zip code specific intercept and a variable that denotes the year. The coefficients on the quarter dummies show that sales are highest in the second and fourth quarters and somewhat lower in the third and (omitted) first quarter. The coefficient on year implies that, when all else is equal, sales in the average zip code of the area grew at about 0.5 percent per year, but this trend was not significant. The model explains 96 percent of the variation in sales across zip codes over time. Model 2 generalizes the specification by including variables that interact between zip code and year so that each zip code is allowed to have its own rate of growth over time. The excluded zip code is 60639 where Wal-Mart is located so that the coefficient on year (7.4 percent) can be interpreted as the yearly growth in sales in that zip code—this is 7.4 percent. Model 1_3 uses data from the entire period (first quarter 2000 through first quarter 2008) and includes a variable that allows a break-in-trend for the Wal-Mart zip code in the period after it opened (third quarter of 2006 through first quarter 2008) and zero otherwise. This “Wal-Mart dummy” should reflect any break-in-trend in sales growth in zip code 60639 after Wal-Mart opened. The estimated break-in-trend amounts to -9.6 percent. The negative coefficient on the break-in-trend for Wal-Mart’s home zip code is a bit puzzling (since we expected sales to rise in this zip code). This coefficient is not significantly different from zero. However, its magnitude is larger than Wal-mart’s home zip code trend growth rate. After Wal-Mart opened, growth in zip code 60639 fell to about zero. Rather than launching a new wave of retail development in its zip code, Wal-Mart’s opening coincides with a stagnation of retail growth in that zip code.
9 The calculation here assumes the full tax rate of 9.25 percent until July 2008 and 10.25 percent after that. Many items sold at Wal-Mart qualify for lower tax rates. Hence the actual sales are undoubtedly higher.

13
Table 9 reports on more general regressions that allow each zip code to have its own Wal-Mart dummy and thus do not impose the assumption that Wal-Mart had no impact on sales in surrounding zip codes. Model 2_post 1999, the regression reported in column 1, uses all of the data. In this regression, nine zip codes in addition to 60639 show estimated negative break-in-trends, but none of these are significant statistically. Two zip codes, 60304 and 60612 show positive breaks-in-trend, both of which are significant (at the 1 percent and 5 percent level respectively.) There is not an obvious reason why these two zip codes should respond to the Wal-Mart opening in this fashion. These two zip codes are both relatively distant from Wal-Mart. We reran the same regression excluding data from 2000, 2001 and 2002 to abstract from the recession that hit the nation (and the area) beginning in early 2001. These results are reported as Model 2_post2002 in column 2 of Table 9. When we do this the adjusted R-square rises slightly, the negative coefficient on the Wal-Mart home break-in-trend is now significant at better than the 1 percent level. Nine other zip codes continue to show a negative break-in-trend, with three of these now significant, 60618, 60651, and 70707. Of the five positive signs only 60301 is now significant. The regressions in columns 3 and 4 of Table 9 further trim the sample by excluding observations from 2003 and 2004, respectively. The last of these is perhaps the best measure of the impact of Wal-Mart’s opening on taxable retail sales. It compares each zip code’s retail sales growth in the year and a half before Wal-Mart’s opening to that zip code’s growth in the year and a half after Wal-Mart’s opening. When this is done the coefficient on Wal-Mart’s home zip code’s break-in-trend variable remains negative and highly significant. There are no significant positive breaks-in-trend for this last model and four non-home zip codes retain highly significant negative breaks-in-trend.10 Summary: Our analyses of data on taxable sales in Wal-Mart’s home and adjacent zip codes
are consistent with the hypothesis that Wal-Mart’s sales displace a significant amount of sales
from its home zip code. Sales in zip code 60639 remained flat despite Wal-Mart’s opening. There
is also some evidence that Wal-Mart’s sales reduced sales in some nearby zip codes, but this
effect seems to be inconsistent.
10 If we extend the sample of this last model up through the second quarter of 2009, virtually all the zip codes show a negative break-in-trend, but these results are very likely influenced by the severity of the recession after the third quarter of 2008.

14
Findings from Retail Employment Data
Tables 10 and 11 follow the analytical approach of Tables 8 and 9, but applied to annual retail employment data not quarterly sales tax data. The dependent variable of Table 10 is the natural log of March retail employment for zip code and year. In Model 1 and 2 the sample is restricted to the years prior to Wal-Mart’s opening in the third quarter of 2006, i.e. the March observations for 2001 through 2006. Independent variables in Model 1 include a zip code specific intercept and a variable that denotes the year. The coefficient on year implies that, all else equal retail employment grew at about 4.9 percent per year. The model explains 93 percent of the variation in employment across zip codes over time. Model 2 generalizes the specification by including variables that interact between zip code and year so that each zip code is allowed to have its own rate of growth over time. For zip code 60639 where Wal-Mart is located the coefficient on year is 0.33 percent and not significantly different from zero. Model 3 uses data from the entire period (2001 through 2008) and includes a break-in-trend variable that equals t-6 in the Wal-Mart zip code in the period after it opened and zero otherwise. This “Wal-Mart dummy” should reflect any jump in employment growth in this zip code after Wal-Mart opened. The estimated coefficient is +9.5 percent. However, it is not significant at the 10 percent level with a t-statistic of 0.87. A 95 percent confidence interval on the estimated coefficient ranges from -12.4 percent to +31.4 percent, meaning we cannot reject the hypothesis that Wal-Mart had no effect on total employment growth in its zip code. Table 11 reports on more general regressions that allow a break-in-trend Wal-Mart dummy on Wal-Mart’s zip code and a similar dummy for all other zip codes aggregated together. Here (in column 1) the home Wal-Mart dummy stays the same and the neighboring Wal-Mart dummy comes in at -5.0 percent, but also short of significance at the 10 percent level (t=1.45). Unfortunately, since we do not have quarterly employment data we do not have enough observations to estimate separate break-in-trend coefficients for each non-Wal-Mart zip code. 11 We reran the same regressions excluding data from 2001 and 2002 to abstract from the recession that hit the nation (and the area) beginning in early 2001. These results are reported in column 2 of Table 11. When we do this, the coefficient of the home zip code break-in-trend dummy is essentially zero (actually it goes a slight bit negative). The coefficient on the aggregate dummy for neighboring zip codes increases absolutely to -8.2 percent and is significant at the 10 percent level. Summary: Our analyses of data on retail employment in Wal-Mart’s home and adjacent zip
codes are consistent with the hypothesis that Wal-Mart’s sales displace some employment from its
home zip code. There is also evidence that Wal-Mart’s presence reduced employment in some
nearby zip codes.
11 Alternatively we might define the Wal-Mart dummies not as permanent effects on trend growth but as one time shifts in the intercepts. This approach gives much the same results as reported above. Here if a Wal-Mart level dummy is introduced just for the home zip code, it comes in with a coefficient of 25.1 percent, but not significant at the 10 percent level (t=1.41). Adding a Wal-Mart level dummy for neighbors as a group gives a coefficient of -7.2 percent but again not significant (t=-1.29).

15
Summary and Conclusions
Our study of Chicago’s West Side Wal-Mart has provided evidence that, in an urban setting, proximity to Wal-Mart is associated with a higher probability of going out of business for local retail establishments. In addition, we have some evidence that the West Side Wal-Mart has replaced sales and employment from its own and neighboring zip codes. All of these findings, however, show modest, but significant effects. Our first two years of survey data produced statistically weak and inconsistent results linking distance to Wal-Mart with likelihood of going out of business during Wal-Mart’s first year of operation. However, our second round of surveys began only six months after Wal-Mart’s opening so that we capture only short-run effects. Our third round of surveys began in March 2008. Those data provide stronger evidence about Wal-Mart’s long-run effects. The impact on store closures by distance from Wal-Mart is larger and more significant in this last sample. Our estimates suggest that Wal-Mart has resulted in the loss of about 300 full-time-equivalent jobs in its own and nearby zip codes. While there is still considerable uncertainty attached to these calculations, they suggest a loss about equal to Wal-Mart’s own employment in the area. These estimates support the contention that large-city Wal-Marts absorb retail sales from other city stores without significantly expanding the market. The above estimate focuses only on store closings. Of course, some new stores have entered the area since Wal-Mart opened. We do not have estimates on these store openings. We simply do not know their geographic pattern. In any case, we have no reason to expect them to offset the effects on closures documented here. Sales tax data from the Illinois Department of Revenue suggest that Wal-Mart’s sales displace sales from businesses within the same zip code. However, our findings with these data showed small and inconsistent effects, so we cannot at this time say definitively that Wal-Mart caused a reduction in sales in adjacent zip codes. Illinois Department of Employment Security data on retail employment in Wal-Mart’s own zip code and nearby zip codes are largely consistent with our survey findings. Retail employment levels in Wal-Mart’s own zip code rise modestly (presumably because of Wal-Mart own employees), but retail employment trends in neighboring zip codes show a negative effect after Wal-Mart’s opening. These findings like those from our survey are consistent with but somewhat more muted than findings by Neumark, Zhang, and Ciccarella (2007) which suggest that nationally every Wal-Mart worker replaces about 1.4 non-Wal-Mart workers.

16
Appendix 1
Jobs and Opportunity Zones
On April 2006, Wal-Mart CEO, Lee Scott, announced that the new Wal-Mart store in the West Side of Chicago would be the first of ten sites to adopt an initiative called “Jobs and Opportunity Zones.” According to the original article on Wal-Mart’s website, this initiative was designed to help the economy in poor neighborhoods thrive by accomplishing several things. (Wal-Mart Stores, 2006) First, through the “Small Business Spotlight”, five small local businesses would be chosen each quarter to be featured in advertisements in both local newspapers and Wal-Mart’s in-store radio network. Business owners would receive a “Wal-Mart Trend Report” and would be able to attend seminars held by Wal-Mart’s Business Development Team on how to thrive with a Wal-Mart nearby (ReclaimingDemocracy.org, 2008). Finally, a grant of $300,000 would be donated to different local chambers of commerce and Wal-Mart would work with them to create effective programs for the funds.12
After Mr. Scott’s first announcement, Wal-Mart released very little information about the Jobs and Opportunity Zones Initiative. We made several attempts to contact Daphne Davis-Moore, Wal-Mart’s Community Affairs Manager, and Camille Lilly, President of the Austin Chamber of Commerce through telephone calls, emails, and formal letters to find more information. However, we were unable to obtain even basic information beyond the list of businesses chosen for the “Small Business Spotlight”. According to a Chicago Tribune article, the Illinois Hispanic Chamber of Commerce (IHCC) received $75,000 out of the grant Wal-Mart gave (Jones, 2007). Omar Duque, president/CEO of the IHCC, commented during a phone interview that the projects they were working on in relation to Wal-Mart focused on taking advantage of the higher traffic of customers going through the area due to Wal-Mart’s presence. He was unable to describe a specific program or project implemented with the Wal-Mart grant since he had not been directly involved. We are currently in the process of trying to contact someone at IHCC who can provide more information. Representatives from two of the five original businesses chosen to be part of the “Small Business Spotlight” program also were contacted. In phone interviews both Curlie Anderson from Curlie’s Bakery and Norman Delrahim from B & S Hardware, Anderson and Delrahim confirmed that Wal-Mart published ads for their businesses in local newspapers, but neither was able to confirm that there were radio ads in Wal-Mart’s network. Neither attended a seminar on how to thrive with a Wal-Mart nearby, and Delrahim added that Wal-Mart was no longer planning to hold seminars. Curlie Anderson reported feeling disappointed at the results and said, “This initiative was pretty much a failure.” Anderson believed however, that Wal-Mart was not to blame for this failure since they did their part. Rather, Anderson blamed the local chambers of commerce for taking Wal-Mart’s money but not using it to help the small businesses. The local chambers of
12 The original figure given in the article that first announced the initiative on Wal-Mart’s website (Wal-Mart Stores, April 2006) was $500,000, but nine months later the figure had dropped to $300,000 (McCain, 2007) and Wal-Mart’s original press release was no longer available on its website. The press release can still be found in the Reclaiming Democracy website at http://reclaimdemocracy.org/walmart/2006/opportunity_zones.php.

17
commerce offered Anderson and Delrahim an opportunity to use Wal-Mart funds to hire high school students, but both business owners turned down the offer since they needed more skilled workers. (Jones, 2007)
JMX Media Group is one of the five businesses that were chosen for the second quarter of 2007 for the ‘Small Business Spotlight’ program (Jones, 2007). In a telephone interview, the owner of this business, Sid Daniels, stated that he saw ads for his business in the newspaper and heard them on the radio. He believed the seminars were held, but he was unable to attend. Like the other business owners, he did not work with any of the local chambers of commerce. Several attempts have been made to contact the other three businesses from original five chosen for the “Small Business Spotlight.” The telephone number available for Dandridge Hardware Center has been disconnected. The number for Dreambags works but there has been no response from them since the first attempt to contact them on September 2007 Finally, Active Auto Parts owner Chris Prayer has not been available to answer our questions and has repeatedly asked us to call back later.

18
Appendix 2
Analyses of D&B data
This appendix reports on our analyses of the D&B data. This data appears to suffer from (sometimes severe) measurement error. We purchased data from Dun and Bradstreet to supplement our survey data. Dun and Bradstreet (D&B) data provides basic information about each establishment’s location, line of business, number of employees and sales and is reputed to cover the universe of businesses in a given geographical area. In our conversations with vendors, we were told that D&B updates the files on a monthly basis but, as we discuss below, we have reason to believe that these updates may not always take place or may be quite cursory in some cases. We extracted D&B data for December 2005 (about 9 months before the Wal-Mart store opened) and December 2007 (about 15 months after the store opened). We extracted data on all retail businesses (1 digit SIC code 5) within a three mile radius of zip codes 60639 and 60651 (the Wal-Mart sits on the border of these two zip codes). According to the D&B data we received, Wal-Mart operates in the SIC code for department stores (5311) and has 400 employees. (The Wal-Mart establishment was excluded from other calculations using the D&B data.) According to the D&B data, there were twelve stores within five miles employing 1336 people in the 5311 SIC code in December of 2005, which indicates that Wal-Mart’s presence was a very significant factor in this industry and neighborhood. Every firm in the D&B data has a primary four-digit SIC code which describes the main products sold in the establishment. We examined these codes and designated each establishment as selling a product that either competed or did not compete with Wal-Mart13. Of course, there were many establishments that were not in Wal-Mart’s four-digit SIC code but competed in one or more of Wal-Mart’s product lines. Based on the D&B data there were 175 establishments employing 959 people that competed with Wal-Mart within one mile of the store’s location in December 2005. There were an additional 478 establishments employing 2715 people within two miles of Wal-Mart. Thus, Wal-Mart was clearly an important presence in this neighborhood and market but perhaps not so large that it threatened to completely transform the market place. We divided the businesses in the D&B data into three groups: those that appeared in the 2005 data but not in the 2007 data, those that appeared in the 2007 data but not in the 2005 data, those that appeared in both the 2005 and 2007 data. We extracted a random sample of 20 businesses that appeared in the 2005 data but not the 2007 data and attempted to contact them using the name and address information provided by the 2005 D&B data. We found that at least five of these businesses were still operating in February 2008 despite the fact that they did not appear in our December 2007 extraction of D&B data. We also extracted a random sample of 20 businesses that appeared in both the 2005 and 2007 D&B data and attempted to contact them using the name and
13 Examples of competing SIC codes include Department stores (5311), Men's and Boys' Clothing and Accessory Stores (5611), Furniture Stores (5712). Examples of non-competing SIC codes include Lumber and Other Building Materials Dealers (5211), Retail Bakeries (5461), Motor Vehicle Dealers (New and Used) (5511), Musical Instrument Stores (5736). We designated Eating and Drinking Places (5812) as non-competing even though the Wal-Mart store does house a fast food restaurant on the theory that this establishment was likely to draw little business from nearby restaurants.

19
address information provided by the 2007 data. In February of 2008 we found that only 11 of the 20 businesses in this sample were open and operating under the name given in the D&B data. Three of the businesses were operating in a similar line of business but under a different name than that given in the D&B data. Despite repeated phone calls we could find no evidence that the other six businesses were operating at all. We also attempted to compare sales in 2005 to sales in 2007 for businesses that appeared in both data sets but found that, for the vast majority of establishments, there was no change in sales. Since it is very unlikely that annual sales in 2005 would be exactly the same as annual sales in 2007, we conclude that either D&B did not ask about sales for these establishments or that D&B conducted a only a cursory investigation (e.g. they said, “Are sales still X?”). Sales amounts differed for only 214 of the 2,070 establishments found in both the 2005 and 2007 data. Based on these analyses we concluded that the D&B data may provide less than perfect indicators of Wal-Mart’s impact on economic activity in that neighborhood. However, while the D&B data surely measure economic activity with error we have no evidence that they provide a biased estimate of Wal-Mart’s effect. We therefore provide a summary of our findings using this data here. Using the D&B data, we find additional evidence that proximity to Wal-Mart may have increased the probability that a businesses closed during the first year of Wal-Mart’s operation. This evidence is consistent with and, in fact, stronger than the results from our own survey. We also find some evidence that being in an SIC code that directly competes with Wal-Mart increased the probability that area businesses failed. In our analyses we assume that businesses that appeared in the 2007 data but not the 2005 data were new businesses started after December of 2005. Table A2.1 shows a cross-tabulation of business status (out-of-business, new business, existing business) by two-digit SIC code. There were 3378 (1308+2070) establishments in the 2005 data. Overall, in this neighborhood, 1308 firms went out-of-business while only 697 new businesses were started and 2,070 businesses were continuing. Thus, business existence is clearly very transitory in this neighborhood—about one out of three businesses in the 2005 survey was not in the 2007 survey. While there is some variance across SIC codes, it is clear that all business lines are quite unstable—at least 24 percent of each column have gone out-of-business. Table A2.2 shows basic descriptive statistics about the firms in our D&B data. We have some data on sales and employment for the vast majority of establishments in the 2005 data. In 2005 the average firm had almost eight employees and sales of more than $430,000, but the standard deviation on both numbers was very large. Sales and employment were similar in 2007. The average business in the 2005 survey reported that it was 15 years old, which seems hard to reconcile with the very rapid rate of business turnover found in the data. As shown in Table A2.1 about 17 percent of the business were new in 2007 and about 32 percent of the 2005 businesses were out-of-business by 2007. Sales amounts differed for only 214 of the 2,070 establishments found in both the 2005 and 2007 data. For establishments where the sales figures differed between the two years, we calculated the percentage change in employment and sales. In both cases we see

20
a substantial decline—sales fell by almost 16 percent and employment declined almost eight percent. Table A2.3 shows business status by compete/non-compete status. One might imagine that establishments that sold a competitive product to Wal-Mart would be more likely to go out-of-business than those that did not. The raw data, however, shows no evidence that this is true—38 percent (538/(538+862)) of the non-competing establishments in the 2005 data were out-of-business by 2007. An almost identical percentage (39 percent) of the competing establishments were out-of-business. Similarly, in both non-competitive and competitive SIC codes the number of new businesses was equal to about 20 percent of businesses in the 2005 sample. Thus, the raw data contain little evidence that the Wal-Mart store either hastened business failure or slowed business formation in competitive SIC codes. In parallel with out survey data we examined the geographic distribution of businesses relative to the new Wal-Mart store (Table A2.4). Nearly 70 percent of new businesses formed north of Wal-Mart. This was approximately proportional to the share of continuing and out-of-business establishments in the D&B data. In Table A2.5A we report results of regression estimates analogous to those reported in Table 5 but using D&B rather than survey data. As in our survey data, the OLS regression results in column (1) show that the probability an establishment went out-of-business significantly diminishes as distance to Wal-Mart increases. This qualitative result is maintained when we use a probit regression specification and add a dummy independent variable that equals 1 if the establishment is in a SIC code that competes with Wal-Mart and zero otherwise. When we add a variable that measures employment in 2005 as well (column 4) we get three significant coefficients all with intuitive signs. The probability of an establishment going out-of-business rises with proximity to Wal-Mart, being in a competitive SIC code and having fewer employees in 2005. In column 5 we find that establishments with higher sales volumes in 2005 and longer histories are also less likely to go out-of-business, although in this specification neither distance to Wal-Mart nor being in a competitive SIC codes is a statistical significant determinant of failure. In Table A2.5B we expand this regression by adding dummy variables for a number of two-digit SIC codes. Distance to Wal-Mart maintains a negative sign but is (barely) insignificant at a 10 percent confidence level14. Establishments in several SIC codes (apparel, furniture, and miscellaneous) have a particularly high probability of failure. We would like to know not only whether Wal-Mart contributed to the failure of some businesses but also whether it deterred new businesses from forming. We cannot run a regression analogous to those in Tables A2.5A and A2.5B for new businesses since we only know about establishments that came into existence—not those that might have formed but did not. An alternative approach is shown in Table A2.6 where we display the share of new and existing establishments by distance from Wal-Mart. The two distributions are very similar. In both cases ten percent of businesses are within one mile, half of establishments are with-in about 2.3 miles and 90 percent of establishments are within 3.7 miles of Wal-Mart. This raw data provides little evidence that Wal-Mart’s existence has, thus far, discourage new business formation.
14 It is statistically significant at a 10.5 percent confidence level.
21
Tables A2.7A, A2.7B, A2.8A and A2.8B report results analogous to those in Table 6 using the D&B data. For reasons noted above, we use a sample restricted to establishments that reported different sales in the 2005 and 2007 to estimate the determinants of changes in employment and sales. In these regressions, we find few significant variables and little evidence that Wal-Mart’s presence had any effect on employment growth or decline among establishments that continued in business. We find some counter-intuitive evidence that establishments in SIC codes that compete with Wal-Mart had more growth in sales than those that did not compete with Wal-Mart. However, our sample is very limited so we attach little importance to this result.

22
Bibliography
Anderson, Curlie. Personal Interview. January 2008.
Baiman, Ron. 2006. “The Estimated Economic Impact of a Chicago Big Box Living Wage Ordinance.” Review of Radical Political Economics, 38 (3): 355-364. Barbaro, Michael and Steven Greenhouse. 2007. “Wal-Mart Chief Writes Off New York.” New
York Times. 3/28/2007. http://www.nytimes.com/2007/03/28/business/28retail.html Basker, Emek. 2005a. “Selling a Cheaper Mousetrap: Wal-Mart's Effect on Retail Prices.” Journal of Urban Economics. 58(2): 203-229 Basker, Emek. 2005b. “Job Creation or Destruction? Labor-Market Effects of Wal-Mart Expansion.” Review of Economics and Statistics. 87(1): 174-183 Basker, Emek. 2007. “The Causes and Consequences of Wal-Mart’s Growth.” Journal of
Economic Perspectives, 21(3): 177-198. Bustillo, Miguel, “Wal-Mart Figures Time is Right for a Chicago Push.” Wall Street Journal, February 11, 2009 http://online.wsj.com/article/SB123429120871869301.html Card, David and Alan B. Krueger. 1995. Myth and Measurement: The New Economics of the Minimum Wage. Princeton, NJ: Princeton University Press Daniels, Sid. Personal Interview. January 2008.
Delrahim, Norman. Personal Interview. January 2008.
Dube, Arindrajit and Steve Wertheim. 2005. “Wal-Mart and Job Quality – What Do We Know, and Should We Care?”. http://laborcenter.berkeley.edu/retail/walmart_jobquality.pdf. Duque, Omar. Personal Interview. January 28, 2008.
Greenhouse, Steven. 2005. “Choosing Sides Over $9.68 an Hour; Parrying Its Critics, Wal-Mart Says Its Wages Must Stay Competitive.” New York Times 5/04/2005. http://query.nytimes.com/gst/fullpage.html?res=9905E3D81630F937A35756C0A9639C8B63&sec=health&spon. Jones, Sandra M. 2007. “Big City Strategy Stumbles.” Chicago Tribune, October 7, 2007. http://www.topix.net/content/trb/2007/10/big-city-strategy-stumbles. Jones, Sandra M. 2007. “2nd Wal-Mart in city unlikely Chicago declines request to build on
South Side.” Chicago Tribune, March 18, 2008 http://www.chicagotribune.com/business/chi-tue-walmart-letter-chathammar18,0,4095839.story

23
McCain, Dolores. “Wal-Mart Launches ‘Opportunity Zones’ on the West Side”. Austin Weekly News. January 17, 2007. January 28, 2008 <http://austinweeklynews.1upsoftware.com/ main.asp?SectionID=1&SubSectionID=1&ArticleID=1044&TM=9696> Massey, Daniel. “Look Who’s Eyeing NYC: Wal-Mart.” Crain’s New York Business, August 9, 2009. http://www.crainsnewyork.com/article/20090809/SMALLBIZ/308099963
Mehta, Chirag, Ron Baiman, Joe Persky. 2004. “The Economic Impact of Wal-Mart: An Assessment of the Wal-Mart Store Proposed for Chicago's West Side.” UIC Center for Urban Economic Development. http://www.uic.edu/cuppa/uicued/npublications/recent/nwal-martreport.pdf Neumark, David, Zhang, Junfu and Ciccarella, Stephen M. 2007. "The Effects of Wal-Mart on Local Labor Markets." IZA Discussion Paper No. 2545 Available at SSRN: http://ssrn.com/abstract=958704 ReclaimingDemocracy.org. “Wal-Mart CEO Lee Scott Announces ‘Wal-Mart Jobs and Opportunity Zones’ Initiative”. January 28, 2008 <http://reclaimdemocracy.org/ walmart/2006/opportunity_zones.php> Sobel, Russel S., and Andrea M. Dean. 2007. “Has Wal-Mart Buried Mom and Pop?: The Impact of Wal-Mart on Self-Employment and Small Establishment in the United States.” Economic Inquiry. http://www.blackwell-synergy.com/doi/abs/10.1111/j.1465-7295.2007.00091.x Stone, Kenneth E. 1988. “The Effect of Wal-Mart Stores on Businesses in Host Towns and Surrounding Towns in Iowa.” Department of Economics, Iowa State University, Ames, IA. http://www.econ.iastate.edu/faculty/stone/Effect%20of%20Walmart%20-%201988%20paper%20scanned.pdf. Stone, Kenneth E. 1995. "Impact of Wal-Mart Stores and other Mass Merchandisers in Iowa,1983-1993." Economic Development Review. http://www.econ.iastate.edu/faculty/stone/1995_IA_WM_Study.pdf. Stone, Kenneth E. 1995. Competing With the Retail Giants. New York: John Wiley and Sons. Stone, Kenneth E. 1997. “Impact of the Wal-Mart Phenomenon on Rural Communities,” Increasing Understanding of Public Problems and Policies, Farm Foundation, Oak Brook, IL. http://www.econ.iastate.edu/faculty/stone/10yrstudy.pdf. Stone, Kenneth E., Georgeanne Artz and Albert Myles. 2002. “The Economic Impact of Wal-Mart Supercenters on Existing Businesses in Mississippi.” Mississippi State University Extension Service. http://www.econ.iastate.edu/faculty/stone/MSsupercenterstudy.pdf Wal-Mart Store Locator. 2008. http://www.walmart.com/storeLocator/ca_storefinder.do?serviceName=ALL

24
Wal-Mart Stores. April 4, 2006 Press Release. Last accessed October 2007. http://www.walmartstores.com/GlobalWMStoresWeb/navigate.do?catg=589 Wikinvest Wal-Mart. http://www.wikinvest.com/stock/Wal-Mart_Stores_(WMT)accessed March 18, 2008.

25
Figures and Tables
Figures

26
27
Figure 1: Survey results 2006-2009
March 2006 503 businesses identified through yellow pages search
By August 2006 191 completed first survey 177 confirmed in survey area
By August 2006 129 refused to complete first survey but known to be in business in survey area
By August 2006 183 unable to contact, inappropriate business line or other issue, no survey completed
By November 2007 98 confirmed in survey area completed 2nd survey 22 out of business 57 refused to complete or ambiguous status
By November 2008 80 confirmed in survey area completed 3rd survey 22 out-of-business by 11/2007 24 (additional) out-of-business b y 11/2008 58 refused to complete 3rd survey or ambiguous
By Spring 2008 95 known to be in business 34 known to be out-of business
By Spring 2009 86 in business 34 out-of-business by Spring 2008 9 (additional) out-of-business by Spring 2009

28
Figure 2
Plot of survey firms by distance and direction to Wal-Mart and out-of-business status
-4-2
02
4d
iffe
rne
ce b
/w w
alm
art
y a
nd
sto
re y
in
mile
s
-4 -2 0 2 4difference b/w walmart x and store x in miles (east>0)
in business out of business

29
Figure 3: Study Area in its larger regional context
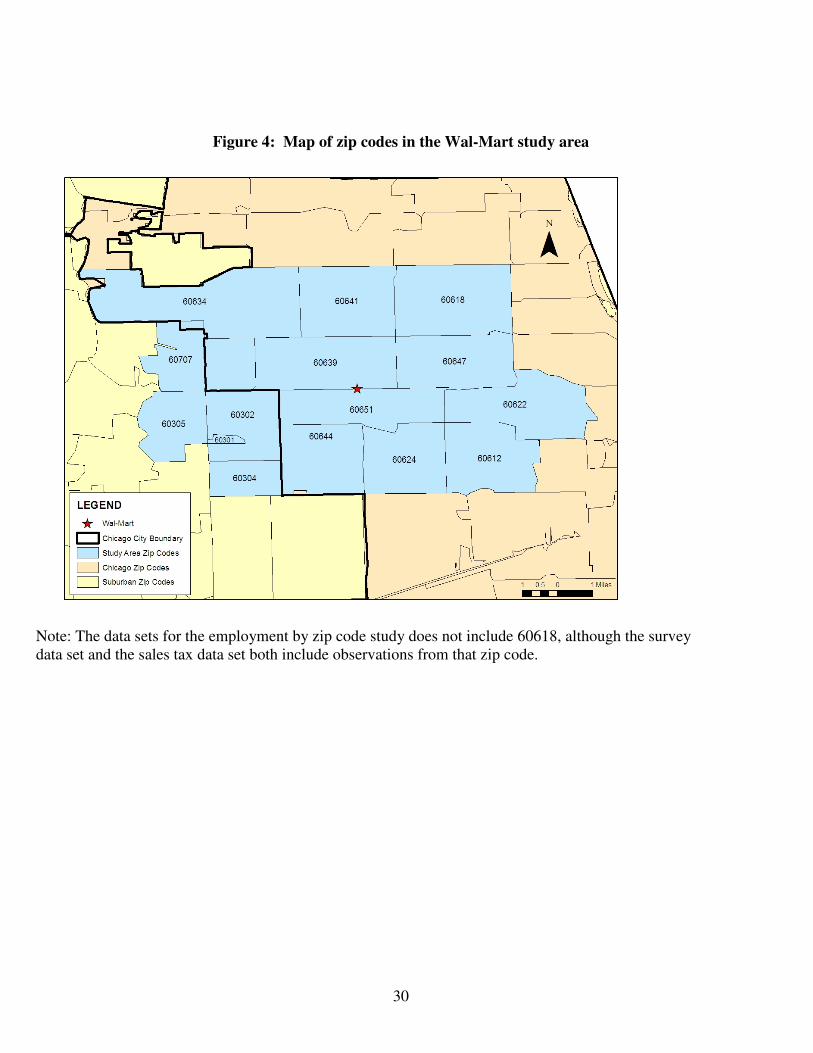
30
Figure 4: Map of zip codes in the Wal-Mart study area
Note: The data sets for the employment by zip code study does not include 60618, although the survey data set and the sales tax data set both include observations from that zip code.

31
Tables

32
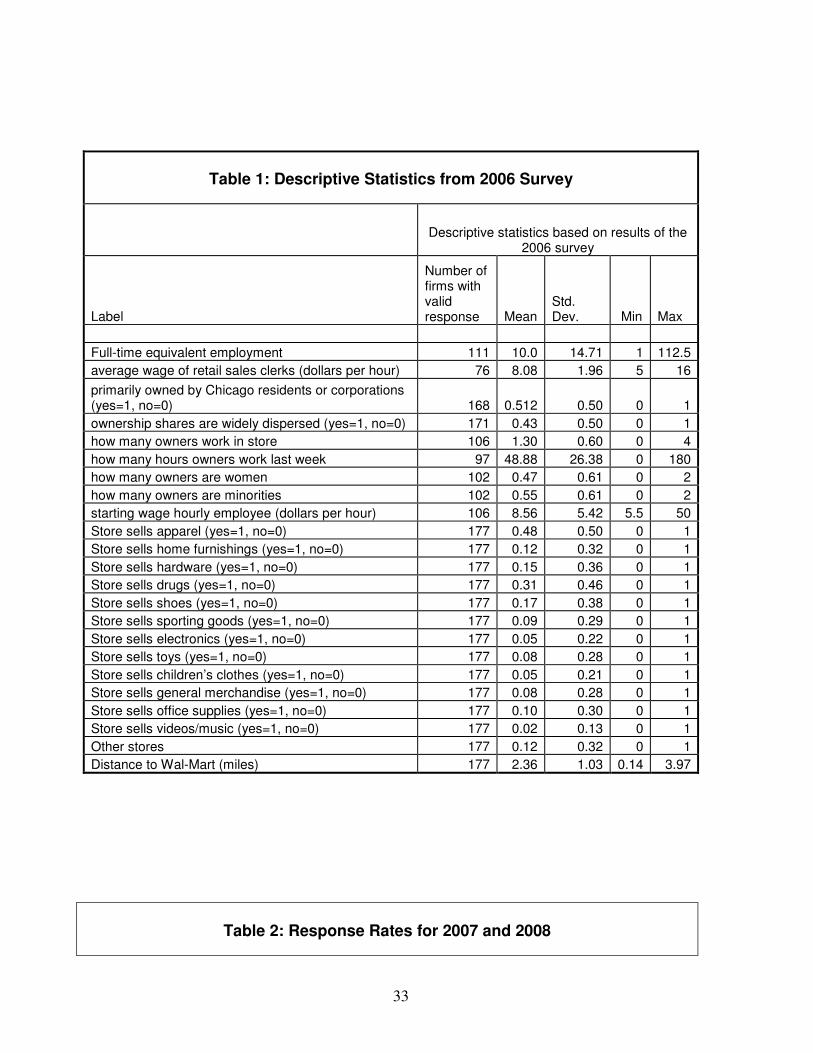
33
Table 1: Descriptive Statistics from 2006 Survey
Descriptive statistics based on results of the
2006 survey
Label
Number of firms with valid response Mean
Std. Dev. Min Max
Full-time equivalent employment 111 10.0 14.71 1 112.5
average wage of retail sales clerks (dollars per hour) 76 8.08 1.96 5 16
primarily owned by Chicago residents or corporations (yes=1, no=0) 168 0.512 0.50 0 1
ownership shares are widely dispersed (yes=1, no=0) 171 0.43 0.50 0 1
how many owners work in store 106 1.30 0.60 0 4
how many hours owners work last week 97 48.88 26.38 0 180
how many owners are women 102 0.47 0.61 0 2
how many owners are minorities 102 0.55 0.61 0 2
starting wage hourly employee (dollars per hour) 106 8.56 5.42 5.5 50
Store sells apparel (yes=1, no=0) 177 0.48 0.50 0 1
Store sells home furnishings (yes=1, no=0) 177 0.12 0.32 0 1
Store sells hardware (yes=1, no=0) 177 0.15 0.36 0 1
Store sells drugs (yes=1, no=0) 177 0.31 0.46 0 1
Store sells shoes (yes=1, no=0) 177 0.17 0.38 0 1
Store sells sporting goods (yes=1, no=0) 177 0.09 0.29 0 1
Store sells electronics (yes=1, no=0) 177 0.05 0.22 0 1
Store sells toys (yes=1, no=0) 177 0.08 0.28 0 1
Store sells children’s clothes (yes=1, no=0) 177 0.05 0.21 0 1
Store sells general merchandise (yes=1, no=0) 177 0.08 0.28 0 1
Store sells office supplies (yes=1, no=0) 177 0.10 0.30 0 1
Store sells videos/music (yes=1, no=0) 177 0.02 0.13 0 1
Other stores 177 0.12 0.32 0 1
Distance to Wal-Mart (miles) 177 2.36 1.03 0.14 3.97
Table 2: Response Rates for 2007 and 2008

34
Frequency Table on Response to 2007 Re-Survey attempt
Frequency Table on Response to 2008 Re-Survey attempt
outcome of survey attempt Number of firms Percent Cum.
Number of firms Percent Cum.
survey completed 98 55.37 55.37 80 49.38 49.38 refused 57 32.20 87.57 58 35.8 85.19 phone number disconnected 9 5.08 92.66 16 9.88 95.06 no response 7 3.95 96.61 7 4.32 98.38 new/changed business 6 3.39 100 1 0.62 100
Total 177 100 162 100
Table 3: Descriptive Statistics from the 2007 and 2008 Surveys
Descriptive statistics based on results of the 2007 survey and change from 2006 to 2007
Obs Mean Std. Dev. Min Max
Full-time equivalent employment 2007 55
10.8 14.40 1 57.5
Average wage of retail sales clerks (dollars per hour) 28 8.47 2.21 6 15
Percentage change in employment 2006 to 2007 55 0.14 0.75 -0.57 4.00
Percentage change in wage 2006 to 2007 28 0.04 0.22 -0.33 0.62
Descriptive statistics based on results of the 2008 survey and change from 2007 to 2008
Full-time equivalent employment 2008 53
12.37 23.63 1 122.5
Average wage of retail sales clerks (dollars per hour) 24 9.02 1.27 7.5 11
Percentage change in employment 2007 to 2008 53 -0.05 0.41 -0.67 1.65
Percentage change in wage 2007 to 2008 24 0.06 0.17 -0.29 0.375

35
Table 4: 2008 Status of Business by Quadrant
Status of business by quadrant
In-business 2008
Out-of-business 2008 Total
% Out-of-business 2008
Wal-Mart Area Quadrant
northwest 40 14 54 25.93%
northeast 74 31 105 29.52%
southeast 44 18 62 29.03%
southwest 66 19 85 22.35%
Total 224 82 306 26.80%

36
Table 5: Distance from Wal-Mart and Probability of Going Out of Business
Probability firm went out of business as a function of
distance to Wal-Mart and other variables
1 2 3 4 5
2006-2007
2006-2007
2006-2008
2006-2008
2006-2008
Estimation Method OLS Probit OLS Probit OLS
Distance to Wal-Mart (miles) -0.0412* -0.175* -0.059** -0.179** -.070*
-1.89 -1.9 -2.21 -2.2 -1.67
Constant 0.250*** -0.626*** 0.400*** -0.224 0.416***
-4.68 -2.91 -6.17 -1.16 -5.07
Number of observations 306 306 306 306 222 < 3
miles
R-squared 0.008 0.013 0.01
Psuedo R-squared 0.014 0.014
Absolute t statistics in parentheses
* p<.1, ** p<.05, *** p<.01

37
Table 6: Probability Firm Went Out of Business between 2006 and 2008
Surveys as a Function of Distance to Wal-Mart, by Line of Business
Distance to Wal-Mart (miles)
Constant Number of Observations
R-squared
Apparel
-0.032 (0.81)
0.344*** (3.61)
139 .005
Home furnishings
-0.153* (1.98)
0.563*** (3.47)
28 0.13
Hardware
-0.179*** (2.87)
0.512*** (4.12)
41 0.17
Drugs
-0.192*** (4.70)
0.609*** (6.22)
87 0.21
Shoes
0.033 ((0.65)
0.111 (0.89)
49 0.01
Sporting
-0.068 (0.96)
0.373** (2.31)
34 0.03
Electronics
-0.218** (2.60)
0.620*** (3.44)
13 0.38
Toys
-0.251** (2.59)
0.755*** (3.80)
20 0.27
Child
-0.145 (1.30)
0.554** (2.33)
22 0.08
General
-0.167** (2.43)
0.546*** (3.38)
39 0.14
Office
-0.208* (1.82)
0.586*** (2.89)
19 0.16
Vidmusic
-0.266 (0.25)
0.649 (0.41)
4 0.03
Other
-0.067 (1.15)
0.446*** (3.15)
78 0.02
Absolute t statistics in parentheses
* p<.1, ** p<.05, *** p<.01
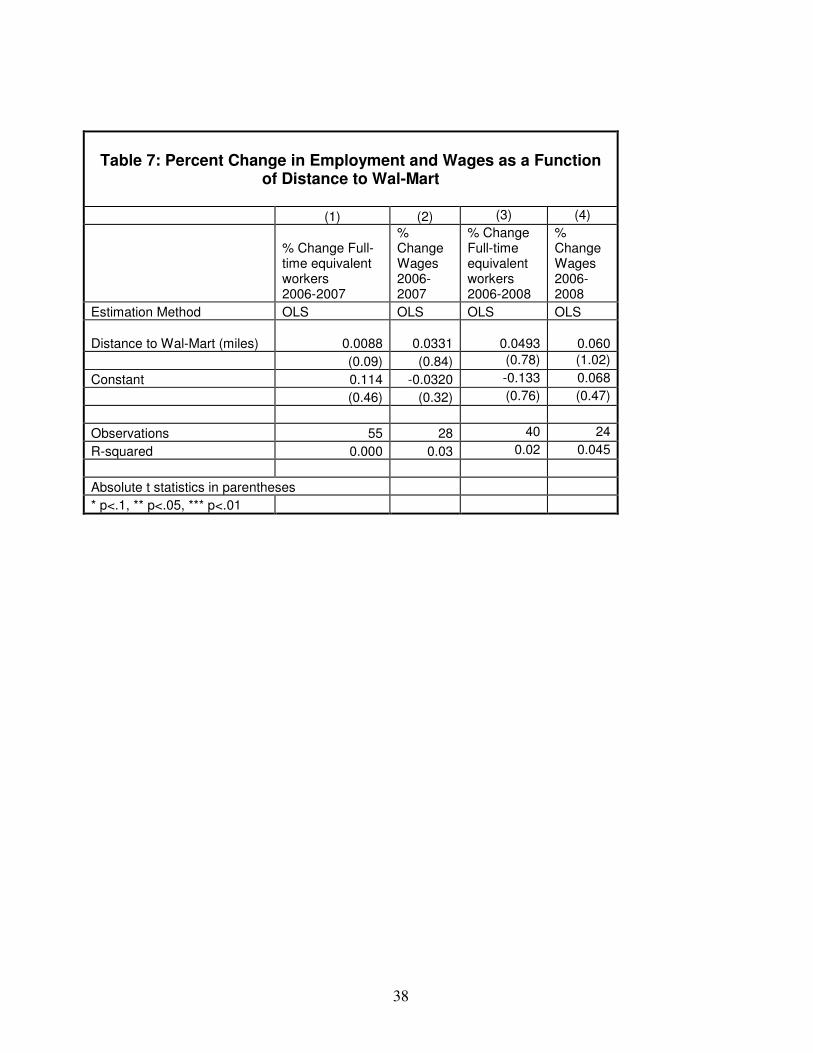
38
Table 7: Percent Change in Employment and Wages as a Function
of Distance to Wal-Mart
(1) (2) (3) (4)
% Change Full-time equivalent workers 2006-2007
% Change Wages 2006-2007
% Change Full-time equivalent workers 2006-2008
% Change Wages 2006-2008
Estimation Method OLS OLS OLS OLS
Distance to Wal-Mart (miles) 0.0088 0.0331
0.0493
0.060
(0.09) (0.84) (0.78) (1.02)
Constant 0.114 -0.0320 -0.133 0.068
(0.46) (0.32) (0.76) (0.47)
Observations 55 28 40 24
R-squared 0.000 0.03 0.02 0.045
Absolute t statistics in parentheses
* p<.1, ** p<.05, *** p<.01
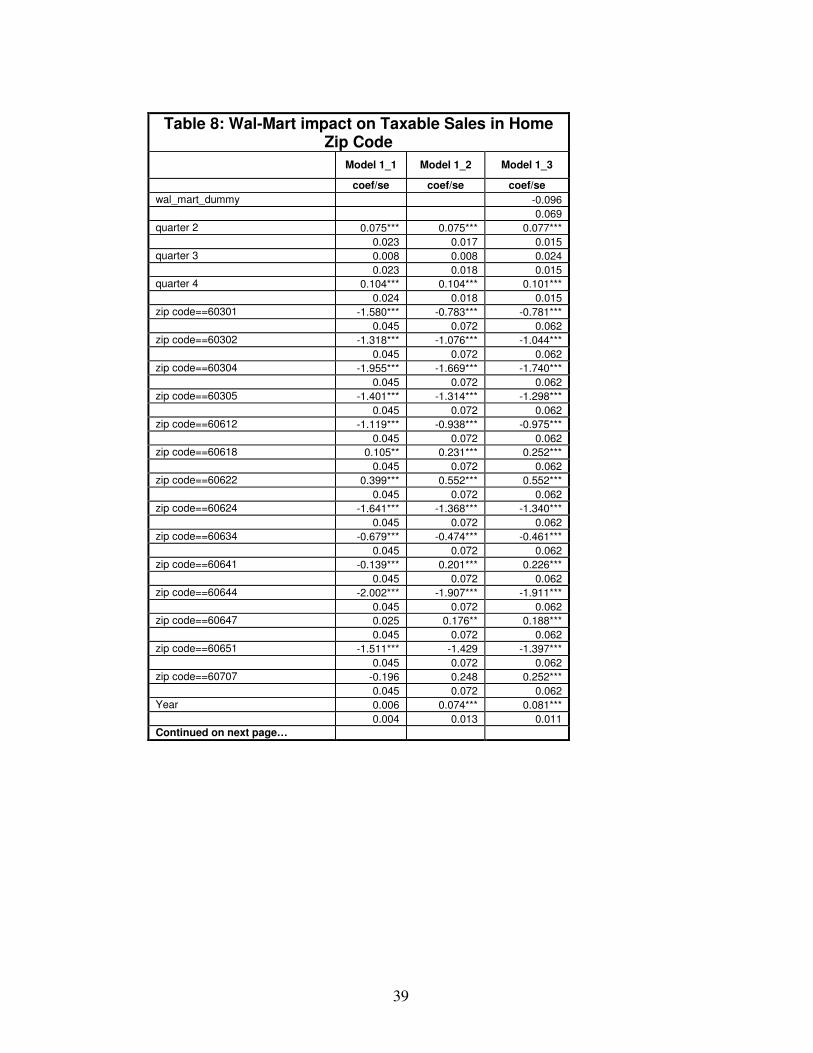
39
Table 8: Wal-Mart impact on Taxable Sales in Home Zip Code
Model 1_1 Model 1_2 Model 1_3
coef/se coef/se coef/se
wal_mart_dummy -0.096
0.069
quarter 2 0.075*** 0.075*** 0.077***
0.023 0.017 0.015
quarter 3 0.008 0.008 0.024
0.023 0.018 0.015
quarter 4 0.104*** 0.104*** 0.101***
0.024 0.018 0.015
zip code==60301 -1.580*** -0.783*** -0.781***
0.045 0.072 0.062
zip code==60302 -1.318*** -1.076*** -1.044***
0.045 0.072 0.062
zip code==60304 -1.955*** -1.669*** -1.740***
0.045 0.072 0.062
zip code==60305 -1.401*** -1.314*** -1.298***
0.045 0.072 0.062
zip code==60612 -1.119*** -0.938*** -0.975***
0.045 0.072 0.062
zip code==60618 0.105** 0.231*** 0.252***
0.045 0.072 0.062
zip code==60622 0.399*** 0.552*** 0.552***
0.045 0.072 0.062
zip code==60624 -1.641*** -1.368*** -1.340***
0.045 0.072 0.062
zip code==60634 -0.679*** -0.474*** -0.461***
0.045 0.072 0.062
zip code==60641 -0.139*** 0.201*** 0.226***
0.045 0.072 0.062
zip code==60644 -2.002*** -1.907*** -1.911***
0.045 0.072 0.062
zip code==60647 0.025 0.176** 0.188***
0.045 0.072 0.062
zip code==60651 -1.511*** -1.429 -1.397***
0.045 0.072 0.062
zip code==60707 -0.196 0.248 0.252***
0.045 0.072 0.062
Year 0.006 0.074*** 0.081***
0.004 0.013 0.011
Continued on next page…
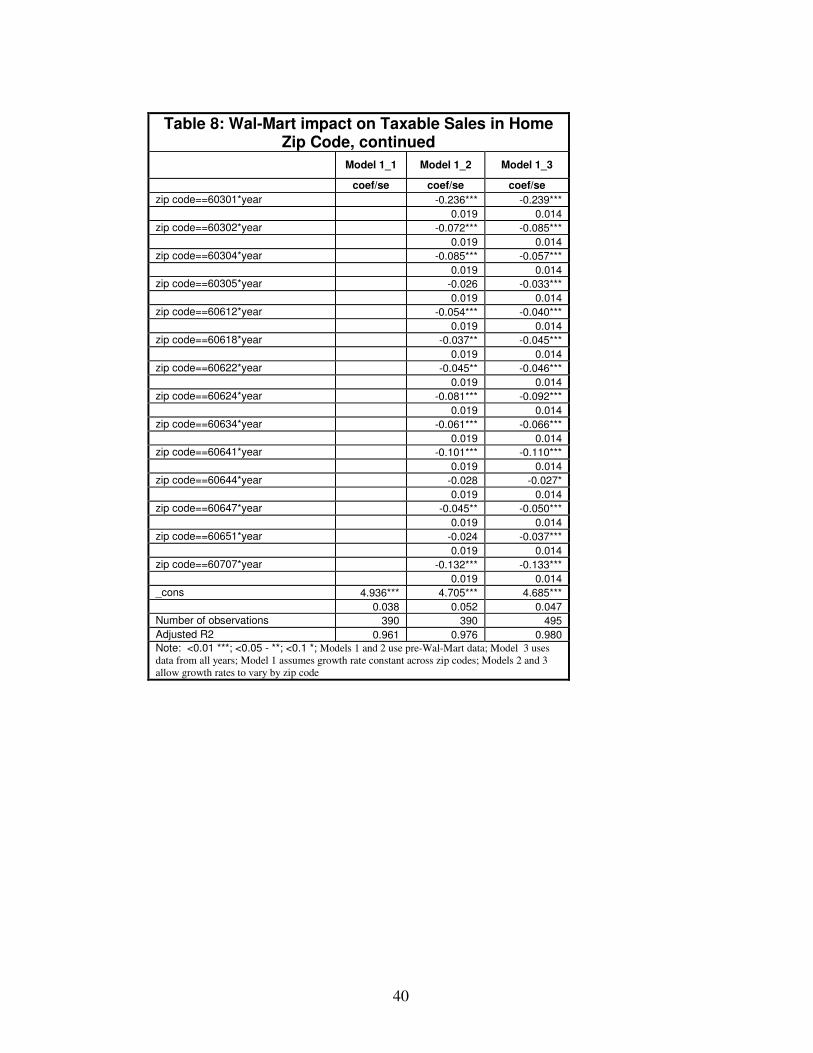
40
Table 8: Wal-Mart impact on Taxable Sales in Home Zip Code, continued
Model 1_1 Model 1_2 Model 1_3
coef/se coef/se coef/se
zip code==60301*year -0.236*** -0.239***
0.019 0.014
zip code==60302*year -0.072*** -0.085***
0.019 0.014
zip code==60304*year -0.085*** -0.057***
0.019 0.014
zip code==60305*year -0.026 -0.033***
0.019 0.014
zip code==60612*year -0.054*** -0.040***
0.019 0.014
zip code==60618*year -0.037** -0.045***
0.019 0.014
zip code==60622*year -0.045** -0.046***
0.019 0.014
zip code==60624*year -0.081*** -0.092***
0.019 0.014
zip code==60634*year -0.061*** -0.066***
0.019 0.014
zip code==60641*year -0.101*** -0.110***
0.019 0.014
zip code==60644*year -0.028 -0.027*
0.019 0.014
zip code==60647*year -0.045** -0.050***
0.019 0.014
zip code==60651*year -0.024 -0.037***
0.019 0.014
zip code==60707*year -0.132*** -0.133***
0.019 0.014
_cons 4.936*** 4.705*** 4.685***
0.038 0.052 0.047
Number of observations 390 390 495
Adjusted R2 0.961 0.976 0.980 Note: <0.01 ***; <0.05 - **; <0.1 *; Models 1 and 2 use pre-Wal-Mart data; Model 3 uses data from all years; Model 1 assumes growth rate constant across zip codes; Models 2 and 3 allow growth rates to vary by zip code

41
Table 9: Wal-Mart impact on Taxable Sales all Zip Codes
Model
2_post1999 Model
2_post2002 Model
2_post2003 Model
2_post2004
coef/se coef/se coef/se coef/se
walmart dummy -0.096 -0.229*** -0.191*** -0.184***
0.068 0.078 0.059 0.059
zip code==60301*year>6.75 0.086 0.344*** 0.395*** -0.061
0.068 0.078 0.059 0.059
zip code==60302*year>6.75 -0.054 -0.065 0.016 0.035 0.068 0.078 0.059 0.059
zip code==60304*year>6.75 0.197*** 0.057 -0.133** -0.191***
0.068 0.078 0.059 0.059
zip code==60305*year>6.75 0.011 0.042 0.049 0.083
0.068 0.078 0.059 0.059
zip code==60612*year>6.75 0.149** 0.052 0.008 0.011
0.068 0.078 0.059 0.059
zip code==60618*year>6.75 -0.055 -0.207*** -0.090 -0.095
0.068 0.078 0.059 0.059
zip code==60622*year>6.75 -0.006 -0.099 -0.134** -0.141**
0.068 0.078 0.059 0.059
zip code==60624*year>6.75 -0.051 -0.116 -0.073 -0.044 0.068 0.078 0.059 0.059
zip code==60634*year>6.75 -0.024 -0.109 -0.057 -0.093
0.068 0.078 0.059 0.059
zip code==60641*year>6.75 -0.072 -0.113 -0.097 -0.097
0.068 0.078 0.059 0.059
zip code==60644*year>6.75 0.053 -0.057 0.023 0.046
0.068 0.078 0.059 0.059
zip code==60647*year>6.75 -0.001 -0.020 0.003 -0.031
0.068 0.078 0.059 0.059
zip code==60651*year>6.75 -0.089 -0.190** -0.173*** -0.166***
0.068 0.078 0.059 0.059 zip code==60707*year>6.75 -0.046 -0.227*** -0.230*** -0.282***
0.068 0.078 0.059 0.059
quarter 2 0.078*** 0.077*** 0.076*** 0.080***
0.015 0.017 0.012 0.010
quarter 3 0.025* 0.007 0.045*** 0.054***
0.015 0.017 0.012 0.010
quarter 4 0.102*** 0.079*** 0.074*** 0.086***
0.015 0.017 0.012 0.010 Continued on next page…

42
Table 9, continued : Wal-Mart impact on Taxable Sales all Zip Codes
Model
2_post1999 Model
2_post2002 Model
2_post2003 Model
2_post2004
coef/se coef/se coef/se coef/se
zip code==60301 -0.758*** 0.124 0.163 -1.806***
0.065 0.173 0.190 0.285
zip code==60302 -1.058*** -0.768*** -0.611*** -0.560*
0.065 0.173 0.190 0.285
zip code==60304 -1.687*** -1.707*** -2.516*** -2.780*** 0.065 0.173 0.190 0.285
zip code==60305 -1.295*** -0.891*** -1.004*** -0.886***
0.065 0.173 0.190 0.285
zip code==60612 -0.935*** -0.855*** -1.131*** -1.128***
0.065 0.173 0.190 0.285
zip code==60618 0.237*** 0.203 0.463** 0.401
0.065 0.173 0.190 0.285
zip code==60622 0.551*** 0.643*** 0.401** 0.329
0.065 0.173 0.190 0.285
zip code==60624 -1.354*** -1.295*** -1.261*** -1.149***
0.065 0.173 0.190 0.285
zip code==60634 -0.467*** -0.372** -0.322* -0.517* 0.065 0.173 0.190 0.285
zip code==60641 0.207*** 0.407** 0.333* 0.309
0.065 0.173 0.190 0.285
zip code==60644 -1.897*** -1.850*** -1.697*** -1.607***
0.065 0.173 0.190 0.285
zip code==60647 0.188*** 0.427** 0.383** 0.197
0.065 0.173 0.190 0.285
zip code==60651 -1.421*** -1.350*** -1.411*** -1.406***
0.065 0.173 0.190 0.285
zip code==60707 0.240*** 0.098 -0.034 -0.292
0.065 0.173 0.190 0.285 Year 0.081*** 0.139*** 0.119*** 0.114***
0.011 0.023 0.024 0.033 Continued on next page…

43
Table 9, continued : Wal-Mart impact on Taxable Sales all Zip Codes
Model
2_post1999 Model
2_post2002 Model
2_post2003 Model
2_post2004
coef/se coef/se coef/se coef/se
zip code==60301*year -0.247*** -0.414*** -0.421*** -0.105**
0.016 0.033 0.034 0.047
zip code==60302*year -0.079*** -0.133*** -0.159*** -0.167***
0.016 0.033 0.034 0.047
zip code==60304*year -0.077*** -0.074** 0.061* 0.104** 0.016 0.033 0.034 0.047
zip code==60305*year -0.034** -0.108*** -0.089*** -0.108**
0.016 0.033 0.034 0.047
zip code==60612*year -0.055*** -0.070** -0.024 -0.024
0.016 0.033 0.034 0.047
zip code==60618*year -0.040** -0.033 -0.077** -0.067
0.016 0.033 0.034 0.047
zip code==60622*year -0.0458 -0.062* -0.021 -0.010
0.016 0.033 0.034 0.047
zip code==60624*year -0.087*** -0.104*** -0.109*** -0.126***
0.016 0.033 0.034 0.047
zip code==60634*year -0.064*** -0.082*** -0.091*** -0.060 0.016 0.033 0.034 0.047
zip code==60641*year -0.103** -0.141*** -0.129*** -0.125***
0.016 0.033 0.034 0.047
zip code==60644*year -0.033** -0.042 -0.067** -0.081*
0.016 0.033 0.034 0.047
zip code==60647*year -0.050*** -0.096*** -0.088*** -0.059
0.016 0.033 0.034 0.047
zip code==60651*year -0.028* -0.041 -0.031 -0.031
0.016 0.033 0.034 0.047
zip code==60707*year -0.128*** -0.103*** -0.081** -0.040
0.016 0.033 0.034 0.047
_cons 4.685*** 4.384*** 4.494*** 4.518***
0.046 0.123 0.135 0.202
Number of observations 495 315 255 195
Adjusted R2 0.980 0.984 0.994 0.997
note: <0.01 ***; <0.05 - **; <0.1 *;
Note: All models allow growth rate to vary by zip code
Model 1 uses data from all years, Model 2 uses post 2002 data Model 3 use post 2003 data, model 4 use post 2004 data

44
Table 10: Wal-Mart Impact on Retail Employment in
Home Zip Code
Model 1_1 Model 1_2 Model 1_3
coef/se coef/se coef/se
wal_mart_dummy 0.095
(0.110)
zip code==60612 -1.516*** -2.274*** -2.120***
0.119 0.221 0.186
zip code==60622 0.257** 0.379* 0.303
0.119 0.221 0.186
zip code==60624 -1.802*** -1.978*** -1.880***
0.119 0.221 0.186
zip code==60634 -0.636*** -1.236*** -1.049***
0.114 0.204 0.174
zip code==60641 0.029 0.068 0.137
0.114 0.204 0.174
zip code==60644 -1.473*** -1.502*** -1.515***
0.119 0.221 0.186
zip code=60647 -0.007 -0.095 -0.090
0.114 0.204 0.174
zip code=60651 -1.581*** -1.597*** -1.615***
0.119 0.221 0.186
zip code=60707 -1.172*** -1.495*** -1.351***
0.114 0.204 0.174
Zip code=Oak Park -0.676*** -0.614*** -0.580***
0.114 0.204 0.174
Year 0.049***
0.015
Continued on next page…

45
Table 10, Continued: Wal-Mart Impact on Retail
Employment in Home Zip Code
Model 1_1 Model 1_2 Model 1_3
coef/se coef/se coef/se
(zip code==60612)*year 0.206*** 0.165***
0.040 0.024
(zip code==60622)*year -0.025 0.008
0.040 0.024
(zip code==60624)*year 0.053 0.029
0.040 0.024
(zip code==60634)*year 0.175*** 0.117***
0.037 0.022
(zip code==60639)*year 0.003 0.014
0.037 0.033
(zip code==60641)*year -0.008 -0.023
0.037 0.022
(zip code==60644)*year 0.014 0.028
0.040 0.024
(zip code==60647)*year 0.028 0.035
0.037 0.022
(zip code==60651)*year 0.011 0.025
0.040 0.024
(zip code==60707)*year 0.095** 0.054**
0.037 0.022
(zip code==OakPark)*year -0.015 -0.017
0.037 0.022
_cons 7.568*** 7.727*** 7.701***
0.096 0.144 0.132
Number of observations 61 61 83
Adjusted R2 0.93 0.96 0.96
note: <0.01 ***; <0.05 - **; <0.1 *;
Note: Models 1 and 2 use pre-Wal-Mart data
Model 3 uses data from all years
Model 1 assumes growth rate constant across zip codes
Models 2 and 3 allow growth rates to vary by zip code

46
Table 11: Wal-Mart Impact on Retail
Employment in All Zip Codes
Model 2_1 Model 2_3
Coef/se coef/se
wal_mart_dummy 0.095 -0.024
0.109 0.090
non wal_mart_dummy -0.050 -0.082*
0.035 0.046
zip code==60612 -2.157*** -1.670***
0.186 0.232
zip code==60622 0.266 0.466*
0.186 0.232
zip code==60624 -1.917*** -1.589***
0.186 0.232
zip code==60634 -1.081*** -0.293
0.173 0.232
zip code==60641 0.105 0.460*
0.173 0.232
zip code==60644 -1.552*** -1.378***
0.186 0.232
zip code=60647 -0.122 0.124
0.173 0.232
zip code=60651 -1.653*** -1.623***
0.186 0.232
zip code=60707 -1.384*** -0.915***
0.173 0.232
Zip code=Oak Park -0.612*** -0.291
0.173 0.232
Continued on next page…
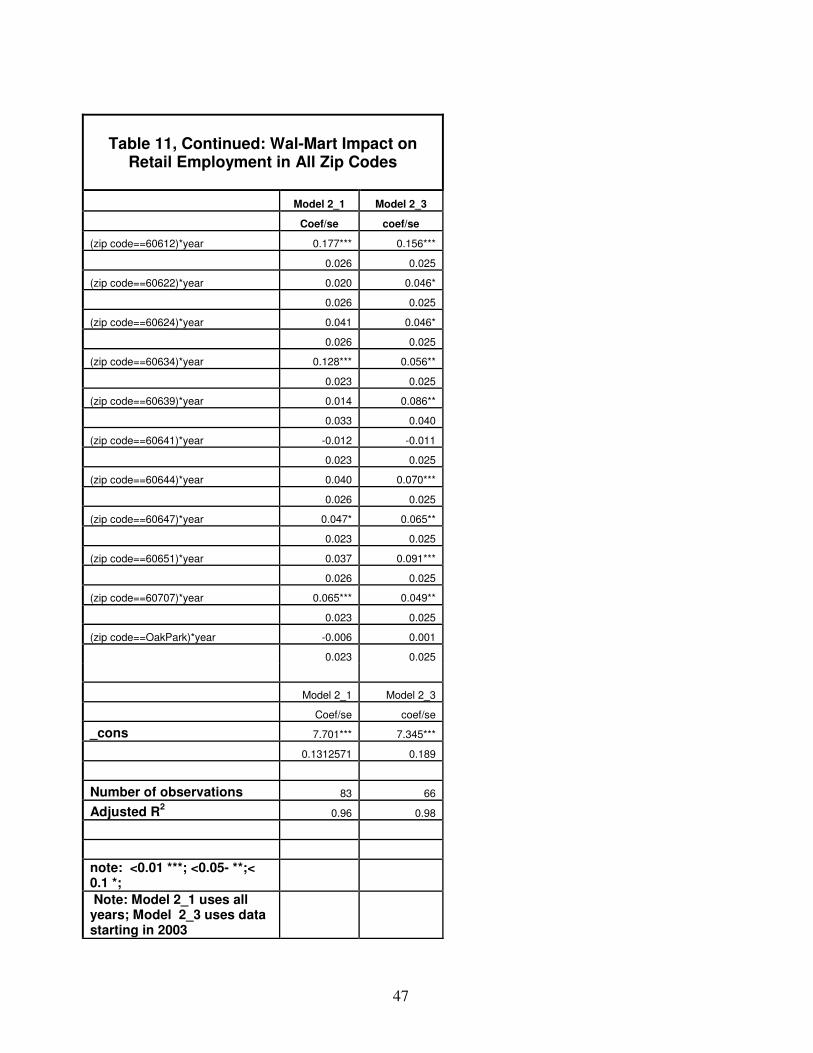
47
Table 11, Continued: Wal-Mart Impact on
Retail Employment in All Zip Codes
Model 2_1 Model 2_3
Coef/se coef/se
(zip code==60612)*year 0.177*** 0.156***
0.026 0.025
(zip code==60622)*year 0.020 0.046*
0.026 0.025
(zip code==60624)*year 0.041 0.046*
0.026 0.025
(zip code==60634)*year 0.128*** 0.056**
0.023 0.025
(zip code==60639)*year 0.014 0.086**
0.033 0.040
(zip code==60641)*year -0.012 -0.011
0.023 0.025
(zip code==60644)*year 0.040 0.070***
0.026 0.025
(zip code==60647)*year 0.047* 0.065**
0.023 0.025
(zip code==60651)*year 0.037 0.091***
0.026 0.025
(zip code==60707)*year 0.065*** 0.049**
0.023 0.025
(zip code==OakPark)*year -0.006 0.001
0.023 0.025
Model 2_1 Model 2_3
Coef/se coef/se
_cons 7.701*** 7.345***
0.1312571 0.189
Number of observations 83 66
Adjusted R2 0.96 0.98
note: <0.01 ***; <0.05- **;< 0.1 *;
Note: Model 2_1 uses all years; Model 2_3 uses data starting in 2003

48

49
Appendix Tables

50

51
able A2.1 Business status by SIC code for Wal-Mart area firms
Business status by SIC code for Wal-Mart area firms
Business status
Building materials, hardware, garden supply, & mobile home (SIC 52)
General merchandise stores (SIC 53)
Food stores (SIC 54)
Automotive dealers and gasoline service stations (SIC 55)
Apparel and accessory stores (SIC 56)
Furniture, home furnishings and equipment stores (SIC 57)
Eating and drinking places (SIC 58)
Miscellaneous retail (SIC 59) Total
In 2005 survey only (out-of-business) frequency 32 37 196 89 154 133 363 304 1,308
row percentage 2.45 2.83 14.98 6.8 11.77 10.17 27.75 23.24 100
column percentage 24.24 27.41 33.11 29.37 33.62 37.46 32.15 31.97 32.1
In 2007 survey only (new business) frequency 21 31 108 39 94 57 194 153 697
row percentage 3.01 4.45 15.49 5.6 13.49 8.18 27.83 21.95 100
column percentage 15.91 22.96 18.24 12.87 20.52 16.06 17.18 16.09 17.1
In both 2005 and 2007 survey frequency 79 67 288 175 210 165 572 494 2,070
row percentage 3.82 3.24 13.91 8.45 10.14 7.97 27.63 23.86 100
column percentage 59.85 49.63 48.65 57.76 45.85 46.48 50.66 51.95 50.8
Total frequency 132 135 592 303 458 355 1,129 951 4,075
row percentage 3.24 3.31 14.53 7.44 11.24 8.71 27.71 23.34 100
column percentage 100 100 100 100 100 100 100 100 100

52
Table A2.2
Basic Descriptive Statistics about Firms in the Wal-Mart area from the Dun & Bradstreet data
Variable Obs Mean Std. Dev. Min Max
Sales volume 2005 (nominal $s) 2634 434,134 1,961,795 6,000 49,100,000
Employment here 2005 2944 7.91 23.15 1 476
Sales volume 2007 (nominal $s) 2389
441,079
924,549 10,000 9,100,000
Employment here 2007 2428 8.27 24.31 1 600
Year Business Started 1853 1990.0 13.14 1895 2005
New business in 2007 data 4075 0.17 0.38 0 1
Out-of-business in 2007 data 4075 0.32 0.47 0 1
Distance from Wal-Mart (miles) 4075 2.43 1.18 0.07 9.65
Percentage change in employment* 211 -7.8% 65.2%
-355.5% 160.9%
Percentage change in sales* 214 -15.8% 89.7%
-377.2% 238.6%
* Restricted to firms with differing sales in 2005 and 2007 surveys. Please see text for discussion.

53
Table A2.3
Business status by compete status for Wal-Mart area firms*
Business status
Non-competitive SIC code
Competitive SIC code Total
In 2005 survey only (out-of-business) frequency 538 770 1308
row percentage 41.13 58.87 100
column percentage 31.82 32.3 32.1
In 2007 survey only (new business) frequency 291 406 697
row percentage 41.75 58.25 100
column percentage 17.21 17.03 17.1
In both 2005 and 2007 survey frequency 862 1208 2070
row percentage 41.64 58.36 100
column percentage 50.98 50.67 50.8
Total frequency 1691 2384 4075
row percentage 41.5 58.5 100
column percentage 100 100 100
* Non-competitive SIC codes were codes that sold products where Wal-Mart did not sell an alternative.

54
Table A2.4
Business status by relative location for Wal-Mart area firms*
Location relative to Wal-Mart
In 2005 survey only (out-of-business)
In 2007 survey only (new business)
In both 2005 and 2007 survey Total
Northwest frequency 414 228 731 1373
row percentage 30.15 16.61 53.24 100
column percentage 31.65 32.17 35.31 33.69
Northeast frequency 373 244 654 1271
row percentage 29.35 19.2 51.46 100
column percentage 28.52 35.01 31.59 31.19
Southeast frequency 199 88 235 522
row percentage 38.12 16.86 45.02 100
column percentage 15.21 12.63 11.35 12.81
Southwest frequency 322 137 450 909
row percentage 35.42 15.07 49.5 100
column percentage 24.62 19.66 21.74 22.31
Total frequency 1308 697 2070 4075
row percentage 32.1 17.1 50.8 100
column percentage 100 100 100 100

55
Table A2.5A
Regressions to predict out-of-business status for Wal-Mart area firms
OLS Probit Probit Probit Probit
1 2 3 4 5 Distance to Wal-Mart (miles)
-0.0139**
-0.0366**
-0.0367** -0.0413** -0.0363
(1.98) (1.97) (1.97) (1.98) (1.29)
In competitive SIC code 0.0147 0.173*** 0.0636
(0.33) (3.39) (0.97)
Number of employees 2005 -
0.0130*** -
0.0135***
(3.34) (2.72)
Sales volume 2005 ($s) -6.90e-
08**
(2.05)
Year business started 0.0105***
(3.88)
Constant 0.421*** -
0.198*** -
0.206*** -0.284*** -21.28***
(21.94) (3.94) (3.68) (4.30) (3.94)
Observations 3378 3378 3378 2944 1802
R-squared 0.001
Pseudo R-squared 0.001 0.001 0.021 0.026
Absolute t statistics in parentheses
* p<.1, ** p<.05, *** p<.01

56
Table A2.5B
Regression to predict out-of-business status for Wal-Mart area firms
(includes SIC dummies, building materials omitted category)
Probit
(1)
Distance to Wal-Mart (miles) -0.0466
(1.62)
In competitive SIC code -0.146
(1.35)
Number of employees 2005 -0.0112**
(2.28)
Sales volume 2005 ($s) -7.50e-
08**
(2.18)
Year business started 0.0100***
(3.74)
General merchandise stores (SIC 53) 0.338
(1.31)
Food stores (SIC 54) 0.246
(1.29)
Automotive dealers and gasoline service stations (SIC 55) 0.151
(0.71) Apparel and accessory stores (SIC 56) 0.467**
(2.34)
Furniture, home furnishings and equipment stores (SIC 57) 0.452**
(2.24)
Eating and drinking places (SIC 58) 0.0601
(0.30)
Miscellaneous retail (SIC 59) 0.337*
(1.84)
Constant -20.43***
(3.82)
Observations 1789
R-squared
Pseudo R-squared 0.032
Absolute t statistics in parentheses
* p<.1, ** p<.05, *** p<.01
Table A2.6

57
Distance (in miles) to Wal-Mart of existing and new businesses in 2007 Dun &
Bradstreet survey
Closest Existing New
1% 0.29 0.24
5% 0.71 0.76
10% 0.99 0.98
25% 1.61 1.57
50% 2.32 2.26
75% 31.2 3.12
90% 3.73 3.67
95% 4.62 4.62
99% 6.19 6.37
Table A2.7A
OLS Regressions to predict change in employment for Wal-Mart area firms
1 2 3 4 5
Distance to Wal-Mart (miles) 0.00758 0.00643 0.0282 0.0289 0.0336
(0.18) (0.15) (0.67) (0.69) (0.71)
In competitive SIC code 0.0932 -0.0397 -0.0343 0.0479
(0.98) (0.48) (0.41) (0.43)
Number of employees 2005 -
0.0232*** -
0.0219*** -
0.0236***
(6.45) (5.31) (4.91)
Sales volume 2005 ($s) -3.16e-08 -2.83e-08
(0.91) (0.82)
Year business started -0.00274
(0.68)
Constant -0.0957 -0.146 0.038 0.0419 5.441
(0.88) (1.26) (0.35) (0.39) (0.67)
Observations 211 211 211 211 141
R-squared 0 0.005 0.185 0.191 0.249
# sample restricted to firms with differing non-zero sales in 2005 and 2007 surveys
Absolute t statistics in parentheses
* p<.1, ** p<.05, *** p<.01

58
Table A2.7B
Regression to predict percentage change in employment for Wal-Mart area firms
(includes SIC dummies, building materials omitted category)
(1)
Distance to Wal-Mart (miles) 0.0406
(0.75)
In competitive SIC code -0.0942
(0.32)
Number of employees 2005 -0.0232***
(4.37)
Sales volume 2005 ($s) -2.31E-08
(0.66)
Year business started -0.00155
(0.38)
General merchandise stores (SIC 53) -0.443
(0.78)
Food stores (SIC 54) -0.0188
(0.06)
Automotive dealers and gasoline service stations (SIC 55) -0.542**
(1.99)
Apparel and accessory stores (SIC 56) -0.26
(1.25)
Furniture, home furnishings and equipment stores (SIC 57) -0.282
(1.33)
Eating and drinking places (SIC 58) -0.453
(1.43)
Miscellaneous retail (SIC 59) -0.328
(1.56)
Constant 3.46
(0.43)
Observations 129
R-squared 0.295
# sample restricted to firms with differing non-zero sales in 2005 and 2007 surveys
Absolute t statistics in parentheses
* p<.1, ** p<.05, *** p<.01
Table A2.8A

59
OLS Regressions to predict change in sales for Wal-Mart area firms#
(1) (2) (3) (4) (5)
Distance to Wal-Mart (miles)
-0.0309
-0.0332 -0.018 -0.0144 0.000987
(0.58) (0.64) (0.34) (0.28) (0.02)
In competitive SIC code 0.300** 0.206* 0.236** 0.336**
(2.4) (1.69) (2.04) (2.1) Number of employees 2005
-0.0170*** -0.00994** -0.00991*
(3.96) (2.19) (1.77)
Sales volume 2005 ($s) -
0.000000174*** -
0.000000173***
(5.2) (5.16)
Year business started 0.000306
(0.06)
Constant -
0.0832 -0.247* -0.109 -0.0876 -0.788
(0.61) (1.67) (0.77) (0.67) (0.08)
Observations 214 214 212 212 142
R-squared 0.002 0.029 0.08 0.177 0.219
# sample restricted to firms with differing non-zero sales in 2005 and 2007 surveys
Absolute t statistics in parentheses
* p<.1, ** p<.05, *** p<.01
Table A2.8B

60
Regression to predict percentage change in sales for Wal-Mart area firms
(includes SIC dummies, building materials omitted category)#
(1)
-0.00498
Distance to Wal-Mart (miles) (0.08)
-0.11
In competitive SIC code (0.27)
-0.00921
Number of employees 2005 (1.24)
-0.000000192***
Sales volume 2005 ($s) (4.31)
0.000357
Year business started (0.07)
-0.538
General merchandise stores (SIC 53) (0.73)
-0.165
Food stores (SIC 54) (0.36)
-0.29
Automotive dealers and gasoline service stations (SIC 55) (0.54)
-0.262
Apparel and accessory stores (SIC 56) (0.6)
-0.308
Furniture, home furnishings and equipment stores (SIC 57) (0.77)
-0.938*
Eating and drinking places (SIC 58) (1.91)
-0.378
Miscellaneous retail (SIC 59) (0.95)
-0.114
Constant (0.01)
Observations 130
R-squared 0.263
# sample restricted to firms with differing non-zero sales in 2005 and 2007 surveys
Absolute t statistics in parentheses
* p<.1, ** p<.05, *** p<.01
File:WalMart final report 2009 12 21.doc