the impact of a stem program on academic achievement of
TRANSCRIPT
The Impact of a STEM Program on Academic Achievement of Eighth Grade Students in
a South Texas Middle School
A Dissertation
By
Norma Olivarez
Submitted in Partial Fulfillment of the Requirements for the Degree of
DOCTOR OF EDUCATION
In
Educational Leadership
Texas A & M University - Corpus Christi
Corpus Christi, Texas
December, 2012


Copyright © 2012 Norma R. Olivarez
All Rights Reserved
December, 2012

iii
ABSTRACT
The Impact of a STEM Program on Academic Achievement of Eighth Grade Students in
a South Texas Middle School
(October 2012)
Norma R. Olivarez
BBA, St. Mary’s University, San Antonio, Texas
MBA, University of Texas at Austin
MPH, Loma Linda University- Loma Linda, California
The primary purpose of the study was to examine the impact of a science,
technology, engineering, and mathematics (STEM) educational program on academic
achievement. The study was delimited to 8th graders and outcome measures of
mathematics, science, and reading. An ex-post facto, causal-comparative research design
was employed. The characteristic-present group consisted of 73 eighth grade students in
a STEM academic program. The comparison group consisted of 103 eighth grade
students in a non-STEM academic program. On the basis of the centroids, the STEM
group outperformed the non-STEM group on all outcome measures. It is concluded that
participation in a STEM academic program, where teachers use Project-Based Learning
(PBL), collaborative learning, and hands-on strategies, positively impacted eighth grade
students’ academic achievement in mathematics, science, and reading.

iv
DEDICATION
My parents were deprived of the opportunity to pursue their education and
ensured that their children would not suffer the same fate. They supported and
encouraged academic achievement through their actions and sacrifices. I dedicate this
effort and the accomplishment it represents to the late Manuel and Vickie Olivarez.

v
ACKNOWLEDGEMENTS
I would like to take this opportunity to express my gratitude and appreciation to
my family who sustained and encouraged me as I embarked on this phase of my
education. The health challenges encountered during this period were alleviated by their
unwavering support in helping me meet my responsibilities. A special thank you to my
sister Alma who spent numerous hours taking me to and from classes when I needed her
help.
Thank you, Dr. Kamiar Kouzekanani, for your patience and guidance as my
dissertation chair. I recognized your heart of gold and generous spirit and know that my
success in completing this project is due in large part to your help.
I would also like to express my thanks to the administrators, teachers, friends, and
staff who contributed their time and assistance in so many ways. My dissertation
committee members, Dr. Denise Hill, Dr. Faye Bruun, and Dr. Virginia Wheeless,
invested time and energy providing feedback and encouragement to enhance my study.
Their valuable input was greatly appreciated. It was through the guidance and help of so
many that I was able to achieve my goal.

vi
TABLE OF CONTENTS
PAGE
ABSTRACT ....................................................................................................................... iii
DEDICATION ................................................................................................................... iv
ACKNOWLEDGEMENTS .................................................................................................v
TABLE OF CONTENTS ................................................................................................... vi
LIST OF TABLES ........................................................................................................... viii
CHAPTER PAGE
I. INTRODUCTION ...................................................................................................1
Background and Setting ...........................................................................................1
Statement of the Problem .........................................................................................4
Theoretical Framework ............................................................................................4
Purpose of the Study and Research Questions .........................................................6
Operational Definitions ............................................................................................7
Glossary of Terms ....................................................................................................8
Delimitations, Limitations, and Assumptions ..........................................................8
Significance of the Study .........................................................................................9
II. REVIEW OF THE LITERATURE .......................................................................10
Introduction ............................................................................................................10
Texas Science, Technology, Engineering, and Mathematics (T-STEM) ..............10
Theoretical Framework ..........................................................................................12
Student Engagement ..............................................................................................14
Changing Demographics ........................................................................................18
Teacher Effectiveness ............................................................................................19
Student Achievement .............................................................................................22
Educational Funding ..............................................................................................25
Summary ................................................................................................................27
III. METHOD ..............................................................................................................29
Introduction ............................................................................................................29

vii
PAGE
Research and Design ..............................................................................................29
Subject Selection ....................................................................................................31
Instrumentation ......................................................................................................31
Data Collection ......................................................................................................33
Data Analysis .........................................................................................................33
IV. RESULTS ..............................................................................................................36
A Profile of Subjects ..............................................................................................37
Outcome Measures.................................................................................................38
Mathematics Achievement.....................................................................................39
Science Achievement .............................................................................................41
Reading Achievement ............................................................................................43
Covariate Analysis .................................................................................................45
Summary ................................................................................................................47
V. SUMMARY, CONCLUSIONS, AND DISCUSSION ..........................................49
Introduction ............................................................................................................49
Summary of Results ...............................................................................................51
Conclusion .............................................................................................................53
Discussion ..............................................................................................................53
Implications............................................................................................................59
Recommendations for Further Research ................................................................61
REFERENCES ..................................................................................................................63
APPENDICES ...................................................................................................................72
APPENDIX A: IRB Approval Letter ...................................................................73
APPENDIX B: Outside Research Evaluation and Approval Form ......................74
APPENDIX C: Campus Consent Form ................................................................75
viii
LIST OF TABLES TABLE PAGE
1 TAKS 8th Grade Mathematics Objectives .............................................................32
2 TAKS 8th Grade Science Objectives ......................................................................32
3 TAKS 8th Grade Reading Objectives .....................................................................33
4 A Profile of Subjects ..............................................................................................38
5 Mathematics Achievement.....................................................................................39
6 Correlation Matrix for Mathematics Objective Scores ..........................................40
7 Mean Difference Effect Size – Mathematics Achievement ...................................41
8 Science Achievement .............................................................................................41
9 Correlation Matrix for Science Objective Scores ..................................................42
10 Mean Difference Effect Size – Science Achievement ...........................................43
11 Reading Achievement ............................................................................................43
12 Correlation Matrix for Reading Objective Scores .................................................44
13 Mean Difference Effect Size – Reading Achievement ..........................................44
14 Bivariate Correlations Between Outcome Measures and Covariates ....................45
15 Observed and Adjusted Mean Scores for all Objectives .......................................46
1
CHAPTER 1
INTRODUCTION
Background and Setting
After the end of WWII in the 1940s, America invested in educational programs
such as the G.I. Bill for military personnel to pursue higher education. Funds were also
provided for research and development projects to encourage American innovation. The
successful launch of Sputnik in 1957 by the Soviet Union increased the focus on science
and engineering education. The United States underwent decades of identifying,
recruiting, and educating individuals who represented the best and the brightest citizens
to create a generation of leaders in scientific and technological innovation (NSB 07-114,
2007).
The focus and investment in science, technology, engineering, and mathematics
(STEM) education, in addition to research and development, resulted in the creation of
new jobs, technologies, and enterprises. Many Americans benefitted directly and
indirectly from the results of these efforts. The gains and innovations, which were made
during the 1950s and 1960s, elevated the United States to the status of a world leader in
scientific innovation. The focus and energy, which were spent on developing STEM
education, were diminished significantly by the 1970s. The gains which were realized
through American innovation during the 19th and 20th century have been deteriorating in
recent years as other countries have succeeded in training and preparing students in fields
which were once exemplified by American achievement (NSB 07-114, 2007).
Other countries have made significant gains in fields involving science and
technology, while the number of American students pursuing higher education in STEM

2
fields declined. The changes, which have taken place in recent years in the areas of
science, technology, engineering, and mathematics education, have created growing
concerns that the United States is losing its competitive edge on a global stage.
Globalization and a knowledge-based economy have made technology and scientific
innovation critical elements of retaining a worldwide leadership position (Campbell,
Hombo, & Mazzeo, 2000).
The urgency of correcting the course and preparing future generations of STEM
leadership and graduates is reminiscent of the Sputnik era. The economic future and
security of America as a nation makes this race even more critical because the basis of a
democratic society includes involvement by all citizens rather than a selected few who
are educated enough to understand what is at risk. In 1983, the A Nation At Risk report
was generated after research was conducted by the National Commission on Excellence
in Education, which was formed in 1981, to evaluate the quality of the American
educational system. The report concluded that the high expectations, investment,
commitment, and disciplined effort, which defined the Sputnik era, had deteriorated
significantly in the American education system as a whole (Gardner & Larsen, 1983).
Competitors such as Japan, Korea, and Germany, however, are preparing their citizens to
operate in a knowledge-based economic system (NSB 12-01, 2012).
Changing economic drivers and demographic changes in the U.S. are
contributing to the challenges which must be met in order to retain a competitive
workforce on a global level. Science and mathematics performance indicators are
particularly low for minority students who represent a growing demographic in the U.S.
As Latinos become an increasingly larger percentage of the American population, their
3
involvement and performance in STEM education will reverberate throughout society
(Kuenzi, 2008).
World leaders in a global economy recognize the impact of educational
accomplishments and innovations generated by current and future generations. Since
1995, Trends in International Mathematics and Science Study (TIMSS) has generated
reports which track performance trends in mathematics and science of students in various
countries. In 2007, eighth grade science scores were lower than those in 9 countries
located in Asia or Europe. The U.S. was still experiencing higher scores for eighth grade
science in 35 of 47 other countries, but only 10% of those students scored at or above the
advanced international benchmark in science (Gonzales, Williams, Jocelyn, Roey,
Kastberg, & Brenwall, 2008). America faces increased challenges to its worldwide
standing as a leader in STEM fields.
In an effort to increase the performance of students in STEM subjects, the Texas
High School Project was created in 2003 and involves collaboration between public and
private entities. The mission of the project is to improve the postsecondary readiness of
low income students in low performing schools. The STEM academies were developed
in selected schools dedicated to developing innovative methods for instruction aimed at
improving science and mathematics achievement. The alignment of middle school and
high school programs with curriculum requirements of competitive higher education
institutions and 21st century jobs is a cornerstone of the STEM focused instruction and
learning models (Avery, Chambliss, Truiett, & Stotts, 2010).

4
Statement of the Problem
There is a middle school in an urban South Texas city, hereafter referred to as the
Middle School, which has been implementing a STEM program as a choice for students.
The ethnicity distribution of the Middle School, at the time of the study, was 92.9%
Hispanic, 4.6% African American, and 2.5% White. Economically disadvantaged
students comprise 88.5% of the student body (TEA, 2009-2010).
Implementation of the STEM program at the Middle School, partnered with a
STEM program at a local high school, began with the 2007-2008 academic year. At the
Middle School, the STEM program is referred to as the Innovation Academy. Funding
for the program began with a grant from the Texas High School Project and has expanded
to include local business partners. At the Middle School, the program began only with
the sixth grade students and was extended to the seventh and eighth grade levels as the
pilot students progressed to the higher grade levels. Students can apply to continue their
participation in the STEM program at the high school level after completion of their
middle school education. The effectiveness of the STEM program had not been
systematically evaluated at the Middle School.
Theoretical Framework
The study was grounded on Jerome Bruner’s Discovery Learning theory. Bruner,
a psychologist and a cognitive learning theorist, extensively studied the interaction of
culture and brain activity as they relate to learning. His theory includes the belief that
active engagement by students including experiments, exploration, and discoveries of the
world around them leads to increased understanding and knowledge. Students who are
interested in the material they are learning will be more motivated and creative in

5
developing problem-solving skills which will enhance their ability to gain knowledge in
the subject area. He suggested that students must find meaning within their cultural
context in their education. The way students create and transform meaning is impacted
by the world around them and teachers should create conditions for learners to use their
individual learning styles to create meaningful connections (Bruner, 1963).
The basic foundation upon which STEM programs are built relies heavily on
principles espoused by the theory of Discovery Learning. The basis of the theory
incorporates the role of intuition as students solve problems and increase their knowledge
base. The STEM programs are designed to incorporate project-based learning which
relies on student creativity and problem solving skills. Bruner referred to this approach
as a spiral curriculum, which included the concept that children are active problem
solvers. By building on a structure, which draws from prior knowledge and facilitates the
formation of new knowledge, students repeatedly review concepts and achieve a deeper
level of understanding (Bruner, 1963).
Changes in technology have made resources available to current students which
provide greater opportunities for student engagement in deliberate inquiries into areas of
interest. Inquiry science instruction, for example, is incorporated into the guidelines for
developing the STEM curriculum. Inquiry learning, as well as discovery learning,
incorporates hands-on learning, facilitates problem solving, and promotes inductive
reasoning to achieve meaningful learning (The Inquiry Synthesis Project, 2006).
Attributes of discovery learning such as exploring and problem solving, spiraling, and
group activities, are also incorporated into the STEM curriculum guidelines (Bicknell-
Holmes & Hoffman, 2000).
6
Bruner’s view that knowledge is a process in which motivation plays a major role
is also reflected in the STEM academy guidelines. When students are motivated to learn,
they are more likely to gain a deeper understanding of underlying concepts. Encouraging
students to pursue work on projects, which are of interest to them, increases their
motivation for learning (Bruner, 1963). Academic achievement has been researched
along with motivation and retention. The findings suggest that discovery learning may
lead to increased academic achievement in areas which do not rely on fact-based teaching
strategies. Discovery learning also requires more preparation and learning time and
benefits from smaller class sizes. Suggestions made for the STEM programs incorporate
limits on class sizes and commitments by teachers to invest the additional time required
to provide for such learning (Bicknell-Holmes & Hoffman, 2002). In order to receive
funding, it is stipulated that the STEM programs must meet benchmark requirements
regarding academic content and student achievement standards (NSB 07-114, 2007).
Purpose of the Study
The purpose of the study was to examine the impact of the STEM program on
academic achievement of eighth grade students. Academic achievement was established
based on performance measures provided through the Texas Assessment of Knowledge
and Skills (TAKS) test scores for mathematics, science, and reading objective test scores.
The National Center for Education Statistics monitors student academic achievement by
collecting and analyzing data in specific cities throughout the United States. The data are
used to generate the National Assessment of Educational Progress (NAEP) report, which
makes state level comparisons of academic achievement on the basis of standardized test
7
scores in mathematics, science, and reading available (Aud, Hussar, Johnson, Kena, Roth,
Manning, Wang, Zhang, & Notter, 2012).
The eighth grade was chosen because it was the only middle school grade which
included TAKS testing in all three abovementioned areas. It had been hypothesized that
the STEM students would outperform the non-STEM students on academic achievement.
The study was guided by the following questions:
1. What is the impact of the STEM program on mathematics achievement
among eighth grade students?
2. What is the impact of the STEM program on science achievement among
eighth grade students?
3. What is the impact of the STEM program on reading achievement among
eighth grade students?
Operational Definitions
Mathematics achievement was measured by the proportion of correct answers to
questions in each of the following TAKS mathematics objectives:
Objective1: Numbers, operations, and quantitative reasoning
Objective 2: Patterns, relationships, and algebraic reasoning
Objective 3: Geometry and spatial reasoning
Objective 4: Concepts and uses of measurement
Objective 5: Probability and statistics
Objective 6: Mathematical processes and tools
Science achievement was measured by the proportion of correct answers to
questions in each of the following TAKS science objectives:

8
Objective 1: Nature of science
Objective 2: Living systems and the environment
Objective 3: Structure and properties of matter
Objective 4: Motion, forces, and energy
Objective 5: Earth and space systems
Reading achievement was measured by the number of correct answers to
questions in each of the following TAKS reading objectives:
Objective 1: Basic understanding
Objective 2: Applying knowledge of literary elements
Objective 3: Using strategies to analyze
Objective 4: Applying critical-thinking skills
Glossary of Terms
Texas Assessment of Knowledge and Skills (TAKS) are statewide standardized
tests used in Texas primary and secondary schools to assess students’ attainment of skills
required under Texas education standards for mathematics, science, reading, writing, and
social studies.
Texas Essential Knowledge and Skills (TEKS) are statewide standards for
knowledge of the required curriculum which students should have and skills which they
should be able to perform.
Delimitations, Limitations, and Assumptions
The study was delimited to 8th graders in one middle school in South Texas and to
the outcome measures of mathematics, science, and reading. Due to the non-probability
nature of sampling, external validity was limited to study participants. Due to non-

9
experimental nature of the study, no causal inferences were drawn. The study assumed 1)
the quantitative data received from the Texas Education Agency (TEA) were accurate
and 2) teachers taught their courses in accordance with the district and TEA curriculum
guidelines.
Significance of the Study
The study provided comparative data on student achievement on TAKS tests for
students in a STEM versus a non-STEM academic program. Results from the study
could provide support and documentation for the continuation of funding for the STEM
programs at the middle school level. The current financial challenges faced by school
districts increase the significance of grant funded programs. Improved student
performance at the middle school level is likely to increase student performance at the
high school level and beyond. An educated population is essential to maintaining a
democratic society, and academic achievement influences the pursuit of educational goals
for many students.
10
CHAPTER 2
REVIEW OF THE LITERATURE
Introduction
The growing concerns that the United States is losing its competitive edge on a
global stage has created initiatives at the local, state, and national levels aimed at
preparing citizens to have the necessary skills required in the 21st century. Chapter 2
provides a systematic review of the literature and research related to student academic
achievement and STEM education. The chapter is organized by eight major areas,
namely, 1) history of the Texas STEM (T-STEM) program, 2) the theoretical framework,
3) student engagement, 4) changing demographics, 5) teacher effectiveness, 6) student
achievement 7) educational funding, and 8) summary. In retrieving the literature for the
study, the researcher utilized the following databases and search engines: the Mary and
Jeff Bell Library databases at Texas A&M University – Corpus Christi, EBSCO, ERIC,
SAGE, Web of Science, Google, and Google Scholar.
Texas Science, Technology, Engineering, and Mathematics (T-STEM)
In an effort to prepare the Texas workforce to have the necessary skills required
by employers, the Texas High School Project was developed in 2003 by an alliance
among public-private sectors including the Texas Education Agency (TEA), Office of the
Governor, Bill and Melinda Gates Foundation (BMGF), Texas Legislature, Michael and
Susan Dell Foundation (MSDF), Texas Higher Education Coordinating Board (THECB),
Communities Foundation of Texas (CFT), Wallace Foundation, Meadows Foundation,
and the Greater Texas Foundation. The alliance provided $375 million in grant funding
dedicated to STEM education reform in Texas. The goal of the program was to produce
11
a leading technical workforce in Texas by aligning educational and economic
development sectors. Implementation of the program began with the 2006-2007 school
year (SRI, 2011). The initial aim of the T-STEM was to improve science and
mathematics academic achievement and stimulate student interest in STEM careers. The
program was intended to provide students with a rigorous academic curriculum as well as
support systems which will nurture student interest in STEM careers.
The T-STEM academies Design Blueprint provides guidelines for the
development and implementation of the STEM programs. Many of the programs were
implemented as small schools or as a school within a school. The seven benchmarks of
the design blueprint include 1) mission-driven leadership, 2) T-STEM culture, 3) student
outreach, recruitment and retention, 4) teacher selection, development and retention,
5) curriculum, instruction, and assessment, 6) strategic alliances, and 7) academy
advancement and sustainability (Avery et al., 2010).
There are currently 51 Texas STEM (T-STEM) academies throughout the state,
comprised of 20 campuses serving grades 9-12 and 31 campuses serving grades 6-12.
There are five T-STEM centers associated with universities which are designed to
develop innovative curriculum, research-based educational resources for STEM areas,
professional development for teachers, and classroom support (Fontenot, Chandler,
Talkmitt, & Sullivan, 2007).
Through the use of an engineering design process as an instructional framework,
the STEM programs are designed to engage students in rigorous inquiry and project-
based learning. Project-based learning is used as a vehicle to allow students to use their
knowledge in addressing real world problems through which they learn and apply high

12
content standards as they search for solutions. The approach is designed to help students
develop skills which will help them succeed in higher education and the workforce. The
STEM programs include the development of problem solving, teamwork,
communication, and critical thinking skills. The T-STEM initiative challenges the
traditional way of teaching mathematics and science in grades 6-12 by incorporating
hands-on applications. The T-STEM programs are serving schools with high populations
of students who are economically disadvantaged and are underrepresented in STEM
fields (Fontenot et al., 2007).
Theoretical Framework
Bruner’s inquiry-based constructivist learning theory is influenced by earlier
educational theories developed by Jean Piaget and John Dewey. Constructivism includes
concepts such as incorporating the teacher as a guide to learning, allowing children to be
led by their natural curiosity and interests, and working cooperatively with others as they
construct knowledge. These guidelines are also the cornerstones of project-based
learning (Warde & Novak, 1960). Constructivism is based on sociology and centers on
evaluating how individuals report their perceptions, beliefs, and world views in a
particular setting (Patton, 2002).
Project-based learning (PBL) is a constructivist-based learning approach which is
designed to encourage student motivation and promote academic rigor. Students are
given projects which include finding solutions to open-ended problems incorporating
group work, scaffolding, and multiple subject area integration (Ravitz, 2010). The
projects encourage the development and use of skills such as critical thinking,
collaboration, and communication as students create and present artifacts demonstrating
13
and explaining what they have learned. Successful PBL instruction requires extensive
planning, professional development, tools and strategies for effective instruction, and a
supportive environment (Ravitz, 2010).
Discovery learning philosophies are incorporated into project-based learning by
encouraging students to employ hands-on activities as they attempt to solve problems
with real life applications (Reigle-Crumb, Moore, & Ramos-Wada, 2011). Project-based
learning is a student-centered instructional strategy which encourages student
collaboration as they work in small groups to answer questions, solve problems, and
reflect on their experiences. Employing critical thinking skills, creativity, and a desire to
learn more as they discover by doing was described by a panel of teachers as the ultimate
educational goal for their students (Reigle-Crumb, et al., 2011). Bicknell-Holmes and
Hoffman (2000) described discovery learning as having the following three main
attributes: 1) activities which encourage scaffolding new knowledge into existing
knowledge for the learner; 2) exploring and problem solving to create, integrate, and
generalize the learner’s knowledge; and 3) student driven, interest-based learning
activities.
There are five main characteristics identified by Joyce A. Castronova (2002) as
differentiating discovery learning from traditional learning models. The first includes
active student participation and hands-on learning rather than the transfer of knowledge
from teacher to students. The second suggests that by encouraging mastery and
application of concepts, the emphasis of learning should be on the process rather than the
end product. The third involves the lessons learned from failure as encouragement to
continue searching for solutions. The fourth suggests that collaboration and discussions
14
among students allows for a deeper understanding of the subject area. And the fifth
characteristic involves satisfying natural human curiosity by student driven, interest-
based learning (Castronova, 2002).
Discovery learning, inquiry learning, project-based learning, teaching by
problem-solving, and inductive methods are all terms used over a period of 30 years of
research, which were categorized together under the umbrella of inquiry learning (The
Inquiry Synthesis Project, 2006). While the approaches are varied, the basic components
of these strategies include aspects emphasizing student responsibility for learning, student
motivation, and student active thinking. Student outcomes of programs of interest,
utilizing the framework of inquiry instruction, particularly in science, were tracked as
part of numerous studies in an effort to develop inquiry-science-instruction measurement
protocols (The Inquiry Synthesis Project, 2006).
Student Engagement
The benefits of inquiry-based learning and student engagement have been of
interest to many researchers since John Dewey published his classic works which
spanned almost 50 years. The inquiry learning method has been applied in subjects such
as science, mathematics, and social studies. A study involving adolescents suggests that
problem-based learning for them may be more productive when it incorporates small
group collaborative learning (Memory, Yoder, Bolinger, & Warren, 2004). Adolescents
were more motivated and engaged in their learning when they were allowed to choose
tasks, topics, and investigations to solve a problem they were given. Working in groups
allowed the students to share prior knowledge and develop thinking, collaborative, and
investigative skills required for more complex PBL tasks (Memory et al., 2004).
15
The instructional model of problem-based learning (PBL) was developed in
medical school programs. Students using PBL are given projects based on real life
problems and purposeful learning takes places as the search for solutions to those
problems is sought. The instructor serves as a coach as students work in collaborative
groups seeking answers to solve assigned problems which are vague by (Goodnough,
2006). The problems which students are given do not have a single right way to reach a
solution, and creative responses promote long-term retention of information.
The National Research Council (NRC) established the National Science
Education Standards in 1996 (NRC, 1996). In the year 2000, those standards were
expanded to include inquiry as an integral part of science instruction and student learning
(NRC, 2000). The Principles and Standards for School Mathematics, established by the
National Council of Teachers of Mathematics (NCTM), also included inquiry as an
essential part of mathematics instruction (NCTM, 2000). Inquiry-based science and
mathematics instruction is believed to contribute to greater learning and deeper
understanding when students are provided the opportunity to construct knowledge
through inquiry and are engaged in their learning. The Learning Cycle is an approach
which incorporates inquiry and can be applied to most subjects in order for students to
become more engaged in the lessons which are presented (Luera, Killu, & O’Hagan,
2003).
A program implemented in an urban school’s sixth grade class integrating
mathematics and science instruction found significant academic achievement differences
between students included in the integration program compared to those in a traditional
instructional setting (Hill, 2004). Students in the integration program worked in groups

16
as they were asked to solve real world problems which required hands-on applications of
mathematics and science knowledge. Improved scores on standardized testing for
students in the integration group, including at-risk and special education students,
suggested a deeper understanding and knowledge of mathematics was attained by those
students (Hill, 2004).
A study by Goodnough (2006) was conducted to investigate students’ PBL work
in a 9th grade biology class consisting of 39 students. Students were allowed to integrate
their own interests with biology in developing the questions, design their information
gathering methods, and apply their knowledge of the scientific method in searching for
solutions. The majority of the students reported a sense of ownership in their projects
and enjoyed working on projects which allowed them to be actively involved in their own
learning (Goodnough, 2006).
Inquiry-based learning includes the benefit of greater engagement by students and
the disadvantage of requiring additional time and efforts from both students and teachers
(Heppner, Kouttab, & Croasdale, 2006). Concerns regarding rigor, student
developmental levels, and future goals suggest that inquiry learning must be combined
with conventional teaching methods to meet the needs of a greater number of students.
Following students’ progress through high school and college may provide greater insight
into the benefits of inquiry-based learning as students’ maturity levels increase (Heppner,
Kouttab, & Croasdale, 2006).
Factors which have been identified as affecting student learning and achievement
include motivation, attitudes towards learning, attitudes towards a particular subject, and
self-concept (Baseya & Francis, 2011). A study conducted to analyze the impact of

17
inquiry-oriented science labs on freshman and sophomore college students at the
University of Colorado at Boulder found that student attitudes and excitement level
depended on the perceived difficulty of the lab itself. Students preferred a guided
instruction style over a project-based learning environment for labs which they perceived
as being more difficult. Greater preparation provided through more in-depth pre-lab
material for labs which were perceived as difficult were suggested by the authors as
positively impacting student attitudes towards project-based learning (Baseya & Francis,
2011).
The creation of small, reform-oriented high schools designed to promote student
readiness for skills required for the 21st century has been made possible through private
investment and legislative changes. Project-based learning is a key feature of reform
models which include cultural and organizational practices to support the effective use of
PBL (Ravitz, 2010).
Research in human cognition has demonstrated that active engagement
contributes to deeper learning. The National Science Education Standards (NSES)
established inquiry as a highly effective learning strategy which is useful in learning
subjects in addition to science (NSES, 2000). Higher education has incorporated more
inquiry-based learning which requires students to develop and apply skills that include
analyzing and exploring alternative explanations for results obtained in non-laboratory
teamwork settings. Students’ individual accountability includes the ability to defend their
answers by applying concepts learned and understanding gained through their inquiries
(Flory, Ingram, Heidinger, & Tintjer, 2005).

18
Changing Demographics
Public school data, comparing student demographics since 1993-1994 to 2005-
2006, indicated a greater than 55% increase in Hispanic student populations. Data
gathered by the Pew Hispanic center for those years indicated a growing proportion of
public elementary/secondary school students represented by Black and Hispanic students
and a decreasing share of White students. The number of public schools with nearly all
minority students increased from 5,498 to 10,135 during the same period, while the
number of nearly all-White schools fell from 25,603 to 16,679 (Fry, 2007). Data
provided by The National Center for Education Statistics regarding public school
ethnicity information between 1972 and 2007 showed that the percentage of public
school students who were White decreased from 78% to 56%. During that same period,
the Hispanic student population increased from 6% to 21% and represented the fastest
growing group of school-age children (Fusarelli, 2011).
The U.S. Census bureau projected that the Hispanic school age population, ages 5
to 17, would increase 166% by 2050, while the non-Hispanic white school age
population, ages 5 to 17, would increase by only 4% during the same time period (Fry &
Gonzales, 2008). In 2006, Hispanics represented the largest minority groups in public
schools in 22 states. More than half of Hispanic students in public schools were enrolled
in schools in Texas and California. Nearly 70% of Hispanic students are of Mexican
origin and 84% of all Hispanic students were born in the United States (Fry & Gonzales,
2008).
The majority of African American and Hispanic children live in urban areas
which are more likely to have high concentrations of poverty and joblessness (Fusarelli,

19
2011). The Brookings Institution (2010) identified changes in metropolitan areas as
having five realities which are impacting the demographics in such areas including 1)
growth and outward expansion of the population, 2) income polarization, 3) uneven
higher educational attainment, 4) increasing ethnic diversity, and 5) an aging population.
The number of children living in poverty reached 15.6 million in 2010, as the economic
challenges faced by the U.S. resulted in increased numbers of parental unemployment
(Young & Fusarelli, 2011). The gap in academic attainment in mathematics, reading, and
science in the U.S. was influenced by factors such as teacher qualifications, parental
education, and father’s occupation (Houtenville & Conway, 2008).
The inequality in educational opportunities is expected to widen the achievement
gap as income polarization increases. The challenges for public schools are exacerbated
as programs targeted to meet the needs of low income children are reduced or eliminated
(Young & Fusarelli, 2011). The National Center for Education Statistics defines high-
poverty schools as those in which at least 76% of children were eligible for free or
reduced lunch. The majority of those schools are located in urban areas: 34% of Blacks
and 46% of Hispanics attend high poverty schools compared to only 14% of Whites
(Aud, Hassar, Planty, & Snyder, 2010).
Teacher Effectiveness
Student achievement, as a measure of teacher effectiveness, was the basis for
research performed by The Brookings Institution. The study found that the weakest
teachers tend to be concentrated in the poorest schools. In Los Angeles, for example,
schools with 90% of their student population on free or reduced lunch programs were 2.5
times more likely to have teachers who were in the bottom quartile based on teacher
20
evaluations than did schools with less than 10% of students on free or reduced lunch
(Gordon, Kane, & Staiger, 2006).
The National Science Foundation reported chronic shortages of qualified teachers
who are adequately prepared to effectively teach STEM subjects in K-12. This lack of
preparation is particularly evident at the elementary and middle school levels. According
to the U.S. Department of Education data from 2002, 51.5% of middle-school
mathematics teachers and 40% of middle-school science teachers did not have a major or
minor in those subjects (Kuenzi, 2008). The report also noted that, in 2004, White fifth
graders were 51% more likely to be taught with teachers with a master’s or advanced
degrees than did Latino or African American students (Museus, Palmer, Davis, &
Maramba, 2011). Minority students in low economic schools were twice as likely to be
taught by teachers with three years experience or less, compared with schools with
predominantly White student populations (Museus et al., 2011).
Research on teacher quality conducted over a 20 year period revealed that
student achievement in mathematics and science is significantly affected in a positive
manner when instructors have a major in the subject which they teach (Kuenzi, 2008).
High school teachers were more likely to have majored or minored in the subjects which
they taught. Only 14.5% of those who taught mathematics and 11.2% of those who
taught science in high school did not have a major or minor in those subjects. Students
who were taught high school mathematics by higher quality teachers who had more
college level mathematics classes achieved at higher academic levels than did the
comparison group (Pey-Yan, Liou, Desjardins, & Lawrenz, 2010).

21
The educational experience for students is impacted to a great extent by the
quality and effectiveness of teachers (Nathan, Tran, Atwood, Prevost, and Phelps, 2010).
The Engineering Education Beliefs and Expectation Instrument (EEBEI), designed to
compare teachers’ beliefs and expectations about pre-college engineering instruction and
college preparation, was used to examine the beliefs and expectations of Project Lead the
Way (PLTW) teachers and non-PLTW teachers. The non-PLTW teachers agreed more
strongly that high school academic achievement in mathematics and science was
necessary for prospective engineering students. The PLTW teachers were more likely to
report that engineering activities should integrate science and mathematics content and
academic achievement in high school should not be the only determinant in identifying
prospective engineering students (Nathan et al., 2010). Practicing engineers described
communications skills, interdisciplinary cooperation, good experimental skills, problem
solving, and creativity as skills essential to success in their profession. Contrasting views
by teachers help shape the instruction, recruitment, and assessment practices in K-12
classrooms and influence decisions made regarding the potential of students as future
engineers (Nathan et al., 2009).
In the fall of 2009, the Bill & Melinda Gates Foundation created the Measures of
Effective Teaching (MET) project to gather information on best teaching practices.
Information was gathered over two years and included feedback from over 3000 teachers
in school districts throughout the nation. The MET project included partnerships with
academic institutions such as Harvard University, nonprofit organizations such as the
RAND Corporation, educational consultants such as Teachscape, and teacher
organizations such as The American Federation of Teachers (Kane & Cantrell, 2009).
22
The MET project’s goal was to identify effective teaching methods which could be used
to help develop more effective teachers. The basis for this project was that in order to
improve student achievement, better teaching methods must be identified and taught to
current and future teachers (Kane & Cantrell, 2009).
Student Achievement
Identifying students with the potential to be developed into high academic
achievers requires training for dealing with those who may otherwise fall through the
cracks. The adjectives which were used to describe such children included “gifted,”
“talented and motivated,” and “high-ability” students. Spatial and quantitative talents of
those who eventually earned doctorates in a STEM field were apparent in elementary
school (NSB 10-33, 2010). Developing guidelines to identify a broad pool of students
with the ability and interest to pursue a STEM education is necessary for proper
development and training at all educational levels (NSB 12-01, 2012).
The disparity between academic achievement of Hispanic and their non-Hispanic
white peers has been documented in numerous studies. A large percentage of Hispanic
students have parents who did not complete high school or pursue higher education.
Students whose parents achieved higher levels of education or valued academic
achievement were less pervasive in Hispanic communities (Fry & Gonzales, 2008).
Parental involvement and high expectations for their children regarding academic
achievement was reflected in higher grades and higher scores on standardized tests.
Parental expectations were also linked to student motivation and aspirations for higher
education which were communicated in diverse socio-cultural contexts (Houtenville &
Conway, 2008).

23
An ASHE higher education evaluation report (2011) included factors which
impacted the success of minority students success in the STEM circuit in kindergarten
through grade 12 (K-12). Inadequate levels of academic preparation for college level
courses negatively impacted the successful pursuit of STEM careers for many students.
The most important predictor of students’ ability to complete a STEM baccalaureate
degree was found to be the academic intensity of their high school curriculum (Museus et
al., 2011). The report identified eight factors in K-12 education which contributed to the
inadequate preparation of minority students in STEM subjects as: 1) school district
funding disparities, 2) unqualified teachers, 3) underrepresentation in AP courses, 4) low
teacher expectations, 5) tracking into remedial courses, 6) oppositional culture, 7)
stereotype threat, and 8) premature departure from high school (Museus et al., 2011).
Hispanics graduating from high school are less qualified for admission to a four-
year college than their white counterparts. Latinos were also more likely to have lower
test scores across subjects and less likely than non-Whites to take advanced coursework
(Reigle-Crumb & Callahan, 2009). Using the category of “minimally qualified” for
admission to a four-year college, 53% of Hispanic high school graduates, compared to
nearly 70% of White high school graduates, were prepared to pursue higher education at
a four-year college. Only 19% of Hispanics, compared to 35% of White students, met the
criteria for “highly qualified” for pursuing their education at a four-year college
(Campbell, Hombo, & Mazzeo, 2000). Data gathered from 1991 to 2002 by the U.S.
Department of Education indicated that the student graduation rates of those who
graduated from public high schools and college-ready in 2002 were approximately 40%
for White students, 23% for African American students, and 20% for Hispanic students.

24
The study counted only regular graduation rates of students who obtained a high school
diploma and excluded those who pursued equivalency tests (Greene & Winters, 2005).
Having friends with higher parental education was found to promote academic
achievement of Hispanic students. Relationships with non-Latino White peers were
shown to positively promote assimilation and academic achievement. Ties formed with
dominant culture students were found to provide students access to families with higher
educational and economic attainment which improved students’ insight, information, and
motivation to succeed in an academic setting (Reigle-Crumb & Callahan, 2009).
According to data gathered by the Bill and Melinda Gates foundation, of the 1.9
million students pursuing higher education, 1.3 million students pursuing STEM careers
required remediation courses in order to successfully complete college-level STEM
courses (Gammon, 2011). The overall percentage of STEM degrees awarded by U.S.
universities has remained at approximately 17% of all postsecondary degrees awarded
since the 1980s. The decrease in the number of secondary degrees in mathematics,
engineering, and physical sciences has been offset by increases in degrees in biology and
computer science (Kuenzi, 2008).
Business degrees were roughly equal in number to STEM degrees awarded at the
associate and baccalaureate levels. Nearly twice as many master’s degrees were pursued
in business and education as compared to those in STEM fields. At the doctoral level,
degrees awarded for STEM fields comprised approximately one third of all degrees
awarded. Federal funding of STEM education programs primarily support graduate and
post-doctoral education (Kuenzi, 2008). As of the mid-2000s, a third of STEM doctoral
students were foreign students on temporary visas (NSB 10-33, 2010).

25
The National Assessment of Educational Progress (NAEP) has been assessing
elementary and secondary students from public and private schools at grades 4, 8, and 12.
Student achievement levels are divided into basic, proficient, and advanced. In 2005,
scores indicated that less than one-third of 4th and 8th grade students scored at or above
the proficient level in science. Less than one-fifth of 12th grade students scored at or
above the proficient level in science. Those percentages have remained fairly similar to
performance measures recorded in 1996 (Kuenzi, 2008).
The results of mathematics test between 1990 and 2005 showed continued
improvement in scores of 4th and 8th grade students, but the percentage of students
performing at the basic level did not change during that period. Approximately 20% of
4th graders and more than 30% of 8th graders scored below the basic level, and only 33%
of 4th and 8th grade students performed at the proficient level in math. The results for 12th
grade students showed a decrease in the percent of students scoring at the proficient level
but they had a higher percentage scoring at the basic level. The percentage of students
scoring at or above the proficient level in math has been declining since 2005 (Kuenzi,
2008).
Educational Funding
The current economic crisis is described as the Great Recession and is considered
as the worst financial crisis in the United Stated since the Great Depression (Young &
Fusarelli, 2011). Reductions in tax revenues for state and local governments combined
with increased in demand for publicly funded services have resulted in large budget gaps
in many state budgets. Public education has been negatively impacted by government
cutbacks which have led to decreased funds available for personnel costs and academic

26
programs (Young & Fusarelli, 2011). These changes are significant as political decisions
concerning school funding compete with social issues concerning an aging population.
Elderly Americans are more likely to participate in the voting process and exert greater
influence on political decisions involving the distribution of limited financial resources
which directly impact public school assets (Fusarelli, 2011).
Local property taxes contribute a significant percentage of public school funding.
Low income students are more likely to attend neighborhood schools which receive less
funding per pupil than schools located in affluent neighborhoods (Museus et al., 2011).
Data from the National Assessment of Educational Progress (NAEP) showed that 3% of
White eighth graders are in schools where 75% of the students qualify for free or reduced
lunch, 34% of eighth grade Hispanics, and 35% of eighth grade Blacks attend such
schools. Schools with more resources, as a result of a higher tax base, are able to afford
smaller class sizes, instructional materials, laboratories, and technology which positively
contribute to student learning and achievement (Museus et al., 2011).
Federal support for high-ability students in K-12 programs has been minimal. The
National Association for Gifted Children (NAGC) conducted a survey in 2008-2009
which received input from 45 states. Of those respondents, only 32 states required school
districts to provide services for gifted and talented children. Twelve states did not
provide funds to support gifted education. Only five states required professional
development for teachers in gifted and talented education. These students are more likely
to pursue careers in STEM fields with proper guidance and training at the elementary,
middle, and high school levels (NSB 10-33, 2010).

27
A study designed to examine the perception about the influence of scholarships
for STEM teachers who agreed to teach in high need schools was conducted. Survey
results based on responses by 304 STEM educators suggested that competitive,
prestigious scholarships influenced the decisions of top ranking scholarship recipients to
enter the teaching profession and serve in high needs schools. Financial incentives were
found to be a necessary component of attracting and retaining high quality STEM majors
in teaching (Pey-Yan et al., 2010).
Summary
The global economy depends on knowledgeable workers as technology becomes
the driving force behind innovations throughout the world. Power players of past
generations are being challenged by countries which were unable to compete in eras such
as the U.S. industrial revolution. Investment in human capital is differentiating countries
which will be competitive in a knowledge based economy from those who will not.
In order for Americans to enjoy the societal benefits, which were possible in past
generations as a result of the exemplary educational system, investment in education
must once again become a national priority. The status that America enjoyed as a leading
innovator and home to the greatest minds in science, technology, engineering, and
mathematics is threatened. The investments being made by other countries in their
educators and students are preparing the populations to become the leading innovators in
the 21st century. The gains which were made in the 50s and 60s created many benefits to
all Americans as generations benefited from the educational investment the U.S. made in
mathematics and science. The declining performance by American students must be
addressed and corrected in order to prepare future generations to continue the legacy

28
which those generations created. Defending our democracy and lifestyle is tied to the
development of future generations of STEM innovators. Improving the performance of
all students in mathematics and science must become a national priority for security as
well as financial reason

29
CHAPTER 3
METHOD
Introduction
The primary purpose of the study was to examine the impact of a STEM program
on 8th graders’ academic achievement in mathematics, science, and reading. The study
was guided by the following research questions:
1. What is the impact of the STEM program on mathematics achievement among
eighth grade students?
2. What is the impact of the STEM program on science achievement among
eighth grade students?
3. What is the impact of the STEM program on reading achievement among
eight grade students?
Research Design
The study employed an ex-post facto, causal-comparative design. Ex-post facto,
Latin for after the fact, includes retrospective studies in which the researcher attempts to
determine the cause, or reasons, for known consequences or results (Meltzoff, 2008). In
causal-comparative studies, the researcher does not manipulate the independent variable
but attempts to identify relationships which may occur between the independent and
dependent variables. The researcher compares groups in which the independent variable
is present with at least one group in which the independent variable is not present in an
attempt to identify differences among the groups based on the dependent variable(s). The
researcher speculates about possible causes or effects for the observed variations in
historical data outcomes among the groups (Gall, Gall, & Borg, 2007).

30
A typical STEM program consists of an increased focus on hands-on and project-
based learning which includes group assignments. By involving students in solving real
world problems, working in collaborative groups, applying critical thinking skills, and
developing real solutions, current research in project-based learning suggests that such
learning activities may increase student interest in science, technology, engineering, and
mathematics (Fortus, Krajcikb, Dershimer, Marx, & Mamlok-Naamand, 2005). The
STEM educational programs also involve the integration of knowledge in other subjects
(e.g., English, social studies) as students attempt to solve problems and create new
knowledge. This process includes interdisciplinary bridging among discrete disciplines
which offer students opportunities to make sense of the world in a holistic manner.
Rigorous academic concepts coupled with real-world lessons allow students to gain skills
which will enable them to compete in STEM fields in a world economy (Tsupros, Kohler,
& Hallinen, 2009).
Teacher professional development, collaborative learning, and partnerships with
local businesses provide STEM students with additional resources such as field trips that
include hands-on applications of lessons, which are designed to encourage
underrepresented or disadvantaged groups to pursue higher education in STEM fields
(Kuenzi, 2008).
In the study, there was one independent variable, the STEM program, with two
levels: 1) STEM program (characteristic-present group) and 2) non-STEM program
(comparison group). The outcome measures were the students’ achievement scores on
mathematics, science, and reading. The independent variable was not manipulated by the
researcher; thus, no causal inferences were drawn.

31
Subject Selection
The Middle School was located in a lower socio-economic neighborhood in South
Texas. The study was delimited to eighth grade students because 1) such students were
required to take the TAKS test in mathematics, science, and reading; 2) national
mandatory testing for science was required at the fifth, eighth, and eleventh grade levels;
and 3) middle schools in the school district in which the study took place offered sixth,
seventh, and eighth grade education. The characteristic-present group consisted of 73
eighth grade students in a STEM academic program. An overwhelming majority of the
STEM students chose to be in the program due to personal interest or parental
encouragement. Requirements for inclusion in the STEM academic group included the
submission of student essays and parental signatures on the application form. A
maximum of 100 students per middle school grade level could be part of the STEM
program based on the grant guidelines. The comparison group consisted of 103 eighth
grade students in a non-STEM academic program. Due to the non-probability nature of
sampling, external validity was limited to study participants.
Permission to conduct the study was obtained from the Institutional Review
Board at Texas A&M University-Corpus Christi and the school district (Appendix A).
Instrumentation
The state of Texas has changed testing programs in the past several decades. The
Texas Assessment of Academic Skills (TAAS) test was used from 1990-2002; it was
replaced by the Texas Assessment of Knowledge and Skills (TAKS) in 2003. In the
2011-2012 academic school year, the TAKS was replaced by the State of Texas
Assessments of Academic Readiness (STAAR).

32
The TAKS test was designed to measure student’s understanding and knowledge
of the Texas Essential Knowledge and Skills (TEKS), which were used as guidelines for
the statewide curriculum. For the purposes of the study, the 2011 TAKS objective scores
in science, mathematics, and reading were used. The proportion of correct answers was
used to measure each objective (TEA, 2010).
The eighth grade TAKS mathematics test had six objectives with a total of 50
items, which tested student knowledge of the mathematics TEKS. The mathematics
objectives are listed in Table 1.
Table 1
TAKS 8th Grade Mathematics Objectives
Objective Number of Items Tested 1. Numbers, Operations, and Quantitative Reasoning 10 2. Patterns, Relationships, and Algebraic Reasoning 10 3. Geometry and Spatial Reasoning 7 4. Concepts and Uses of Measurement 5 5. Probability and Statistics 8 6. Mathematical Processes and Tools 10
Total Number of Items 50
The eighth grade TAKS science test had five objectives with a total of 50 items,
which tested student knowledge of science TEKS. The science objectives are listed in
Table 2.

33
Table 2
TAKS 8th Grade Science Objectives
Objective Number of Items Tested 1. Nature of Science 14 2. Living Systems and the Environment 12 3. Structures and Properties of Matter 6 4. Motion, Forces, and Energy 6 5. Earth and Space Systems 12
Total Number of Items 50
The eighth grade TAKS reading test had four objectives with a total of 48 items,
which tested student knowledge of reading TEKS. The reading objectives are listed in
Table 3.
Table 3
TAKS 8th Grade Reading Objectives
Objective Number of Items Tested 1. Basic Understanding 12 2. Applying Knowledge of Literary Elements 10 3. Using Strategies to Analyze 10 4. Applying Critical-Thinking Skills 16
Total Number of Items 48
The writers and reviewers for TAKS tests verified that test questions related to
each objective measured the appropriate content and were aligned with the test items they
had designed to measure TEKS. Construct validity for TAKS test content was shown by
the relationship between the tested content and the construct they were designed to
measure (TEA, 2010). For the TAKS tests utilizing multiple-choice items, the Kuder-
Richardson Formula 20 (KR20) was used to calculate the reliability estimates.
Reliability indices for TAKS assessments ranged from .87 to .90 (TEA, 2010).
34
Data Collection
The data were obtained from the Texas Education Agency (TEA), which included
raw scores for each of the TAKS objectives, as well as data on the selected characteristics
of the students (i.e., age, gender, ethnicity, socioeconomic status, and special education
status). Permission to use the data for the purpose of the study was obtained from the
school district where the Middle School was located (Appendix A).
Data Analysis
Data obtained from the TEA were downloaded into the Statistical Package for the
Social Sciences (SPSS). The proportion of the total number of test questions answered
correctly to the total number of questions in each reporting category was used to measure
student achievement in science, mathematics, and reading. Descriptive statistics were
used to summarize and organize the data. A t-test for independent samples (Field, 2009)
was performed to compare the characteristic-present and comparison groups on the basis
of age. A series of chi-square test of independence was performed to compare the two
groups on the basis of gender, ethnicity, socioeconomic status, and special education
status (Field, 2009).
A series of multivariate analysis of variance (MANOVA) was performed to assess
differences between the STEM and non-STEM groups on the basis of the outcome
measures. This multivariate statistical technique is used to analyze data that involve
more than one dependent variable at a time (Field, 2009). There is a mathematical
expression called a vector, which represents each subject’s score on more than one
response variable. The mean of the vectors for each group is called a centroid. The
MANOVA is used to differentiate among groups with respect to their centroids (Stevens,
35
2009). For the purpose of post hoc analysis, a series of univariate F-test was performed.
Mean difference effect sizes were computed to examine the practical significance of the
findings. Specifically, Cohen’s d (��
√��) was computed and characterized as .2=small,
.5=medium, and .8=large (Cohen, 1988).
Group differences on the basis of age and special education status were
statistically significant, and the two variables were correlated with the majority of the
outcomes measures; thus, they were considered to be confounding variables. Co-variate
analysis was deemed necessary. A series of multivariate analysis of co-variance
(MANCOVA) was performed to test group differences on the basis of outcome measures
adjusted on the basis of age and special education status (Field, 2009). Observed and
adjusted mean scores were reported.

36
CHAPTER 4
RESULTS
The purpose of the ex post facto causal-comparative study was to compare
academic achievement in science, mathematics, and reading objective test scores of
eighth grade students in a Science, Technology, Engineering, and Mathematics (STEM)
program to the academic achievement in science, mathematics, and reading objective test
scores of eighth grade students in a non-STEM program. It was hypothesized that the
students in the STEM program would outperform the students in the non-STEM program
on the basis of the above-mentioned outcome measures. The study was guided by the
following questions:
1. What is the impact of the STEM program on mathematics achievement among
eighth grade students?
2. What is the impact of the STEM program on science achievement among
eighth grade students?
3. What is the impact of the STEM program on reading achievement among
eighth grade students?
The data were obtained from the school district and the Texas Education Agency.
The data were coded, entered into a computer, and analyzed by using the Statistical
Package for the Social Sciences (SPSS).
Achievement in mathematics, science, and reading was measured by the Texas
Assessment of Knowledge and Skills (TAKS); the 2010 – 2011 academic school year
data were used. The study was delimited to 8th graders and the non-probability sample
consisted of 176 students. The characteristic-present group (n = 73) included eighth

37
grade students who had participated in the STEM academic program and the comparison
group (n = 103) included eighth grade students who had not participated in the STEM
academic program. The two sample sizes were deemed approximately equal as the
largest n divided by the smallest n was less than 1.50 (Stevens, 2009).
A Profile of Subjects
The students in the STEM group ranged in age from 13 to 15 years old; students
in the non-STEM group ranged in age from 13 to 16 years old. The STEM group (M =
13.56, SD = .58) was younger than the non-STEM group (M = 13.90, SD = .69), and the
difference was statistically significant, t(174) = 3.44, p < .01. The non-STEM group was
almost equally represented by both genders, female (49.50%, n = 51) and male (50.50%,
n = 52). The STEM group included more females (56.20%, n = 41) than males (43.80%,
n = 32). The group differences were not statistically significant, χ2 (1, N=176) = .51, p =
.47. The majority of the students in the STEM program were Hispanic (90.40%, n = 66),
followed by White (5.50%, n = 4), and African American (4.1%, n = 3). The non-STEM
group had a similar distribution with Hispanics being the majority (89.30%, n = 92),
followed by African American (5.80%, n = 6), and White (4.90%, n = 5). For the
purpose of data analysis, ethnicity was recoded into Hispanic or non-Hispanic because
there were cells with expected frequency less than five; the differences were not
statistically significant, χ2(1, N = 176) = .01, p = 1.00. The majority of the students in
both groups were economically disadvantaged, as determined by eligibility for free or
reduced lunch; the group differences were not statistically significant, χ2 (1, N = 176) =
2.50, p = .11. The difference in the number of special education students in the STEM
program (4.10%, n = 3) compared to the non-STEM program (22.30%, n = 23) was

38
statistically significant, χ 2 (1, N = 176) = 9.86, p = < .01. Gender, ethnicity, and socio-
economic status were not correlated with the outcome measures; thus, they were not
considered to be confounding variables. Age and special education status were correlated
with the majority of the outcome measures; thus, covariate analysis was deemed
necessary. Results are summarized in Table 4.
Table 4
A Profile of Subjects STEM Group Non-STEM Group (n = 73) (n = 103) Demographic characteristic F % F % Gendera
Male 32 43.80 52 50.50 Female 41 56.20 51 49.50
Ethnicityb
Hispanic 66 90.40 92 89.30 Non-Hispanic 7 9.60 11 10.70 Socio-Economic Statusc
Disadvantaged 59 80.80 93 90.30 Not disadvantaged 14 19.20 10 9.70 Special Education Statusd Yes 3 4.10 23 22.30 No 70 95.90 80 77.70 Agee M SD M SD 13.56 .58 13.90 .69 a χ
2 (1, N = 176) = .51, p = .47 b χ
2 (1, N = 176) = .01, p = 1.00 c χ
2 (1, N = 176) = 2.50, p = .11 d χ
2 (1, N = 176) = 8.86, p < .01 e t (174) = 3.44, p < .01
Outcome Measures
The three sets of outcome measures included TAKS objective scores on
mathematics, science, and reading. Mathematics included six objectives: Objective 1:

39
Numbers, Operations, and Quantitative Reasoning; Objective 2: Patterns, Relationships,
and Algebraic Reasoning; Objective 3: Geometry and Spatial Reasoning; Objective 4:
Concepts and Uses of Measurement; Objective 5: Probability and Statistics; Objective 6:
Mathematical Processes and Tools. Science consisted of five objectives: Objective 1:
Nature of Science; Objective 2: Living Systems and the Environment; Objective 3:
Structures and Properties of Matter; Objective 4: Motion, Forces, and Energy; Objective
5: Earth and Space Systems. Reading was defined by four objectives: Objective 1:
Basic Understanding; Objective 2: Applying Knowledge of Literary Elements; Objective
3: Using Strategies to Analyze; Objective 4: Applying Critical-Thinking Skills.
Mathematics Achievement
Achievement in mathematics was measured by the proportion of correct answers
to questions in each of the six objectives. The means and standard deviations are
summarized in Table 5.
Table 5
Mathematics Achievement STEM Group Non-STEM Group
(n = 73) (n = 103) Mathematics Objectives M* SD M* SD Objective 1 .68 .17 .60 .22 Objective 2 .67 .20 .51 .23 Objective 3 .70 .21 .59 .23 Objective 4 .47 .26 .42 .25 Objective 5 .68 .17 .60 .21 Objective 6 .67 .21 .55 .21 *Proportion of correct answers Note: Objective 1: Numbers, Operations, and Quantitative Reasoning Objective 2: Patterns, Relationships, and Algebraic Reasoning Objective 3: Geometry and Spatial Reasoning Objective 4: Concepts and Uses of Measurement Objective 5: Probability and Statistics Objective 6: Mathematical Processes and Tools

40
As can be seen in Table 6, the objective test scores were correlated with each
other; thus multivariate analysis of variance (MANOVA) was used to compare the STEM
and non-STEM groups on the basis of the group centroids.
Table 6
Correlation Matrix for Mathematics Objective Scores Factor Obj1 Obj2 Obj3 Obj4 Obj5 Obj6 Obj1 1.00 Obj2 .54* 1.00 Obj3 .38* .56* 1.00 Obj4 .31* .51* .48* 1.00 Obj5 .40* .52* .46* .49* 1.00 Obj6 .46* .57* .50* .41* .46* 1.00 * p < .01 Note: Obj 1: Numbers, Operations, and Quantitative Reasoning Obj 2: Patterns, Relationships, and Algebraic Reasoning Obj 3: Geometry and Spatial Reasoning Obj 4: Concepts and Uses of Measurement Obj 5: Probability and Statistics Obj 6: Mathematical Processes and Tools
The MANOVA showed that group differences on the basis of the centroids were
statistically significant, F(6, 169) = 4.61, p < .01. A post hoc analysis showed that with
the exception of Objective 4: Concepts and Uses of Measurement, all group differences
were statistically significant, favoring the STEM group. In order to examine the practical
significance of the findings, mean difference effect sizes were computed. As can be seen
in Table 7, effect sizes ranged from .19 to .73. The lowest effect size belonged to the
objective which did not differentiate between the two groups statistically.

41
Table 7
Mean Difference Effect Sizes – Mathematics Achievement Objective Mean Difference p Effect Size* Objective 1 .09 <.01 .42 Objective 2 .16 <.01 .73 Objective 3 .10 <.01 .46 Objective 4 .05 .21 .19 Objective 5 .08 <.01 .39 Objective 6 .12 <.01 .57 *Effect size, .2 = small, .5 = medium, .8 = large Note: Objective 1: Numbers, Operations, and Quantitative Reasoning Objective 2: Patterns, Relationships, and Algebraic Reasoning Objective 3: Geometry and Spatial Reasoning Objective 4: Concepts and Uses of Measurement Objective 5: Probability and Statistics Objective 6: Mathematical Processes and Tools
Science Achievement
Achievement in science was measured by the proportion of correct answers to
questions in each of the five objectives. The means and standard deviations are
summarized in Table 8.
Table 8
Science Achievement STEM Group non-STEM Group
(n = 73) (n = 103) Science Objectives M* SD M* SD Objective 1 .79 .15 .63 .20 Objective 2 .74 .18 .60 .21 Objective 3 .60 .25 .57 .24 Objective 4 .64 .22 .54 .22 Objective 5 .69 .20 .56 .22 *Proportion of correct answers Note: Objective 1: Nature of Science Objective 2: Living Systems and the Environment Objective 3: Structures and Properties of Matter Objective 4: Motion, Forces, and Energy Objective 5: Earth and Space Systems

42
The objective test scores were correlated with each other (Table 9); thus,
MANOVA was used to compare the STEM and non-STEM groups on the basis of the
group centroids.
Table 9
Correlation Matrix for Science Scores Factor Obj1 Obj2 Obj3 Obj4 Obj5 Obj1 1.00 Obj2 .64* 1.00 Obj3 .46* .43* 1.00 Obj4 .52* .54* .47* 1.00 Obj5 .66* .65* .50* .61* 1.00 * p < .01 Note: Objective 1: Nature of Science Objective 2: Living Systems and the Environment Objective 3: Structures and Properties of Matter Objective 4: Motion, Forces, and Energy Objective 5: Earth and Space Systems
The MANOVA showed that the group differences on the basis of the centroids
were statistically significant, F(5, 170) = 8.36, p < .01, favoring the STEM group. A post
hoc analysis showed that with the exception of Objective 3: Structures and Properties of
Matter, all group differences were statistically significant in favor of the STEM group.
Mean difference effect sizes were computed to examine the practical significance of the
findings. As can be seen in Table 10, effect sizes ranged from .16 to .90. Objective 3
showed the smallest effect size.

43
Table 10
Mean Difference Effect Sizes – Science Achievement Objective Mean Difference p Effect Size* Objective 1 .16 <.01 .90 Objective 2 .14 <.01 .68 Objective 3 .04 .30 .16 Objective 4 .09 <.01 .43 Objective 5 .14 <.01 .65 *Effect size, .2 = small, .5 = medium, .8 = large Note: Objective 1: Nature of Science Objective 2: Living Systems and the Environment Objective 3: Structures and Properties of Matter Objective 4: Motion, Forces, and Energy Objective 5: Earth and Space Systems
Reading Achievement
Achievement in reading was measured by the proportion of correct answers to
questions in each of the four objectives. The means and standard deviations are
summarized in Table 11.
Table 11
Reading Achievement STEM Group non-STEM Group
(n = 73) (n = 103) Reading Objectives M* SD M* SD Objective 1 .90 .10 .80 .19 Objective 2 .88 .12 .79 .18 Objective 3 .90 .12 .77 .20 Objective 4 .87 .12 .76 .20 *Proportion of correct answers Note: Objective 1: Basic Understanding Objective 2: Applying Knowledge of Literary Elements Objective 3: Using Strategies to Analyze Objective 4: Applying Critical-Thinking Skills

44
As can be seen in Table 12, the objective test scores were correlated with each
other and MANOVA was used to compare the STEM and non-STEM groups on the basis
of the group centroids.
Table 12
Correlation Matrix for Reading Scores Factor Obj1 Obj2 Obj3 Obj4 Obj1 1.00 Obj2 .60* 1.00 Obj3 .74* .61* 1.00 Obj4 .68* .60* .72* 1.00 * p < .01 Note: Objective 1: Basic Understanding Objective 2: Applying Knowledge of Literary Elements Objective 3: Using Strategies to Analyze Objective 4: Applying Critical-Thinking Skills
The MANOVA showed that the group differences on the basis of the centroids
were statistically significant, F(4, 171) = 6.42, p < .01. All group comparisons were
statistically significant, favoring the STEM group, based on a post hoc analysis. In order
to examine the practical significance of the findings, mean difference effect sizes were
computed. As can be seen in Table 13, effect sizes ranged from .59 to .74.
Table 13
Mean Difference Effect Sizes – Reading Achievement Objective Mean Difference p Effect Size* Objective 1 .10 <.01 .63 Objective 2 .09 <.01 .59 Objective 3 .13 <.01 .74 Objective 4 .11 <.01 .63 *Effect size, .2 = small, .5 = medium, .8 = large Note: Objective 1: Basic Understanding Objective 2: Applying Knowledge of Literary Elements Objective 3: Using Strategies to Analyze Objective 4: Applying Critical-Thinking Skills

45
Covariate Analysis
As reported earlier, differences between the STEM and non-STEM groups on the
basis of age and special education status were statistically significant. The majority of
the bivariate associations between individual objectives scores and these two variables
were statistically significant (Table 14).
Table 14
Bivariate Correlations Between Outcome Measures and Covariates Objective Age Sp Ed Status Math Objective 1 -.17* -.39*** Math Objective 2 -.17* -.28*** Math Objective 3 -.08 -.22** Math Objective 4 -.08 -.10 Math Objective 5 -.18* -.18* Math Objective 6 -.21** -.25** Science Objective 1 -.27*** -.24** Science Objective 2 -.15* -.11** Science Objective 3 -.05 -.15* Science Objective 4 -.12 -.10 Science Objective 5 -.13 -.26*** Reading Objective 1 -.29*** -.36*** Reading Objective 2 -.20** -.45*** Reading Objective 3 -.26** -.40*** Reading Objective 4 -.23** -.40*** * p < .05, ** p < .01, *** p < .001 Math Objective 1: Numbers, Operations, and Quantitative Reasoning Math Objective 2: Patterns, Relationships, and Algebraic Reasoning Math Objective 3: Geometry and Spatial Reasoning Math Objective 4: Concepts and Uses of Measurement Math Objective 5: Probability and Statistics Math Objective 6: Mathematical Processes and Tools Science Objective 1: Nature of Science Science Objective 2: Living Systems and the Environment Science Objective 3: Structures and Properties of Matter Science Objective 4: Motion, Forces, and Energy Science Objective 5: Earth and Space Systems Reading Objective 1: Basic Understanding Reading Objective 2: Applying Knowledge of Literary Elements Reading Objective 3: Using Strategies to Analyze Reading Objective 4: Applying Critical-Thinking Skills

46
Age and special education status were treated as covariates and a series of
Multivariate Analysis of Co-variate (MANCOVA) was performed to compare the two
groups on the basis of the centroids adjusted for the two confounding variables. The
observed and adjusted means for mathematics, science, and reading objectives are
reported in Table 15
Table 15
Observed and Adjusted Mean Scores for all Objectives STEM Group Non-STEM Group
(n = 73) (n = 103) Observed Adjusted Observed Adjusted
Objectives Mean* Mean* Mean* Mean* Math Objective 1 .68 .66 .60 .62 Math Objective 2 .67 .65 .51 .52 Math Objective 3 .70 .69 .59 .60 Math Objective 4 .47 .47 .42 .43 Math Objective 5 .68 .67 .60 .61 Math Objective 6 .67 .65 .55 .57 Science Objective 1 .79 .78 .63 .64 Science Objective 2 .74 .74 .60 .61 Science Objective 3 .60 .60 .57 .58 Science Objective 4 .64 .63 .54 .55 Science Objective 5 .69 .68 .56 .57 Reading Objective 1 .90 .88 .80 .82 Reading Objective 2 .88 .86 .79 .81 Reading Objective 3 .90 .88 .77 .79 Reading Objective 4 .87 .85 .76 .78 *Proportion of correct answers Math Objective 1: Numbers, Operations, and Quantitative Reasoning, Math Objective 2: Patterns, Relationships, and Algebraic Reasoning, Math Objective 3: Geometry and Spatial Reasoning, Math Objective 4: Concepts and Uses of Measurement, Math Objective 5: Probability and Statistics, Math Objective 6: Mathematical Processes and Tools Science Objective 1: Nature of Science, Science Objective 2: Living Systems and the Environment, Science Objective 3: Structures and Properties of Matter, Science Objective 4: Motion, Forces, and Energy, Science Objective 5: Earth and Space Systems Reading Objective 1: Basic Understanding, Reading Objective 2: Applying Knowledge of Literary Elements, Reading Objective 3: Using Strategies to Analyze, Reading Objective 4: Applying Critical-Thinking Skills

47
With respect to achievement in mathematics, MANCOVA showed that group
differences remained statistically significant, favoring the STEM group, F(6, 167) = 2.94,
p < .01. As reported earlier, post hoc analysis for MANOVA had shown that with the
exception of Objective 4: Concepts and Uses of Measurement, all group differences were
statistically significant. The post hoc analysis for MANCOVA showed that in addition to
Objective 4, group differences on the basis of adjusted scores for Objective 1: Numbers,
Operations, and Quantitative Reasoning and Objective 5: Probability and Statistics were
not statistically significant. With respect to achievement in science, MANCOVA showed
that group differences remained statistically significant, favoring the STEM group, F(5,
168) = 5.96, p < .01, and the post hoc results were the same as those obtained by
MANOVA. With respect to achievement in reading, MANCOVA showed that group
differences remained statistically significant, favoring the STEM group, F(4, 169) = 3.07,
p < .05, and the post hoc results were the same as those obtained by MANOVA.
Summary
It was hypothesized that the eighth grade students in the STEM program would
outperform the eighth grade students in the non-STEM program on the basis of academic
achievement in mathematics, science, and reading, as measured by the Texas Assessment
of Knowledge and Skills (TAKS) 2010 – 2011 academic school year data. Multivariate
and univariate analysis of the data showed that the STEM group performed at a higher
achievement level on the majority of the tested objectives than did the non-STEM
program on the basis of observed and adjusted scores for the outcome measures.
With respect to achievement in mathematics, the STEM group outperformed the
non-STEM group on the basis of observed and adjusted test scores for Objective 2:

48
Patterns, Relationships, and Algebraic Reasoning, Objective 3: Geometry and Spatial
Reasoning, and Objective 6: Mathematical Processes and Tools. The observed and
adjusted test scores for Objective 4: Concepts and Uses of Measurement showed no
statistically significant group differences. Although group differences on the basis of
observed test scores for Objective 1: Numbers, Operations, and Quantitative Reasoning
and Objective 5: Probability and Statistics were statistically significant, adjusted test
scores showed no statistically significant differences.
With respect to achievement in science, the STEM group outperformed the non-
STEM group on the basis of observed and adjusted test scores for Objective 1: Nature of
Science, Objective 2: Living Systems and the Environment, Objective 4: Motion,
Forces, and Energy, and Objective 5: Earth and Space Systems. Objective 3: Structures
and Properties of Matter showed no statistically significant differences between the two
groups on the basis of either the observed or the adjusted test scores.
With respect to achievement in reading, the STEM group outperformed the non-
STEM group on the basis of all observed and adjusted test scores for all objectives. The
objectives were Objective 1: Basic Understanding, Objective 2: Applying Knowledge
of Literary Elements, Objective 3: Using Strategies to Analyze, and Objective 4:
Applying Critical-Thinking Skills.
49
CHAPTER 5
SUMMARY, CONCLUSIONS, AND DISCUSSION
Introduction
"A world-class education is the single most important factor in determining not
just whether our kids can compete for the best jobs but whether America can out-compete
countries around the world. America's business leaders understand that when it comes to
education, we need to up our game. That's why we’re working together to put an
outstanding education within reach for every child."
-President Barack Obama, July 18, 2011
Prior to the 1940s, access to higher education was limited to affluent or
academically gifted students (Cohen & Kisker, 2010). The American G.I. Bill and the
launch of Sputnik by the Soviet Union were the impetus for identifying and educating the
most intellectually gifted Americans from all walks of life through investments in
science, technology, engineering, and mathematics (STEM) education. These
investments in education led to innovations which made scientific innovation
synonymous with the United States (NSB 07-114, 2007).
The great economic gains made in the United States from the early 1940s through
the 1970s have been attributed to educational gains in STEM fields, which contributed to
the creation of a middle class through American innovations impacting societal changes
(Young & Fusarelli, 2011).
Investment in education decreased significantly by the early 1980s, as America
experienced a double-dip recession. Current economic indicators suggest America is
experiencing the greatest economic downturn since the Great Depression based on the
50
duration and recovery rates of prior economic downturns (Young & Fusarelli, 2011).
The U.S. policies and world events have led to the current recession, with a slow
recovery beginning in late 2009, which has contributed to significant changes in
educational funding (Young & Fusarelli, 2011). Residential segregation by income has
resulted in greater disparity between public resources, such as schools and teachers,
available to affluent residential areas as compared to low and middle-income residential
areas (Reardon & Bischoff, 2011).
The gap between the affluent and the poor in the U.S. has widened and the
middle class is threatened as access to higher education, which President Lyndon Johnson
referred to as the great equalizer, becomes more expensive (Young & Fusarelli, 2012).
Technological advances and demographic changes, which have occurred at an
accelerated rate since the 1980s, are currently challenging America’s dominance in
STEM fields (Aud et al., 2012).
President Barak Obama described the American dream as defined by the dreams
of a strong middle class during campaign speeches throughout the summer of 2012. As
part of his speech in Pittsburg, Pennsylvania, the President described higher education as
an economic necessity rather than a luxury (The White House, 2012).
The decrease in academic achievement of U.S. students, particularly among
minority students, as measured by test scores on the Trends in International Mathematics
and Science Study (TIMSS) and standardized tests, has been a cause of great concern.
Measures such as NCLB, which was passed in 2001 and reauthorized in 2007, have been
used to assess student achievement and hold states, school districts, and individual
schools accountable for their results. In this study, it was hypothesized that the STEM

51
program was effective in increasing student achievement on mathematics, science, and
reading. The research questions guiding the study were:
1. What is the impact of the STEM program on mathematics achievement among
eighth grade students?
2. What is the impact of the STEM program on science achievement among eighth
grade students?
3. What is the impact of the STEM program on reading achievement among eighth
grade students?
Summary of Results
The characteristic-present group consisted of 73 eighth grade students in a STEM
academic program. The comparison group consisted of 103 eighth grade students in a
non-STEM academic program. Analysis of quantitative data revealed that there were
statistically significant differences between eighth grade students in a STEM academic
program and eighth grade students in a non-STEM academic program in mathematics,
science, and reading academic achievement, favoring the STEM sample.
The STEM group (M = 13.56, SD = .58) was slightly younger than the non-
STEM group (M = 13.90, SD = .69). The non-STEM group was almost equally
represented by both genders, female (49.50%, n = 51) and male (50.50%, n = 52). The
STEM group included more females (56.20%, n = 41) than males (43.80%, n = 32). The
majority of the students in the STEM program were Hispanic (90.40%, n = 66), followed
by white (5.50%, n = 4), and African American (4.1%, n = 3). The non-STEM group had
a similar distribution with Hispanics being the majority (89.30%, n = 92), followed by
African American (5.80%, n = 6), and White (4.90%, n = 5).
52
Achievement in mathematics was measured by the proportion of correct answers
to questions in each of the six objectives. A Multivariate Analysis of Variance
(MANOVA) showed that group differences on the basis of the centroids were statistically
significant, F(6, 169) = 4.61, p < .01. A post hoc analysis showed that with the exception
of Objective 4: Concepts and Uses of Measurement, all group differences were
statistically significant, favoring the STEM group.
Achievement in science was measured by the proportion of correct answers to
questions in each of the five objectives. The MANOVA showed that the group
differences on the basis of the centroids were statistically significant, F(5, 170) = 8.36, p
< .01, favoring the STEM group. A post hoc analysis showed that with the exception of
Objective 3: Structures and Properties of Matter, all group differences were statistically
significant in favor of the STEM group.
Achievement in reading was measured by the proportion of correct answers to
questions in each of the four objectives. The MANOVA showed that the group
differences on the basis of the centroids were statistically significant, F(4, 171) = 6.42, p
< .01. All group comparisons were statistically significant, favoring the STEM group.
In short, 1) the STEM group outperformed the non-STEM group on all
mathematics objectives with the exception of the concepts and uses of measurement
objective; 2) with the exception of the structures and properties of matter objective, the
STEM group outperformed the non-STEM group in all science objectives; and 3) the
STEM group outperformed the non-STEM group in all four reading objectives.

53
Conclusions
The reader is cautioned that due to the non-experimental nature of the study, no
causal inferences may be drawn. Based on the results, the study’s hypothesis was found
tenable. It was concluded that participation in a STEM academic program positively
impacted eighth grade students’ academic achievement in mathematics, science, and
reading.
Discussion
National and state efforts to improve student academic achievement have
incorporated various approaches. The purpose of NCLB was to increase the academic
achievement of all children and included negative financial consequences to schools and
districts which did not meet expectations. Grants providing funding for educational
programs such as STEM became available as efforts to identify approaches which could
positively impact student achievement intensified.
The use of project-based and hands-on learning, which is prevalent in STEM
programs, requires significant investments of time and training for both educators and
students. Improving academic achievement is critical for the nation as a whole, and
federal funding is tied directly to attainment of acceptable academic achievement levels.
Many research studies to validate STEM programs and their effectiveness have focused
on high school or higher education programs. The study was conducted because there
was a need to evaluate the effectiveness of a STEM program at a middle school level on
student achievement on standardized assessments.
Traditional training methods and the NCLB have come under greater scrutiny as it
becomes apparent that the academic achievement of most students will not meet federal
54
expectations. The main mandate of the NCLB, signed into law by former president
George W. Bush in 2002, stipulated that 100% of elementary and secondary students
would be proficient in mathematics and reading by 2014. In 2011, Secretary of
Education, Arne Duncan, projected that more than 80% of schools would be unable to
achieve 100% proficiency and would risk losing federal funding as a result. Mr. Duncan
speculated that many states would have a 90% failure rate based on NCLB testing
standards (Berry & Herrington, 2011).
Many states have submitted waivers for opting out of the NCLB and political
pressure is mounting to find new ways to hold states accountable for student
achievement. Some of the requirements of waivers include measuring accountability
standards by showing improvement in test scores by comparing year-to-year to show
improvement. Other measures of accountability emphasize college and career readiness
standards instead of the proficiency standards established through NCLB (Berry &
Herrington, 2011). Teacher preparation and performance standards tied to student
academic achievement are being carefully analyzed by many districts.
Technology has made monitoring and comparing student achievement between
countries, states, and individual districts possible in a timely basis. Reports such as The
Condition of Education use indicators including school characteristics, climate, finance,
assessments, student efforts, and persistence to measure student progress in the United
States of America (Aud et al., 2012). School administrators, teachers, financial
resources, and student assessments are used to evaluate progress through the education
system. Indicators of student achievement based on performance on assessments in
55
mathematics, reading, science, and other academic subject areas are used to examine the
context of learning in U.S. schools (Aud et al., 2012).
Finding ways to improve student achievement via programs such as STEM may
impact state and school district funding in numerous ways. In addition to funding issues
for the schools, the ability to provide an educated workforce is a key indicator in
attracting business investment in specific areas. Having an educated workforce includes
a higher tax base to fund further educational investment (Reardon & Bischoff, 2011).
Many states are attempting to identify ways to encourage institutions of higher
learning to encourage degrees in STEM fields. For example, California’s attempt to
identify the best and the brightest is reflected in the California State Summer School for
Mathematics and Science program (COSMOS), which began in 1998, and is currently
offered at four University of California campuses in Irvine, San Diego, Davis, and Santa
Cruz. The COSMOS is a summer program that attempts to identify and recruit highly
talented and motivated students within the state and expose them to STEM activities to
further their interests and skills in such fields. The students participate in hands-on labs
and field activities in addition to working on a research project and attending lectures and
discussions. The students work in groups, referred to as clusters, which vary from 18 to
24 students. The students attend courses taught by University of California faculty and
researchers with a typical staff to student ratio of 5:1. The Students can participate only
once due to the high demand for this program and financial assistance is available for
students who are unable to pay for the program (Goldstein, 2008).
The Texas Higher Education Agency is considering changing its funding model to
include merit-based funding linked to graduation rates and awarded degrees. The number
56
of degrees awarded in STEM fields and teachers in those subjects could impact 10% of
undergraduate funding. In a period of decreased funding in education, Texas is
attempting to increase funding linked to a business model based on outcomes that are
needed to fulfill the STEM skills demands of businesses (Meyers, 2012).
The STEM careers offering higher paying job opportunities attract an educated
workforce, which will support other businesses to meet the societal needs of communities
(Reardon & Bischoff, 2011). Encouraging students’ interest in these careers at the
middle school level is facilitated through STEM programs which helps them develop
skills which are critical for success in such fields (Reardon & Bischoff, 2011).
The goal of the study was to provide evidence that participation in a STEM
academic program positively impacts student achievement on state assessments in
mathematics, science, and reading. Reading was included in the study because it is
shown that it impacts student achievement in other content areas, particularly science and
mathematics. Poor performance in reading has been linked to lower academic progress in
school (Perie, Grigg, & Donahue, 2005). Part of the process of understanding and
learning to think mathematically is related to read mathematically, particularly
understanding reading passages in textbooks and standardized tests (Schoenfeld, 2008).
Science knowledge and reading skills were found to be significant predictors of science
achievement scores (O’Reilly & McNamara, 2007).
The study’s STEM group participated in grant-funded field trips that included
cooperative learning as students experienced hands-on applications of scientific and
mathematics knowledge gained in the classroom. For example, trips dedicated to the
acquisition, classification, and analysis of oceanic samples, as well as applying scientific

57
methods standards. Group learning, a greater number of hands-on experiments in the
classroom, interdisciplinary assignments (science and mathematics), and project-based
learning activities allow for a deeper understanding of science and mathematics concepts
for the STEM students. Many higher education engineering and science programs
require cooperative learning and project-based learning as part of their curriculum
(Smith, Sheppard, Johnson, & Johnson, 2005).
Challenging students to apply mathematics skills in group projects and
competitions is an integral part of STEM mathematics classes. Sandra S. Snyder, in her
study entitled, Cooperative Learning Groups in the Middle School Mathematics
Classroom, found that problem-solving and communication skills improve significantly
with the inclusion of cooperative learning groups. Her research found that cooperative
learning affected students’ attitudes toward mathematics and improved their oral and
written communication skills (Snyder, 2006). Students who participate in cooperative
learning acquire skills which will serve them well in higher education and as they enter
the workforce, particularly in STEM fields (Smith et al., 2005). The results of the study
demonstrated that the STEM students outperformed the non-STEM students in all
mathematics objectives with the exception of Objective 4: Concepts and Uses of
Measurement. Students in both groups had low achievement scores in Objective 4; the
STEM group had a mean score of .47, while the non-STEM group had a mean score of
.42. Could this suggest that “Concepts and Uses of Measurement” were not adequately
taught in either the STEM or the non-STEM classes? If so, contributing factors may
include teacher preparation, students’ lack of comfort with metric units of measurement

58
used in testing mathematics and science, length of exposure, and practice with concepts
and usages of measurement.
The STEM students outperformed the non-STEM students in all science
objectives with the exception of Objective 3: Structures and Properties of Matter.
The students in the STEM group had a mean score of .60, while the students in the non-
STEM group had a mean score of .57, and the effect size was small, .16. This objective
includes concepts that require abstract thinking. Developmental studies suggest that
abstract terms and thinking are not mastered until adolescence. While there is a
significant gain in abstract thinking for children by age 12, repeated exposure is required
by most students in order to understand such concepts (Caramelli, Setti, & Maurizzi,
2004). Repeated exposure to this objective’s concepts would be beneficial to all students.
The largest effect size, .90, was found in Objective 1: Nature of Science. The
STEM group had a mean score of .79, while the non-STEM group had a mean score of
.63. The large effect size is reflected in the large difference in achievement between the
two groups for this objective. The hands-on activities, cooperative learning, and project-
based learning, which the STEM students were exposed to, may have contributed to their
greater understanding of the nature of science.
With respect to reading objectives, all group comparisons were statistically
significant, favoring the STEM group. The ability to read and analyze questions is
critical to student’s academic achievement. The smallest effect size, .59, was for
Objective 2: Applying Knowledge of Literary Elements. The STEM group had a mean
score of .88, while the non-STEM group had a mean score of .79. The largest effect
size, .74, was for Objective 3: Using Strategies to Analyze. The STEM group had a

59
mean score of .90, while the non-STEM group had a mean score of .77. The non-STEM
group had a higher number of special education students who might have been unable to
read at an eighth grade level. The STEM students were exposed to more activities
requiring analysis and interpretation of data than did the non-STEM group which might
have contributed to their higher Objective 3 scores.
The MANOVA and MANCOVA results were similar with two exceptions. After
adjusting the mathematics achievement scores on the basis of age and education, in
addition to Objective 4: Concepts and Uses of Measurement, differences between the
STEM and non-STEM groups on the basis of Objective 1: Numbers, Operations, and
Quantitative Reasoning and Objective 5: Probability and Statistics were not statistically
significant. The lack of statistical significance could have been due to similar difficulties
encountered by both groups in applying higher level mathematics concepts to questions
addressing these objectives. The ability to successfully apply quantitative reasoning and
problem-solving techniques involving probability and statistics requires repeated
exposure and practice for many students. Research by Lisa Kasmer and Ok-Kyeong
Kim has shown that prediction has the potential to enhance mathematics understanding
and reasoning in a middle school context. Students who were exposed to prediction
questions on a daily basis were found to have improved mathematical understanding and
reasoning skills (Kasmer & Kim, 2011). Exposing eighth grade students to prediction
questions on a consistent basis would be beneficial for both groups.
Implications
The jobs of the future, which will allow the middle class and all Americans to
prosper, are concentrated in fields that involve STEM skills. According to the U.S.

60
Bureau of National Statistics, STEM fields provided occupations which allowed workers
to earn about 70% more than the national average in 2005 (Terrell, 2007). In May 2009,
data from the Occupational Employment Statistics program showed that only 4 out of the
97 STEM occupations had mean wages below the U.S. average. The average annual
wage for all STEM occupations based was $77,880, compared to the U.S. average of
$43,460 (Cower, Jones, & Watson, 2011). American students who are unprepared to
meet the criteria required for STEM occupations will be unable to compete for those
high-paying jobs at home and abroad.
Finding ways to increase student achievement to meet the educational
requirements of STEM careers is crucial for continuing America’s standing as a leader in
such fields. Programs which increase interest in STEM courses in middle school,
including project-based and hands-on learning, influence the recruitment and retention of
students in high-level science and mathematics courses in high school. High school
graduates who participate in rigorous college preparatory courses are more likely to
succeed in completing STEM coursework in higher education (Stein & Matthews, 2009).
If American students are unprepared to meet the demands of employers providing STEM
careers, highly qualified applicants from other countries will be ready to fill the void.
Approximately 90% of the students included in the study were Hispanic, and
there were no significant gender gaps in either the STEM or the non-STEM group. In the
United States, African-Americans, Hispanics, and women are seriously underrepresented
in STEM fields. Participation in high growth, high wage positions projected for future
jobs require STEM skills and training which must be encouraged, particularly among
minority groups, in order for the U.S. to meet employer needs with local labor forces.

61
Recommendations for Further Research
Incorporating a qualitative component into future research studies may provide
teacher and student perspectives regarding the pros and cons of participating in a STEM
program. Identifying successful teaching techniques could provide information
regarding characteristics of highly successful teachers. Student perspectives could
provide insight into what motivates and challenges them in an academic setting.
Decreased state and federal funding increases the benefit of obtaining grant funding such
as those offered for STEM curriculum and related staff. A longitudinal study to track
progress of students who participated in a STEM academic program in middle school
through high school and higher education programs could provide valuable feedback for
obtaining grant funding. Including an analysis of STEM graduates and the number of
remedial courses they required may provide useful information for curriculum
development at secondary and higher education levels.
Identifying and developing techniques which improve academic achievement,
especially among Hispanic students, could provide useful information. Determining how
programs, such as STEM, which engage students through hands-on learning may
improve academic achievement among students with deficient reading skills may lead to
curriculum changes. Qualitative research investigating cultural beliefs and value systems
among Hispanics may provide insight into why STEM fields attract such limited numbers
of Latino students.
Characteristics of highly effective PBL teachers could be identified through
studies in order to create guidelines for teacher development, particularly for those
dealing with minority and at-risk students. Effective STEM programs employ PBL

62
techniques which must be mastered by teachers in order to maximize student learning
opportunities. Districts must capitalize on grant funding available for research and
training involving PBL strategies aimed at improving academic achievement and
developing STEM skills among all students. Research investigating how non-traditional
teaching strategies such as PBL impact minorities can provide justification for the
investment of time and resources required to successfully implement programs to prepare
students for success in a knowledge-based economy.

63
REFERENCES
Aud, S., Hussar, W., Johnson, F., Kena, G., Roth, E., Manning, E., Wang, X., &
Zhang, J. (2012). The Condition of Education 2012. (NCES 2012-045).
Washington, DC: U.S. Department of Education, National Center for Education
Statistics.
Aud, S., Hussar, W., Planty, M, & Snyder, T. (2010). The Condition of Education 2010.
(NCES 2010-028). Washington, DC: U.S. Department of Education, National
Center for Education Statistics.
Avery, S., Chambliss, D., Truiett, R., & Stotts, J. L. (2010). Texas Science,
Technology, Engineering, and Mathematics Academies (pp. 1-40):
Texas High School Project: Austin, TX.
Baseya, J. M., & Francis, C. D. (2011). Design of inquiry-oriented science labs:
Impacts on students’ attitudes. Research in Science & Technological Education,
29(3), 241-255.
Berry, K. S., & Herrington, C. D. (2011). States and their struggles with NCLB:
Does the Obama blueprint get it right? Peabody Journal of Education, 86(3),
272-290.
Bicknell-Holmes, T., & Hoffman, P. S. (2000). Elicit, engage, experience, and explore:
Discovery learning in library instruction. Reference Services Review, 28(4),
313-322.
Brookings Institution. (2010). State of metropolitan America on the front lines of
demographic transformation. Washington, DC: The Brookings Institution
Metropolitan Policy Program.
64
Bruner, J. (1963). The Process of Education. Cambridge, MA: Harvard University
Press.
Campbell, J. R., Hombo, C. M., & Mazzeo, J. (2000). NAEP 1999 trends in academic
progress: Three decades of student performance. (NCES 2000-469).
Washington, DC: U.S. Department of Education, National Center for Education
Statistics.
Caramelli, N., Setti, A., & Maurizzi, D. D. (2004). Concrete and abstract concepts in
school age children. Psychology of Language and Communication, 8(2), 17-32.
Castronova, J. (2002). Discovery learning for the 21st century: What is it and how does
it compare to traditional learning effectiveness in the 21st century? Action
Research Exchange, 1(1). Valdosta, GA: Valdosta State University,
Department of Curriculum & Instructional Technology.
Cohen, J. (1988). Statistical power analysis for the social sciences. Hillsdale, NJ:
Lawrence Earlbaum Associates.
Cohen, A. M., & Kisker, C. B. (2010). The shaping of American higher education:
Emergence and growth of the contemporary system. San Francisco, CA:
Jossey-Bass.
Cower, B., Jones, J. I., & Watson, A. (2011, May). Science, technology, engineering,
and mathematics (STEM) occupations: A visual essay. Monthly Labor Review,
3-15.
Museus, S., Palmer, R., Davis, R., & Maramba, D. (2011). Racial and ethnic minority
success in STEM education. ASHE Higher Education Report, 36(6),
27-52.
65
Field, A. (2009). Discovering statistics using SPSS. Los Angeles, CA: Sage.
Flory, S. L., Ingram, E. L., Heidinger, B. J., & Tintjer, T. (2005). Hands-on in the
non-laboratory classroom. The American Biology Teacher, 67(9), 542-547.
Fontenot, D., Chandler, J. R., Talkmitt, S., & Sullivan, K. (2007). The Texas High
School Initiative aims at STEM education reform: Texas Tech University
T-STEM Center – putting the “E” in k-12 STEM education. Paper presented
at the 37th ASEE/IEEE Frontiers in Education Conference, Milwaukee, WI.
Fortus, D., Krajcik, J., Dershimer, R., Marx, R., & Mamlok-Naaman, R. (2005). Design-
based science and real world problem-solving. International Journal of Science
Education, 27(7), 855-879.
Fry, R. (2007). The changing racial and ethnic composition of U.S. public schools.
Washington, DC: Pew Hispanic Center.
Fry, R., & Gonzales, F. (2008). One-in-five and growing fast: A profile of Hispanic
public school students. Washington, DC: Pew Hispanic Center.
Fusarelli, L. D. (2011). School reform in a vacuum: Demographic change, social policy,
and the future of children. Peabody Journal of Education, 86(3), 215-35.
Gall, M. D., Gall, J. P., & Borg, W. R. (2007). Educational research: An introduction
(8th ed.). White Plains, NY: Longman.
Gammon, M. (2011). Next generation learning challenges seeks promising technology
tools that can help U.S. students get ready for college. Seattle, WA: Bill &
Melinda Gates Foundation.
66
Gardner, D. P., & Larsen, Y. W. (1983). A nation at risk: The imperative for educational
reform. Washington, DC: Department of Education, National Commission on
Excellence in Education.
Goldstein, D. (2008). The evaluation of COSMOS (2000-2008): Developing future
scientists, engineers, and mathematicians. Berkeley, CA: University of
California, Center for Research Evaluation and Assessment.
Gonzales, P., Williams, T., Jocelyn, L., Roey, S., Kastberg, D., & Brenwald, S. (2008).
Highlights from TIMSS 2007: Mathematics and science achievement of U.S.
fourth and eighth grade students in an international context. (NCES 2009-001).
Washington, DC: U.S. Department of Education, National Center for Education
Statistics.
Goodnough, K. (2006). Enhancing pedagogical content knowledge through self-study:
An exploration of problems-based learning. Teaching in Higher Education,
11(3), 301-318.
Gordon, R., Kane, T. J., & Staiger, D. O. (2006). Identifying effective teachers using
performance on the job. Washington, DC: The Brookings Institution.
Greene, J. P., Ph.D., & Winters, M. (2005). Public high school graduation and college-
readiness rates: 1991-2002. Washington, DC: U.S. Department of Education.
Heppner, F. H., Kouttab, K. R., & Croasdale, W. (2006, September). Inquiry: Does
it favor the prepared mind? American Biology Teacher, 390-392.
Hill, D. (2004, October). The mathematics pathway for all children. Teaching Children
Mathematics, 11(3), 127-133.
67
Houtenville, A. J., & Conway, K. S. (2008). Parental effort, school resources, and
student achievement. Journal of Human Resources, 43(2), 437-453.
Kane, T. J., & Cantrell, S. (2009). Initial findings from the measures of effective teaching
(MET) project. Seattle, WA: Bill & Melinda Gates Foundation.
Kasmer, L., & Kim, O. (2011). Using prediction to promote mathematical understanding
and reasoning. School Science & Mathematics, 111(1), 20-33.
Kuenzi, J. J. (2008). Science, technology, engineering, and mathematics (STEM)
education: Background, federal policy, and legislative action. (RL33434).
Washington, DC: National Council for Science and the Environment.
Luera, G., Killu, K., & O’Hagen, J. (2003). Linking math, science, and inquiry-based
learning: An example from a mini-unit on volume. School Science and
Mathematics, 103(4), 194-207.
Mathis, W. J. (2011). International test scores, educational policy, and the American
Dream. ENCOUNTER: Education for Meaning and Social Justice, 24(1), 31-33.
Meltzoff, J. (2008). Critical thinking about research: Psychology and related fields.
Washington, DC: American Psychological Association.
Memory, D. M., Yoder, C. Y., Bolinger, K. B., & Wilson, J. W. (2004, July/August).
Creating thinking and inquiry tasks that reflect the concerns and interests of
of adolescents. The Social Studies, 147-154.
Meyers, R. (2012, August 2). Higher Education Agency: New funding model may be
merit-based. Corpus Christi Caller Times, pp. 1A, 7A

68
Nathan, M. J., Tran, N. A., Atwood, A. P., and Phelps, L. A. (2010). Beliefs
and expectations about engineering preparation exhibited by high school STEM
teachers. Journal of Engineering Education, 99(4), 409-426.
National Council of Teachers of Mathematics. (2000). Principles and standards for
school mathematics. Reston, VA: National Council of Teachers of Mathematics.
National Research Council. (1996). National Science Education Standards.
Washington, DC: National Academy Press.
National Research Council. (2000). Inquiry and the National Science Education
Standards: A Guide for Teaching and Learning. Washington, D.C.: National
Academy Press.
National Science Board. (2007). A national action plan for addressing the critical needs
of the U.S. science, technology, engineering, and mathematics education system.
(NSB-07-114). Arlington, VA: National Science Foundation.
National Science Board. (2010). Preparing the next generation of STEM innovators:
Identifying and developing our nation’s capitol. (NSB-10-33). Arlington, VA:
National Science Foundation.
National Science Board. (2012). Science and Engineering Indicators 2012.
(NSB-12-01). Arlington, VA: National Science Foundation.
O’Reilly, T., & McNamara, D. S. (2007). The impact of science knowledge, reading
skill, and reading strategy knowledge on more traditional “high stakes” measures
of high school students’ science achievement. American Educational Research
Journal, 44, 161-196.

69
Patton, M. Q. (2002). Qualitative research and evaluation methods. Thousand Oaks,
CA: Sage.
Perie, M., Grigg, W. S., & Donahue, P. L. (2005). The nation’s report card: Reading
2005. (NCES 2006-451). Washington, DC: U.S. Department of Education
National Center for Education Statistics.
Pey-Yan, L., Desjardins, C., & Lawrenz, F. (2010). Influence of Scholarships on STEM
Teachers: Cluster Analysis and Characteristics. School Science & Mathematics,
110(3), 128-143. doi:10.1111/j.1949-8594.2010.00016.x
Ravitz, J. (2010). Beyond changing culture in small high schools: Reform models and
changing instruction with project-based learning. Peabody Journal of Education,
85(3), 290-312.
Reardon, S. F., & Bischoff, K. (2011). Income inequality and income segregation.
American Journal of Sociology, 116(4), 1092-1153
Reigle-Crumb, C., & Callahan, R. M. (2009). Exploring the academic benefits of
friendship ties for Latino boys and girls. Social Science Quarterly, 90(3),
611-631.
Reigle-Crumb, C., Moore, C., & Ramos-Wada, A. (2011). Who wants to have a career
in science or math? Exploring adolescents’ future aspirations by gender and
race/ethnicity. Science Education, 95(3), 458-476.
Schoenfeld, A. H. (Ed.). (2008). A study of teaching: Multiple lenses, multiple views.
Journal for Research in Mathematics, Education Monograph No. 14, 45-96.
Reston, VA: National Council of Teachers of Mathematics.
70
Smith, K. A., Sheppard, S. D., Johnson, D. W., & Johnson, R. T. (2005). Pedagogies
of engagement: Classroom-based practices. Journal of Engineering Education,
94(1), 87-102.
Snyder, S. S. (2006). Cooperative learning groups in the middle-school mathematics
classroom. Action Research Projects. Paper 30. Retrieved from
http://digitalcommons.unl.edu/mathmidactionresearch/30
Stevens, J. P. (2009). Applied multivariate statistics for the social sciences. New York,
NY: Routhledge.
Stine, D. D., & Matthews, C. M. (2009). The U.S. science and technology workforce.
Washington, DC: Congressional Research Service.
SRI International. (2011). Evaluation of the Texas High School Project: Third
Comprehensive Annual Report Executive Summary. (P18092). Menlo Park, CA:
SRI International Center for Education Policy.
TEA. (2009-2010). Academic Excellence Indicator System. Austin, TX: Texas
Education Agency.
TEA. (2010). Technical Digest. Austin, TX: Texas Education Agency.
Terrell, N. (2007, Spring). STEM occupation. Occupational Outlook Quarterly, 26-33.
Retrieved from http://www.bls.gov/opub/ooq/2007/spring/art04.pdf
The Inquiry Synthesis Project. (2006). Technical report 2: Conceptualizing inquiry
science instruction. Washington, DC: Center for Science Education, Education
Development Center, Inc. (EDC).
71
The White House, Office of the Press Secretary. (2012). Taking out Stafford Loans
to help pay for college? Thanks to young people all over the country who
made their voices heard, interest rates on student loans will not double
this summer (Press release). Retrieved from
http://www.whitehouse.gov/dontdouble-my-rates.
Tracy, D. M. (2003). Linking math, science, and inquiry-based learning: An example
from a mini-unit on volume. School Science & Mathematics, 103(4), 94-108.
Tsupros, N., Kohler, R., & Hallinen, J. (2009). STEM education: A project to identify
the missing components, Intermediate Unit 1 and Carnegie Mellon, Pennsylvania.
Warde, W. F., & Novak, G. (1960). John Dewey’s theories of education. International
Socialist Review, 21(1), 1-12.
Young, T. V., & Fusarelli, B. C. (2011). The politics of education and equity in
turbulent times: An introduction. Peabody Journal of Education, 86(3), 211-214.

72
APPENDICES
APPENDIX A: IRB Approval Letter
APPENDIX B: Outside Research Evaluation and Approval Form
APPENDIX C: Campus Approval Form

73
APPENDIX A
IRB Approval Letter

74
APPENDIX B
Outside Research Evaluation and Approval Form
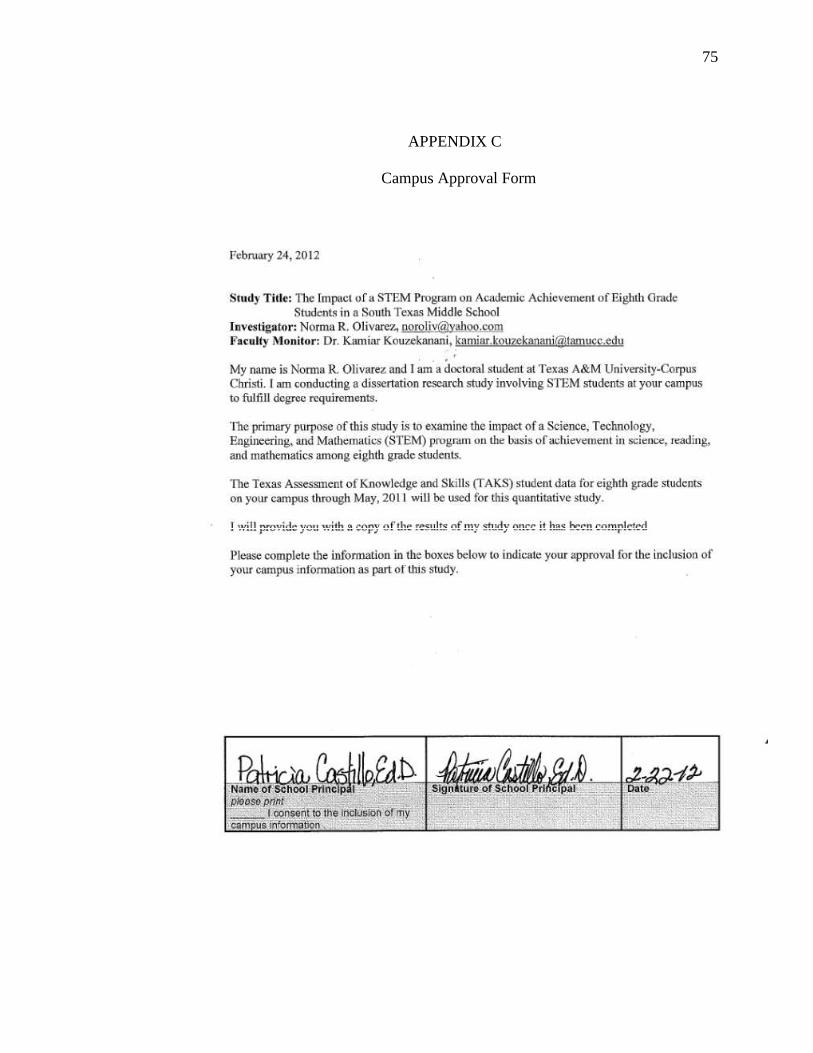
75
APPENDIX C
Campus Approval Form