the illinois tollway’s use of composite concrete pavements
TRANSCRIPT

The Illinois Tollway’s Use of Composite Concrete Pavements with Greener
Concrete for Improved Sustainability
Steve Gillen. Illinois Tollway / Deputy Program Manager of Materials
Arizona Pavements / Materials Conference November 13, 2013

Overview: About the Illinois Tollway
2
286-mile system comprised of four tollways
Opened in 1958 as a bypass around Chicago to connect Indiana and Wisconsin
Carries more than 1.4 million vehicles per day
Largest open road tolling system in the nation
User-fee system – no state or federal gas tax dollars

Move Illinois Program
3
TAKE CARE OF EXISTING SYSTEM
NEEDS
ILLINOIS ROUTE 53/120 EXTENSION
JANE ADDAMS MEMORIAL TOLLWAY
$2.2 billion
ELGIN O’HARE WESTERN ACCESS
$3.4 billion
I-294/I-57 INTERCHANGE $719 million
ILLIANA EXPRESSWAY

Jane Addams Memorial Tollway (I-90)
4
Rebuilding and widening I-90 as a 21st century, state-of-the-art corridor linking Rockford to O'Hare International Airport
62 miles of roadway improvements
$2.2 billion budget includes $240 million to integrate transit in the corridor today, as well as future transit expansion plans

Implementing New Design Elements
5
“100-year” bridges
High-performance concrete decks
Stainless steel rebar
Jointless
120,000 pound load capacity to roads and bridges

Utilizing Recycled Materials
6
It starts from the bottom up
Existing aggregate subbases recycled
Subgrade undercuts eliminated
Old concrete recycled as new porous base
Old asphalt recycled for many applications

Innovative Pavement Designs
7
To provide long-lasting, smooth surface to customers…
Life Cycle Cost Assessment
2-Lift concrete pavement with asphalt shoulders
Incorporates various green initiatives

Pavement Type Selection Report Card
West Rockford – IL-47
Center IL-47 to Randall
East Randall to O’Hare
2-Lift Composite Jointed Concrete 3.16 B 3.21 B 3.02 B
Continuously Reinforced Concrete 3.00 B 3.00 B 2.99 B-
Full Depth Asphalt 3.02 B 3.03 B 2.83 B-
Composite Asphalt/Jointed Concrete 2.43 C+ 2.42 C+ 2.38 C+
Composite Asphalt/Cont. Reinforced 2.34 C+ 2.36 C+ 2.34 C+

Two Lift Concrete Paving- A Forgotten Practice
9
Popular back in the 50’s, 60’s and 70’s when the
Tollway was originally built
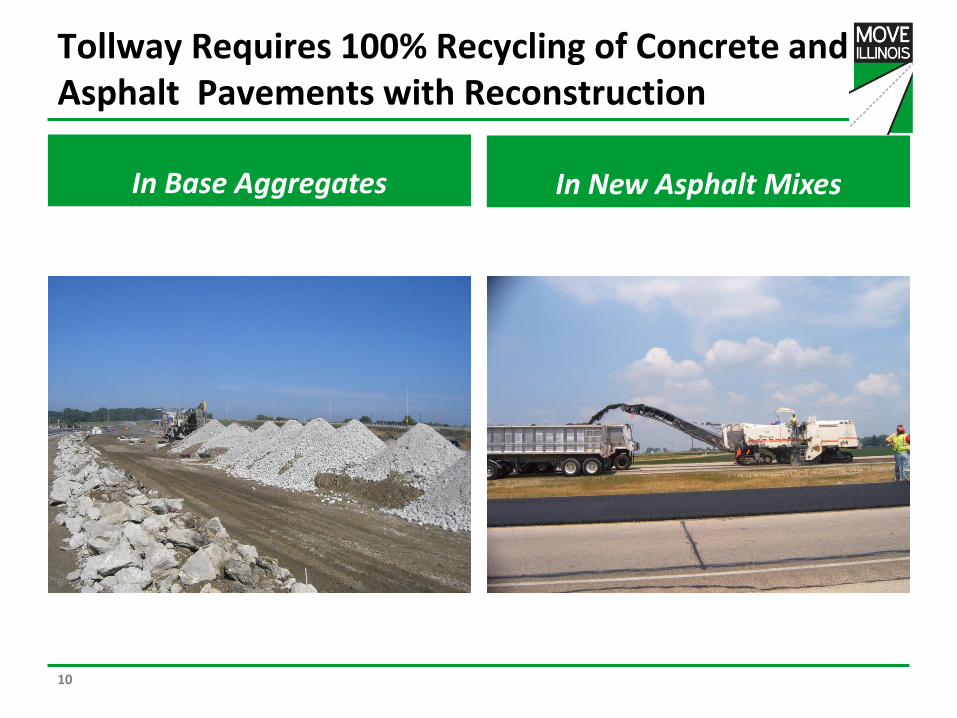
Tollway Requires 100% Recycling of Concrete and Asphalt Pavements with Reconstruction
In Base Aggregates In New Asphalt Mixes
10
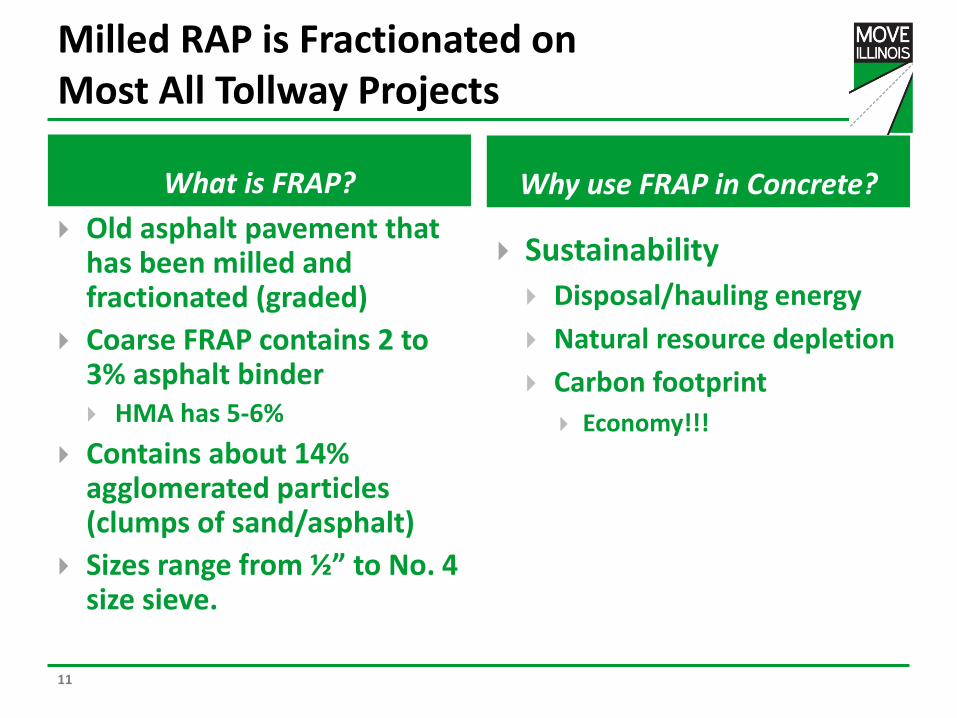
Milled RAP is Fractionated on Most All Tollway Projects
What is FRAP? Why use FRAP in Concrete?
11
Old asphalt pavement that has been milled and fractionated (graded)
Coarse FRAP contains 2 to 3% asphalt binder HMA has 5-6%
Contains about 14% agglomerated particles (clumps of sand/asphalt)
Sizes range from ½” to No. 4 size sieve.
Sustainability
Disposal/hauling energy
Natural resource depletion
Carbon footprint
Economy!!!

Plenty of Coarse FRAP Left Over for Concrete
12
• Fine FRAP (<#4 sieve) used by the Tollway as a liquid binder replacement in new asphalt mixes with reclaimed asphalt shingles (RAS)
• Large stockpiles of coarse FRAP remain unused and take up space

Making Concrete Greener and Ultimately Cheaper For Both Lifts
13
Replace Virgin
Aggregate with
Recycled
Replace portland cement
with SCM’s
Optimize
gradation and
reduce cement
content

“Green Concrete” Quandry
Concrete today is made primarily with virgin materials.
Portland cement manufacturing creates 1 ton of CO2 for every ton of cement produced.
Move Illinois:
Be the “cleanest and greenest” program in history

“Black Rock” in Concrete
Coarse portion of fractionated RAP
Minus ½-inch and plus #4
Austria – standard practice in lower lift
US Trial: Florida
Tollway Trial: Milwaukee Avenue ramp - 2010

Composite Pavement Field Trials Initiated in 2010 With SHRP 2 R21 Team’s Help
16
Asphalt-over-concrete composite ramps built
Specifications for bottom lift concrete placement and for mix designs based on SHRP R21’s MN Road Project

I-294 Ramp first composite pavement
Two HMA/JPC sections of I-94 ramps north of Chicago
Constructed 2010 using 30% RAP & 20% fly ash in PCC, high quality WMA surface layer, & saw & seal joint over doweled JPC

“Black Rock” in Concrete Concerns
Higher dust in RAP – washing RAP?
“Agglomerated particles” – sand-asphalt pieces
Lower Strengths
Freeze-Thaw Durability

Black Rock Ternary Mixes Researched at The University of Illinois
19
Phase I study focused on the physical properties and performance of black rock ternary concrete mixes
Phase II study focused on the fracture properties and structural capacity of two lift pavements with recycled aggregates in the bottom lifts
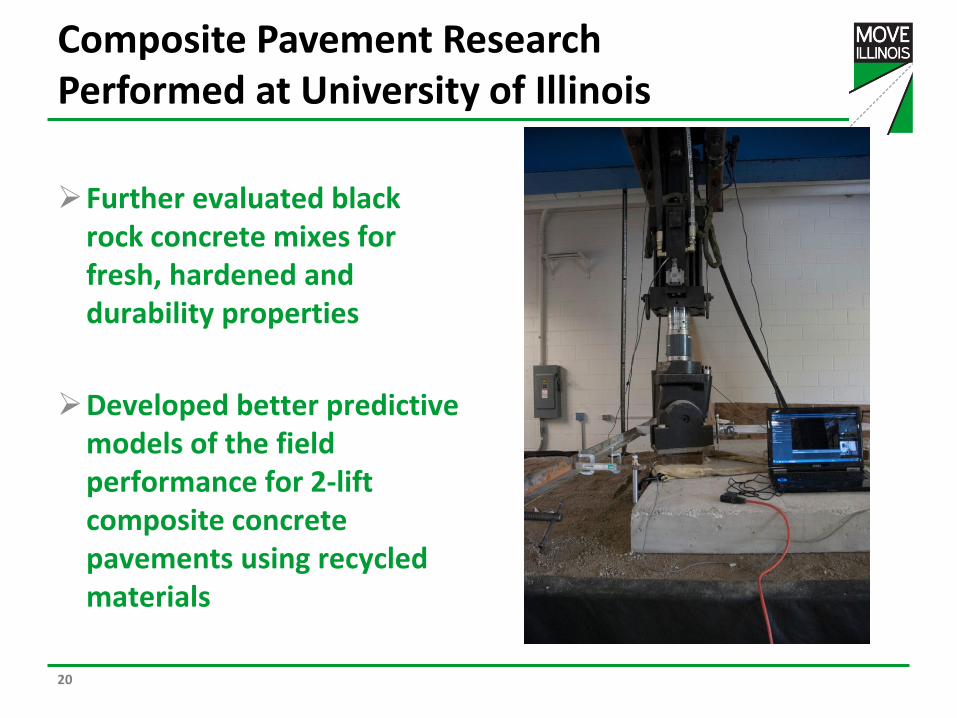
Composite Pavement Research Performed at University of Illinois
20
Further evaluated black rock concrete mixes for fresh, hardened and durability properties
Developed better predictive models of the field performance for 2-lift composite concrete pavements using recycled materials

Research Mix Designs
21
Material Virgin Mix
45% FRAP
100% RCA
45-55% FRAP-RCA
Total Cementitious 610.0 610.0 610.0 610.0
Cement 55% 335.5 335.5 335.5 335.5
Slag 35% 213.5 213.5 213.5 213.5
Type C Fly Ash 10% 61.0 61.0 61.0 61.0
Total Coarse Aggregate (SSD) 1867.9 1822.3 1696.2 1724.9
CA-11 Virgin Coarse Agg. 1307.5 1002.3 0.0 0.0
CA-16 Virgin Coarse Agg. 560.4 0.0 0.0 0.0
FRAP 0.0 820.0 0.0 776.2
RCA 0.0 0.0 1696.2 948.7
Virgin Fine Aggregate (SSD) 1216.9 1216.9 1216.9 1216.9
Water w/cm = 0.37 226.4 226.4 226.4 226.4

Compressive Strength
0
500
1000
1500
2000
2500
3000
3500
4000
4500
5000
5500
7 14 28
Co
mp
res
siv
e S
tre
ng
th (
ps
i)
0% FRAP
20% FRAP
35% FRAP
50% FRAP
25% Slag and 10% Fly Ash

Flexural Strength
0
100
200
300
400
500
600
700
800
900
14 28
Fle
xu
ral S
tre
ng
th (
ps
i)
0%
20%
35%
50%
25% Slag and 10% Fly Ash

Is Washing the FRAP Necessary? • “Dirty” FRAP compared to washed FRAP
• Four mix types: 1. Control (0%)
2. Dirty FRAP (20%, 35%, and 50%)
3. Washed Dirty FRAP (20%, 35%, and 50%)
• Fines (past #4) removed by washing
4. Sieved Dirty FRAP (20%, 35%, and 50%)
• Fines (past #4) removed by dry sieving
• Tested for compressive and split tensile strength at 7, 14, and 28 days

Compressive Strength – 28 Days
0
500
1000
1500
2000
2500
3000
3500
4000
4500
5000
5500
6000
0% 10% 20% 30% 40% 50%
28-D
ay C
om
pre
ss
ive
Str
en
gth
(p
si)
Percentage of Coarse FRAP
Dirty FRAP
Sieved Dirty FRAP
Washed Dirty FRAP

Phase I Research Conclusions
FRAP can used up to 50% to meet strength requirements for paving concrete
Compressive: 3500 psi at 14 days
Flexural: 650 psi at 14 days
Additional processing of the dirty FRAP does not appear beneficial
Concrete strength / modulus decreases as FRAP content increases, impacting cure times
Restrained shrinkage is slightly greater for control (0% RAP) mix
Chloride penetration is relatively unaffected

Phase II Research Conclusions
27
Slab capacity is not accurately predicted by the beam flexural strength!
Supports previous findings by other researchers.
Load capacity is under-predicted by a factor of 1.5 to 2.7.
Attributed to geometric / material size effect.
Despite a significant reduction in concrete beam / cylinder strengths, concrete with recycled aggregates can have similar slab flexural load capacities compared to virgin aggregate concrete.
We don’t need to increase the slab thickness for FRAP concrete!

Research Developed Materials Specifications
28
Requirements for bottom lift concrete as currently specified:
Optimized gradations
15% to 50% coarse FRAP (Black Rock)
0% to 85% coarse RCA allowed
Ternary mixes (35% to 50%) required
Blended cements allowed

Specifications For Composite Pavements
29
Materials Top lift concrete designs either standard Class PV mix, or
optimized ternary performance based mix with virgin aggregate. Only optimized mixes after 2014.
Bottom lift concrete designs only with optimized ternary performance based mixes with black rock aggregate
Curing Opened to construction traffic at a min. flexural strength of
450 psi and 2,850 psi compressive strength no earlier than 3 or 4 days age for light trucks (< 20,000 single axle load) and no earlier than 4 or 5 days for heavy loaded trucks depending on FRAP content.
Opened to public traffic at 650 psi flexural strength and 3,500 psi compressive strength, typically obtained in 7 to 14 days.

Placed 0.7 Mile Trial Reconstruction and Widening Project on I-88 in 2012

Composite Pavement Designs Fully Implemented for I-90 Construction in 2013
31

LCCA’s Determine JPCP to be the Choice
32

Total Traffic and Truck Traffic Are Different
0
20,000
40,000
60,000
80,000
100,000
120,000
140,000
160,000
180,000
200,000
0 5 10 15 20 25 30 35 40 45 50 55 60 65 70 75 80
Ve
hic
le C
ou
nt
Milepost
Average Daily Traffic
Average Daily Truck Traffic
IL 5
3
Hig
gin
s
Ran
dal
l Rd
.
IL 4
7
I-3
9

Truck Counts Split In 3 Segments
0
2,000
4,000
6,000
8,000
10,000
12,000
14,000
16,000
0 5 10 15 20 25 30 35 40 45 50 55 60 65 70 75 80
Tru
ck C
ou
nt
Milepost
IL 5
3
Hig
gin
s
Ran
dal
l Rd
.
IL 4
7
I-3
9
Design
Design
Design

Major Traffic Inputs for Pavement Design
Lane Distribution
Traffic Volume
Load Spectra
3-Lane 4-Lane
National 60%
Tollway 70%
National 45%
Tollway 70%

Design Trucks – Load Distributions
34kip 12kip 34kip
Current Load Limits 40kip 12kip 40kip
40kip 12kip 60kip
Proposed Load Limits
Proposed Load Limits

Tollway Axle Weight Distribution Does Not Follow National Data
0
2
4
6
8
10
12
14
16
18
0 5,000 10,000 15,000 20,000 25,000 30,000 35,000 40,000 45,000 50,000
Pe
rce
nt
of
Axl
es
Weight of Tandem Axle Group (lb)
MEPDG
Tollway
Tandem Axle – Class 9

Understanding bonding is key
Latice Model (PCC/PCC Debonding)
R-21 work coupled lattice models with finite element models
Analysis concluded wet on wet paving had only very low chance if any to debond, matching field surveys & bond testing.

I-90 Concrete Pavement Design Details
15’ Slab length
1’ Widened slab
Doweled Joints (1 ½” dia.)
18” of base
Topping Concrete
High-recycled Content Concrete
WMA Base
Aggregate Cap
Porous Aggregate
Compacted Recycled Subbase

Summary of I-90 Reconstruction - 2013
40
Test strips constructed for all types of placements (single and double lane)

Summary of I-90 Reconstruction - 2013
41
Two slip form pavers / two belt placers for double lane placements only

Summary of I-90 Reconstruction - 2013
42
One slip form paver / two belt placers for double lane and single lane placements

Summary of I-90 Reconstruction - 2013
43
Two slip form pavers / one belt placer for double lane placements only

Summary of I-90 Reconstruction - 2013
44
One slip form paver / one belt placer for single lane placements only

Summary of I-90 Reconstruction - 2013
45
Envelope outside edges of bottom lifts

Summary of I-90 Reconstruction - 2013
46
Finishing / curing / opening to traffic

Summary of I-90 Reconstruction - 2013
47
MIT Scan device to measure dowel bar alignment used as a QA tool in 2013

Summary of I-90 Reconstruction - 2013
48
Consolidation monitored with thickness cores

Typical Black Rock Mix Design Used in 2013
49
Typical Proportions:
Lbs/Cu Yd
Cement 375
Class C Fly Ash 145
Slag Cement 60
Coarse Aggregate* 1575
Black Rock 273
Natural Sand 1196
* - IDOT CM-11 Crushed Stone (~ AASHTO #6 Stone)

Summary of Flexural Strength Data Received on 2013 Ternary Black Rock Mixes
50

Summary of Compressive Strength Data Received on 2013 Ternary Black Rock Mixes
51

Bid Prices for 2013 and 2014 Composite Pavement Construction
52
Bid prices for 2013 construction of 11.25” JPC composite (637,429 Sq. Yds. – 5 contracts)
$40.30 / Sq. Yd. average of all bids (24 total)
$38.43 / Sq. Yd. average of all low bidders (5)
Bid prices for 2014 construction of 11.25” JPC composite (685,243 Sq. Yd. – 5 contracts)
$40.42 / Sq. Yd. average of all bids (15 total)
$38.15 / Sq. Yd. average of all low bidders (5)

Extra Costs Are Not An Issue With Composite Pavements
53
Approximately 1,188,086 Sq. Yds. of 12” JPCP Placed on I-294 and I-88 Reconstruction / Widening Projects
Average Low Bid Price = $56.37 / SY

Lessons Learned From 2013 Placements
54
Cure times can be reduced with low FRAP %
Two slip form pavers are not to be mandated with black rock mixes
Adequate spacing and time between paving operations is important
MIT Scanning can be time consuming
Two concrete plants must be required
Two lift paving is not at a higher cost
Don’t use limited resources for recycled agg.
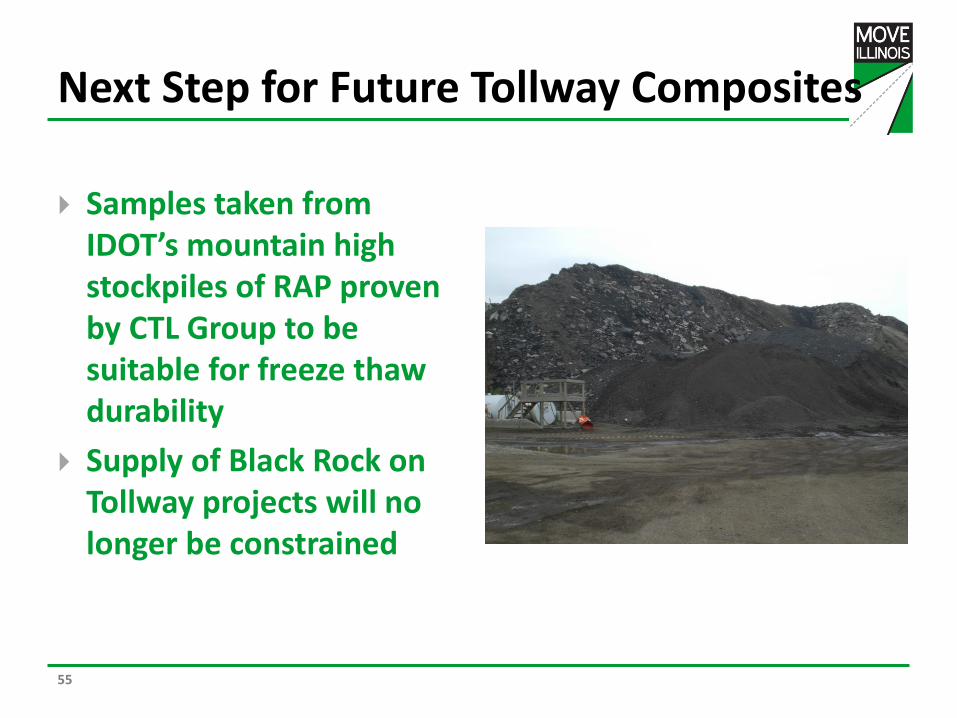
Next Step for Future Tollway Composites
55
Samples taken from IDOT’s mountain high stockpiles of RAP proven by CTL Group to be suitable for freeze thaw durability
Supply of Black Rock on Tollway projects will no longer be constrained

FRAP and B Quality Ternary Mixes
56
ASTM C192 Mixture Summary
B1 B2 Frap A Frap B Frap C
Material lb/yd3 (SSD)
Cement 370 370 370 370 370
Fly Ash 85 85 85 85 85
Slag 115 115 115 115 115
Coarse Aggregate 1880 1916 647 637 640
Coarse Aggregate 0 0 1240 1240 1240
Fine Aggregate 1190 1190 1190 1190 1190
Water 238 238 228 228 228
w/cm 0.42 0.42 0.40 0.40 0.40
fl. oz./cwt (100 lbs of cementitous material)
Air Entraining Agent 1.41 1.02 1.02 1.02 1.02
Water Reducer 4.00 4.00 4.00 4.00 4.00
Measured Fresh Properties
Slump, in. 0.75 2.25 1.5 2.5 2.25
Air Content, % 6.5% 8.0% 7.0% 8.5% 8.0%
Temperature, °F 72.8 71.2 72.3 73.7 73.8
Fresh Density, lb/ft3 145.0 143.6 144.3 141.3 142.8
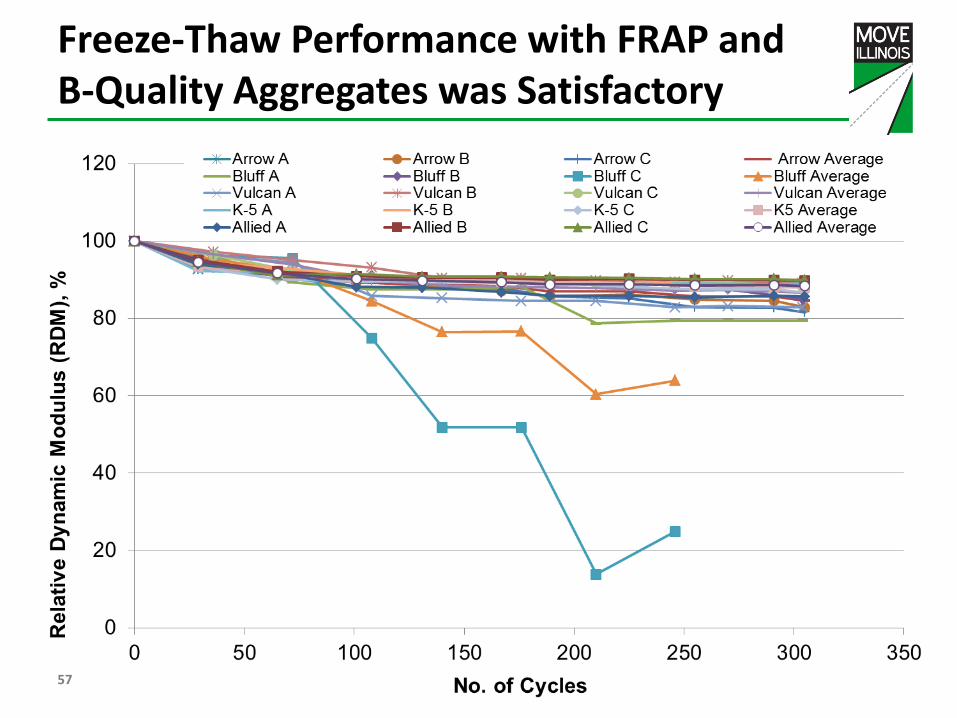
Freeze-Thaw Performance with FRAP and B-Quality Aggregates was Satisfactory
57

Current Research For Future Pavements
58
Use of aged/oxidized steel slag FRAP in bottom lift
Use of carbonate waste fines (screenings) in bottom lift

THANK YOU
59