the hepi-hea 2015 student academic experience survey …€¦ · satisfaction the uk higher...
TRANSCRIPT
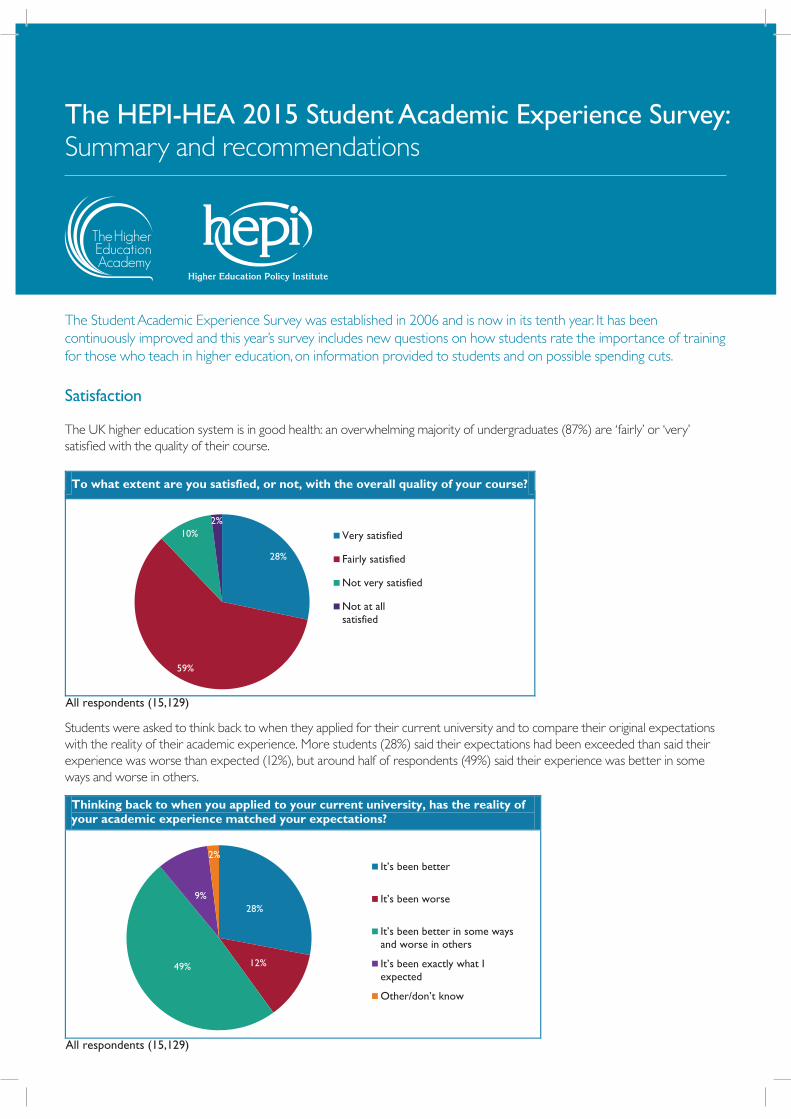
Satisfaction
The UK higher education system is in good health: an overwhelming majority of undergraduates (87%) are ‘fairly’ or ‘very’ satisfied with the quality of their course.
Students were asked to think back to when they applied for their current university and to compare their original expectations with the reality of their academic experience. More students (28%) said their expectations had been exceeded than said their experience was worse than expected (12%), but around half of respondents (49%) said their experience was better in some ways and worse in others.
The HEPI-HEA 2015 Student Academic Experience Survey:
Summary and recommendations
The Student Academic Experience Survey was established in 2006 and is now in its tenth year. It has been continuously improved and this year’s survey includes new questions on how students rate the importance of training for those who teach in higher education, on information provided to students and on possible spending cuts.
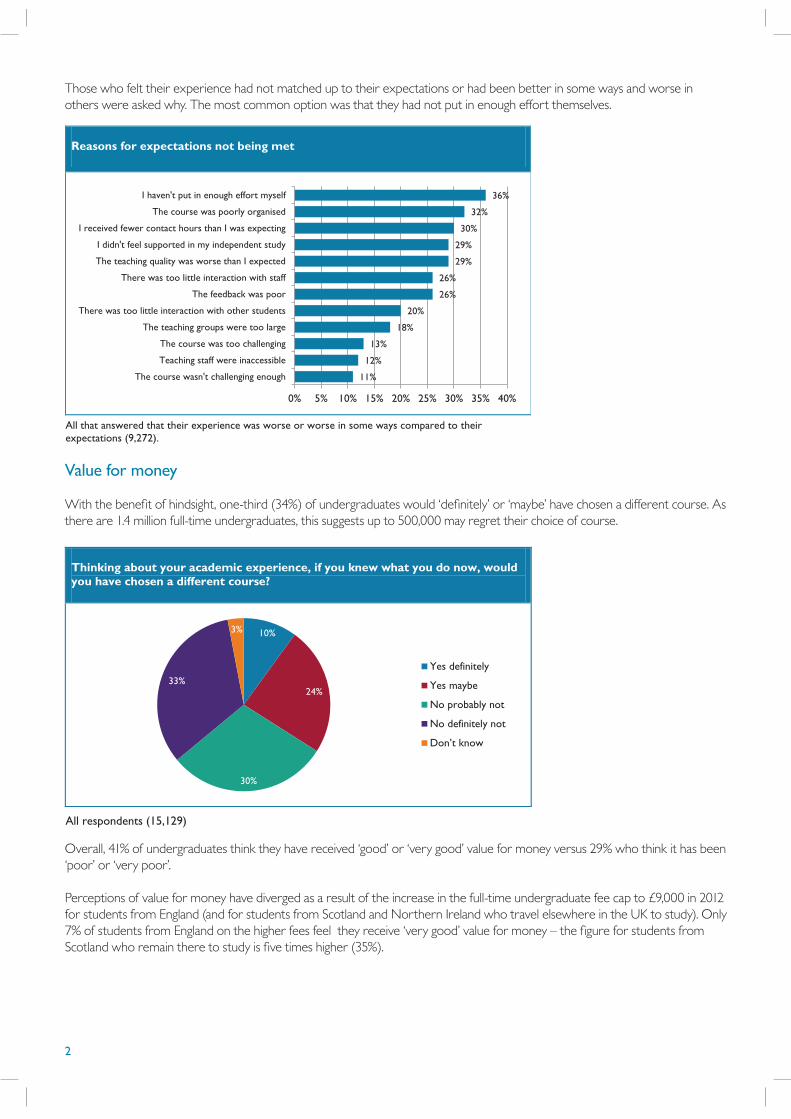
Those who felt their experience had not matched up to their expectations or had been better in some ways and worse in others were asked why. The most common option was that they had not put in enough effort themselves.
Value for money
With the benefit of hindsight, one-third (34%) of undergraduates would ‘definitely’ or ‘maybe’ have chosen a different course. As there are 1.4 million full-time undergraduates, this suggests up to 500,000 may regret their choice of course.
Overall, 41% of undergraduates think they have received ‘good’ or ‘very good’ value for money versus 29% who think it has been ‘poor’ or ‘very poor’.
Perceptions of value for money have diverged as a result of the increase in the full-time undergraduate fee cap to £9,000 in 2012 for students from England (and for students from Scotland and Northern Ireland who travel elsewhere in the UK to study). Only 7% of students from England on the higher fees feel they receive ‘very good’ value for money – the figure for students from Scotland who remain there to study is five times higher (35%).
2
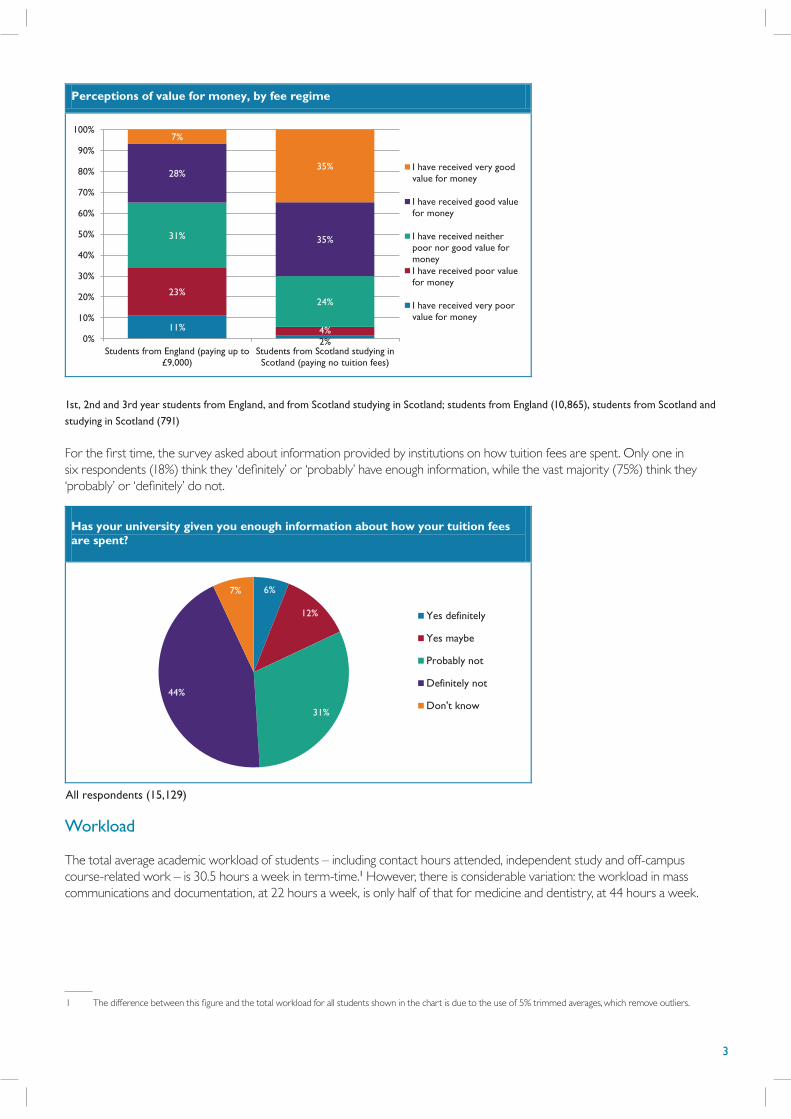
1st, 2nd and 3rd year students from England, and from Scotland studying in Scotland; students from England (10,865), students from Scotland and
studying in Scotland (791)
For the first time, the survey asked about information provided by institutions on how tuition fees are spent. Only one in six respondents (18%) think they ‘definitely’ or ‘probably’ have enough information, while the vast majority (75%) think they ‘probably’ or ‘definitely’ do not.
Workload
The total average academic workload of students – including contact hours attended, independent study and off-campus course-related work – is 30.5 hours a week in term-time.1 However, there is considerable variation: the workload in mass communications and documentation, at 22 hours a week, is only half of that for medicine and dentistry, at 44 hours a week.
1 The difference between this figure and the total workload for all students shown in the chart is due to the use of 5% trimmed averages, which remove outliers.
3

Time spent in differently-sized classes also varies markedly by subject. Students with more contact hours typically spend a higher proportion of them in larger classes.
Class size is an incomplete metric for judging the quality of teaching and learning, but students place less value on larger classes – particularly classes of more than 50 people.
4

Teaching and learning
For the first time, the questionnaire asked students to rank the importance of three different characteristics of the people who teach them. The priorities for students are staff having received training in how to teach and the possession of professional or industry expertise, with 39% and 44% of students respectively saying they are of primary importance. Being an active researcher is a lower priority, with over half of students (54%) ranking it third. Where teaching benefits from being research-informed and research-led, the benefits may not always be clear to students.
Another new question asked about assignments that contribute to a student’s final qualification (known as summative assessment) and assignments designed to help them improve (formative assessment). The latter are a key measure of course quality. On average, students complete 4.1 summative assessments per term/semester compared to 1.6 formative assessments. For example in humanities and social sciences, the number of summative assessments generally outweighs the number of formative assessments but the reverse is the case at some institutions.
5

Wellbeing
The survey includes questions from the Office for National Statistics (ONS) on wellbeing, with respondents plotting their answers on a scale from zero to ten. Compared to the data for the whole population, students appear less satisfied, less likely to regard their lives as worthwhile and less happy.
The higher the workload, the higher the levels of wellbeing. Only 43% of students who spend fewer than 10 hours a week on their studies believe the things they do in life are worthwhile, compared with 78% of those who undertake academic work for more than 50 hours.
6
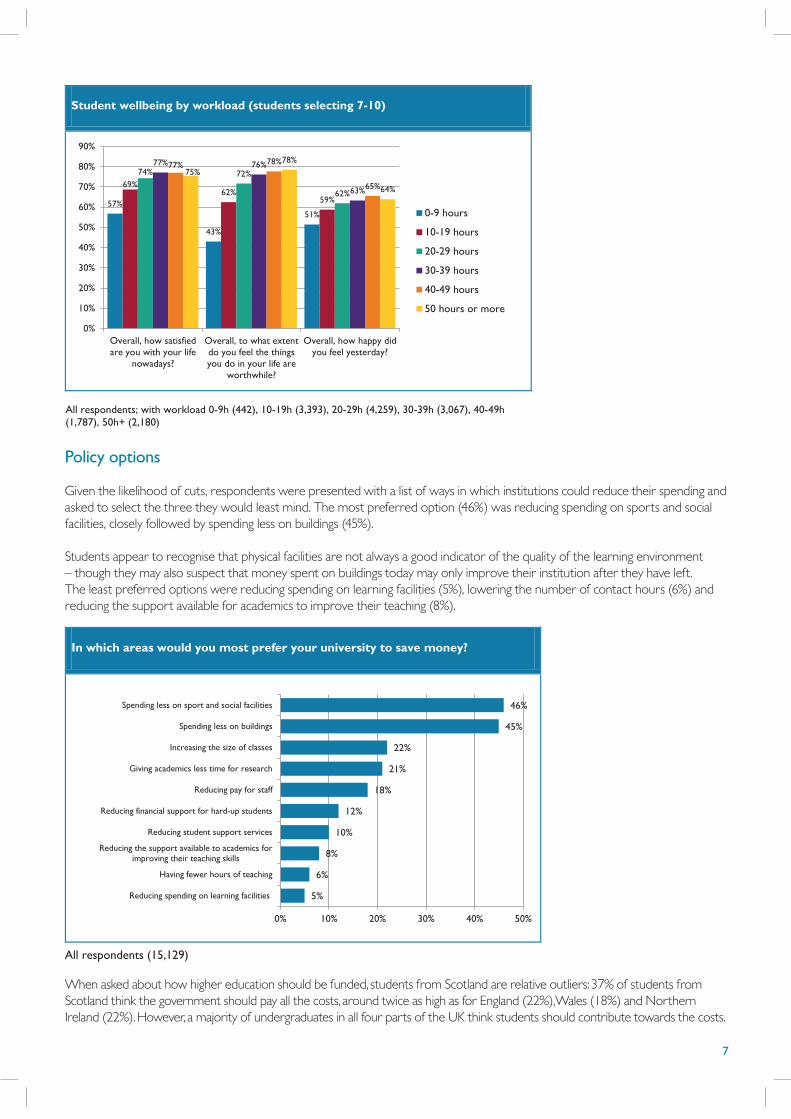
Policy options
Given the likelihood of cuts, respondents were presented with a list of ways in which institutions could reduce their spending and asked to select the three they would least mind. The most preferred option (46%) was reducing spending on sports and social facilities, closely followed by spending less on buildings (45%).
Students appear to recognise that physical facilities are not always a good indicator of the quality of the learning environment – though they may also suspect that money spent on buildings today may only improve their institution after they have left. The least preferred options were reducing spending on learning facilities (5%), lowering the number of contact hours (6%) and reducing the support available for academics to improve their teaching (8%).
When asked about how higher education should be funded, students from Scotland are relative outliers: 37% of students from Scotland think the government should pay all the costs, around twice as high as for England (22%), Wales (18%) and Northern Ireland (22%). However, a majority of undergraduates in all four parts of the UK think students should contribute towards the costs.
7

To request copies of this report in large print or in a different format, please contact the communications office at the Higher Education Academy: 01904 717500 or [email protected].
HEPI Company number 4503712, registered charity number 1099645. The full data is available at www.hepi.ac.uk.
Contact us
The Higher Education Academy and its logo are registered trademarks and should not be used without our permission.
The Higher Education Academy. Company limited by guarantee registered in England and Wales no. 04931031. Registered as a charity in England and Wales no. 1101607. Registered as a charity in Scotland no. SC043946.
Policy recommendations
The 2015 HEPI-HEA Academic Experience Survey shows an overwhelming majority of undergraduates are satisfied with their course, but beneath the positive headline statistics are some tricky issues that need to be addressed. The following policies would be a positive response to the issues highlighted in the survey.
1. Providing better information on how tuition fees are spent by institutions is coming to seem an inevitable consequence of relying so heavily on student loans and, without rapid sector-led progress, it may be forced on institutions by policymakers.
2. Students spend more time studying independently than in the classroom but many students feel they have not put in enough effort themselves, so greater attention needs to be paid by higher education institutions to supporting self-directed work.
3. The demand from students for academics who are trained in how to teach suggests this should be given priority by institutions and that it should be incorporated within a revamped Key Information Set.
4. Where teaching benefits from being research-informed or research-led, the benefits need to be clearly communicated to students.5. The lower self-reported wellbeing among students compared to the rest of the population suggests a need to improve student
support services, including counselling, even in challenging financial times.6. Any future cuts to spending on higher education should recognise that students want positive teaching and learning
environments and appear to be less concerned about sports and social facilities and new buildings.
The removal of student controls in England from 2015/16 could see more students in total and a greater number of first-in-family students. Ensuring they receive a good all-round student experience requires an unstinting focus on teaching and learning but also better information and supportive student services, which may prove challenging in a more constrained funding environment.
Methodology
The 15,129 respondents to the Student Academic Experience Survey were full-time undergraduates drawn from YouthSight’s Student Panel, which is made up of around 72,000 students recruited through a partnership with UCAS. The fieldwork was completed between 16 February and 24 March 2015. Weighting has been applied to the responses to ensure the sample is balanced and reflective of the full-time student population as a whole. Further information is available at www.hepi.ac.uk or www.heacademy.ac.uk.