the heimburger plots
TRANSCRIPT

The Heimburger Plots:The Heimburger Plots:7+ Decades of Forest Soil Research in the 7+ Decades of Forest Soil Research in the
Adirondack MountainsAdirondack Mountains
J B diJames Bedison
University of PennsylvaniaDepartment of Earth & Environmental Science
Northeastern Soil Monitoring Cooperative Workshop

The Heimburger Plots
Where and what they arey(and aren’t)
What’s been done
What we’ve learned

Where and what they are (and aren’t)(and aren t)

The “Heimburger Plots”

F t T Cl ifi ti
The “Heimburger Plots”
Forest Type Classifications
Spruce-Fir (1074 m)Abies balsamea, Picea rubens, Betula papyrifera, elevations ≥ 900 m
Northern Hardwood (581m) Acer saccharum, Betula alleghaniensis,Acer saccharum, Betula alleghaniensis, Fagus grandifolia, elevations <800 m
Pine (433 m)Pinus strobus, Pinus resinosa,well-drained outwash sands

An Adirondack Catena
1%
46%
107412%
1074m
581m
433m

The “Heimburger Plots”

What the Heimburger Plots aren’t
Randomly distributed
Managed (with the exception of the Newcomb sites)
Representative of “wet” soils

Wh ’ B D ?What’s Been Done?

Genesis of a Legacy
1984Sally Andersen
1930-1932Carl C. Heimburger
2006
Long-term changes (1930-32 to 1984)in the acid-base status of forest soils
in the Adirondacks of New York
Forest Type Studies inThe Adirondack Region
Decadal-scale comparisons ofVegetation and soil propertiesIn forests of the Adirondack
Mountains, NYMountains, NY

Previous Work
1933 1988 2009

Publication ListSoilsSoilsBedison, J.E. and A.H. Johnson. 2010. 74 years of Ca loss from forest soils of the Adirondack Mountains,
NY. Soil Sci. Soc. Am. J. in press.
B di J E A H J h d S A Willi 2010 A i f il i i 1932Bedison, J.E., A.H. Johnson., and S.A. Willig. 2010. A comparison of soil organic matter content in 1932, 1984 and 2005/6 in forests of the Adirondack Mountains, NY. Soil Sci. Soc. Am. J. 74:658-662.
Bedison, J.E. and A.H. Johnson. 2009. Controls on the spatial pattern of carbon and nitrogen storage in Adirondack forest soils along a gradient of nitrogen deposition. Soil Sci. Soc. Am. J. 73:2105-2117.d o dac o est so s a o g a g ad e t o t oge depos t o . So Sc . Soc. . J. 73: 05 7.
Johnson, A. H., A. Moyer, J. E. Bedison, S. L. Richter, S. A. Willig, and M. Boyer. 2008. Seven decades of calcium depletion in organic horizons of Adirondack forest soils. Soil Sci. Soc. Am. J. 72:1824-1830.
Johnson, A.H., S.B. Andersen, and T.G. Siccama. 1994. Acid rain and soils of the Adirondacks I. Changes
Ecology
J , , , gin pH and available calcium, 1930-1984. Can. J. For. Res. 24:39-45.
EcologyBedison, J.E. and B.E. McNeil. 2009. Is the growth of temperate forest trees enhanced along a nitrogen
deposition gradient? Ecology 90:1736-1742.
Bedison, J.E., A.H. Johnson, S.A. Willig, S.L. Richter, and A. Moyer. 2007. Two decades of change in vegetation in Adirondack spruce-fir, northern hardwood and pine-dominated forests. J. Torrey Bot. Soc. 134: 238-252.
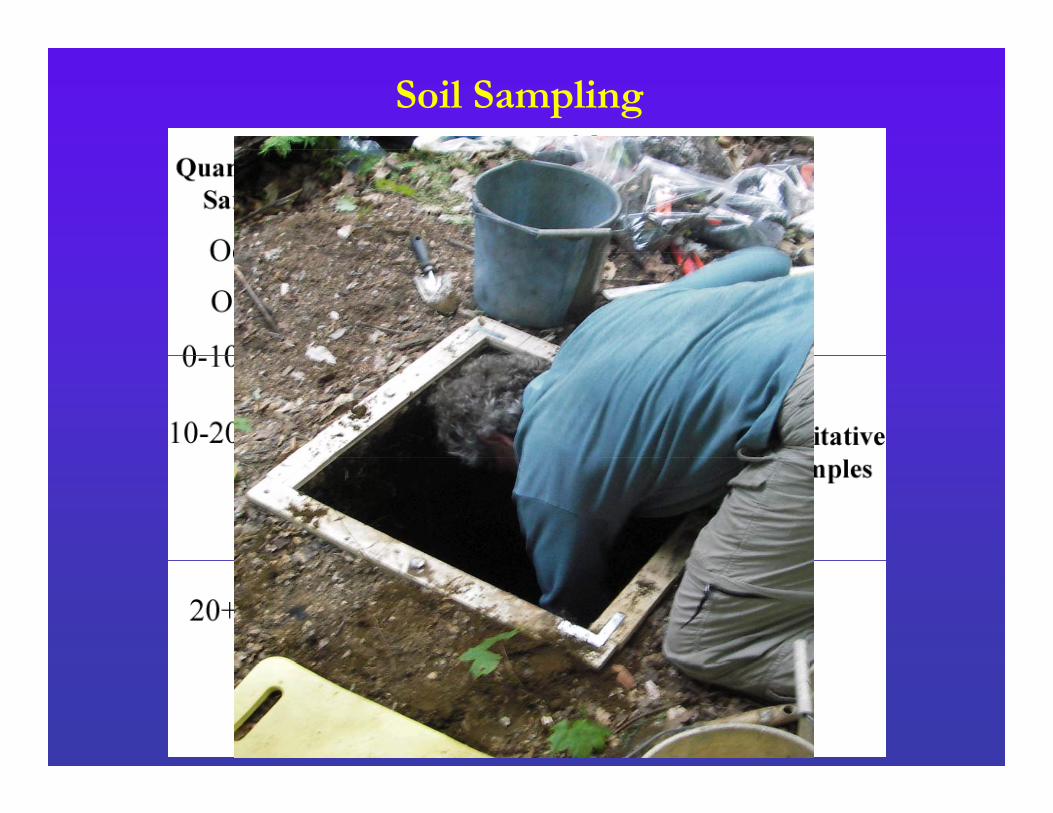
Soil Sampling

What we’ve learnedWhat we ve learnedi. Soil Caii Soil Nii. Soil Niii. SOM/C

Soil CaHas the loss of Ca from the soil continued since 1984, or have soil Ca pools stabilized or even increased since 1984 in light ofsoil Ca pools stabilized or even increased since 1984 in light of reductions in acidic deposition over the past few decades in forests of the Adirondack Mountains?

Percentile
Soil Ca content change
Horizon n Year Mean 25 Median 75
kg Ca ha-1
Percentile
1932 a 993.5 427.6 763.6 1402.6
1984 b 431.8 136.2 238.7 473.1
2005/6 c 209.6 84.5 163.3 292.3
51Total Organic†
1932 a 409.8 110.3 324.6 574.3
1984 a 267.9 38.0 79.2 326.9
2005/6 b 175.6 46.9 107.7 233.8
540-10 cm b
1932 a 310.1 34.8 166.5 486.0
1984 a 289.5 49.8 116.0 314.55410-20 cm
2005/6 b 144.9 30.4 70.3 212.5
1932 a 1948.2 1200.2 1575.8 2490.7
1984 b 1450.9 497.1 865.8 1499.9Whole-Profile‡ 54
2005/6 c 891.9 265.7 571.1 1226.8†Total organic = Oe + Oa‡Whole-profile = total organic + total mineral

20+ cm mineral soil Ca content changeg
(or lack thereof)
Horizon n Year Mean 25 Median 75
Percentile
kg Ca ha-1
1932 a 301.7 0.0 62.4 372.7
1984 485 7 21 6 175 7 657 05420+ cm 1984 a 485.7 21.6 175.7 657.0
2005/6 a 373.4 15.4 151.2 447.5
5420+ cm
†Total organic = Oe + OaTotal organic Oe Oa‡Whole-profile = total organic + total mineral

Mineral soil Ca concentration
Horizon Units Year Mean 25 Median 75
Percentile
1932 a 47.9 3.9 26.7 56.21984 b 19.4 3.7 9.3 24.0
2005/6 c 10 1 3 5 8 1 13 4cmolc kg-1OM
2005/6 c 10.1 3.5 8.1 13.4
1932 a 2.6 0.8 1.5 3.61984 a 2.1 0.4 0.9 2.5
2005/6 b 1.4 0.3 0.9 1.8
0-20 cm
cmolc kg-1soil2005/6 b 1.4 0.3 0.9 1.8
1932 a 27.1 0.0 7.1 36.21984 a 32.8 3.4 14.6 45.2
2005/6 21 8 1 4 11 0 34 7cmolc kg-1OM
2005/6 a 21.8 1.4 11.0 34.7
1932 a 1.6 0.0 1.1 2.61984 a 2.3 0.3 1.4 2.7
2005/6 a 1 6 0 2 0 9 2 5
20+ cm
cmolc kg-1soil2005/6 a 1.6 0.2 0.9 2.5

Soil CaConclusions
1. Ca decreased in organic and upper-mineral horizons during the 74-year interval (1932 to 2005/6) and has continued since 1984
2 Ch h b i il fi d h2. Changes have been primarily confined to the upper horizons and have changed little below 20 cm

Soil NIs there a measurable influence of
N deposition on soil N pools?

Soil N
R2 = 0.29 R 0 88
N
R 0.29P ≤ 0.05
R = 0.88P < 0.0001
rest
Flo
or %
NFo
r
Modified from, Lovett and Rueth, 1999 Modified from, McNulty et al., 1991
Range = 4-11 kg ha-1yr-1 Range = 3-5.5 kg ha-1yr-1

Soil N2 yr
-1) 3.0
3.5 N depositionep
ositi
on (g
m- 2
2.0
2.5
West-to-East Gradient
tmos
pher
ic N
de
1.0
1.5
Elevation (m)
0 600 800 1000 1200 1400
At
0.0
0.5
Data from Miller 1993 Elevation (m)
Elevation GradientData from Miller 1993
Courtesy of B.E. McNeil

Soil N
Total N dep estimates
Total McNeil et al., 2007 wet N dep
p
N depositionestimates
, p
Miller, 1993 scaling factor
N deposition rates = 3.8 to 31 kg N ha-1y-1
Over 50 years:190 to 1550 kg N ha-1 (mean = 460 kg N ha-1)190 to 1550 kg N ha (mean = 460 kg N ha )

Soil NNot enough N in deposition to have a measurable influence on soil N pools
200050 yrs of N deposition, estimated Total-Profile N content
1000
1200 50 years of N deposition (g m-2)Total Forest Floor N content
ent (
g/m
2 ) 1500
g m
-2) 800
1000
Nitr
ogen
con
te
500
1000
N C
onte
nt (g
400
600
0
500
0
200
NH P SFNH P SF

Soil NMultivariate Regression Tree analysis
Soil Stratum GSDD† MAP‡ N deposition
% silt + clay
Conifer Importance Total§
Variable
p y p
Organic N Content 58 – 9 – 2 69
% SS¶ explained
g
Mineral N Content 50 8 – 6 – 64
i d d† Growing season degree-days‡ Mean annual precipitation§ Represents the total sums of squares explained for each tree¶ Sums of squares¶ Sums of squares

Soil NConclusions
1. Growing Season Degree-Days (GSDD), appears to be the dominant influence on forest soil N storage
2. The contribution of atmospheric N deposition to soil N l i llN pools is small
**Even in organic horizons of SF soils where N dep rates are the highest (~30 kg N ha-1yr-1)are the highest ( 30 kg N ha yr )

SOM/CIs there evidence for an increase in SOM content
between 1932 and 2006?

Soil organic matter/carbon change over time
Latty et al 2004Latty et al. 2004
Hooker and Compton 2003

Soil Organic Matter Content (Mg/ha)Horizon 1932 1984 2005/6
Oe† 27.1 a 37.9 a 22.2 b Oa‡ 71.5 a 70.1 a 63.8 a Total Organic‡ 105.7 a 113.5 a 88.3 b 0-10 cm† 60.0 b 73.6 a 70.1 ab 10-20 cm† 58.1 b 80.6 a 67.6 ab 20+ cm† 34.0 a 61.6 a 68.5 aTotal Mineral§ 170.0 b 216.9 a 218.1 a Whole-Profile† 322.7 a 374.3 a 321.8 a†Wilcoxon signed-ranks test on untransformed data ‡t-test on log transformed data §t test on untrasformed data§t-test on untrasformed data
Little evidence of change over time

SOM/CChanges by Forest type
1 )
1000Northern Hardwood PineNewcomb Spruce-Fir
rofil
ete
r (M
g ha
-1
600
800a
a
a a aa
ab a
Who
le-p
ror
gani
c m
att
200
400
a aa a
a b
soil
o
0
200
1932 1984 2005/6 1932 1984 2005/6 1932 1984 2005/6 1932 1984 2005/6
Sampling Year

Sites with an agricultural or fire historyn = 16
600
n 16
SOM accumulation rate ~ 1Mg ha-1yr-1ha
-1) 500
600
aa b
prof
ileco
nten
t (M
g
300
400b
Who
le-p
rgan
ic m
atte
r
200
300
Soil
or
100
Sampling Year
01932 1984 2005/6

SOM/CConclusions
1. Measurements of the SOM content in Adirondack forest soils over 7 decades suggested that overall, the soils of hi i h d b l i k f C d i h 20 hthis region had not been a large sink for C during the 20th
century.
2. There was, however, evidence of a trend toward increased whole-profile SOM content between 1932 and 2005/6 in pplots with an agricultural and/or fire history
*The rates of C increase were similar to rates determined for similar conditions in other forests in New England.

Conclusions– overall
Soil CaHas continued to decrease in organic and upper mineral g pphorizons, but not deeper in the profile
Soil NSoil NDespite the strong gradient of N deposition and large amount of N deposited over the past ~50 yrs, the influence of N deposition on soil N pools is small
SOM/soil CSOM/soil COverall, there has been little change since the early1930’s. However, in plots with evidence of past ag./fire, SOM h i d iSOM has increased over time

Relevant Lessonsd·sampling methodology– keep it consistent
·sample amount– you can never have too much·start an archive– know what you have and keep it organized

Acknowledgements
Lab HelpMarty DranoffP l B
HelpGomaa OmarJ B illi
Art JohnsonSally Willig
Fi ld H l
Paul BattoneDavid Vann
Joan BuccilliEd DohenyE&ES Grad Students
y gBrenden McNeil
Field HelpJess EarhardtKristen Schu
E&ES Grad StudentsE&ES Faculty
Kristen Schu‘Tomahawk’ Johnson‘Big JC’ Clark
The Andrew W. Mellon Foundation
Minocher DadachanjiBill GarthwaiteAndrea DeVitoAndrea DeVitoMomSuzie Richter


Mineral soil Ca concentration
Horizon Units Year Mean 25 Median 75
Percentile
1932 a 47.9 3.9 26.7 56.21984 b 19.4 3.7 9.3 24.0
2005/6 c 10.1 3.5 8.1 13.40 20
cmolc kg-1OM
1932 a 2.6 0.8 1.5 3.61984 a 2.1 0.4 0.9 2.5
2005/6 b 1.4 0.3 0.9 1.8
0-20 cm
cmolc kg-1soil
1932 a 27.1 0.0 7.1 36.21984 a 32.8 3.4 14.6 45.2
2005/6 a 21.8 1.4 11.0 34.7cmolc kg-1OM
1932 a 1.6 0.0 1.1 2.61984 a 2.3 0.3 1.4 2.7
2005/6 a 1.6 0.2 0.9 2.5
20+ cm
cmolc kg-1soil

Influences on FF N content MRT analysis of FF (Oe + Oa) N content

A Quantitative View
50 years of N deposition and Forest Floor N Storage
1200 50 years of N deposition (g m-2)
800
1000
50 years of N deposition (g m )Total Forest Floor N content
Con
tent
(g m
-2)
600
800
N
200
400
NH
0
P SF

What about the highest N deposition plots?
N deposition1 1
1200 R2 = 0.36P = 0.04
9.8 to 31 kg N ha-1yr-1
% SS†
i ‡
SF
% SS†
SF
t (g
m- 2
)
600
800
1000
Organic GSDD‡ 60
Mineral GSDD 43
† Sums of squares explained
Organic N deposition 79
Mineral GSDD‡ 43
† Sums of squares explained
N c
onte
n
200
400
600
† Sums of squares explained‡ Growing season degree-days† Sums of squares explained‡ Growing season degree-days
Inorganic wet N deposition (g N m-2y-1)
0.0 0.5 1.0 1.5 2.0 2.5 3.0 3.500

) 800
1000
1200
Correlated VariablesForest Floor
N C
onte
nt (g
m-2
)
400
600
800
However, the same functional
Growing Season Degree Days
050010001500200025000
200
However, the same functional relationship exists for both temperature
1000
1200
Growing Season Degree-Days
and N deposition
*C thi b l d?
nten
t (g
m-2
)600
800
1000*Can this be resolved?
N c
on
0
200
400
N deposition (g m-2yr-1)
0.0 0.5 1.0 1.5 2.0 2.5 3.0 3.50

A Quantitative View Can N dep account for differences in soil N?
1200
1400 Organic Horizon50 years of N deposition, estimated
nt (g
m- 2
)
800
1000
Nitr
ogen
Con
ten
600
N
200
400
Elevation (m)
0 800 1000 1200 14000
( )
570 g N m-2, 1.8 g N m-2yr-1 * 50 yrs = 16%

Not enough N in deposition to have a measurable i fl il N linfluence on soil N pools
1200
1000
nten
t (g
m-2
)
600
800
N C
on
400
0
200
5700 kg N ha-1, 18 kg N ha-1yr-1 * 50 yrs = 16%SF

Whiteface Mtn N budgetWhere is the N going?
N budget (kg N haN budget (kg N ha--11yryr--11))
Atmospheric Input = 16.4Mineralization = 40
Uptake = 42.8Leaching = 4.8Leaching 4.8
Retained = 8.8FF Pool = 0.3% yr-1
Total Pool = 0.07% yr-1
From Friedland et al., 1991

Adirondack forest transect