the health returns to schooling—what can we learn from twins?
TRANSCRIPT

J Popul Econ (2013) 26:673–701DOI 10.1007/s00148-012-0429-5
ORIGINAL PAPER
The health returns to schooling—what can we learnfrom twins?
Petter Lundborg
Received: 22 June 2011 / Accepted: 1 June 2012 /Published online: 11 July 2012© Springer-Verlag 2012
Abstract This paper estimates the health returns to schooling, using a twindesign. For this purpose, I use data on monozygotic twins from the Midlifein the United States survey. The results suggest that completing high schoolimproves health, as measured through self-reported health, chronic conditions,and exercise behavior, but that additional schooling does not lead to additionalhealth gains. Controlling for certain early life factors that may vary within twinpairs does not alter the main conclusions of this paper.
JEL Classification I12 · I11 · J14
Keywords Health production · Education · Schooling · Twins ·Returns to education · Ability bias
Responsible editor: Alessandro Cigno
P. Lundborg (B)Department of Economics, Lund University, P.O. Box 7082, 220 07, Lund, Swedene-mail: [email protected].
P. LundborgVU University Amsterdam, Amsterdam, The Netherlands
P. LundborgIZA, Bonn, Germany
P. LundborgTinbergen Institute, Amsterdam, The Netherlands
P. LundborgHealth Economics Program Lund, Lund, Sweden
P. LundborgCentre for Economic Demography Lund, Lund, Sweden
674 P. Lundborg
1 Introduction
The potential health benefits of schooling have recently received increasingattention in the economics literature. This partly reflects a generally growinginterest in the effect of schooling on nonmarket outcomes, such as fertilitychoices, criminal activity, charitable giving, trust, and voting behavior (seeLochner 2011, for a recent overview). If schooling has such nonmarket returns,estimates that only focus on the wage returns to schooling may seriouslyunderestimate both the private and social returns to schooling.
The attention given to the topic also reflects an interest in possible ways toimprove population health and to reduce socioeconomic inequalities in health.Schooling is strongly associated with a range of different health measures, andthe relationship has been observed in a large number of countries and timeperiods, even after accounting for factors such as income, wealth, and healthknowledge. If this relationship reflects a causal effect of schooling on health,increased expenditures on education may be a cost-effective way to improvepopulation health, compared to other means, such as increased health care ex-penditures. Whether the association reflects a causal effect remains much dis-puted, however, and more evidence is needed before credible policy advice canbe given.
In this paper, I estimate the effect of schooling on health using a twindesign. By relating within-twin-pair differences in schooling to within-twin-pair differences in health and health behaviors, I am able to difference out theinfluence of genetic traits and family endowments that may otherwise bias theschooling coefficient. In the previous economics literature, the twin design hasmainly been used to estimate the effect of low birth weight on adult educationand income, the intergenerational transmission of education, and the wagereturns to schooling (e.g. Ashenfelter and Krueger 1994; Bonjour et al. 2003;Black et al. 2007; Royer 2009; Holmlund et al. 2011; Pronzato 2012).
My paper is directly related to the different explanations for the positiveassociation between schooling and health that has been proposed in theeconomics literature. Arguing in favor of a causal effect, Grossman (1972)proposed that educated people are more efficient in producing their ownhealth, so that educated people are able squeeze out a greater health outputfrom a given health input. Schooling may also increase the allocative efficiencyin health production, in which case educated people are able to pick a bettermix of inputs (Rosenzweig and Schultz 1982; Kenkel 1991). Alternatively,schooling and health may be related through factors such as family backgroundand genetic traits. Fuchs (1982) proposed time preferences as one importantfactor, where less future-oriented people will invest less in both educationand health, since the benefits of the investments are of a long-run character.Since factors such as time preferences and genetic traits are often unobserved,this creates a standard omitted variable problem. Third, there may be reversecausality so that early life health affects educational attainment. Some recentevidence based on samples of twins suggest, for instance, that low birth weight,
The health returns to schooling—what can we learn from twins? 675
being a marker of early life health, has a negative effect on schooling (see, e.g.,Behrman and Rosenzweig 2004; Black et al. 2007).
The latter two hypotheses would suggest that schooling is endogenous in aregression of schooling on health. To deal with this, a number of recent studieshave relied on various “natural experiments” to estimate the causal effect ofschooling of health (see, e.g., Currie and Moretti 2003; Lleras-Muney 2005;de Walque 2007; Powdthavee 2010; Jürges et al. 2011).1 The majority of thesestudies use educational reforms in order to identify the effect.
These studies rely on natural experiments that affect people whose return toschooling is likely to be different from the average returns in the population.Changes in mandatory schooling laws, for instance, were typically intended toincrease the schooling of those at the lower end of the education distribution,while having little or no effect on those planning to proceed to further studiesanyway. The resulting estimates therefore reflect local average treatmenteffects (LATE).
A twin design offers an alternative research design, where identificationrelies on differences in schooling within identical twin pairs. This usually alsomeans that a twin design identifies the effect of education on health across theentire education distribution, whereas most instrumental variable (IV) studiesprovide estimates for those at the lower end of the education distribution.Twin-based estimates may therefore come closer to estimating an averagetreatment effect (ATE) than those based on reforms. The resulting estimatecould therefore be expected to differ and a twin difference approach shouldtherefore constitute a useful complement to the literature.
Very few studies, however, have exploited, to date, the twin design in orderto estimate the health returns to schooling. One exception was Lundborg(2008), on which this paper is partly based, who conducted a detailed investiga-tion of the relation between education and health using a twin design appliedto US data. Fujiwara and Kawachi (2009), also using US twin data, focusedon years of schooling and found no evidence of a causal effect of schoolingon a range of health outcomes and health behaviors. A working paper byBehrman et al. (2006) found no causal effect of education on health, using dataon Chinese twins. Behrman et al. (2011) examined the effect of schooling onhospitalizations and mortality among Danish twins. Their findings suggest thatthe negative association between education, on the one hand, and hospitaliza-tions and mortality, on the other hand, disappears when exploiting within-twin-pair variation in schooling and health outcomes. A similar finding was reportedby Amin et al. (2010), using data on UK twins and focusing on various healthbehaviors and health outcomes. Webbink et al. (2010) examined the effect ofschooling on overweight using a twin design and found an effect only for men.
1Currie and Moretti (2003) and Chou et al. (2010) consider the effect of parental education onchild health.
676 P. Lundborg
This paper contributes to the small literature on the health returns to school-ing that uses a twin design. For this purpose, I exploit unique and detaileddata on monozygotic twins from the Midlife in the United States (MIDUS)survey. These data have not been used, to the best of my knowledge, in anyprevious economic studies and contains rich information on health outcomesand education. Moreover, the data allow me to address some common criticismof the twin design. A common concern has been that differences in educationwithin twin pairs are not exogenously given, i.e., that while twin differencingwill remove the influence of unobserved factors common to a twin pair, theremay still remain within-twin-pair differences in unobserved factors that affectschooling (Bound and Solon 1999).2
In order to address such criticism, I contribute by exploiting the unusuallyrich MIDUS data and examine to which extent my results are robust to con-trolling for differences in early life factors, such as parental treatment, withintwin pairs. Moreover, differences in time preferences between twins mayexplain why even identical twins end up with different schooling levels, in linewith the Fuchs (1982) hypothesis. I will therefore consider this possibility byexploiting detailed questions about attitudes towards the future. In addition,I will address the reverse causality argument, i.e., that early life health affectseducational attainment, by accounting for early life health differences withintwin pairs.
Finally, whereas most previous twin studies focus on years of schooling, Iallow for a more flexible functional form regarding the effect of schooling onhealth. I show that this has important implications for the results.
In contrast to most previous twin-based studies on the relationship betweeneducation and health, I find some evidence of a causal effect of schooling onhealth. Relative to high school dropouts, people with greater schooling aresignificantly healthier, as measured through self-reported health and chronicconditions. Moreover, some of these twin-based point estimates are evengreater in magnitude compared to the corresponding ordinary least squares(OLS) estimates. Beyond completing high school, however, additional school-ing does not generate any additional health gains. For physical activity, mytwin-based estimates are again greater in magnitude, whereas for smoking andoverweight, the twin-based estimates are substantially smaller in magnitudeand are insignificant. My results are reasonably robust to accounting fordifferences in early life factors, such as parental treatment and early life health.Moreover, accounting for differences in attitudes towards the future does notalter my results.
Why are then some of my twin-based estimates larger in magnitude thanthe corresponding OLS estimates? I argue that one reason might be that the
2Bound and Solon (1999) showed that any differences between the twins that are not removedin a twin-fixed effects model could potentially even increase the endogeneity bias compared toOLS estimates. To see this, first note that the ability bias is determined by the ratio of exogenousvariation to total variation. If differencing reduces the fraction of exogenous variation, ability biasmay increase.
The health returns to schooling—what can we learn from twins? 677
twin-based estimates are only identified for those pairs where a differencein schooling is present and that these twin pairs may face larger returns toschooling than the average person in the population. I show some evidenceconsistent with this idea where twin pairs showing a difference in schooling aremore likely to come from low-educated backgrounds. In addition, I show thatthere is a tendency for those twins to have larger returns to schooling, whichcould thus explain the larger twin estimates.
The paper proceeds as follows: next, I discuss the empirical model. Afterthat, I discuss the data used in the analyses and compare it to data from theCurrent Population Survey (CPS) in order to assess its generalizability. I thenreport the results, where the results from the pooled twin sample are con-trasted with those obtained when applying a twin-difference strategy. Finally,the results are discussed and some conclusions are drawn.
2 Empirical strategy
In order to see how a twin-difference strategy may help to estimate the causaleffect of schooling on health, let H1 j and H2 j denote the health of the first andsecond twin in the jth twin pair:
H1 j = S1 jβ + μ j + X′1 jγ + ε1 j, (1)
H2 j = S2 jβ + μ j + X′1 jγ + ε2 j, (2)
where Sij denotes the schooling of the first and second twin, X′1 j denotes a
vector of other observable factors that may vary within a twin pair, μ j denotesunobserved genetic traits and family endowments at the family level, and εij isan unobserved random component. In this context, omitted variable bias mayarise since μ j possibly affects both health and schooling. The X
′1 j vector may
include factors such as parental treatment, past health, time preferences, andbirth weight, to the extent that such factors are observable.
Next, I take the difference between Eqs. 1 and 2, giving
�H j = �S jβWT P + �X′jγWT P + �ε j. (3)
where βWT P is the within-twin-pair estimate of the association between school-ing and health. In this specification, all factors that are common to both twins ina given twin pair will be differenced out. Since twins share common genes, theirinfluence will vanish as well as the influence of common family background.This means that an OLS estimate of Eq. 3 will no longer be biased due tounobserved twin-pair specific variables. Any remaining unobservables thatremain in the error term after differencing may still, however, bias the results,if these unobservables are still related to both schooling and health.
The crucial assumption made in the literature is, thus, that schooling dif-ferences within twin pairs are exogenous, conditional on the fixed effect, andincluded covariates. A justified question is then what causes such schooling
678 P. Lundborg
differences between otherwise very similar individuals. One example of ex-ogenously given differences would be, for instance, if the twins in a giventwin pair happened to end up with teachers of different quality.3 This maythen cause one of them to obtain more schooling, and it is not obviousthat the quality of the teacher would influence health other than throughobtained schooling. Another interpretation is given by Ashenfelter andRouse (1998), who argue that random deviations from the optimum school-ing level, stemming from optimization errors, may cause differences amongotherwise similar individuals. Differences in education could also result fromearly differences in interests and activities that, in turn, may result from coin-cidences and more or less random events. While there is, of course, no wayof proving that differences in schooling within twin pairs are exogenous, onecould shed some light on the issue if data on early life differences betweentwins are available. Since the MIDUS contains rich information on such early-life factors, I will address these issues in the sensitivity analyses.
In all my regressions, I control for self-assessed health at age 16. This willthen, to some extent, deal with the issue of reverse causality, running fromearly life health to education. In addition, it provides a control for a character-istic that may vary within twin pairs and that may predict schooling differences.I will not, however, control for marital status, occupation, or current incomein the regressions since some of the effect of education on health may runexactly through these channels.
I will also provide a set of OLS regressions in order to obtain some“baseline” results. Besides self-assessed health at age 16 and schooling, theseregressions will, in addition, control for age, gender, and race. Note that inthe twin-fixed effect regressions, these variables are not included since they donot vary within twin pairs. In the regressions on smoking, I will also includea measure of smoking at age 16. This will account for any reverse causalityrunning from teenage smoking to later schooling attainment. Since this vari-able can vary also within twin pairs, it is included in both the OLS and fixedeffects regressions.
It is well known that the importance of measurement errors in years ofschooling is exaggerated by differencing and even more so when differencingbetween identical twins (Griliches 1979). This will cause twin FE estimates tobe downward-biased, under the assumption of classical measurement errors.Since our measure of years of schooling is imputed from categories, there islikely to be measurement error in the variable. I will consider this possibilityin a section on robustness checks towards the end of the paper.
3 Data
My estimates are based on data from the first wave of the MIDUS survey. Thefirst wave collected data in 1995 on a total of 7,108 individuals. To be eligible
3I thank the anonymous referee for suggesting this possibility.
The health returns to schooling—what can we learn from twins? 679
for the survey, participants had to be noninstitutionalized, English-speaking,living in the USA, and aged 25–74. The response rate for the telephoneinterviews in the first wave of MIDUS was 70 %. Among these, 86.3 % alsocompleted a self-administered questionnaire, giving an overall response rateof 60.8 %.
Out of the 7,108 individuals interviewed, 1,914 were twins participating inthe MIDUS twin screening project. In the project, a representative nationalsample of approximately 50,000 households were screened in order to identifyfamilies with twins. It should be noted that MIDUS was the first nationalsample of twins that was ascertained randomly via telephone. Using nationallyrepresentative data is an improvement compared to prior economic studies us-ing twin data, such as that of Ashenfelter and Krueger (1994) and Ashenfelterand Rouse (1998), using highly selective data collected during the Twinsburgtwins festival.
By using information collected as part of the initial twin screening ques-tionnaire, twin pairs were diagnosed as identical or fraternal twins. Based ontheir answers to the questions, the twins were assigned points, which weresubsequently totaled. “High” scores indicated identical twin pairs and “low”scores indicated fraternal twin pairs. In a small number of cases, the pairs’ scorefell in the middle of the range, and no diagnosis was given (Brim et al. 2003).This method of diagnosing twin zygosity has proven reliable and has shownto be over 90 % accurate in diagnosing twin zygosity (e.g., Nichols and Bilbro1966).
In the twin sample, 32 twins (16 twin pairs) were dropped due to uncertaintyregarding zygosity. Of the remaining twins, 734, or 37 %, were identical twins,who were then selected for the analysis. I dropped three twins who had yetnot finished their education. In addition, I dropped 19 twins whose id numberswere lacking and 18 twins whose information on the co-twin was lacking. Thisresulted in a final sample size of 694 identical twins (individuals).
3.1 Explanatory variables
Educational attainment was measured in 12 categories in MIDUS, rangingfrom no school/some grade school to PhD. For my analyses, I categorized thisvariable into four categories: college degree, college but less than a BA degree;a high school diploma; less than a high school diploma.4
While years of schooling has been the standard measure in many priorstudies on the wage returns to schooling, the educational degree may be asrelevant, or even more relevant. In de Walque (2007), for instance, there is asharp increase in the effect of number of years of schooling on smoking once
4While full-time students were already excluded from the sample, measurement error may alsobe present if there are twins who are part-time students at the moment of the interview, since thequestion in MIDUS about schooling concerned “completed” schooling. In the twin sample, therewere only seven part-time students, however. I will check the robustness of the results to excludingthe part-time students from the sample in Section 5.
680 P. Lundborg
reaching college. Similar evidence for nonlinear effects have been obtained inthe literature on the wage returns to education (Hungerford and Solon 1987;Belman and Heywood 1991; Isacsson 2004). Based on such findings, someeconomists argue that credentials matter more than years of schooling (fora discussion on this, see Card 1999).
In line with previous studies using a twin-difference design, the twins inMIDUS often end up with similar educational attainment. Using the educa-tional categories described above, 67 % of the identical twins in MIDUS reportthe same level of education.5 For imputed years of schooling, 42 % are assignedthe same number of years. In the regressions using educational categories, I usethe category less than a high school diploma as the omitted reference category.This category, in principle, indicates being a high school dropout.
3.2 Health outcomes
As measures of health, I use self-assessed health and the number of chronicconditions. The former was assessed through the following question: “Using ascale from 0 to 10 where 0 means “the worst possible health” and 10 means“the best possible health,” how would you rate your health these days?” Self-assessed health has been found to be a strong predictor of subsequent mortality(see for instance Idler and Benyamini 1997). There are often some concernsexpressed, however, about the interpretation of questions about self-reportedhealth. Older individuals often report similar self-reported health as that ofyounger persons, despite having “objectively” worse health (Groot 2000).Note, however, that this is not an issue in the twin design since two twins areof the same age. I will also consider an additional health measure: the self-reported number of chronic conditions.6
In addition to these health measures, I will also make use of measureson lifestyle. These are smoking, body mass index, and physical exercise. Themeasure of physical exercise indicates the number of occasions during the pastmonth that the individual engages in vigorous physical activity. In the MIDUSquestionnaire, “vigourous” is examplified by running or lifting heavy objects.
For both the health and the lifestyle measures, there is substantial variationwithin twin pairs. In 75 % of the pairs, the twins reported different levelsof self-reported health. For chronic conditions, the corresponding figure was71 %. The fraction of twin pairs reporting a difference in smoking, exercise,and BMI was 73, 16, and 99 %, respectively.
5The reason that the variation in years of schooling is greater than the variation in educationalcategories is that certain ranges of years of schooling are aggregated into larger educationalcategories in the imputation of Jaeger (1997).6The number of chronic conditions is a constructed variable in the MIDUS database which, froma list of 29 chronic conditions shown to the respondent, counts the number of conditions that therespondent claims to suffer from.
The health returns to schooling—what can we learn from twins? 681
3.3 Representativeness of the sample
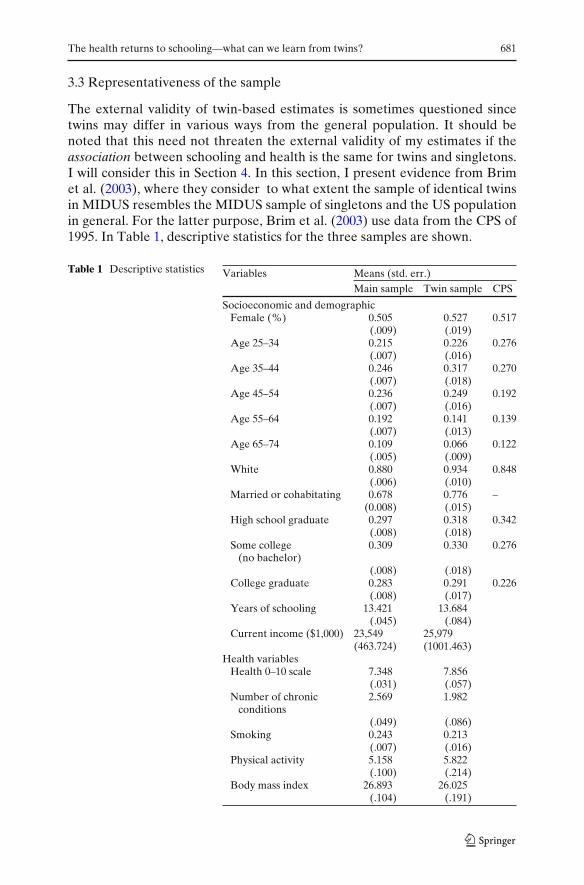
The external validity of twin-based estimates is sometimes questioned sincetwins may differ in various ways from the general population. It should benoted that this need not threaten the external validity of my estimates if theassociation between schooling and health is the same for twins and singletons.I will consider this in Section 4. In this section, I present evidence from Brimet al. (2003), where they consider to what extent the sample of identical twinsin MIDUS resembles the MIDUS sample of singletons and the US populationin general. For the latter purpose, Brim et al. (2003) use data from the CPS of1995. In Table 1, descriptive statistics for the three samples are shown.
Table 1 Descriptive statistics Variables Means (std. err.)Main sample Twin sample CPS
Socioeconomic and demographicFemale (%) 0.505 0.527 0.517
(.009) (.019)Age 25–34 0.215 0.226 0.276
(.007) (.016)Age 35–44 0.246 0.317 0.270
(.007) (.018)Age 45–54 0.236 0.249 0.192
(.007) (.016)Age 55–64 0.192 0.141 0.139
(.007) (.013)Age 65–74 0.109 0.066 0.122
(.005) (.009)White 0.880 0.934 0.848
(.006) (.010)Married or cohabitating 0.678 0.776 –
(0.008) (.015)High school graduate 0.297 0.318 0.342
(.008) (.018)Some college 0.309 0.330 0.276
(no bachelor)(.008) (.018)
College graduate 0.283 0.291 0.226(.008) (.017)
Years of schooling 13.421 13.684(.045) (.084)
Current income ($1,000) 23,549 25,979(463.724) (1001.463)
Health variablesHealth 0–10 scale 7.348 7.856
(.031) (.057)Number of chronic 2.569 1.982
conditions(.049) (.086)
Smoking 0.243 0.213(.007) (.016)
Physical activity 5.158 5.822(.100) (.214)
Body mass index 26.893 26.025(.104) (.191)

682 P. Lundborg
A comparison with the CPS data reveals that both the twin sample and theMIDUS main sample are better educated than the US population in general.7
Similar patterns were found in several previous twin studies, possibly reflectinga selection of better educated twins into the surveys or that twins, for somereason, obtain more schooling than singletons (Ashenfelter and Krueger 1994;Ashenfelter and Rouse 1998; Bonjour et al. 2003). While similar in termsof gender distribution, the twin sample also contains more whites and has aslightly more compressed age distribution than the CPS sample. Regardingmarital status, the CPS from 1995 does not contain a straightforward estimateof the number of cohabitating or married couples. Considering marriage alone,however, the fraction of married in CPS in 1995 was 67.5 %, compared to71.6 % in the twin sample and 62.6 % in the MIDUS main sample.
4 Results
4.1 Self-reported health
The first three columns of Table 2 show the OLS and twin-differences resultsfor self-reported health. In order to assess the external validity of the estimatesbased on the twin sample, I will start by comparing the association betweenschooling and health in the nontwin sample and the twin sample. Starting withthe MIDUS nontwin sample, the results in the first column show a strong andpositive association between schooling and self-reported health. Next, I runthe same analysis on the twin sample but without including twin-fixed effects.I refer to this sample as the “pooled” twin sample, and the results are shownin the second column in Table 2.8 The results are largely similar, although themagnitude of the associations is now somewhat increased. This suggests thatthe differences between the MIDUS main sample and the MIDUS twin samplein the distribution of characteristics does not lead to any radical differences inthe estimated health returns to schooling.
In the third column, the results from the twin-differences approach are thenshown. Relative to high school dropouts, people with greater schooling reportsignificantly better health. The effect is to increase self-reported health withabout one unit, measured on the 0–10 scale. Interestingly, the magnitude ofthe associations between the educational categories and self-reported health isabout double the magnitude of the associations in the nontwin sample. Theseresults are surprising, since one would expect a weaker relationship, once theinfluence of genes and family background common to the twins is controlledfor. Also remember that these regressions control for self-reported health at
7Brim et al. (2003) do not present standard errors and only show comparisons for a selectednumber of variables from the CPS.8The regressions without twin-fixed effects allow for clustering within families when calculatingthe standard errors. The reason is that twins can be assumed to share common unobserved factorsat the family level.
The health returns to schooling—what can we learn from twins? 683
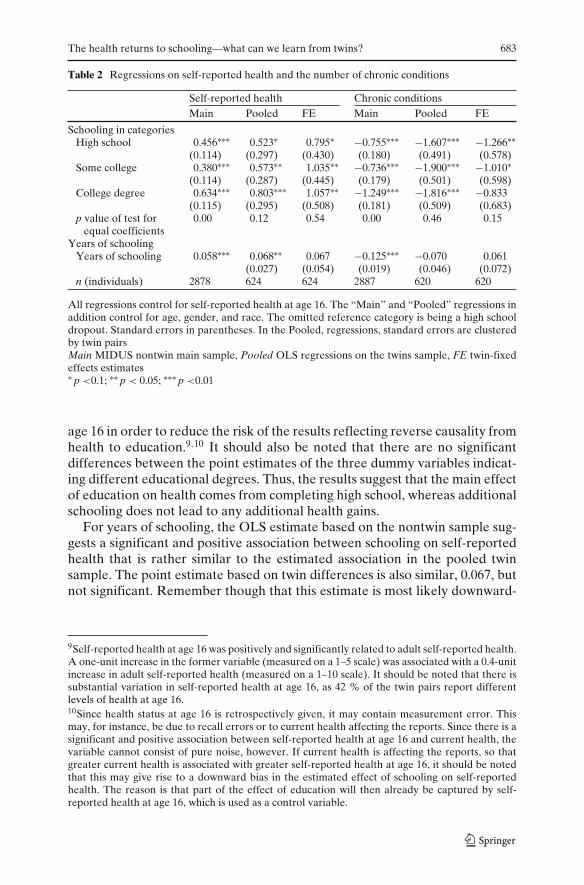
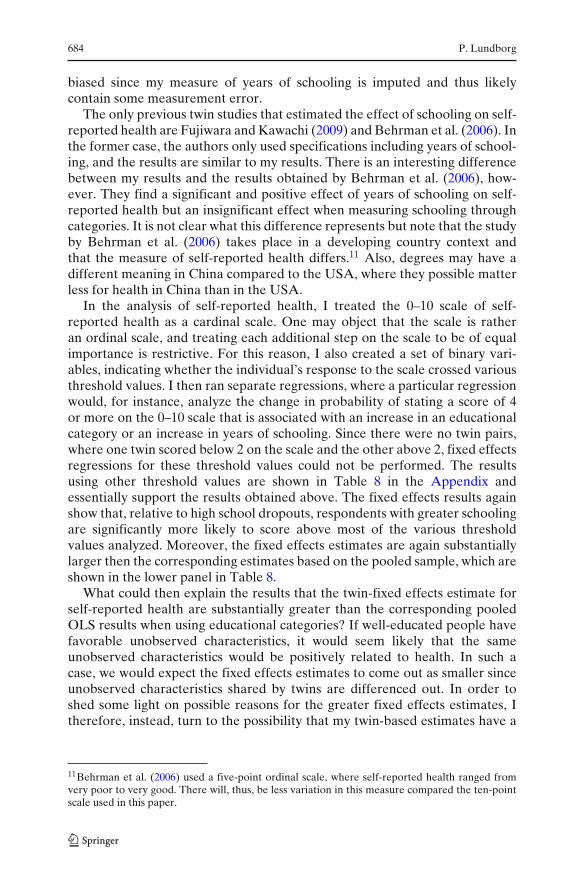
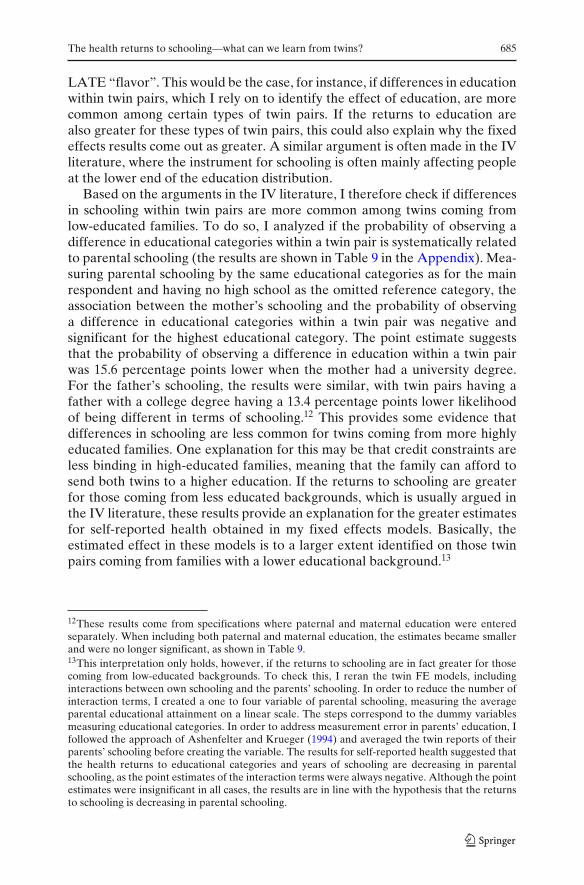
Table 2 Regressions on self-reported health and the number of chronic conditions
Self-reported health Chronic conditionsMain Pooled FE Main Pooled FE
Schooling in categoriesHigh school 0.456∗∗∗ 0.523∗ 0.795∗ −0.755∗∗∗ −1.607∗∗∗ −1.266∗∗
(0.114) (0.297) (0.430) (0.180) (0.491) (0.578)Some college 0.380∗∗∗ 0.573∗∗ 1.035∗∗ −0.736∗∗∗ −1.900∗∗∗ −1.010∗
(0.114) (0.287) (0.445) (0.179) (0.501) (0.598)College degree 0.634∗∗∗ 0.803∗∗∗ 1.057∗∗ −1.249∗∗∗ −1.816∗∗∗ −0.833
(0.115) (0.295) (0.508) (0.181) (0.509) (0.683)p value of test for 0.00 0.12 0.54 0.00 0.46 0.15
equal coefficientsYears of schooling
Years of schooling 0.058∗∗∗ 0.068∗∗ 0.067 −0.125∗∗∗ −0.070 0.061(0.027) (0.054) (0.019) (0.046) (0.072)
n (individuals) 2878 624 624 2887 620 620
All regressions control for self-reported health at age 16. The “Main” and “Pooled” regressions inaddition control for age, gender, and race. The omitted reference category is being a high schooldropout. Standard errors in parentheses. In the Pooled, regressions, standard errors are clusteredby twin pairsMain MIDUS nontwin main sample, Pooled OLS regressions on the twins sample, FE twin-fixedeffects estimates∗ p <0.1; ∗∗ p < 0.05; ∗∗∗ p <0.01
age 16 in order to reduce the risk of the results reflecting reverse causality fromhealth to education.9,10 It should also be noted that there are no significantdifferences between the point estimates of the three dummy variables indicat-ing different educational degrees. Thus, the results suggest that the main effectof education on health comes from completing high school, whereas additionalschooling does not lead to any additional health gains.
For years of schooling, the OLS estimate based on the nontwin sample sug-gests a significant and positive association between schooling on self-reportedhealth that is rather similar to the estimated association in the pooled twinsample. The point estimate based on twin differences is also similar, 0.067, butnot significant. Remember though that this estimate is most likely downward-
9Self-reported health at age 16 was positively and significantly related to adult self-reported health.A one-unit increase in the former variable (measured on a 1–5 scale) was associated with a 0.4-unitincrease in adult self-reported health (measured on a 1–10 scale). It should be noted that there issubstantial variation in self-reported health at age 16, as 42 % of the twin pairs report differentlevels of health at age 16.10Since health status at age 16 is retrospectively given, it may contain measurement error. Thismay, for instance, be due to recall errors or to current health affecting the reports. Since there is asignificant and positive association between self-reported health at age 16 and current health, thevariable cannot consist of pure noise, however. If current health is affecting the reports, so thatgreater current health is associated with greater self-reported health at age 16, it should be notedthat this may give rise to a downward bias in the estimated effect of schooling on self-reportedhealth. The reason is that part of the effect of education will then already be captured by self-reported health at age 16, which is used as a control variable.
684 P. Lundborg
biased since my measure of years of schooling is imputed and thus likelycontain some measurement error.
The only previous twin studies that estimated the effect of schooling on self-reported health are Fujiwara and Kawachi (2009) and Behrman et al. (2006). Inthe former case, the authors only used specifications including years of school-ing, and the results are similar to my results. There is an interesting differencebetween my results and the results obtained by Behrman et al. (2006), how-ever. They find a significant and positive effect of years of schooling on self-reported health but an insignificant effect when measuring schooling throughcategories. It is not clear what this difference represents but note that the studyby Behrman et al. (2006) takes place in a developing country context andthat the measure of self-reported health differs.11 Also, degrees may have adifferent meaning in China compared to the USA, where they possible matterless for health in China than in the USA.
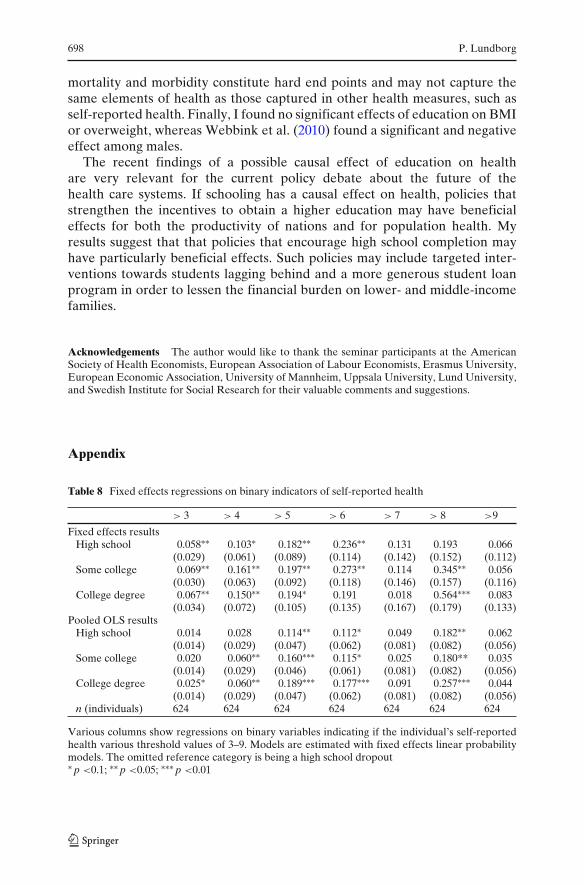
In the analysis of self-reported health, I treated the 0–10 scale of self-reported health as a cardinal scale. One may object that the scale is ratheran ordinal scale, and treating each additional step on the scale to be of equalimportance is restrictive. For this reason, I also created a set of binary vari-ables, indicating whether the individual’s response to the scale crossed variousthreshold values. I then ran separate regressions, where a particular regressionwould, for instance, analyze the change in probability of stating a score of 4or more on the 0–10 scale that is associated with an increase in an educationalcategory or an increase in years of schooling. Since there were no twin pairs,where one twin scored below 2 on the scale and the other above 2, fixed effectsregressions for these threshold values could not be performed. The resultsusing other threshold values are shown in Table 8 in the Appendix andessentially support the results obtained above. The fixed effects results againshow that, relative to high school dropouts, respondents with greater schoolingare significantly more likely to score above most of the various thresholdvalues analyzed. Moreover, the fixed effects estimates are again substantiallylarger then the corresponding estimates based on the pooled sample, which areshown in the lower panel in Table 8.
What could then explain the results that the twin-fixed effects estimate forself-reported health are substantially greater than the corresponding pooledOLS results when using educational categories? If well-educated people havefavorable unobserved characteristics, it would seem likely that the sameunobserved characteristics would be positively related to health. In such acase, we would expect the fixed effects estimates to come out as smaller sinceunobserved characteristics shared by twins are differenced out. In order toshed some light on possible reasons for the greater fixed effects estimates, Itherefore, instead, turn to the possibility that my twin-based estimates have a
11Behrman et al. (2006) used a five-point ordinal scale, where self-reported health ranged fromvery poor to very good. There will, thus, be less variation in this measure compared the ten-pointscale used in this paper.
The health returns to schooling—what can we learn from twins? 685
LATE “flavor”. This would be the case, for instance, if differences in educationwithin twin pairs, which I rely on to identify the effect of education, are morecommon among certain types of twin pairs. If the returns to education arealso greater for these types of twin pairs, this could also explain why the fixedeffects results come out as greater. A similar argument is often made in the IVliterature, where the instrument for schooling is often mainly affecting peopleat the lower end of the education distribution.
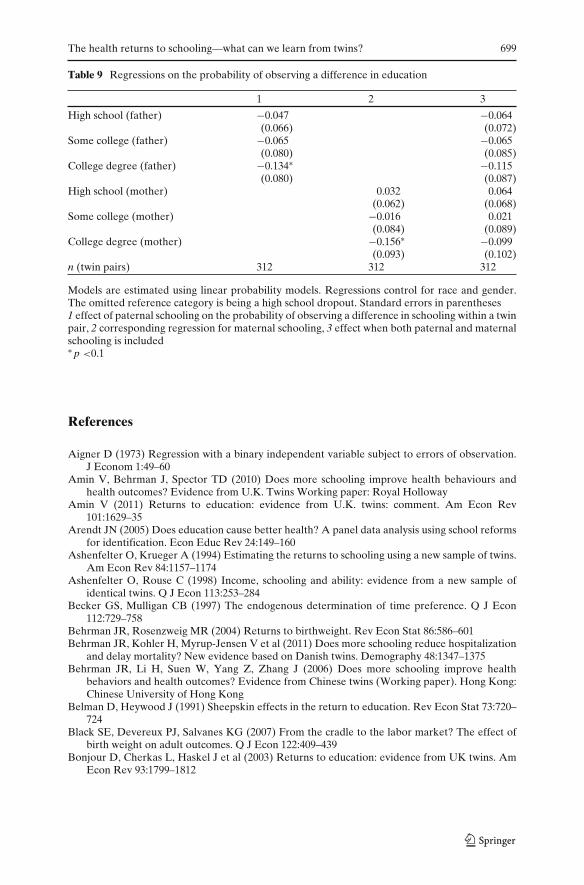
Based on the arguments in the IV literature, I therefore check if differencesin schooling within twin pairs are more common among twins coming fromlow-educated families. To do so, I analyzed if the probability of observing adifference in educational categories within a twin pair is systematically relatedto parental schooling (the results are shown in Table 9 in the Appendix). Mea-suring parental schooling by the same educational categories as for the mainrespondent and having no high school as the omitted reference category, theassociation between the mother’s schooling and the probability of observinga difference in educational categories within a twin pair was negative andsignificant for the highest educational category. The point estimate suggeststhat the probability of observing a difference in education within a twin pairwas 15.6 percentage points lower when the mother had a university degree.For the father’s schooling, the results were similar, with twin pairs having afather with a college degree having a 13.4 percentage points lower likelihoodof being different in terms of schooling.12 This provides some evidence thatdifferences in schooling are less common for twins coming from more highlyeducated families. One explanation for this may be that credit constraints areless binding in high-educated families, meaning that the family can afford tosend both twins to a higher education. If the returns to schooling are greaterfor those coming from less educated backgrounds, which is usually argued inthe IV literature, these results provide an explanation for the greater estimatesfor self-reported health obtained in my fixed effects models. Basically, theestimated effect in these models is to a larger extent identified on those twinpairs coming from families with a lower educational background.13
12These results come from specifications where paternal and maternal education were enteredseparately. When including both paternal and maternal education, the estimates became smallerand were no longer significant, as shown in Table 9.13This interpretation only holds, however, if the returns to schooling are in fact greater for thosecoming from low-educated backgrounds. To check this, I reran the twin FE models, includinginteractions between own schooling and the parents’ schooling. In order to reduce the number ofinteraction terms, I created a one to four variable of parental schooling, measuring the averageparental educational attainment on a linear scale. The steps correspond to the dummy variablesmeasuring educational categories. In order to address measurement error in parents’ education, Ifollowed the approach of Ashenfelter and Krueger (1994) and averaged the twin reports of theirparents’ schooling before creating the variable. The results for self-reported health suggested thatthe health returns to educational categories and years of schooling are decreasing in parentalschooling, as the point estimates of the interaction terms were always negative. Although the pointestimates were insignificant in all cases, the results are in line with the hypothesis that the returnsto schooling is decreasing in parental schooling.
686 P. Lundborg
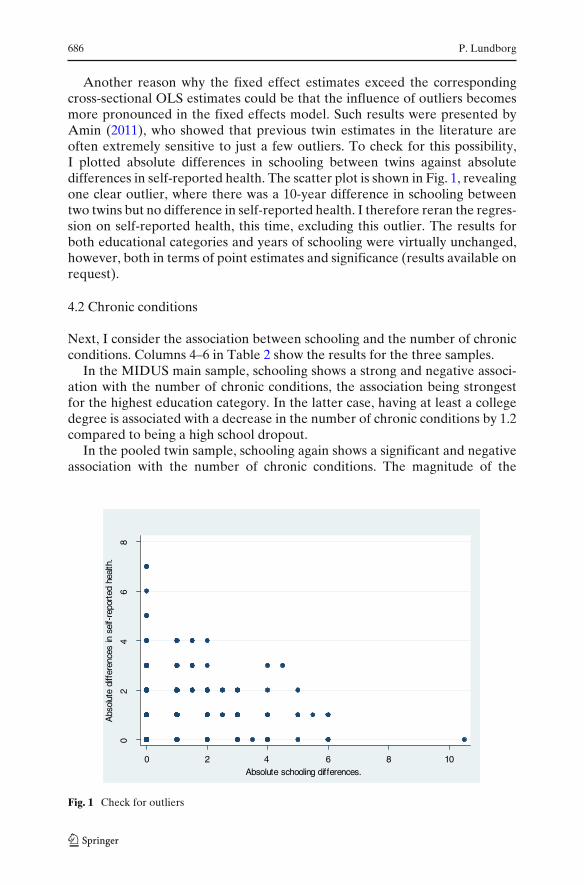
Another reason why the fixed effect estimates exceed the correspondingcross-sectional OLS estimates could be that the influence of outliers becomesmore pronounced in the fixed effects model. Such results were presented byAmin (2011), who showed that previous twin estimates in the literature areoften extremely sensitive to just a few outliers. To check for this possibility,I plotted absolute differences in schooling between twins against absolutedifferences in self-reported health. The scatter plot is shown in Fig. 1, revealingone clear outlier, where there was a 10-year difference in schooling betweentwo twins but no difference in self-reported health. I therefore reran the regres-sion on self-reported health, this time, excluding this outlier. The results forboth educational categories and years of schooling were virtually unchanged,however, both in terms of point estimates and significance (results available onrequest).
4.2 Chronic conditions
Next, I consider the association between schooling and the number of chronicconditions. Columns 4–6 in Table 2 show the results for the three samples.
In the MIDUS main sample, schooling shows a strong and negative associ-ation with the number of chronic conditions, the association being strongestfor the highest education category. In the latter case, having at least a collegedegree is associated with a decrease in the number of chronic conditions by 1.2compared to being a high school dropout.
In the pooled twin sample, schooling again shows a significant and negativeassociation with the number of chronic conditions. The magnitude of the
02
46
8
. htl aeh det roper-fl es ni secner effi d et ul osbA
0 2 4 6 8 10Absolute schooling differences.
Fig. 1 Check for outliers

The health returns to schooling—what can we learn from twins? 687
associations is greater than the corresponding ones in the main sample, withthe two highest education categories now being associated with a decrease inthe number of conditions by 1.9 and 1.8, respectively.
The twin-differences estimates tell a similar story. The significant associa-tions between schooling and the number of conditions remain for all educationcategories, except for the highest one, where the point estimate is still negative,however. It should be noted that there are no significant differences in thepoint estimates of the three dummy variables indicating schooling levels.
For years of schooling, there is a significant and negative correlation,−0.125, with the number of chronic conditions in the MIDUS main sample. Inthe pooled twin sample, the correlation is somewhat smaller in magnitude andsignificant at the 10 % level. In contrast, the twin FE estimate no longer sug-gests any significant relationship between schooling and the number of chronicconditions.14
4.3 Smoking, physical activity, and overweight
In order to examine the potential mechanisms through which schooling affectshealth, I will next investigate the association between schooling and variouslifestyle factors. I will focus on smoking and overweight since these are two ofthe main causes of preventable deaths in the USA. In addition, I will considerthe association between schooling and physical activity. In order to preservespace, I will only compare, from now on, the results from the pooled twinsample with the twin FE estimates.
Smoking Starting with the pooled twin sample, data in the first column inTable 3 show a strong association between schooling and smoking that in-creases with the level of schooling. The regressions on smoking control forsmoking at age 16, in addition to self-reported health at age 16. In contrastto the OLS results, the twin FE estimates for smoking are 4–20 times smallerin magnitude and are insignificant in all cases. It seems unlikely that measure-ment errors alone would generate these nonsignificant findings. The results areconsistent with the hypothesis that unobserved factors, such as genetic traitsand family endowments, are driving the results for the pooled twin sample.
It is not obvious why education would be expected to have any causaleffect on smoking, given the widespread knowledge about smoking risks (e.g.Lundborg 2007). On the other hand, education may increase the wage rate,which in turn increases the opportunity cost associated with a shorter life.Moreover, it should be noted that both Grimard and Parent (2007) and deWalque (2007) found that education mattered for smoking initiation when us-ing an IV strategy. As instruments, they use indicators of the risk of inductionduring the Vietnam War and exploited the fact that college attendance could
14There are no comparable results for chronic conditions in the previous twin literature.
688 P. Lundborg
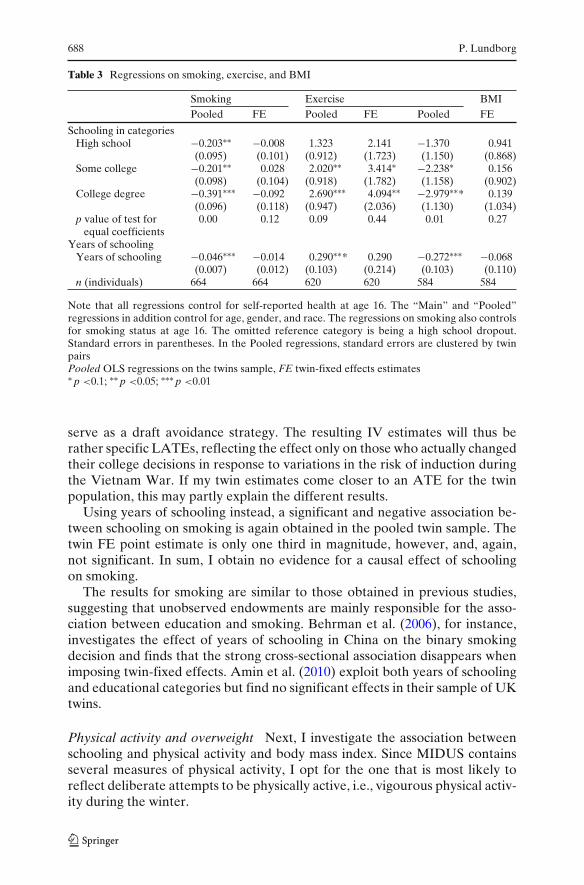
Table 3 Regressions on smoking, exercise, and BMI
Smoking Exercise BMIPooled FE Pooled FE Pooled FE
Schooling in categoriesHigh school −0.203∗∗ −0.008 1.323 2.141 −1.370 0.941
(0.095) (0.101) (0.912) (1.723) (1.150) (0.868)Some college −0.201∗∗ 0.028 2.020∗∗ 3.414∗ −2.238∗ 0.156
(0.098) (0.104) (0.918) (1.782) (1.158) (0.902)College degree −0.391∗∗∗ −0.092 2.690∗∗∗ 4.094∗∗ −2.979∗∗* 0.139
(0.096) (0.118) (0.947) (2.036) (1.130) (1.034)p value of test for 0.00 0.12 0.09 0.44 0.01 0.27
equal coefficientsYears of schooling
Years of schooling −0.046∗∗∗ −0.014 0.290∗∗* 0.290 −0.272∗∗∗ −0.068(0.007) (0.012) (0.103) (0.214) (0.103) (0.110)
n (individuals) 664 664 620 620 584 584
Note that all regressions control for self-reported health at age 16. The “Main” and “Pooled”regressions in addition control for age, gender, and race. The regressions on smoking also controlsfor smoking status at age 16. The omitted reference category is being a high school dropout.Standard errors in parentheses. In the Pooled regressions, standard errors are clustered by twinpairsPooled OLS regressions on the twins sample, FE twin-fixed effects estimates∗ p <0.1; ∗∗ p <0.05; ∗∗∗ p <0.01
serve as a draft avoidance strategy. The resulting IV estimates will thus berather specific LATEs, reflecting the effect only on those who actually changedtheir college decisions in response to variations in the risk of induction duringthe Vietnam War. If my twin estimates come closer to an ATE for the twinpopulation, this may partly explain the different results.
Using years of schooling instead, a significant and negative association be-tween schooling on smoking is again obtained in the pooled twin sample. Thetwin FE point estimate is only one third in magnitude, however, and, again,not significant. In sum, I obtain no evidence for a causal effect of schoolingon smoking.
The results for smoking are similar to those obtained in previous studies,suggesting that unobserved endowments are mainly responsible for the asso-ciation between education and smoking. Behrman et al. (2006), for instance,investigates the effect of years of schooling in China on the binary smokingdecision and finds that the strong cross-sectional association disappears whenimposing twin-fixed effects. Amin et al. (2010) exploit both years of schoolingand educational categories but find no significant effects in their sample of UKtwins.
Physical activity and overweight Next, I investigate the association betweenschooling and physical activity and body mass index. Since MIDUS containsseveral measures of physical activity, I opt for the one that is most likely toreflect deliberate attempts to be physically active, i.e., vigourous physical activ-ity during the winter.
The health returns to schooling—what can we learn from twins? 689
In columns 3 and 4 in Table 3, I show the associations obtained for thepooled twin sample and the results from the twin FE estimation. In the pooledtwin sample, having some college or having a college degree is associated withabout two more occasions of physical activity per month compared to thereference category, whereas having graduated high school shows no significanteffect. The results get even stronger when employing the twin FE estimator.Now, having some college or having a college degree are associated with an in-crease in the number of occasions of physical activity per month by more thanthree.15 This suggests that there may be some unobserved endowment thatis negatively related to schooling but positively related to physical exercise.This endowment is then taken out in the twin design, which will yield greaterestimates. An example would be if there is a negative relation between thelevel of education and preferences for being active in sports or other physicalexercise.
The results for physical exercise are somewhat difficult to compare to thoseobtained in previous twin studies since measurement differs to a great extent.Amin et al. (2010), for instance, used a dummy variable indicating moderate orheavy exercise during leisure time and found small and insignificant effects ofeducation. Behrman et al. (2006) used a measure indicating monthly physicalexercise participation, finding no significant effect of education.
In order to investigate to what extent the higher physical activity of educatedindividuals also transforms itself into lower body mass, I next examine thedirect association between schooling and body mass index. Columns 5 and 6in Table 3 show the results for the pooled twin sample and the results fromthe twin FE estimator. In the pooled twin sample, schooling shows a strongand negative significant association with BMI for all educational categories.Belonging to the highest educational category is associated with a three pointsdecrease in BMI compared to the omitted reference category. The significanceof these associations is completely swept away in the twin FE estimates. Thepoint estimates of schooling are now, in most cases, only a tiny fraction of thoseobtained from the pooled twin sample and are no longer significant.
Columns 5 and 6 in Table 3 also show the corresponding results for yearsof schooling. In the pooled twin sample, years of schooling show a significantand positive association with physical activity and a negative and significantassociation with body mass index. These associations are no longer significantwhen employing the twin FE estimator.
The results for BMI and overweight are consistent with the results inBehrman et al. (2006) and Amin et al. (2010). Webbink et al. (2010), however,find a significant and negative effect between years of schooling and the
15Similar results were obtained when using alternative measures, such as moderate activity duringthe summer. Only for vigorous activity during the summer were the results from the twin FE notsignificant.
690 P. Lundborg
probability of being overweight among men but not among women, whenapplying the twin design. To check if there are such gender-specific patterns inmy data, I therefore reran the regressions on BMI and overweight by gender,both using years of schooling and educational categories. The estimates weresmall and insignificant in all cases, however (results available on request). Itcould also be noted that my results for body size are in line with the resultsfrom some recent IV studies, which find little or no evidence that educationcausally reduces overweight or body mass index (Arendt 2005; Kenkel et al.2006).
Summing up, the results in this section suggest that part of the effect ofeducation on self-reported health may run through physical exercise. More-over, in such a case, the beneficial effect must come through other mechanismsthan through reduced BMI since I found no effect of education on BMI oroverweight. One way to check this would be adding physical exercise to theequation for self-reported health and examine if the effect of education is re-duced substantially. If so, it may suggest that the effect of education on healthruns through physical exercise. The results did not suggest so, however, as thecoefficients of the education dummies were only marginally reduced.16 Thus,the effect on exercise is not large enough to account for the effect of educationon self-reported health.
5 Sensitivity analysis
Dif ferences in parental treatment and circumstances within twin pairs I willstart my sensitivity analysis by considering how the results are affected byallowing twins that were treated very differently by their parents and facedvery different circumstances to be included in my sample. A key assumptionin the twin-based literature is that twins faced very similar conditions and thatany differences in terms of schooling are exogenously determined. Results inLundborg (2010), however, suggest that MIDUS twins who reported that theywere treated very differently or faced very different environments also moreoften ended up with different level of schooling. This concerned, for instance,whether the twins went to the same classroom, if they had the same friends,if parents emphasized the differences between them, if they were dressedsimilarly, etc.
One interpretation of such differences in treatment and circumstances isthat they result from large differences in factors such as ability and healthwithin twin pairs. Including such twin pairs in the analysis may thereforebias the results since the differences in schooling in such twin pairs may be
16The coefficient indicating high school completion was reduced from 0.79 to 0.76. For thevariables indicating some college or a university degree, the coefficients were reduced from 1.03 to0.94 and from 1.06 to 0.95. The variable indicating physical exercise showed a positive relationshipwith self-reported health.

The health returns to schooling—what can we learn from twins? 691
Table 4 Differences within twin pairs in early life
Parents emphasized Twins dressed Twins shared Twins shareddifferences between the same (%) same classroom (%) playmates (%)the twins (%)
Always 1.5 32.9 35.1 52.5Most of the time 6.2 28.2 22.2 37.2Some of the time 7.1 32.3 28.6 8.5Never 85.2 6.5 14.0 1.8n 337 340 342 341
Numbers are based on the answer from the first-born twin in each twin pair
endogenous. I therefore reran my regressions of the effect of schooling on self-reported health, chronic conditions, and exercise, excluding twin pairs thatreported large differences along the lines discussed above. Thus, I removedtwin pairs, where at least one twin reported that they never went to thesame classroom, never dressed the same, never had the same friends, andwere always treated differently by their parents. Table 4 first show descriptivestatistics on these variables. As revealed by the table, most twins reportedbeing rather similar across these dimensions, but this does not exclude thepossibility that the previous results were driven mainly by the small fractionof twins who were rather dissimilar.
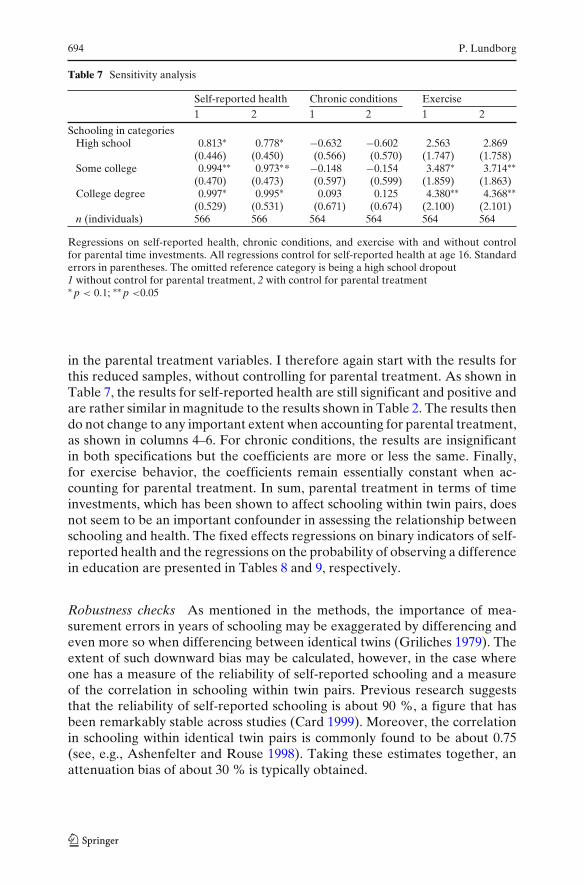
In Table 5, I show the results for self-reported health, when excludingdissimilar twins. The estimated coefficients of the education dummies arenow similar in magnitude but are somewhat less precisely estimated. Forchronic conditions, however, the schooling dummies are now much smaller inmagnitude and are no longer significant, although still having negative signs.In the model of exercise behavior, the magnitude of the coefficients measuringcompletion of high school and having some college are very similar in mag-nitude but are much less precisely measured due to the smaller sample size.
Table 5 Sensitivity analysis
Self-reported health Chronic conditions Exercise
Schooling in categoriesHigh school 0.982∗ −0.632 2.349
(0.554) (0.674) (2.140)Some college 0.999∗ −0.024 3.287
(0.566) (0.689) (2.185)College degree 1.120∗ −0.023 1.920
(0.650) (0.792) (2.510)n (individuals) 504 502 500
Twin-fixed effects regressions on self-reported health, the number of chronic conditions, andexercise, where twins who faced very different early life conditions are excluded from the analyses.All regressions in the table are estimated with twin-pair fixed effects and control for self-reportedhealth at age 16. Standard errors in parentheses. The omitted reference category is being a highschool dropout∗ p < 0.1
692 P. Lundborg
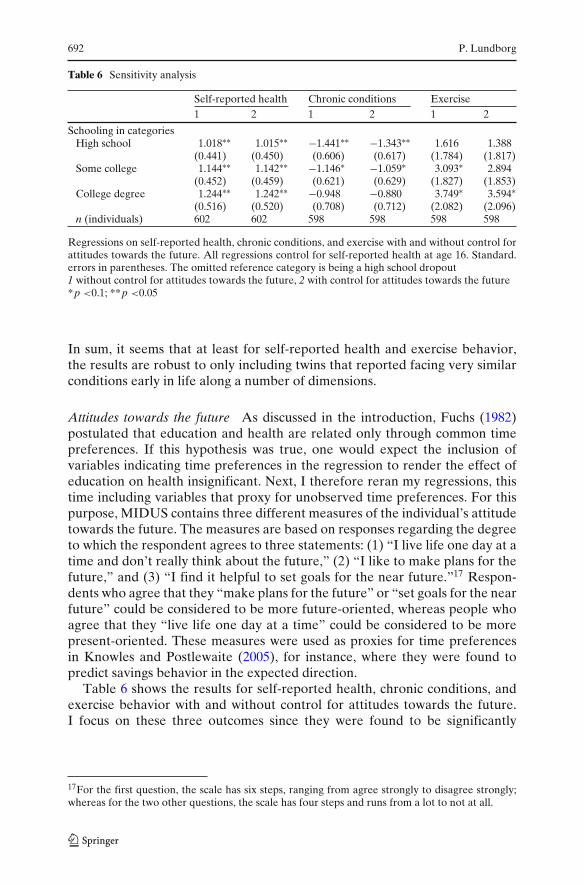
Table 6 Sensitivity analysis
Self-reported health Chronic conditions Exercise1 2 1 2 1 2
Schooling in categoriesHigh school 1.018∗∗ 1.015∗∗ −1.441∗∗ −1.343∗∗ 1.616 1.388
(0.441) (0.450) (0.606) (0.617) (1.784) (1.817)Some college 1.144∗∗ 1.142∗∗ −1.146∗ −1.059∗ 3.093∗ 2.894
(0.452) (0.459) (0.621) (0.629) (1.827) (1.853)College degree 1.244∗∗ 1.242∗∗ −0.948 −0.880 3.749∗ 3.594∗
(0.516) (0.520) (0.708) (0.712) (2.082) (2.096)n (individuals) 602 602 598 598 598 598
Regressions on self-reported health, chronic conditions, and exercise with and without control forattitudes towards the future. All regressions control for self-reported health at age 16. Standard.errors in parentheses. The omitted reference category is being a high school dropout1 without control for attitudes towards the future, 2 with control for attitudes towards the future*p <0.1; **p <0.05
In sum, it seems that at least for self-reported health and exercise behavior,the results are robust to only including twins that reported facing very similarconditions early in life along a number of dimensions.
Attitudes towards the future As discussed in the introduction, Fuchs (1982)postulated that education and health are related only through common timepreferences. If this hypothesis was true, one would expect the inclusion ofvariables indicating time preferences in the regression to render the effect ofeducation on health insignificant. Next, I therefore reran my regressions, thistime including variables that proxy for unobserved time preferences. For thispurpose, MIDUS contains three different measures of the individual’s attitudetowards the future. The measures are based on responses regarding the degreeto which the respondent agrees to three statements: (1) “I live life one day at atime and don’t really think about the future,” (2) “I like to make plans for thefuture,” and (3) “I find it helpful to set goals for the near future.”17 Respon-dents who agree that they “make plans for the future” or “set goals for the nearfuture” could be considered to be more future-oriented, whereas people whoagree that they “live life one day at a time” could be considered to be morepresent-oriented. These measures were used as proxies for time preferencesin Knowles and Postlewaite (2005), for instance, where they were found topredict savings behavior in the expected direction.
Table 6 shows the results for self-reported health, chronic conditions, andexercise behavior with and without control for attitudes towards the future.I focus on these three outcomes since they were found to be significantly
17For the first question, the scale has six steps, ranging from agree strongly to disagree strongly;whereas for the two other questions, the scale has four steps and runs from a lot to not at all.
The health returns to schooling—what can we learn from twins? 693
associated with education, as shown in Tables 2 and 3. In the regressions, Iuse the answer to the question regarding to what extent the respondent agreeswith the statement that he/she lives life 1 day at a time since the results usingthe other measures were similar.18 It is also important to note that the samplesizes are reduced due to missing data in the attitude questions. For assessingthe influence of my proxy for time preferences, the relevant comparison is thusthe results with and without controls in these reduced samples.
Starting with self-reported health, the effect of education on health issignificant and similar in magnitude in both the specifications excluding andincluding my measure of time preferences. The point estimates also remainvery stable when analyzing chronic conditions and exercise behavior andaccounting for differences in time preferences. No support is thus found forthe Fuchs hypothesis that unobserved time preferences explain the correlationbetween education and health. The possibility of course remains that myproxies for time preferences are poor, but in that respect, it should be notedthat two out of the three measures of time preferences are significantly relatedto the health outcomes in the expected direction.19
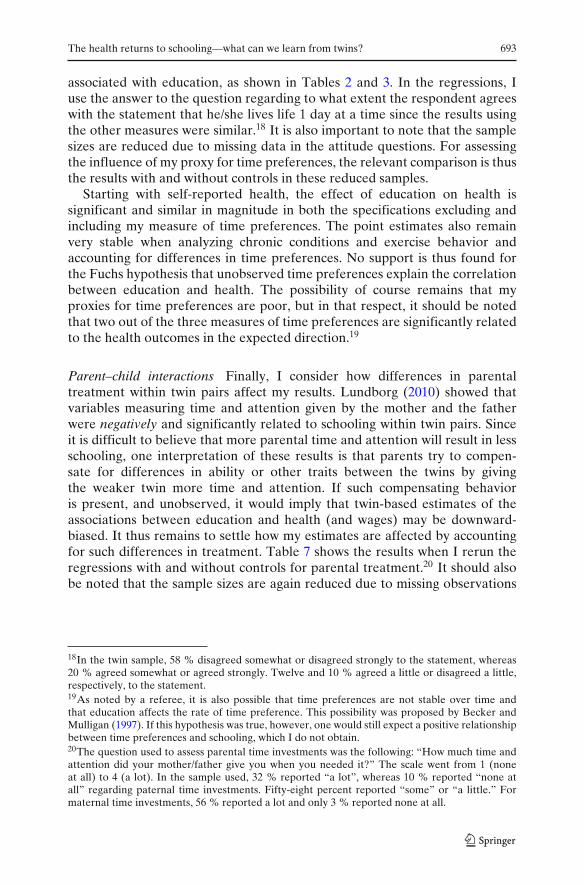
Parent–child interactions Finally, I consider how differences in parentaltreatment within twin pairs affect my results. Lundborg (2010) showed thatvariables measuring time and attention given by the mother and the fatherwere negatively and significantly related to schooling within twin pairs. Sinceit is difficult to believe that more parental time and attention will result in lessschooling, one interpretation of these results is that parents try to compen-sate for differences in ability or other traits between the twins by givingthe weaker twin more time and attention. If such compensating behavioris present, and unobserved, it would imply that twin-based estimates of theassociations between education and health (and wages) may be downward-biased. It thus remains to settle how my estimates are affected by accountingfor such differences in treatment. Table 7 shows the results when I rerun theregressions with and without controls for parental treatment.20 It should alsobe noted that the sample sizes are again reduced due to missing observations
18In the twin sample, 58 % disagreed somewhat or disagreed strongly to the statement, whereas20 % agreed somewhat or agreed strongly. Twelve and 10 % agreed a little or disagreed a little,respectively, to the statement.19As noted by a referee, it is also possible that time preferences are not stable over time andthat education affects the rate of time preference. This possibility was proposed by Becker andMulligan (1997). If this hypothesis was true, however, one would still expect a positive relationshipbetween time preferences and schooling, which I do not obtain.20The question used to assess parental time investments was the following: “How much time andattention did your mother/father give you when you needed it?” The scale went from 1 (noneat all) to 4 (a lot). In the sample used, 32 % reported “a lot”, whereas 10 % reported “none atall” regarding paternal time investments. Fifty-eight percent reported “some” or “a little.” Formaternal time investments, 56 % reported a lot and only 3 % reported none at all.
694 P. Lundborg
Table 7 Sensitivity analysis
Self-reported health Chronic conditions Exercise1 2 1 2 1 2
Schooling in categoriesHigh school 0.813∗ 0.778∗ −0.632 −0.602 2.563 2.869
(0.446) (0.450) (0.566) (0.570) (1.747) (1.758)Some college 0.994∗∗ 0.973∗* −0.148 −0.154 3.487∗ 3.714∗∗
(0.470) (0.473) (0.597) (0.599) (1.859) (1.863)College degree 0.997∗ 0.995∗ 0.093 0.125 4.380∗∗ 4.368∗∗
(0.529) (0.531) (0.671) (0.674) (2.100) (2.101)n (individuals) 566 566 564 564 564 564
Regressions on self-reported health, chronic conditions, and exercise with and without controlfor parental time investments. All regressions control for self-reported health at age 16. Standarderrors in parentheses. The omitted reference category is being a high school dropout1 without control for parental treatment, 2 with control for parental treatment∗ p < 0.1; ∗∗ p <0.05
in the parental treatment variables. I therefore again start with the results forthis reduced samples, without controlling for parental treatment. As shown inTable 7, the results for self-reported health are still significant and positive andare rather similar in magnitude to the results shown in Table 2. The results thendo not change to any important extent when accounting for parental treatment,as shown in columns 4–6. For chronic conditions, the results are insignificantin both specifications but the coefficients are more or less the same. Finally,for exercise behavior, the coefficients remain essentially constant when ac-counting for parental treatment. In sum, parental treatment in terms of timeinvestments, which has been shown to affect schooling within twin pairs, doesnot seem to be an important confounder in assessing the relationship betweenschooling and health. The fixed effects regressions on binary indicators of self-reported health and the regressions on the probability of observing a differencein education are presented in Tables 8 and 9, respectively.
Robustness checks As mentioned in the methods, the importance of mea-surement errors in years of schooling may be exaggerated by differencing andeven more so when differencing between identical twins (Griliches 1979). Theextent of such downward bias may be calculated, however, in the case whereone has a measure of the reliability of self-reported schooling and a measureof the correlation in schooling within twin pairs. Previous research suggeststhat the reliability of self-reported schooling is about 90 %, a figure that hasbeen remarkably stable across studies (Card 1999). Moreover, the correlationin schooling within identical twin pairs is commonly found to be about 0.75(see, e.g., Ashenfelter and Rouse 1998). Taking these estimates together, anattenuation bias of about 30 % is typically obtained.
The health returns to schooling—what can we learn from twins? 695
To obtain an estimate of the reliability ratio, previous studies have exploiteddata where several measures of the schooling of the respondent are given.Often, this has been a measure given by the co-twin (see, e.g., Ashenfelterand Rouse 1998). While I do not have access to such a measure, I do havea second measure of the respondent’s schooling at the follow-up survey in2004. The correlation between these measures would suggest a reliability ratioof 0.90, being very much in line with previous estimates.21,22 The estimatedcorrelation in years of schooling within twin pairs in MIDUS is 0.72, which isalso rather similar to the figures obtained in previous twin studies, such as thatof Ashenfelter and Rouse (1998) and Amin et al. (2010). Taken together withthe estimated reliability ratio, this indicates that the twin FE estimator is biaseddownward by about 36 %. Assuming reliability ratios of 0.85 or 0.95 instead,the downward bias would be 53 and 18 %, respectively. This suggests that thereason why my estimates for years of schooling are not significant may havesomething to do with measurement error problems.
Griliches (1979) showed that the downward bias in the estimated returnsto education becomes more severe the greater the correlation in education isbetween the twins. Since this correlation is stronger for monozygotic (MZ)twins than DZ (dizygotic) twins, it therefore becomes problematic to comparethe effects of education on health for these two groups, as done by Fujiwaraand Kawachi (2009), for instance. The reason is that any difference couldsimply reflect the more severe downward bias in the results for the MZ twinscompared to the results for the DZ twins. One could therefore not interpretany smaller or nonexisting effects among the MZ twins in comparison to theDZ twins as evidence that genetic factors were responsible for the significanteffect obtained among the DZ twins, as done by Fujiwara and Kawachi (2009).Therefore, I do not perform any analyses using the sample of DZ twins.
For the dummy variables indicating schooling categories, measurementerrors are nonclassical. The reason is that individuals in the lowest categorycannot underreport the education level, whereas individuals in the highest cat-egory cannot overreport (Aigner 1973). With nonclassical measurement error,one cannot generally sign the bias in the estimates. It should be noted thatdegrees are, in general, much more accurately reported than years of schoolingthough (Kane et al. 1999).
One source of measurement error will be respondents who are students atthe time of the interview, as argued in Section 3. I therefore reran my analysis
21Not all twins participated in the follow-up survey and my estimate is based on a sample of 541identical twins.22One worry would be that the reliability ratio varies by the level of education. I thereforeestimated the reliability ratio separately for low-educated (less than 13 years of schooling) andhigh-educated (more than 12 years of schooling). The estimated reliability ratios were 0.93 and0.90, respectively, causing no concern about heterogeneity in reliability ratios by education. Usingdifferent cutoffs for defining low and high-educated did not change the results.
696 P. Lundborg
on self-reported health, this time excluding the seven twins who were part-timestudents at the moment of the interview. This hardly changed the point esti-mates at all, and they were still significant (results available on request).
6 Conclusion and discussion
In this paper, I show that relative to high school dropouts, people withgreater schooling are significantly healthier, as measured through self-reportedhealth and chronic conditions, and perform exercise more often. Beyondcompleting high school, however, additional schooling does not generate anyadditional health gains. These results were based on a twin-differences design,netting out the influence of genetics and family endowments. When measuringschooling through years of schooling, point estimates were similar in boththe twin-differences model and the OLS model for self-reported health, butinsignificant in the former case.
While I found schooling to be significantly associated with physical exercise,no corresponding effect was obtained for two of the most common causes ofpreventable deaths in the USA; smoking and body weight. This would suggestthat the association between education and these latter two factors may arisemainly through the influence of unobserved family endowments. In addition,this would suggest that the effect of education on health does not mainlyarise through body size and smoking. Instead, other factors, such as betteraccess to the healthcare system, better access to health information, and betteradherance to health treatments, may explain the positive effect of education.It should be noted, though, that the there is rather mixed evidence to dateregarding the causal effect of education on smoking and body size, and moreresearch is clearly needed.
My twin-differences estimates would still be biased if there are twin-specificunobserved factors that relate to both schooling and health. I therefore ex-ploited the rich and unique MIDUS data on the early life conditions of twinsand showed that my results were relatively robust to accounting for some of thefactors that has been shown in a previous study to predict schooling differencesin twins, such as parental treatment. For chronic conditions, however, the re-sults were weakened when restricting the sample to twins with very similar earlylife conditions. On the other hand, I also showed that the effect of schooling onself-reported health, chronic conditions, and exercise behaviors did not changemuch when I accounted for differences in attitudes towards the future withintwin pairs. Thus, I found no support for the famous Fuchs (1982) hypothesis.
The finding that stands out clearest in the paper is the effect of education onself-reported health. This result survived all sensitivity checks, and the fixedeffects results even exceeded the cross-sectional OLS estimates. This begsthe question of why the strongest result is found for self-reported health?First of all, note that self-reported health is the broadest outcome measureof the ones used in this paper. Yet, there is consensus that the measure isinformative, in the sense that it is a strong predictor of later-life mortality
The health returns to schooling—what can we learn from twins? 697
and morbidity (Idler and Benyamini 1997). This suggests that the other healthmeasures, such as chronic conditions and BMI, to a lesser extent, capturedimensions of health affected by education. Also, certain measures reflectedhealth inputs rather than health outcomes, such as smoking. This suggests thatsmoking as a health input is not affected by education in a causal sense. On theother hand, the finding that education affected exercise behavior in a positivedirection suggests that part of the effect of education runs through the choiceof health inputs rather than only through more efficient use of given healthinputs. Yet, the effect of education on self-reported health was only marginallyaffected when controlling for exercise behavior. There may of course existother important health inputs that are not covered in the data available inMIDUS and that would have explained why education has such a strong effecton self-reported health.
The subjective role of self-reported health may also play a role in explainingthe strong effect of education on self-reported health. Note that among thevarious outcome measures used, self-reported health is the most subjectiveone. If twins tend to compare their self-reported health to each other and havesimilar views of what self-reported health means, this will make the subjectivenature of self-reported health less problematic compared to the case when self-reported health is compared between unrelated individuals.23 This will alsoserve, paradoxically, to reduce the influence of measurement errors involvedin the measure of self-reported health. It seems plausible that this is also one ofthe explanations why the twin-fixed effects estimates for self-reported healthcome out as greater in magnitude than the corresponding cross-sectional OLSestimates.
To conclude, my findings provide some evidence consistent with the ideathat schooling has a causal effect on health. This is in line with the resultsfrom a number of recent studies, using alternative research designs, such asIV, and examining various health outcomes, such as mortality, child health, andself-assessed health (Currie and Moretti 2003; Lleras-Muney 2005; Oreopoulos2006). However, my findings at the same time differ from some of the resultsobtained in recent twin studies. In Fujiwara and Kawachi (2009), for instance,no significant effect of education on self-reported health was obtained. Theyonly considered years of schooling, however, whereas my results suggest thatthere may be important nonlinearities in the relation between education andhealth. My results also differ from those of Behrman et al. (2011), for instance,where no significant effect of schooling on mortality or hospitalizations wasobtained in a Danish context. The difference in results may, however, reflectdifferences in the institutional context between Denmark and the USA and inthe outcome variables studied. For instance, in Denmark, there is universalhealth insurance coverage, which is not the case in the USA.24 Also, both
23I thank an anonymous referee for suggesting this possibility.24In Lundborg (2008), however, no effect of education on health insurance participation was foundusing the MIDUS twin sample.
698 P. Lundborg
mortality and morbidity constitute hard end points and may not capture thesame elements of health as those captured in other health measures, such asself-reported health. Finally, I found no significant effects of education on BMIor overweight, whereas Webbink et al. (2010) found a significant and negativeeffect among males.
The recent findings of a possible causal effect of education on healthare very relevant for the current policy debate about the future of thehealth care systems. If schooling has a causal effect on health, policies thatstrengthen the incentives to obtain a higher education may have beneficialeffects for both the productivity of nations and for population health. Myresults suggest that that policies that encourage high school completion mayhave particularly beneficial effects. Such policies may include targeted inter-ventions towards students lagging behind and a more generous student loanprogram in order to lessen the financial burden on lower- and middle-incomefamilies.
Acknowledgements The author would like to thank the seminar participants at the AmericanSociety of Health Economists, European Association of Labour Economists, Erasmus University,European Economic Association, University of Mannheim, Uppsala University, Lund University,and Swedish Institute for Social Research for their valuable comments and suggestions.
Appendix
Table 8 Fixed effects regressions on binary indicators of self-reported health
> 3 > 4 > 5 > 6 > 7 > 8 >9
Fixed effects resultsHigh school 0.058∗∗ 0.103∗ 0.182∗∗ 0.236∗∗ 0.131 0.193 0.066
(0.029) (0.061) (0.089) (0.114) (0.142) (0.152) (0.112)Some college 0.069∗∗ 0.161∗∗ 0.197∗∗ 0.273∗∗ 0.114 0.345∗∗ 0.056
(0.030) (0.063) (0.092) (0.118) (0.146) (0.157) (0.116)College degree 0.067∗∗ 0.150∗∗ 0.194∗ 0.191 0.018 0.564∗∗∗ 0.083
(0.034) (0.072) (0.105) (0.135) (0.167) (0.179) (0.133)Pooled OLS results
High school 0.014 0.028 0.114∗∗ 0.112∗ 0.049 0.182∗∗ 0.062(0.014) (0.029) (0.047) (0.062) (0.081) (0.082) (0.056)
Some college 0.020 0.060∗∗ 0.160∗∗∗ 0.115∗ 0.025 0.180** 0.035(0.014) (0.029) (0.046) (0.061) (0.081) (0.082) (0.056)
College degree 0.025∗ 0.060∗∗ 0.189∗∗∗ 0.177∗∗∗ 0.091 0.257∗∗∗ 0.044(0.014) (0.029) (0.047) (0.062) (0.081) (0.082) (0.056)
n (individuals) 624 624 624 624 624 624 624
Various columns show regressions on binary variables indicating if the individual’s self-reportedhealth various threshold values of 3–9. Models are estimated with fixed effects linear probabilitymodels. The omitted reference category is being a high school dropout∗ p <0.1; ∗∗ p <0.05; ∗∗∗ p <0.01
The health returns to schooling—what can we learn from twins? 699
Table 9 Regressions on the probability of observing a difference in education
1 2 3
High school (father) −0.047 −0.064(0.066) (0.072)
Some college (father) −0.065 −0.065(0.080) (0.085)
College degree (father) −0.134∗ −0.115(0.080) (0.087)
High school (mother) 0.032 0.064(0.062) (0.068)
Some college (mother) −0.016 0.021(0.084) (0.089)
College degree (mother) −0.156∗ −0.099(0.093) (0.102)
n (twin pairs) 312 312 312
Models are estimated using linear probability models. Regressions control for race and gender.The omitted reference category is being a high school dropout. Standard errors in parentheses1 effect of paternal schooling on the probability of observing a difference in schooling within a twinpair, 2 corresponding regression for maternal schooling, 3 effect when both paternal and maternalschooling is included∗ p <0.1
References
Aigner D (1973) Regression with a binary independent variable subject to errors of observation.J Econom 1:49–60
Amin V, Behrman J, Spector TD (2010) Does more schooling improve health behaviours andhealth outcomes? Evidence from U.K. Twins Working paper: Royal Holloway
Amin V (2011) Returns to education: evidence from U.K. twins: comment. Am Econ Rev101:1629–35
Arendt JN (2005) Does education cause better health? A panel data analysis using school reformsfor identification. Econ Educ Rev 24:149–160
Ashenfelter O, Krueger A (1994) Estimating the returns to schooling using a new sample of twins.Am Econ Rev 84:1157–1174
Ashenfelter O, Rouse C (1998) Income, schooling and ability: evidence from a new sample ofidentical twins. Q J Econ 113:253–284
Becker GS, Mulligan CB (1997) The endogenous determination of time preference. Q J Econ112:729–758
Behrman JR, Rosenzweig MR (2004) Returns to birthweight. Rev Econ Stat 86:586–601Behrman JR, Kohler H, Myrup-Jensen V et al (2011) Does more schooling reduce hospitalization
and delay mortality? New evidence based on Danish twins. Demography 48:1347–1375Behrman JR, Li H, Suen W, Yang Z, Zhang J (2006) Does more schooling improve health
behaviors and health outcomes? Evidence from Chinese twins (Working paper). Hong Kong:Chinese University of Hong Kong
Belman D, Heywood J (1991) Sheepskin effects in the return to education. Rev Econ Stat 73:720–724
Black SE, Devereux PJ, Salvanes KG (2007) From the cradle to the labor market? The effect ofbirth weight on adult outcomes. Q J Econ 122:409–439
Bonjour D, Cherkas L, Haskel J et al (2003) Returns to education: evidence from UK twins. AmEcon Rev 93:1799–1812
700 P. Lundborg
Brim OG, Baltes PB, Bumpass LL et al (2003) National survey of midlife development in theUnited States (MIDUS), 1995–1996 [Computer file]. 2nd ICPSR version. Ann Arbor, MI:DataStat, Inc./Boston, MA: Harvard Medical School, Dept. of Health Care Policy [produc-ers], 1996. Ann Arbor, MI: Inter-university Consortium for Political and Social Research[distributor]
Bound J, Solon G (1999) Double trouble: on the value of twin-based estimation of the return toschooling. Econ Educ Rev 18:169–182
Card D (1999) The causal effect of education on earnings. In: Ashenfelter O, Card D (eds)The handbook of labor economics, Volume 3A. Elsevier Science, Amsterdam, pp 1801–1859
Chou S, Liu J, Grossman M et al (2010) Parental education and child health: evidence from anatural experiment in Taiwan. Am Econ J: Applied 2: 33–61
Currie J, Moretti E (2003) Mother’s education and the intergenerational transmission of humancapital: evidence from college openings. Q J Econ 118:1495–1532
de Walque D (2007) Does education affect smoking behavior? Evidence using the Vietnam draftas an instrument for college education. J Health Econ 26:877–895
Fuchs VR. (1982) Time preference and health: an exploratory study. In: Fuchs VR (ed) Economicaspects of health. University of Chicago Press, Chicago, pp 93–120
Fujiwara T, Kawachi I (2009) Is education causally related to better health? A twin fixed-effectstudy in the USA. Int J Epidemiol 38:1310–1322
Griliches Zvi (1979) Sibling models and data in economics: beginnings of a survey. J Polit Econ87:37–64
Grimard F, Parent D (2007) Education and smoking: were Vietnam War draft avoiders also morelikely to avoid smoking? J Health Econ 26:896–926
Groot W (2000) Adaption and scale of references bias in self-assessments of quality of life. JHealth Econ 19:403–420
Grossman M (1972) On the concept of health capital and the demand for health. J Polit Econ80:223–55
Holmlund H, Lindahl M, Plug E (2011) The causal effect of parents’ schooling on children’sschooling: a comparison of estimation methods. J Econ Lit 49:615–51
Hungerford T, Solon G (1987) Sheepskin effects in the return to education. Rev Econ Stat 69:175–177
Idler EI, Benyamini Y (1997) Self-rated health and mortality: a review of twenty-seven communitystudies. J Health Soc Behav 38:2137
Isacsson G (2004) Estimating the economic returns to educational levels using data on twins. JAppl Econ 99:99–119
Jaeger DA (1997) Reconciling the old and new census bureau education questions: recommenda-tions for researchers. J Bus Econ Stat 15:300–309
Jürges H, Reinhold S, Salm M (2011) Does schooling affect health behavior? Evidence from theeducational expansion in Western Germany. Econ Educ Rev 30:862–872
Kane TJ, Rouse C, Staiger D (1999) Estimating returns to schooling when schooling is mismea-sured. National Bureau of Economic Research Working Paper No. 7235
Kenkel D (1991) Health behavior, health knowledge, and schooling. J Polit Econ 99:287–305Kenkel D, Lillard D, Mathios A (2006) The roles of high school completion and GED receipt in
smoking and obesity. J Labor Econ 24:635–660Knowles J, Postlewaite A (2005) Wealth inequality and parental transmission of savings behavior.
Mimeo, University of PennsylvaniaLleras-Muney A (2005) The relationship between education and adult mortality in the U.S. Rev
Econ Stud 72:189–221Lochner L (2011) Non-production benefits of education: crime, health, and good citizenship.
NBER Working Paper No. 16722Lundborg P (2007) Smoking, information sources, and risk perceptions. New evidence on swedish
data. J Risk Uncertain 34:217–240Lundborg P (2008) The health returns to education—what can we learn from twins? IZA Working
Paper 3399Lundborg P (2010) Why are identical twins not identical? Parental treatment and schooling among
monozygotic twins. Mimeo, Department of Economics, Lund UniversityNichols RC, Bilbro WC (1966) The diagnosis of twin zygosity. Acta Genet 16:265–275
The health returns to schooling—what can we learn from twins? 701
Oreopoulos P (2006) Estimating average and local average treatment effects of education whencompulsory school laws really matter. Am Econ Rev 96:152–175
Powdthavee N (2010) Does education reduce the risk of hypertension? Estimating the biomarkereffect of compulsory schooling in England. J Hum Cap 4:173–202
Pronzato C (2012) An examination of paternal and maternal intergenerational transmission ofschooling. J Popul Econ 25:591–608
Rosenzweig MR, Schultz TP (1982) The behavior of mothers as inputs to child health: the determi-nants of birth weight, gestation, and rate of fetal growth. In: Fuchs VR (ed) Economic aspectsof health. University of Chicago Press, Chicago, pp 53–92
Royer H (2009) Separated at girth: US twin estimates of the effects of birth weight. Am Econ JAppl Econ 1:49–85
Webbink D, Martin NG, Visscher PM (2010) Does education reduce the probability of beingoverweight? J Health Econ 29:29–38