the hbsc ireland trends report: child health behaviours ... · the hbsc ireland trends report...
TRANSCRIPT

The HBSC Ireland Trends Report 1998–2010:Child Health Behaviours, Outcomes and ContextsSeptember2013
Aoife Gavin, Michal Molcho, Colette Kelly and Saoirse Nic Gabhainn

HBSCIrelandTrends2013
ii
This report is available online at: www.nuigalway.ie/hbsc/documents/hbsctrends2013
© Copyright 2013Health Promotion Research Centre, National University of Ireland, Galway.Department of Health, Government of Ireland, Dublin.
Published by the Department of Health and National University of Ireland, Galway.
ISBN: 978-1-908358-16-5

iii
Acknowledgements..................................... iv
Foreword........................................................v
EXECUTIVE.SUMMARY........................... 1
Health.Behaviours........................................ 1
Health.Outcomes......................................... 2
Social.Contexts.of.Children’s.Lives............. 3
INTRODUCTION...................................... 5
METHODOLOGY...................................... 7
3.1. Overview............................................... 7
3.2. Social.Class........................................... 9
3.3. Analyses................................................ 9
3.3.1 Reporting trends ............................93.3.2 Statistical analysis ...........................93.3.3 International trends .......................9
HEALTH.BEHAVIOURS......................... 12
4.1. Health.Risk.Behaviours..................... 12
4.1.1 Current smoker ............................ 124.1.2 Age of first cigarette .................... 144.1.3 Ever been drunk........................... 164.1.4 Cannabis use in the last 12 months
184.1.5 Bully others ................................... 204.1.6 On a diet ....................................... 22
4.2. Positive.Health.Behaviours............... 24
4.2.1 Fruit consumption ...................... 244.2.2 Tooth brushing ............................ 264.2.3 Use of seatbelt .............................. 284.2.4 Exercise 4+ times a week .......... 30
HEALTH.OUTCOMES............................ 32
5.1. Physical.Health.Outcomes................ 32
5.1.1 Headache ...................................... 325.1.2 Feeling low .................................... 345.1.3 Times injured ............................... 36
5.2. Positive.Health.Outcomes................. 38
5.2.1 Self-rated health ........................... 385.2.2 Happy with life ............................ 405.2.3 Life satisfaction ............................ 42
CONTEXTS.OF.CHILDREN’S.LIVES... 44
6.1. Family.................................................. 44
6.1.1 Communication with mother ... 446.1.2 Communication with father ..... 466.1.3 Live with both parents................ 48
6.2. School.................................................. 50
6.2.1 Liking School ............................... 506.2.2 Organising school events ........... 526.2.3 Pressured by school work .......... 546.2.4 Teachers treat students fairly .... 56
6.3. Peers.................................................... 58
6.3.1 Close friends of the same sex .... 586.3.2 Four or more evenings with
friends ............................................ 606.3.3 E-communication (Electronic
Media Communication) ............ 626.3.4 Talk to friend of same sex .......... 64
6.4. Locality............................................... 66
6.4.1 Feel safe in local area ................... 666.4.2 Good places to go to spend free
time ................................................ 686.4.3 Can ask for help or a favour from
neighbours .................................... 70
Contents
APPENDICES...............................................78
Trends data for a further 46 HBSC indicators are included in the appendices.

HBSCIrelandTrends2013
iv
AcknowledgementsHBSC 2010 was conducted in the Health Promotion Research Centre under the direction of Dr. Saoirse Nic Gabhainn, Dr. Michal Molcho and Dr. Colette Kelly, and funded by the Health Promotion Policy Unit of the Department of Health. HBSC 2006, 2002 and 1998 were also funded by the Department of Health and Children, Government of Ireland.
We acknowledge all the Parents and Children who consented and participated as well as the Management Authorities, Principals and Teachers in all schools who participated. We also acknowledge the contribution of the following team members and staff of the Health Promotion Research Centre: Ms. Viv Batt, Ms. Larri Walker, Ms. Mary Callaghan, Ms. Natasha Clarke, Mr. Jakub Gajewski, Ms. Lindsay Sullivan and Ms. Lydia Courtney.
We appreciate the contribution and support of the HBSC Ireland 2010 Advisory Committee: Mr. Robbie Breen (Department of Health), Ms. Annemarie Brooks (Department of Children and Youth Affairs), Mr. Seán Denyer (Health Service Executive), Dr. John Devlin (Department of Health), Dr. Sinead Hanafin (Department of Health / Children and Youth Affairs), Mr. Hugh Magee (Department of Health), Mr. Liam McCormack (Department of Health), Mr. Shay McGovern (Department of Health), Dr. Brian Neeson (Health Service Executive), Ms. Ursula O’Dwyer (Department of Health), Dr. Stephanie O’Keefe (Crisis Pregnancy Agency), Ms. Biddy O’Neill (Health Service Executive), Ms. Claire O’Reilly (Department of Health).
We would also like to thank all those who assisted in previous rounds of the HBSC Ireland survey (see www.nuigalway.ie/hbsc/members), and colleagues Professor Cecily Kelleher, Professor Sharon Friel, Professor Margaret Barry and Dr. Jane Sixsmith.
HBSC is an international study carried out in collaboration with WHO/EURO. The International Coordinator of HBSC is Professor Candace Currie (University of St. Andews), and the Data Bank Manager is Professor Oddrun Samdal (University of Bergen).
The 2010 survey was conducted by Principal Investigators in 43 countries and regions: Albania (Elizana Petrela), Armenia (Sergey G. Sargsyan), Austria (Rosemarie Felder-Puig), Belgium-Flemish (Carine Vereecken), Belgium-French (Danielle Piette), Bulgaria (Lidiya Vasileva), Canada (William Pickett), Croatia (Marina Kuzman), Czech Republic (Michal Kalman), Denmark (Pernille Due), England (Antony Morgan), Estonia (Katrin Aasvee), Finland ( Jorma Tynjälä), France (Emmanuelle Godeau), Germany (Petra Kolip), Greece (Anna Kokkevi), Greenland (Birgit Niclasen), Hungary (Ágnes Németh), Iceland (Thoroddur Bjarnason), Ireland (Saoirse Nic Gabhainn), Israel (Yossi Harel-Fisch), Italy (Franco Cavallo), Latvia (Iveta Pudule), Lithuania (Apolinaras Zaborskis), Luxembourg (Yolande Wagener), Macedonia, TYFR (Lina Kostorova Unkovska), Malta (Maryanne Massa), Netherlands (Wilma Vollebergh), Norway (Oddrun Samdal), Poland ( Joanna Mazur), Portugal (Margarida Gaspar De Matos), Romania (Adriana Baban), Russia (Alexander Malinin), Scotland (Candace Currie), Slovak Republic (Andrea Madarasova Geckova), Slovenia (Helena Jericek), Spain (Carmen Moreno Rodriguez), Sweden (Lilly Eriksson), Switzerland (Emmanuel Kuntsche), Turkey (Oya Ercan), Ukraine (Olga Balakireva), United States (Ron Iannotti), Wales (Chris Roberts). For more details and information on Principal Investigators for previous study rounds see www.hbsc.org.

v
ForewordThis report explores the trends in the health and well-being of children in Ireland between 1998 and 2010. The Health Behaviour in School-aged Children (HBSC) Ireland study has been collecting data from school-aged children aged 10-17 over a period of 12 years. The most recent data collection occurred in 2010 and was the 4th survey cycle of the study in Ireland. Data were collected in 1998, 2002, 2006 and 2010. This report reviews the self-reported health status and behaviours of children in Ireland over this time period in relation to key indicators: the contexts of their lives, health behaviours and health outcomes.
It is encouraging to note that the number of children who have smoked tobacco has decreased, similar to the trend in alcohol consumption and use of cannabis. This is a step in the right direction and I hope to see this continue for the good of all our children.
Also included are internationally comparative trend data where the overall relative ranking of children in Ireland is compared to those from 27 other countries and regions that also collected data between 1998 and 2010.
The overall study aims are to gain insight into and increase our understanding of young people’s health and well-being, health behaviours and their social context. As well as serving a monitoring and knowledge-generating function, one of the key objectives of HBSC is to inform policy and practice.
The trends identified here tells us where policy needs to adjust and focus so as to assist Government in addressing the behavioural trends that are a source of concern, or indeed to prevail with existing policy where encouraging positive trends have been reported.
Overall the survey provides us with essential lifestyle information which my Department will use in promoting healthy lifestyles in health and other sectors.
This is what Healthy Ireland is about – taking important steps towards making Ireland a healthier nation. Appropriate health indicators on the health status of children in Ireland are what we require.
I wish to acknowledge the work of the Health Promotion Research Centre at the National University of Ireland, Galway in compiling this study on behalf of the Department.
Dr. James Reilly Minister for Health

HBSCIrelandTrends2013
vi
1

1
EXECUTIVE SUMMARY
The Health Behaviour in School-aged Children (HBSC) trends report presents findings on indicators of children’s health and well-being between 1998 and 2010. The report is divided into three main sections: health behaviours; health outcomes and contexts of children’s lives. In general, this report presents findings that highlight positive changes to children’s lives across each of these three areas.
Health BehavioursOverall, there are encouraging trends in relation to both health risk behaviours and positive health behaviours. There is an overall significant decrease in the percentage of young people who are engaging in risky health behaviours, specifically substance use. However, particular attention should be given to girls and those from lower social classes who are consistently more likely to report engagement in these behaviours. There is an overall positive trend in young people reporting daily or more fruit consumption, tooth brushing twice daily and always wearing a seatbelt. However, fewer boys aged 15-17 consistently report seatbelt use and tooth brushing and fewer of those lower social class groups report consuming fruit daily or more. In addition, the percentage of young people who report exercising four or more times a week has decreased between 1998 and 2010.
Table.1.1.. Summary.trends.in.health risk behaviours
INDICATOR SUMMARY
CurrentlysmokingBetween 1998 and 2010 there was a statistically significant decrease in the percentage of young people who reported that they currently smoke (21.2% in 1998 and 11.9% in 2010).
AgeoffirstcigaretteBetween 2002 and 2010 there was a statistically significant decrease in the percentage of young people who reported that they had their first cigarette at age 13 or younger (60.6% in 2002 and 48.9% in 2010).
EverbeendrunkBetween 1998 and 2010 there was a statistically significant decrease in the percentage of young people who reported they had ever been drunk (29.3% in 1998 and 28.3% in 2010).
Cannabisuselast12months
Between 1998 and 2010 there was a statistically significant decrease in the percentage of young people who reported cannabis use in the last 12 months (10.3% in 1998 and 8.3% in 2010).
Bullyothers
Between 1998 and 2010 there was a statistically significant decrease in the percentage of young people who reported they have bullied others, two more times, in the past couple of months (24.0% in 1998 and 16.4% in 2010).
OnadietBetween 2002 and 2010 there was a statistically significant increase in the percentage of young people who reported they are currently on a diet (13.1% in 2002 and 13.2% in 2010).
1

HBSCIrelandTrends2013
2
Table.1.2.. Summary.trends.in.positive health behaviours
INDICATOR SUMMARY
FruitconsumptionBetween 2002 and 2010 there was a statistically significant increase in the percentage of young people who reported consuming fruit more than once a day (18.0% in 2002 and 20.0% in 2010).
ToothbrushingBetween 1998 and 2010 there was a statistically significant increase in the percentage of young people who reported brushing their teeth more than once a day (57.5% in 1998 and 67.1% in 2010).
UseofseatbeltBetween 1998 and 2010 there was a statistically significant increase in the percentage of young people who reported always wearing a seatbelt when travelling by car (40.8% in 1998 and 81.6% in 2010).
Exercise4+timesaweekBetween 1998 and 2010 there was a statistically significant decrease in the percentage of young people who reported that they exercise four or more times a week (53.5% in 1998 and 50.5% in 2010).
Health OutcomesIn general, there are stable or positive trends noted for both the physical health outcomes and positive health outcomes presented in this report. There was a decrease in the percentage of young people who reported that they had a medically attended injury, and a statistically significant increase across all three positive health outcomes: self-rated health, reporting being happy with life and overall life satisfaction.
Table.1.3. Summary.trends.in.physical health outcomes
INDICATOR SUMMARY
HeadacheBetween 1998 and 2010 the percentage of young people who reported they had a headache at least weekly in the past 6 months remained stable (26.0% in 1998 and 26.5% in 2010
FeelinglowBetween 1998 and 2010 the percentage of young people who reported feeling low at least weekly in the past 6 months remained stable (22.5% in 1998 and 24.0% in 2010).
Timesinjured
Between 1998 and 2010 there was a statistically significant decrease in the percentage of young people who reported having been injured and had to be treated by a doctor or nurse in the last 12 months (40.0% in 1998 and 37.2% in 2010).

ExecutiveSummary
3
Table.1.4.. Summary.trends.in.positive health outcomes
INDICATOR SUMMARY
Self-ratedhealthBetween 2002 and 2010 there was a statistically significant increase in the percentage of young people who reported their health is ‘excellent’ (27.8% in 2002 and 32.7% in 2010).
HappywithlifeBetween 1998 and 2010 there was a statistically significant increase in the percentage of young people who reported they are happy with their life (88.6% in 1998 and 91.1% in 2010).
LifesatisfactionBetween 2002 and 2010 there was a statistically significant increase in the percentage of young people who reported high life satisfaction (75.1% in 2002 and 76.2% in 2010).
Social Contexts of Children’s LivesThis section reports trends on four social contexts of children’s lives: family, school, peers and their local area. In general, there are positive trends in all four contexts.
Table.1.5.. Summary.trends.in.family context
INDICATOR SUMMARY
Communicationwithmother
Between 1998 and 2010 there was a statistically significant increase in the percentage of young people who reported positive maternal communication (74.0% in 1998 and 81.7% in 2010).
Communicationwithfather
Between 1998 and 2010 there was a statistically significant increase in the percentage of young people who reported positive paternal communication (42.0% in 1998 and 59.8% in 2010).
LivingwithbothparentsBetween 1998 and 2010 there was a statistically significant decrease in the percentage of young people who reported that they currently live with both their mother and father (91.4% in 1998 and 73.7% in 2010).
Table.1.6.. Summary.trends.in.school context
INDICATOR SUMMARY
LikingschoolBetween 2002 and 2010 there was a statistically significant increase in the percentage of young people who reported that they like school (68.8% in 2002 and 70.9% in 2010).
OrganisingschooleventsBetween 2002 and 2010 there was a statistically significant increase in the percentage of young people who reported students in their school help to organise school events (55.8% in 2002 and 60.8% in 2010).
PressuredbyschoolworkBetween 1998 and 2010 there was a statistically significant increase in the percentage of young people who reported they feel pressured by school work (33.3% in 1998 and 41.1% in 2010).
Teacherstreatstudentsfairly
Between 1998 and 2010 there was a statistically significant increase in the percentage of young people who reported teachers in their school treat students fairly (55.4% in 1998 and 63.0% in 2010).

HBSCIrelandTrends2013
4
2Table.1.7.. Summary.trends.in.peer context
INDICATOR SUMMARY
Closefriendsofthesamesex
Between 2002 and 2010 the percentage of young people who reported having three or more friends of the same gender remained stable (89.6% in 2002 and 89.3% in 2010).
4+eveningswithfriendsBetween 1998 and 2010 there was a statistically significant increase in the percentage of young people who reported spending four or more evenings after school with friends (37.7% in 1998 and 38.7% in 2010).
E-communication
Between 2002 and 2010 there was a statistically significant increase in the percentage of young people who reported they talk to their friend(s) on the phone, send them text messages or have contact through the internet every day (30.9% in 2002 and 51.5% in 2010).
Communicationwithfriendofsamesex
Between 1998 and 2010 there was a statistically significant increase in the percentage of young people who reported positive communication with a friend of the same sex (79.8% in 1998 and 82.6% in 2010).
Table.1.8. Summary.trends.in.local area context
INDICATOR SUMMARY
FeelsafeinlocalareaBetween 2002 and 2010 the percentage of young people who reported always feeling safe in their local area remained stable (52.9% in 2002 and 53.5% in 2010).
Goodplacestospendfreetime
Between 2002 and 2010 there was a statistically significant increase in the percentage of young people who reported there are good places to spend free time (43.8% in 2002 and 51.2% in 2010).
Canaskneighboursforhelp
Between 2002 and 2010 there was a statistically significant increase in the percentage of young people who reported they can ask for help or a favour from their neighbours (74.5% in 2002 and 80.0% in 2010).
Trends data for a further 46 HBSC indicators are included in the appendices.
5
2 INTRODUCTION
This report explores the trends in the health and well-being of children in Ireland between 1998 and 2010. The Health Behaviour in School-aged Children (HBSC) Ireland study has been collecting data from school-aged children aged 10-17 over a period of 12 years. The most recent data collection took place in 2010 and was the 4th survey cycle of the study in Ireland. Data were collected in 1998, 2002, 2006 and 2010. To date HBSC Ireland has collected data from 39,915 school-aged children across the Republic of Ireland. This report reviews the self-reported health status and behaviours of children in Ireland over this time period in relation to key indicators: the contexts of their lives, health behaviours and health outcomes. For each indicator this report presents the data over time for both boys and girls, and where appropriate by age-group and social class. Also included are internationally comparative trend data where the overall relative ranking of children in Ireland is compared to those from 27 other countries and regions that also collected data between 1998 and 2010.
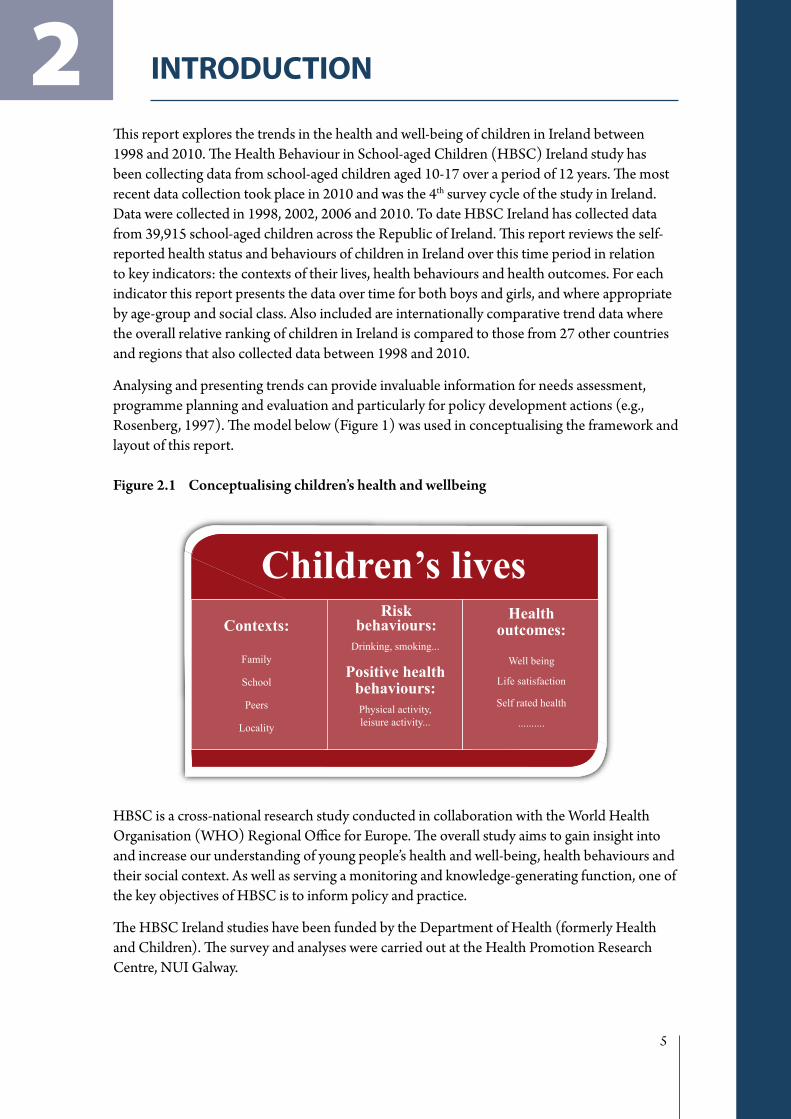
Analysing and presenting trends can provide invaluable information for needs assessment, programme planning and evaluation and particularly for policy development actions (e.g., Rosenberg, 1997). The model below (Figure 1) was used in conceptualising the framework and layout of this report.
Figure.2.1. Conceptualising.children’s.health.and.wellbeing
Children’s livesContexts:
Family
School
Peers
Locality
Riskbehaviours:
Drinking, smoking...
Positive healthbehaviours:
Physical activity,leisure activity...
Healthoutcomes:
Well being
Life satisfaction
Self rated health
..........
HBSC is a cross-national research study conducted in collaboration with the World Health Organisation (WHO) Regional Office for Europe. The overall study aims to gain insight into and increase our understanding of young people’s health and well-being, health behaviours and their social context. As well as serving a monitoring and knowledge-generating function, one of the key objectives of HBSC is to inform policy and practice.
The HBSC Ireland studies have been funded by the Department of Health (formerly Health and Children). The survey and analyses were carried out at the Health Promotion Research Centre, NUI Galway.

HBSCIrelandTrends2013
6
3

7
METHODOLOGY
3.1 OverviewThe HBSC survey is a WHO (Europe) collaborative survey. Principal investigators from all countries and regions co-operate in relation to survey content, methodology and timing, and an international protocol is developed. Strict adherence to the protocol is required for inclusion in the international database and this has been achieved for all four cycles of the HBSC study in Ireland.
In Ireland, sampling was conducted to be representative of the proportion of children in each geographical region. The objective was to achieve a nationally representative sample of school-aged children, and the procedures employed were consistent across all four HBSC Ireland surveys; 1998, 2002, 2006 and 2010.
Data from the most recent available census were employed to provide a picture of the population distribution across geographical regions. The sampling frame consisted of both primary and post-primary schools, lists of which were provided by the relevant Department of Education (formerly Education and Science). A two-stage process identified study participants. Individual schools within regions were first randomly selected and subsequently, class groups within schools were randomly selected for participation. In primary schools, classes from 3rd to 6th class groups were included, while in post-primary schools all classes, with the exception of Leaving Certificate groups were sampled.
School Principals were first approached by post and when positive responses were received, HBSC questionnaires in Irish or English were offered, along with blank envelopes to facilitate anonymity, parental consent forms, information sheets for teachers and classroom feedback forms. All returns were facilitated through the provision of FREEPOST envelopes. In order to maximise response rates, postal reminders were sent to schools, followed by telephone calls from research staff at the Health Promotion Research Centre, NUI Galway. Data entry was conducted according to the International HBSC protocol.
3

HBSCIrelandTrends2013
8
Table.3.1. Summary.of.methodological.approach.to.data.collection.across.the.four.HBSC.Ireland.surveys
2010 2006 2002 1998
Ethics
Full ethical approval was granted by the NUIG Research Ethics Committee.
Full ethical approval was granted by the NUIG Research Ethics Committee.
Full ethical approval was given by the Royal College of Physicians in Ireland
Full ethical approval was given by an Ad-hoc committee convened by the DOHC
PopulationSchool-going children aged 9-18.
School-going children aged 9-18 .
School-going children aged 10-17.
School-going children aged 9-17.
Sampling.Frame
Department of Education and Science school lists.
Department of Education and Science school lists.
Department of Education school lists.
Department of Education school lists.
Sample Cluster sample of students in classrooms.
Stratification Proportionate to the distribution of pupils across geographical regions.
Survey.instrument
Self-completion questionnaire.
Delivery/reminders
Post delivery via Principals and teachers, letter and telephone reminders.
Return Freepost addressed envelopes provided.
Response.Rate
67% of invited schools / 85% of students
63% of invited schools / 83% of students.
51% of invited schools / 82% of students
72% of invited schools / 89% of students
Obtained.Sample
256 schools / 16,060 pupils
215 schools / 10,334 pupils
176 schools / 8,424 pupils.
187 schools / 8,497 pupils
Data.Quality Data were entered according to HBSC international protocol
Details of the demographic representativeness of the samples can be found in the appendix.

Methodology
9
3.2 Social ClassSocial class is represented by SC 1-2, SC 3-4 and SC 5-6 corresponding to high, middle and low social class groups respectively. The categories used for social class are standard and determined by parental occupation. For this report, social class was determined by using the highest social class available for each respondent. This is similar to the approach used by the CSO where social class of dependents under 15 is determined by the highest social class in the house. Social class 1 represents professional occupations (e.g., solicitor, doctor), social class 2 represents managerial occupations (e.g., nurse, teacher), social class 3 represents non-manual occupations (e.g., sales person, office clerk), social class 4 represents skilled-manual occupations (e.g., hairdresser, carpenter), social class 5 represents semi-skilled occupation (e.g., post deliverers, driver) and social class 6 represents unskilled occupations (e.g., cleaner, labourer). The social class breakdown for each of the four survey years can be found in the appendix.
3.3 Analyses3.3.1 Reporting trends
In order to report trends, the question wording and response options must have remained consistent across at least three of the four surveys. For the indicators presented in this report data was available from either 1998-2010 or 2002-2010. A data file was prepared to facilitate analysing the data over time with analysis carried out using SPSS 20.0. Due to the cross-sectional nature of the HBSC survey it should be noted that the trends presented are not reporting change in the behaviour of individuals, but rather, a change of reported behaviour of different cohorts. Nevertheless it is possible to comment on changes by gender, age groups and social classes over time.
3.3.2 Statistical analysis
For each indicator, overall percentages are presented, with a breakdown by gender, age group and social class. In order to determine if the differences over time were statistically significant, binary logistic regression models were applied. Within the models, the variable ‘HBSC survey year’ is treated as a predictor. This provides an overall significance value for the earliest survey year (1998 or 2002) and the most recent (2010) illustrating if there was a statistically significant increase or decrease in the indicator (or no significant change). By using the repeated contrast function for ‘HBSC survey year’, the model also provides a significance value which compares the mean of each survey year to the mean of the previous year. This allows us to comment on differences between each of the specified survey years. Age, gender and social class are included in the model meaning that they are controlled for – so differences between HBSC survey years are statistically significant irrespective of differences by age, gender and social class, and the minor variations in sample composition.
3.3.3 International trends
This report also contains international trends for the most of the indicators included. For each indicator we present the overall % of 15 year olds from Ireland, the minimum and maximum % internationally as well as the HBSC international average. The last row in each table presents the ranking of Ireland based on the 27 countries that have participated in all four survey rounds since 1998.
HBSCIrelandTrends2013
10
These countries include: Austria, Belgium (Flemish-speaking region), Belgium (French-speaking region), Canada, Czech Republic, Denmark, England, Estonia, Finland, France, Germany, Greece, Greenland, Hungary, Ireland, Israel, Latvia, Lithuania, Norway, Poland, Portugal, Russia, Scotland, Sweden, Switzerland, United States and Wales.
Where no internationally comparable data are available this is noted in the text.

Methodology
11
TRENDS
HEALTH BEHAVIOURS
HEALTH OUTCOMES
CONTEXTS.OF.CHILDREN’S.LIVES
APPENDICES
12
HEALTH BEHAVIOURS
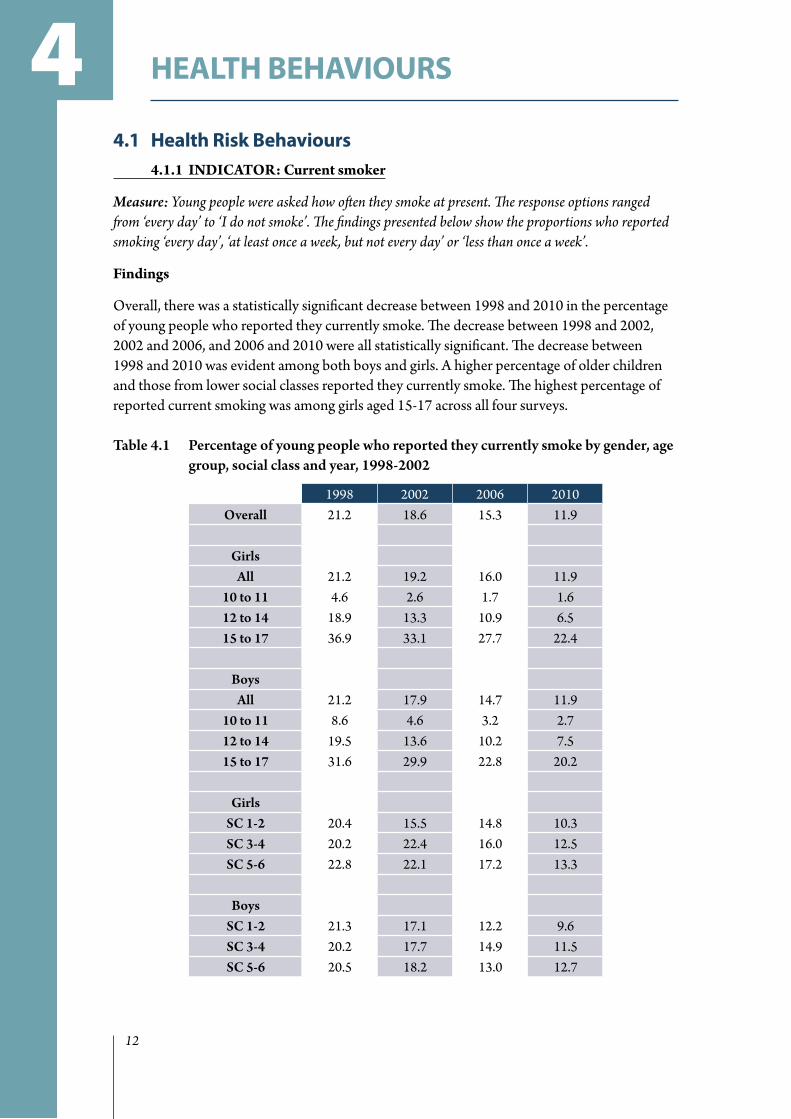
4.1 Health Risk Behaviours4.1.1 INDICATOR: Current smoker
Measure: Youngpeoplewereaskedhowoftentheysmokeatpresent.Theresponseoptionsrangedfrom‘everyday’to‘Idonotsmoke’.Thefindingspresentedbelowshowtheproportionswhoreportedsmoking‘everyday’,‘atleastonceaweek,butnoteveryday’or‘lessthanonceaweek’.
Findings
Overall, there was a statistically significant decrease between 1998 and 2010 in the percentage of young people who reported they currently smoke. The decrease between 1998 and 2002, 2002 and 2006, and 2006 and 2010 were all statistically significant. The decrease between 1998 and 2010 was evident among both boys and girls. A higher percentage of older children and those from lower social classes reported they currently smoke. The highest percentage of reported current smoking was among girls aged 15-17 across all four surveys.
Table.4.1.. Percentage.of.young.people.who.reported.they.currently.smoke.by.gender,.age.group,.social.class.and.year,.1998-2002
1998 2002 2006 2010Overall 21.2 18.6 15.3 11.9
Girls All 21.2 19.2 16.0 11.9
10.to.11 4.6 2.6 1.7 1.612.to.14 18.9 13.3 10.9 6.515.to.17 36.9 33.1 27.7 22.4
Boys
All 21.2 17.9 14.7 11.910.to.11 8.6 4.6 3.2 2.712.to.14 19.5 13.6 10.2 7.515.to.17 31.6 29.9 22.8 20.2
Girls
SC.1-2 20.4 15.5 14.8 10.3SC.3-4 20.2 22.4 16.0 12.5SC.5-6 22.8 22.1 17.2 13.3
Boys
SC.1-2 21.3 17.1 12.2 9.6SC.3-4 20.2 17.7 14.9 11.5SC.5-6 20.5 18.2 13.0 12.7
4

HealthBehaviours
13
Figure.4.1. Percentage.of.young.people.who.reported.they.currently.smoke,.1998-2010,.by.gender
50
40
(%) 30
20
10
01998
21.2 21.2
BoysGirls
201020062002
17.9 19.214.7 16.0
11.9 11.9
International comparisons
Overall, the relative rank of children in Ireland was inconsistent over time. In 2010, children in Ireland were below the international HBSC average for reporting current smoking.
Table.4.2.. International.data.summary.-.currently.smoking,.15.year.olds,.1998-2010,.overall.and.by.gender
OVERALL BOYS GIRLS
1998* 2002 2006 2010 1998* 2002 2006 2010 1998* 2002 2006 2010
HBSC 27 min 22.5 18.3 13.0 16.0 22.9 18.0 10.6 13.6 15.3 16.4 9.3 8.7
HBSC 27 max 60.5 67.7 46.6 59.1 53.8 59.2 38.8 54.9 67.7 73.7 54.2 62.9
HBSC 27 mean 32.8 31.1 24.2 23.5 32.6 30.9 23.7 23.5 33.0 31.2 24.8 23.4
Ireland 32.9 26.5 24.2 17.2 32.9 26.2 23.2 15.8 32.8 26.7 25.4 18.9
Ireland Rank 12 20 13 23 11 18 14 26 15 19 15 22
*England not included (different coding)

HBSCIrelandTrends2013
14
4.1.2 INDICATOR: Age of first cigarette
Measure: Youngpeoplewereaskedhowoldtheywerewhentheytriedtheirfirstcigarette.Theresponseoptionsrangedfrom‘never’to‘17’.Thefindingsbelowpresenttheproportionsofthosewhoreportedhavinghadtheirfirstcigaretteat11oryounger,13oryoungerand15oryounger.
Findings
In 2002, 62.1% of young people aged 15-17 reported that they had ever tried smoking; the percentages were 54.1% in 2006 and 45.7% in 2010. The figures presented below reflect young people that have said that they have ever tried smoking.
Overall, there was a statistically significant decrease between 2002 and 2010 in the percentage of young people who reported having their first cigarette at 13 or younger. The decreases between 2002 and 2006, and 2006 and 2010 were statistically significant. A higher percentage of both boys and girls reported having tried their first cigarette at 15 or younger than those who reported having tried their first cigarette at 11 or 13 and younger. Overall, but not always, a higher percentage of young people smoking at age 13 or younger were from social classes 5-6 than from social classes 1-2, this pattern was most clear in 2006.
Table.4.3.. Percentage.of.young.people.aged.15-17.who.reported.they.tried.their.first.cigarette.at.or.before.ages.11,.13.and.15.by.gender,.social.class.and.year.2002-2010
1998 2002 2006 2010Overall
≤11 - 25.5 18.8 12.5≤13 - 60.6 60.9 48.9≤15 - 87.6 94.3 89.8
Girls≤11 - 20.3 16.5 10.3≤13 - 58.7 60.4 43.4≤15 - 88.6 95.0 89.3
Boys≤11 - 33.3 20.9 14.5≤13 - 63.5 61.5 53.9≤15 - 86.1 93.5 90.3
Girls*SC.1-2 - 55.7 55.3 40.1SC.3-4 - 62.9 62.8 40.1SC.5-6 - 55.6 68.0 47.5
Boys*SC.1-2 - 63.5 58.2 48.4SC.3-4 - 62.6 59.3 57.5SC.5-6 - 67.6 70.8 51.8
*This social class breakdown only includes young people that report that they tried their first cigarette at 13 or younger.

HealthBehaviours
15
Figure.4.2.. Percentage.of.young.people.aged.15-17.who.reported.they.tried.their.first.cigarette.at.age.13.or.younger,.2002-2010,.by.gender
100
80
60
40
20
02002
63.558.7
BoysGirls
20102006
61.5 60.453.9
43.4
90
70
(%) 50
30
10
No internationally comparable data were available.

HBSCIrelandTrends2013
16
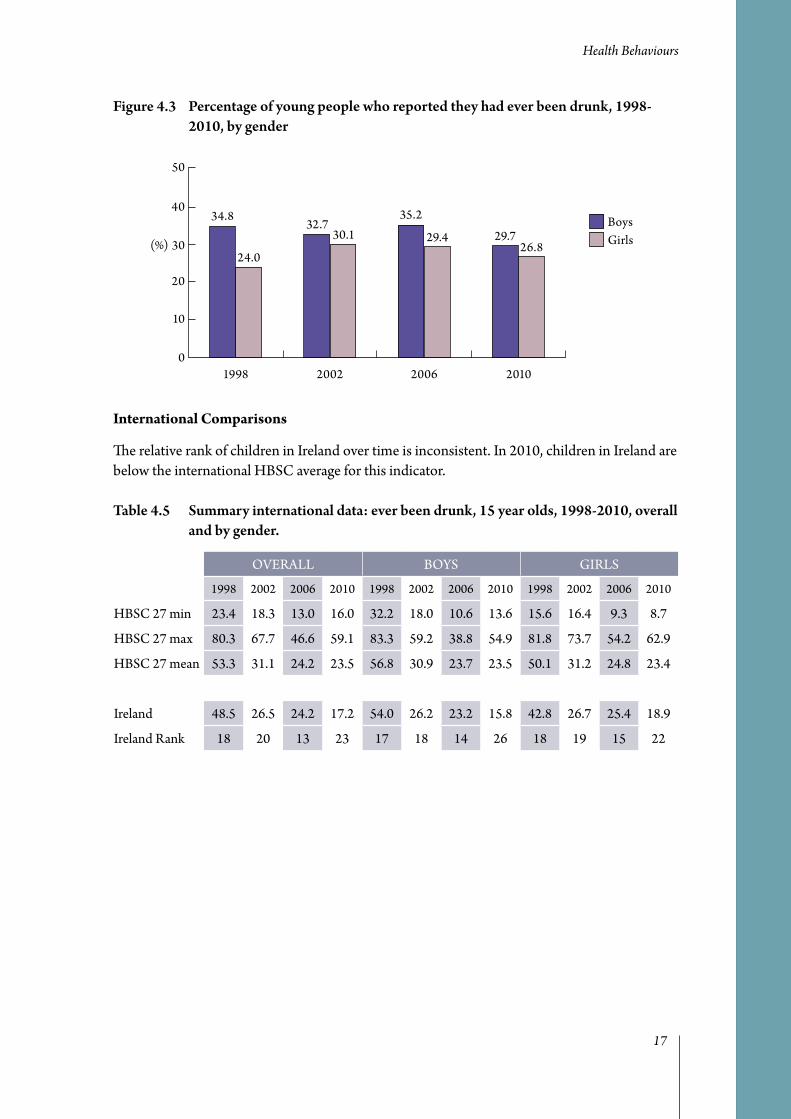
4.1.3 INDICATOR: Ever been drunk
Measure: Youngpeoplewereaskedwhethertheyhadeverbeendrunk.Thefindingspresentedbelowshowtheproportionswhoreportedhavingeverbeendrunk.
Findings
Overall, there was a statistically significant decrease between 1998 and 2010 in the percentage of young people who reported they have ever been drunk. The pattern over time was inconsistent; the difference between 1998 and 2002 was not statistically significant, the increase between 2002 and 2006 was statistically significant and the decrease between 2006 and 2010 was also statistically significant. A higher percentage of older children and boys reported they had ever been drunk, with no clear social class patterns.
Table.4.4. Percentage.of.young.people.who.reported.they.had.ever.been.drunk.by.gender,.age.group,.social.class.and.year,.1998-2010
1998 2002 2006 2010Overall 29.3 31.2 32.4 28.3
Girls All 24.0 30.1 29.4 26.8
10.to.11 5.4 3.0 1.6 2.912.to.14 17.2 17.2 16.3 14.615.to.17 48.9 56.4 55.9 51.9
Boys
All 34.8 32.7 35.2 29.710.to.11 15.3 6.7 6.7 5.112.to.14 28.1 22.1 22.1 18.015.to.17 57.1 59.7 57.2 52.8
Girls
SC.1-2 22.5 29.0 28.6 25.0SC.3-4 24.3 31.2 30.7 26.3SC.5-6 24.7 31.1 26.7 31.8
Boys
SC.1-2 35.8 33.4 32.2 27.9SC.3-4 34.3 30.9 35.0 29.0SC.5-6 31.5 34.3 34.3 31.2
HealthBehaviours
17
Figure.4.3.. Percentage.of.young.people.who.reported.they.had.ever.been.drunk,.1998-2010,.by.gender
50
40
(%) 30
20
10
01998
34.8
24.0
BoysGirls
201020062002
32.730.1
35.2
29.4 29.726.8
International Comparisons
The relative rank of children in Ireland over time is inconsistent. In 2010, children in Ireland are below the international HBSC average for this indicator.
Table.4.5.. Summary.international.data:.ever.been.drunk,.15.year.olds,.1998-2010,.overall.and.by.gender.
OVERALL BOYS GIRLS
1998 2002 2006 2010 1998 2002 2006 2010 1998 2002 2006 2010
HBSC 27 min 23.4 18.3 13.0 16.0 32.2 18.0 10.6 13.6 15.6 16.4 9.3 8.7
HBSC 27 max 80.3 67.7 46.6 59.1 83.3 59.2 38.8 54.9 81.8 73.7 54.2 62.9
HBSC 27 mean 53.3 31.1 24.2 23.5 56.8 30.9 23.7 23.5 50.1 31.2 24.8 23.4
Ireland 48.5 26.5 24.2 17.2 54.0 26.2 23.2 15.8 42.8 26.7 25.4 18.9
Ireland Rank 18 20 13 23 17 18 14 26 18 19 15 22

HBSCIrelandTrends2013
18
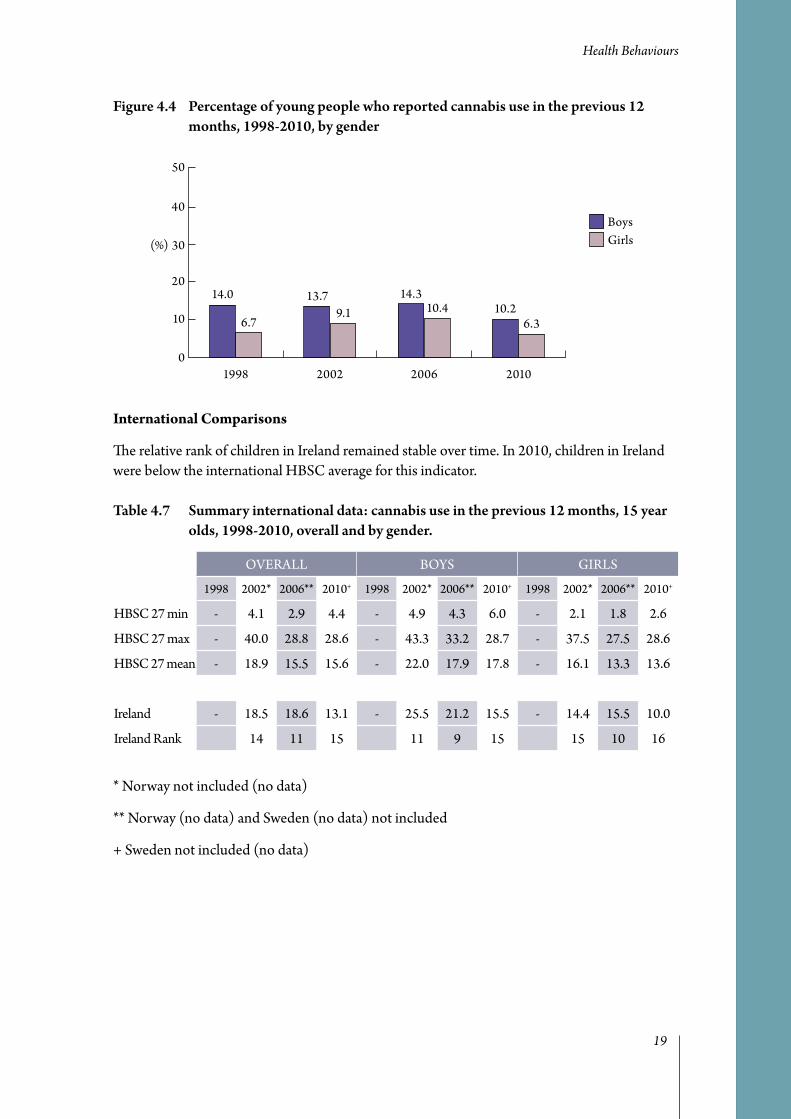
4.1.4 INDICATOR: Cannabis use in the last 12 months
Measure: Youngpeoplewereaskedhowoftentheyhadusedcannabisinthepast12months.Theresponseoptionsrangedfrom‘never’to’40timesormore’.Thefindingspresentedbelowshowtheproportionsofyoungpeoplewhoreportedanycannabisuseinthepast12months.
Findings
Overall, there was a statistically significant decrease between 1998 and 2010 in the percentage of young people who reported cannabis use in the past 12 months. There was an increase between 1998 and 2002 and between 2002 and 2006, but these changes were not statistically significant. There was a statistically significant decrease between 2006 and 2010. The decrease over time was evident among both boys and girls. A higher percentage of older children and boys reported cannabis use in the past 12 months. No clear social class patterns were evident across the four surveys.
Table.4.6.. Percentage.of.young.people.who.reported.cannabis.use.in.the.previous.12.months.by.gender,.age.group,.social.class.and.year,.1998-2010
1998 2002 2006 2010Overall 10.3 11.1 12.4 8.3
Girls All 6.7 9.1 10.4 6.3
10.to.11 0.8 0.0 0.3 0.412.to.14 3.7 3.6 5.2 2.415.to.17 16.1 19.3 20.4 13.5
Boys
All 14.0 13.7 14.3 10.210.to.11 3.1 1.0 2.0 1.012.to.14 10.6 6.2 8.0 4.915.to.17 26.5 30.5 24.6 19.8
Girls
SC.1-2 6.6 8.1 9.6 5.4SC.3-4 7.0 9.7 10.6 5.4SC.5-6 5.6 10.4 9.4 9.7
Boys
SC.1-2 14.5 13.8 13.0 9.1SC.3-4 13.1 12.8 13.8 9.3SC.5-6 10.8 14.6 12.1 8.9
HealthBehaviours
19
Figure.4.4. Percentage.of.young.people.who.reported.cannabis.use.in.the.previous.12.months,.1998-2010,.by.gender
50
40
(%) 30
20
10
01998
14.0
6.7
BoysGirls
201020062002
13.79.1
14.310.4 10.2
6.3
International Comparisons
The relative rank of children in Ireland remained stable over time. In 2010, children in Ireland were below the international HBSC average for this indicator.
Table.4.7.. Summary.international.data:.cannabis.use.in.the.previous.12.months,.15.year.olds,.1998-2010,.overall.and.by.gender.
OVERALL BOYS GIRLS
1998 2002* 2006** 2010+ 1998 2002* 2006** 2010+ 1998 2002* 2006** 2010+
HBSC 27 min - 4.1 2.9 4.4 - 4.9 4.3 6.0 - 2.1 1.8 2.6
HBSC 27 max - 40.0 28.8 28.6 - 43.3 33.2 28.7 - 37.5 27.5 28.6
HBSC 27 mean - 18.9 15.5 15.6 - 22.0 17.9 17.8 - 16.1 13.3 13.6
Ireland - 18.5 18.6 13.1 - 25.5 21.2 15.5 - 14.4 15.5 10.0
Ireland Rank 14 11 15 11 9 15 15 10 16
* Norway not included (no data)
** Norway (no data) and Sweden (no data) not included
+ Sweden not included (no data)

HBSCIrelandTrends2013
20
4.1.5 INDICATOR: Bully others
Measure: Youngpeoplewereaskedhowoftentheyhadtakenpartinbullying(an)otherstudent(s)atschoolinthepastcoupleofmonths.Theresponseoptionsrangedfrom‘Ihavenotbulliedanotherstudentatschoolinthepastcoupleofmonths’to‘severaltimesaweek’.Thefindingspresentedbelowshowtheproportionofyoungpeoplewhoreportedtheyhavebulliedotherstwoormoretimesinthepastcoupleofmonths.
Findings
Overall, there was a statistically significant decrease between 1998 and 2010 in the percentage of young people who reported they had bullied others two or more times in the past couple of months. The decrease between 1998 and 2002 was statistically significant, the increase between 2002 and 2006 was not significant and the decrease between 2006 and 2010 was statistically significant. The decrease between 1998 and 2002 was evident among both boys and girls. A higher percentage of boys and older children reported they had bullied others two or more times in the past couple of months. Among boys (but not girls), this percentage was higher in lower social classes.
Table.4.8. Percentage.of.young.people.who.reported.they.had.bullied.others.two.or.more.times.in.the.past.couple.of.months.by.gender,.age.group,.social.class.and.year,.1998-2010
1998 2002 2006 2010Overall 24.0 20.2 22.0 16.4
Girls All 14.0 14.0 14.3 10.3
10.to.11 13.1 12.0 13.4 10.212.to.14 15.9 15.2 15.4 11.215.to.17 11.3 13.6 13.1 9.4
Boys
All 34.4 28.7 29.4 22.110.to.11 32.2 21.2 21.4 16.812.to.14 33.6 30.5 29.0 21.815.to.17 37.1 30.5 32.1 24.6
Girls
SC.1-2 13.4 13.3 12.7 9.5SC.3-4 15.4 14.7 14.4 10.2SC.5-6 13.4 13.8 15.0 9.1
Boys
SC.1-2 34.0 28.8 28.9 21.2SC.3-4 33.6 28.4 29.1 21.3SC.5-6 34.3 29.1 30.5 22.5

HealthBehaviours
21
Figure.4.5. Percentage.of.young.people.who.reported.they.had.bullied.others.2.or.more.times.in.the.past.couple.of.months,.1998-2010,.by.gender
50
40
(%) 30
20
10
01998
34.4
14.0
BoysGirls
201020062002
28.7
14.0
29.4
14.3
22.1
10.3
International Comparisons
Overall, the relative rank of children in Ireland has remained stable between 1998 and 2010. In 2010, children in Ireland were below the international HBSC average for this indicator.
Table.4.9.. Summary.international.data:.have.bullied.others.2.or.more.times.in.the.past.couple.of.months,.15.year.olds,.1998-2010,.overall.and.by.gender
OVERALL BOYS GIRLS
1998 2002* 2006** 2010 1998 2002* 2006** 2010 1998 2002* 2006** 2010
HBSC 27 min 16.5 18.9 18.5 16.2 21.0 24.8 22.4 21.2 11.0 13.1 11.9 10.3
HBSC 27 max 67.0 73.2 61.9 61.4 78.0 79.0 68.6 65.6 59.1 67.1 56.6 59.5
HBSC 27 mean 39.0 37.5 35.5 34.0 48.3 46.2 43.8 41.9 30.5 29.7 27.6 26.5
Ireland 25.6 22.6 25.2 20.2 39.7 30.6 33.8 27.6 11.0 17.8 15.2 10.6
Ireland Rank 21 23 20 24 19 22 21 24 27 21 23 26
* Czech Republic not included (different coding)
** Israel not included (no data)

HBSCIrelandTrends2013
22
4.1.6 INDICATOR: On a diet
Measure: Youngpeoplewereaskedwhethertheyarecurrentlyonadietordoingsomethingelsetoloseweight.Theresponseoptionswere:‘no,myweightisfine’;‘no,butIshouldlosesomeweight’;‘no,Ineedtoputonsomeweight’;and‘yes’.Thefindingspresentedbelowreporttheproportioncurrentlyonadietordoingsomethingelsetoloseweight.
Findings
Overall, there was a statistically significant increase between 2002 and 2010 in the percentage of young people who reported they are currently on a diet. The decrease between 2002 and 2006 was statistically significant and the increase between 2006 and 2010 was statistically significant. A higher percentage of girls and older children reported being on a diet. Between 2002 and 2010 there was an increase in the percentage of boys who reported being on a diet. There were no clear social class patterns over the three surveys.
Table.4.10. Percentage.of.young.people.who.reported.they.are.currently.on.a.diet.or.doing.something.else.to.lose.weight,.by.gender,.age.group,.social.class.and.year,.2002-2010
1998 2002 2006 2010Overall - 13.1 11.5 13.2
Girls All - 17.9 14.9 16.9
10.to.11 - 7.8 8.3 10.212.to.14 - 16.4 13.0 15.215.to.17 - 24.2 19.7 21.6
Boys
All - 6.6 8.3 9.810.to.11 - 7.2 8.3 9.512.to.14 - 6.5 8.3 9.915.to.17 - 6.3 8.5 9.6
Girls
SC.1-2 - 18.4 15.4 16.3SC.3-4 - 18.5 14.7 17.7SC.5-6 - 15.3 14.9 19.6
Boys
SC.1-2 - 6.3 7.1 8.9SC.3-4 - 6.6 9.9 11.0SC.5-6 - 9.1 8.6 8.6

HealthBehaviours
23
Figure.4.6. Percentage.of.young.people.who.reported.they.are.currently.on.a.diet.or.doing.something.else.to.lose.weight,.2002-2010,.by.gender
50
40
(%) 30
20
10
02002
6.6
17.9
BoysGirls
20102006
8.3
14.99.8
16.9
International Comparisons
The relative rank of children in Ireland remained stable between 1998 and 2010. In 2010, children in Ireland were below the international HBSC average for this indicator.
Table.4.11. Summary.international.data:.currently.on.a.diet.or.doing.something.else.to.lose.weight,.15.year.olds,.1998-2010,.overall.and.by.gender
OVERALL BOYS GIRLS
1998* 2002** 2006 2010 1998* 2002** 2006 2010 1998* 2002** 2006 2010
HBSC 27 min 5.4 8.1 10.0 9.8 1.8 2.4 3.3 4.6 8.0 10.9 14.2 14.8
HBSC 27 max 19.7 25.7 22.7 25.9 9.0 20.8 16.5 17.5 30.0 35.9 31.2 36.9
HBSC 27 mean 11.7 15.4 15.7 16.1 4.4 7.1 7.9 9.5 18.3 22.9 23.0 22.6
Ireland 8.8 16.7 13.2 14.1 3.0 5.5 8.2 8.5 14.8 23.5 19.1 21.5
Ireland Rank 20 11 20 20 21 17 12 17 19 14 22 16
* Belgium Fl not included (different coding)
** Hungary not included (no data)

HBSCIrelandTrends2013
24
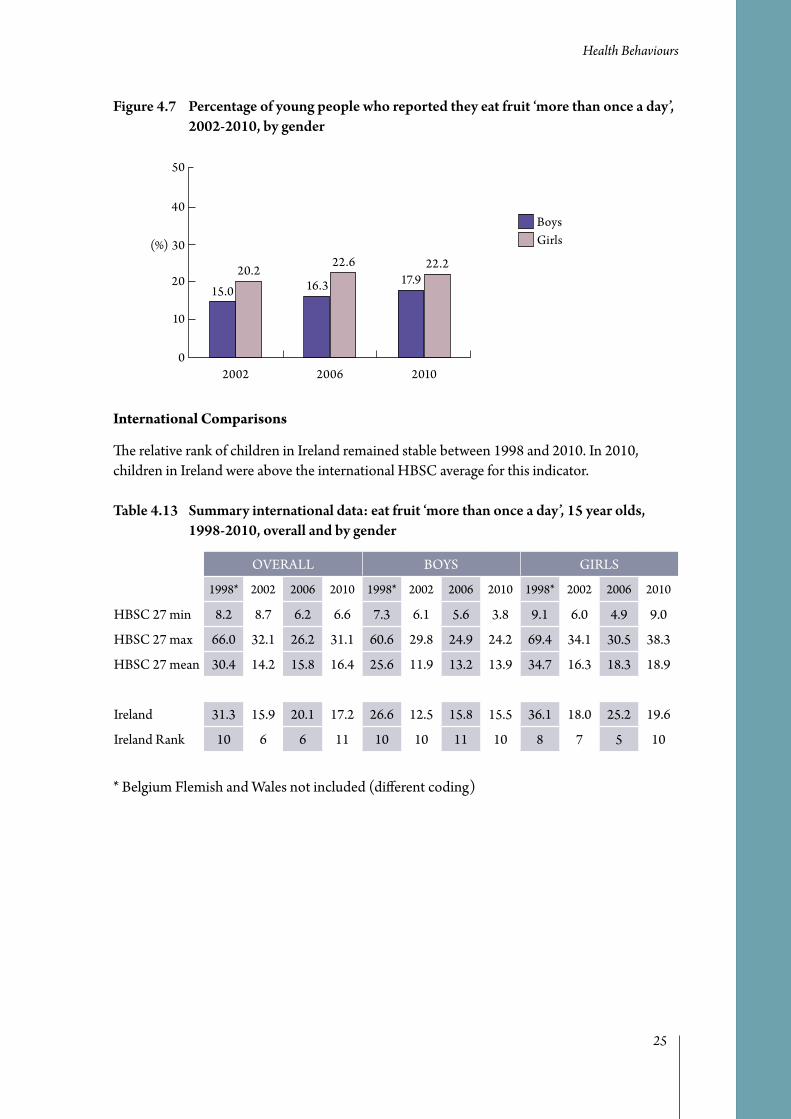
4.2 Positive Health Behaviours4.2.1 INDICATOR: Fruit consumption
Measure: Youngpeoplewereaskedhowoftentheyeatfruit.Theresponseoptionsrangedfrom‘never’to‘morethanonceaday’.Thefindingspresentedbelowshowtheproportionofyoungpeoplewhoreportedeatingfruit‘morethanonceaday’.
Findings
Overall, there was a statistically significant increase between 2002 and 2010 in the percentage of young people who reported they eat fruit ‘more than once a day’. The increase between 2002 and 2006 was statistically significant, but the increase between 2006 and 2010 was not. A higher percentage of girls, younger children and those from higher social classes reported they eat fruit ‘more than once a day’.
Table.4.12. Percentage.of.young.people.who.reported.they.eat.fruit.‘more.than.once.a.day’,.by.gender,.age.group,.social.class.and.year,.2002-2010
1998 2002 2006 2010Overall - 18.0 19.4 20.0
Girls All - 20.2 22.6 22.2
10.to.11 - 20.7 27.1 27.012.to.14 - 20.4 20.9 21.315.to.17 - 19.9 22.8 21.5
Boys
All - 15.0 16.3 17.910.to.11 - 17.3 18.2 20.712.to.14 - 16.1 16.6 18.215.to.17 - 12.0 15.2 17.0
Girls
SC.1-2 - 22.6 26.4 26.2SC.3-4 - 18.4 19.9 19.3SC.5-6 - 15.8 20.9 17.5
Boys
SC.1-2 - 15.4 18.8 21.3SC.3-4 - 13.7 13.7 14.4SC.5-6 - 15.8 16.4 14.8
HealthBehaviours
25
Figure.4.7. Percentage.of.young.people.who.reported.they.eat.fruit.‘more.than.once.a.day’,.2002-2010,.by.gender
50
40
(%) 30
20
10
02002
15.0
20.2
BoysGirls
20102006
16.3
22.617.9
22.2
International Comparisons
The relative rank of children in Ireland remained stable between 1998 and 2010. In 2010, children in Ireland were above the international HBSC average for this indicator.
Table.4.13. Summary.international.data:.eat.fruit.‘more.than.once.a.day’,.15.year.olds,.1998-2010,.overall.and.by.gender
OVERALL BOYS GIRLS
1998* 2002 2006 2010 1998* 2002 2006 2010 1998* 2002 2006 2010
HBSC 27 min 8.2 8.7 6.2 6.6 7.3 6.1 5.6 3.8 9.1 6.0 4.9 9.0
HBSC 27 max 66.0 32.1 26.2 31.1 60.6 29.8 24.9 24.2 69.4 34.1 30.5 38.3
HBSC 27 mean 30.4 14.2 15.8 16.4 25.6 11.9 13.2 13.9 34.7 16.3 18.3 18.9
Ireland 31.3 15.9 20.1 17.2 26.6 12.5 15.8 15.5 36.1 18.0 25.2 19.6
Ireland Rank 10 6 6 11 10 10 11 10 8 7 5 10
* Belgium Flemish and Wales not included (different coding)

HBSCIrelandTrends2013
26
4.2.2 INDICATOR: Tooth brushing
Measure: Youngpeoplewereaskedhowoftentheybrushtheirteeth.Theresponseoptionsrangedfrom‘never’to‘morethanonceaday’.Thefindingspresentedbelowshowtheproportionofyoungpeoplewhoreportedtheybrushtheirteeth‘morethanonceaday’.
Findings
Overall, there was a statistically significant increase between 1998 and 2010 in the percentage of young people who reported they brush their teeth ‘more than once a day’. The increases between 1998 and 2002, 2002 and 2006 and 2006 and 2010 were all statistically significant. The increase between 1998 and 2010 was evident for both boys and girls. A higher percentage of girls and those from higher social classes reported brushing their teeth ‘more than once a day’. Across all four survey years, the highest percentage of tooth brushing ‘every day’ was among girls aged 15-17.
Table.4.14. Percentage.of.young.people.who.reported.they.brush.their.teeth.‘more.than.once.a.day’.by.gender,.age.group,.social.class.and.year,.1998-2010
1998 2002 2006 2010Overall 57.5 61.6 62.5 67.1
Girls All 67.8 70.1 71.9 76.4
10.to.11 60.8 63.9 67.5 71.312.to.14 67.1 67.7 69.7 76.015.to.17 74.4 76.1 76.8 79.0
Boys
All 46.7 50.2 53.5 58.410.to.11 46.7 52.7 55.6 64.212.to.14 46.2 43.6 52.1 57.915.to.17 47.1 50.2 54.7 57.5
Girls
SC.1-2 68.5 72.5 75.0 77.8SC.3-4 67.8 69.4 70.5 76.9SC.5-6 66.3 64.7 71.2 71.9
Boys
SC.1-2 49.7 51.4 56.2 60.6SC.3-4 45.8 50.8 52.8 59.7SC.5-6 45.2 46.5 51.6 53.0

HealthBehaviours
27
Figure.4.8. Percentage.of.young.people.who.reported.they.brush.their.teeth.‘more.than.once.a.day’,.1998-2010,.by.gender
100
80
60
40
20
01998
46.7
67.8 BoysGirls
201020062002
50.2
70.1
53.5
71.9
58.4
76.4 90
70
(%) 50
30
10
International Comparisons
The relative rank of children in Ireland remained stable overall between 1998 and 2010. In 2010, children in Ireland were below the international HBSC average for this indicator.
Table.4.15. Summary.international.data:.tooth.brushing.‘more.than.once.a.day’,.15.year.olds,.1998-2010,.overall.and.by.gender
OVERALL BOYS GIRLS
1998 2002 2006 2010 1998 2002 2006 2010 1998 2002 2006 2010
HBSC 27 min 44.0 - 43.5 47.7 30.7 - 32.0 35.1 52.6 - 53.3 60.8
HBSC 27 max 86.7 - 83.6 83.1 81.9 - 76.2 75.9 92.1 - 91.0 90.5
HBSC 27 mean 66.2 - 66.9 67.8 55.7 - 57.6 58.1 75.9 - 75.7 77.3
Ireland 60.1 - 62.7 63.7 46.4 - 51.6 54.7 74.4 - 75.8 75.6
Ireland Rank 18 - 18 17 21 - 19 16 17 - 15 16

HBSCIrelandTrends2013
28
4.2.3 INDICATOR: Use of seatbelt
Measure: Youngpeoplewereaskedhowoftentheyuseaseatbeltwheninacar.Theresponseoptionswere‘always’;‘often’;‘sometimes’;‘rarelyornever’;‘usuallynoseatbeltwhereIsit’;‘nevertravelbycar’.Thefindingspresentedbelowshowtheproportionofyoungpeoplewhoreported‘always’wearingaseatbeltwheninacar.
Findings
Overall, there was a statistically significant increase between 1998 and 2010 in the percentage of young people who reported they ‘always’ wear their seatbelt while travelling by car. The increases between 1998 and 2002, 2002 and 2006 and 2006 and 2010 were all statistically significant. The increase between 1998 and 2010 was evident among both boys and girls. A higher percentage of younger children and girls reported ‘always’ wearing a seatbelt in the car. There were no clear social class patterns across the four surveys.
Table.4.16. Percentage.of.young.people.who.reported.they.‘always’.wear.a.seatbelt.by.gender,.age.group,.social.class.and.year,.1998-2010
1998 2002 2006 2010Overall 40.8 62.1 79.4 81.6
Girls All 45.8 66.2 82.7 84.3
10.to.11 50.6 69.5 88.4 90.112.to.14 44.2 66.5 81.5 83.215.to.17 45.5 64.2 81.7 83.7
Boys
All 35.5 56.5 76.3 79.010.to.11 38.4 63.1 84.8 82.312.to.14 35.6 56.0 76.0 77.415.to.17 33.8 53.6 74.7 79.5
Girls
SC.1-2 46.1 66.7 82.7 84.8SC.3-4 45.4 65.6 83.8 85.0SC.5-6 45.4 67.8 82.5 81.5
Boys
SC.1-2 37.6 56.3 76.6 79.6SC.3-4 35.1 57.1 77.4 79.9SC.5-6 31.1 56.1 76.9 77.3

HealthBehaviours
29
Figure.4.9. Percentage.of.young.people.who.reported.they.‘always’.wear.a.seatbelt,.1998-2010,.by.gender
100
80
60
40
20
01998
35.5
45.8
BoysGirls
201020062002
56.566.2
76.382.7 79.0
84.390
70
(%) 50
30
10
No internationally comparable data were available.

HBSCIrelandTrends2013
30
4.2.4 INDICATOR: Exercise 4+ times a week
Measure: Youngpeoplewereaskedhowoftentheyexerciseintheirfreetime.Theresponseoptionsrangedfrom‘everyday’to‘lessthanonceamonth’.Thefindingspresentedbelowshowtheproportionofyoungpeoplewhoreportedtheyexercisefourormoretimesaweek.
Findings
Overall, there was a statistically significant decrease between 1998 and 2010 in the percentage of young people who reported they exercise on four or more times a week. There was an inconsistent pattern between survey years, with a significant decrease between 1998 and 2002, a significant increase between 2002 and 2006, and a significant decrease between 2006 and 2010. A higher percentage of boys and younger children reported they exercise four or more times a week over the four surveys. Across all four surveys the lowest percentage was among girls aged 15-17. There were no clear social class patterns.
Table.4.17. Percentage.of.young.people.who.reported.they.exercise.4.or.more.times.a.week.by.gender,.age.group,.social.class.and.year,.1998-2010
1998 2002 2006 2010Overall 53.5 47.0 53.0 50.5
Girls All 45.0 37.9 43.3 40.5
10.to.11 59.5 53.6 58.4 57.912.to.14 49.4 42.4 50.5 44.015.to.17 27.3 26.0 28.1 28.9
Boys
All 62.5 59.2 62.6 60.110.to.11 62.3 64.7 71.8 65.712.to.14 65.9 63.0 67.3 64.015.to.17 53.6 51.3 54.7 53.2
Girls
SC.1-2 47.2 37.4 42.9 41.0SC.3-4 44.2 38.6 42.9 40.1SC.5-6 41.7 39.9 44.7 37.0
Boys
SC.1-2 64.7 60.7 64.3 62.4SC.3-4 63.7 58.7 61.9 59.5SC.5-6 58.5 59.4 63.5 55.4

HealthBehaviours
31
Figure.4.10.Percentage.of.young.people.who.reported.they.exercise.4.or.more.times.a.week,.1998-2010,.by.gender
100
80
60
40
20
01998
62.5
45.0
BoysGirls
201020062002
59.2
37.9
62.6
43.3
60.1
40.5
90
70
(%) 50
30
10
No internationally comparable data were available.

32
HEALTH OUTCOMES
5.1 Physical Health Outcomes 5.1.1 INDICATOR: Headache
Measure: Youngpeoplewereaskedhowofteninthelastsixmonthshadtheyexperiencedheadaches.Theresponseoptionsrangedfrom‘abouteveryday’to‘rarelyornever’.Thefindingspresentedbelowshowtheproportionsofyoungpeoplewhoreportedtheyhadaheadache‘atleastweekly’inthelastsixmonths.
Findings
Overall, the percentage of young people who reported they had a headache ‘at least weekly’ in the last six months remained stable with no statistically significant changes between 1998 and 2010. A higher percentage of girls, older children and those from lower social classes reported they had a headache ‘at least weekly’ in the last six months across all four surveys.
Table.5.1. Percentage.of.young.people.who.reported.they.had.a.headache.‘at.least.weekly’.in.the.last.6.months.by.gender,.age.group,.social.class.and.year,.1998-2010
1998 2002 2006 2010Overall 26.0 26.8 25.5 26.5
Girls All 30.6 31.6 31.0 32.0
10.to.11 22.7 15.8 19.2 19.712.to.14 29.4 28.3 27.6 30.315.to.17 38.0 41.5 39.8 39.3
Boys
All 21.2 20.2 20.2 21.210.to.11 20.2 18.0 16.0 15.912.to.14 21.6 19.9 19.3 20.715.to.17 20.8 21.9 22.5 23.5
Girls
SC.1-2 30.1 31.6 30.9 28.8SC.3-4 31.0 32.5 29.8 34.4SC.5-6 27.8 28.9 30.4 34.0
Boys
SC.1-2 21.5 20.5 19.1 19.6SC.3-4 21.4 19.8 20.7 20.3SC.5-6 18.0 20.2 21.4 25.1
5

HealthOutcomes
33
Figure.5.1. Percentage.of.young.people.who.reported.they.had.a.headache.‘at.least.weekly’.in.the.last.6.months,.1998-2010,.by.gender
50
40
(%) 30
20
10
01998
21.2
30.6BoysGirls
201020062002
20.2
31.6
20.2
31.0
21.2
32.1
International Comparisons
The relative rank of children in Ireland remained stable between 1998 and 2010. In 2010, boys were slightly above the international HBSC average while girls were below the average for this indicator.
Table.5.2. Summary.international.data:.headache.‘at.least.weekly’.in.the.last.6.months,.15.year.olds,.1998-2010,.overall.and.by.gender
OVERALL BOYS GIRLS
1998 2002 2006 2010 1998 2002 2006 2010 1998 2002 2006 2010
HBSC 27 min 19.7 23.2 20.7 24.2 13.1 12.2 11.3 14.9 26.7 30.3 28.0 32.0
HBSC 27 max 54.6 50.8 53.3 48.7 45.0 35.6 39.0 37.5 63.0 63.1 61.4 60.1
HBSC 27 mean 33.7 33.0 33.0 34.5 23.6 22.1 22.6 24.4 42.9 42.7 42.7 44.3
Ireland 29.8 34.1 29.0 32.1 22.2 20.5 21.0 25.0 37.8 42.2 38.3 41.5
Ireland Rank 19 12 19 18 15 16 17 11 20 13 18 20

HBSCIrelandTrends2013
34
5.1.2 INDICATOR: Feeling low
Measure:Youngpeoplewereaskedhowofteninthelastsixmonthshadtheyexperiencedfeelinglow.Theresponseoptionsrangedfrom‘abouteveryday’to‘rarelyornever’.Thefindingspresentedbelowshowtheproportionofyoungpeoplewhoreportedtheyhadexperiencedfeelinglow‘atleastweekly’inthelastsixmonths.
Findings
Overall, there was a statistically significant increase between 1998 and 2010 in the percentage of young people who reported feeling low ‘at least weekly’ in the past 6 months. The pattern between survey years was inconsistent with a statistically significant increase between 1998 and 2002, a statistically significant decrease between 2002 and 2006 and no statistically significant change between 2006 and 2010. A higher percentage of girls and older children reported feeling low ‘at least weekly’ in the last 6 months across all four surveys. The highest percentage was reported among girls aged 15-17. There was no clear social class pattern.
Table.5.3. Percentage.of.young.people.who.reported.feeling.low.‘at.least.weekly’.in.the.past.6.months.by.gender,.age.group,.social.class.and.year,.1998-2010
1998 2002 2006 2010Overall 22.5 25.8 24.0 24.0
Girls All 26.1 29.0 28.4 28.5
10.to.11 18.6 15.9 14.5 17.112.to.14 24.5 25.8 26.0 25.515.to.17 33.7 37.8 36.9 36.8
Boys
All 18.7 21.5 19.8 19.810.to.11 18.0 18.4 14.7 15.812.to.14 17.7 19.3 18.1 17.715.to.17 20.8 26.0 22.8 23.6
Girls
SC.1-2 28.5 29.7 29.9 27.1SC.3-4 23.2 29.0 26.5 27.6SC.5-6 24.0 24.8 27.5 34.5
Boys
SC.1-2 19.9 23.5 19.4 18.5SC.3-4 19.0 18.9 20.0 18.9SC.5-6 14.0 20.3 19.1 24.1

HealthOutcomes
35
Figure.5.2. Percentage.of.young.people.who.reported.feeling.low.‘at.least.weekly’.in.the.past.6.months,.1998-2010,.by.gender
50
40
(%) 30
20
10
01998
18.7
26.1
BoysGirls
201020062002
21.5
29.0
19.8
28.4
19.8
28.5
No internationally comparable data were available.
HBSCIrelandTrends2013
36
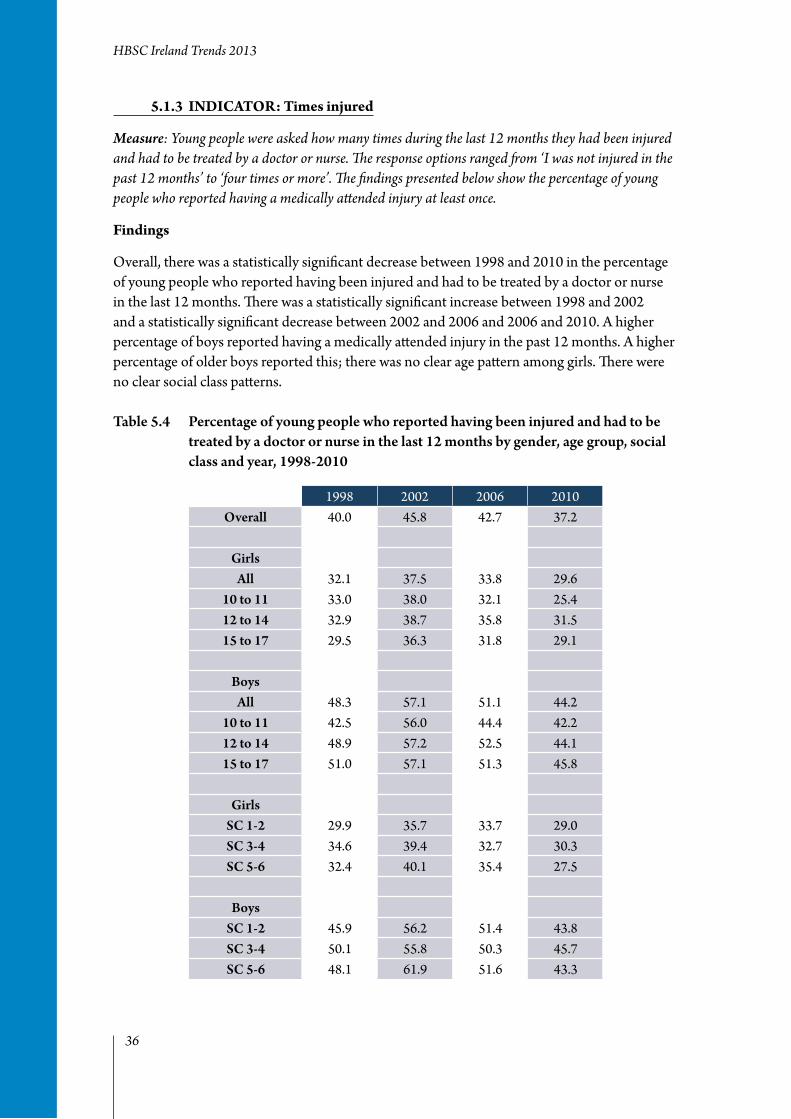
5.1.3 INDICATOR: Times injured
Measure:Youngpeoplewereaskedhowmanytimesduringthelast12monthstheyhadbeeninjuredandhadtobetreatedbyadoctorornurse.Theresponseoptionsrangedfrom‘Iwasnotinjuredinthepast12months’to‘fourtimesormore’.Thefindingspresentedbelowshowthepercentageofyoungpeoplewhoreportedhavingamedicallyattendedinjuryatleastonce.
Findings
Overall, there was a statistically significant decrease between 1998 and 2010 in the percentage of young people who reported having been injured and had to be treated by a doctor or nurse in the last 12 months. There was a statistically significant increase between 1998 and 2002 and a statistically significant decrease between 2002 and 2006 and 2006 and 2010. A higher percentage of boys reported having a medically attended injury in the past 12 months. A higher percentage of older boys reported this; there was no clear age pattern among girls. There were no clear social class patterns.
Table.5.4. Percentage.of.young.people.who.reported.having.been.injured.and.had.to.be.treated.by.a.doctor.or.nurse.in.the.last.12.months.by.gender,.age.group,.social.class.and.year,.1998-2010
1998 2002 2006 2010Overall 40.0 45.8 42.7 37.2
Girls All 32.1 37.5 33.8 29.6
10.to.11 33.0 38.0 32.1 25.412.to.14 32.9 38.7 35.8 31.515.to.17 29.5 36.3 31.8 29.1
Boys
All 48.3 57.1 51.1 44.210.to.11 42.5 56.0 44.4 42.212.to.14 48.9 57.2 52.5 44.115.to.17 51.0 57.1 51.3 45.8
Girls
SC.1-2 29.9 35.7 33.7 29.0SC.3-4 34.6 39.4 32.7 30.3SC.5-6 32.4 40.1 35.4 27.5
Boys
SC.1-2 45.9 56.2 51.4 43.8SC.3-4 50.1 55.8 50.3 45.7SC.5-6 48.1 61.9 51.6 43.3

HealthOutcomes
37
Figure.5.3. Percentage.of.young.people.who.reported.having.been.injured.and.had.to.be.treated.by.a.doctor.or.nurse.in.the.last.12.months,.1998-2010,.by.gender
100
80
60
40
20
01998
48.3
32.1
BoysGirls
201020062002
57.1
37.5
51.1
33.844.2
29.6
90
70
(%) 50
30
10
International Comparisons
Overall, there was a decrease in the relative rank of children in Ireland, most notably among boys. In 2010, children in Ireland were below the international HBSC average for this indicator.
Table.5.5. Summary.international.data:.having.been.injured.and.had.to.be.treated.by.a.doctor.or.nurse.in.the.last.12.months,.15.year.olds,.1998-2010,.overall.and.by.gender
OVERALL BOYS GIRLS
1998 2002 2006 2010 1998 2002 2006 2010 1998 2002 2006 2010
HBSC 27 min - 30.0 29.7 27.5 - 35.5 33.6 34.2 - 25.2 26.1 21.2
HBSC 27 max - 53.3 51.3 52.4 - 61.5 55.7 59.3 - 49.1 49.6 48.1
HBSC 27 mean - 44.8 43.0 44.1 - 51.7 48.6 49.0 - 38.6 37.8 39.4
Ireland - 46.5 42.2 40.3 - 59.7 49.6 45.7 - 38.5 33.6 33.2
Ireland Rank - 13 17 20 - 4 14 21 - 18 22 22

HBSCIrelandTrends2013
38
5.2 Positive Health Outcomes5.2.1 INDICATOR: Self-rated health
Measure:Youngpeoplewereaskedtodescribetheirhealth(“wouldyousayyourhealthis…?”).Theresponseoptionswere‘excellent,‘good’,‘fair’and‘poor’.Thefindingspresentedbelowshowtheproportionofyoungpeoplewhoreportedtheirhealthis‘excellent’.
Findings
Overall, there was a statistically significant increase between 2002 and 2010 in the percentage of young people who reported their health is ‘excellent’. The increase between 2002 and 2006 was statistically significant and the decrease between 2006 and 2010 was statistically significant. The increase between 2002 and 2010 was evident among both boys and girls. A higher percentage of younger children and those from higher social classes reported their health is ‘excellent’ across all four surveys.
Table.5.6. Percentage.of.young.people.who.reported.their.health.is.‘excellent’.by.gender,.age.group,.social.class.and.year,.2002-2010
1998 2002 2006 2010Overall - 27.8 33.3 32.7
Girls All - 24.8 28.9 27.3
10.to.11 - 35.0 39.4 38.612.to.14 - 27.3 32.4 29.415.to.17 - 17.5 20.2 20.1
Boys
All - 31.7 37.5 37.710.to.11 - 34.5 41.7 39.412.to.14 - 32.6 38.6 39.215.to.17 - 29.6 35.2 35.7
Girls
SC.1-2 - 25.8 32.5 29.6SC.3-4 - 23.6 26.9 26.6SC.5-6 - 22.6 27.0 22.2
Boys
SC.1-2 - 34.4 42.1 40.6SC.3-4 - 30.3 34.5 35.7SC.5-6 - 30.5 37.1 32.3

HealthOutcomes
39
Figure.5.4. Percentage.of.young.people.who.reported.their.health.is.‘excellent’,.2002-2010,.by.gender
50
40
(%) 30
20
10
02002
31.7
24.8
BoysGirls
20102006
37.5
28.9
37.7
27.3
International Comparisons
The relative rank of children in Ireland remained stable between 2002 and 2010. In 2010, children in Ireland were above the international HBSC average for this indicator.
Table.5.7. Summary.international.data:.health.is.‘excellent’,.15.year.olds,.1998-2010,.overall.and.by.gender
OVERALL BOYS GIRLS
1998 2002* 2006 2010 1998 2002* 2006 2010 1998 2002* 2006 2010
HBSC 27 min - 9.9 14.2 14.5 - 14.9 19.5 20.4 - 6.2 7.7 7.7
HBSC 27 max - 48.1 57.0 55.6 - 55.7 64.8 60.3 - 41.9 52.5 50.8
HBSC 27 mean - 25.2 28.1 28.3 - 33.0 35.3 35.2 - 18.2 21.4 21.5
Ireland - 25.0 28.5 29.9 - 34.6 34.6 36.2 - 19.2 21.4 21.6
Ireland Rank - 15 13 10 - 14 13 11 - 13 10 12
* France not included (no data)

HBSCIrelandTrends2013
40
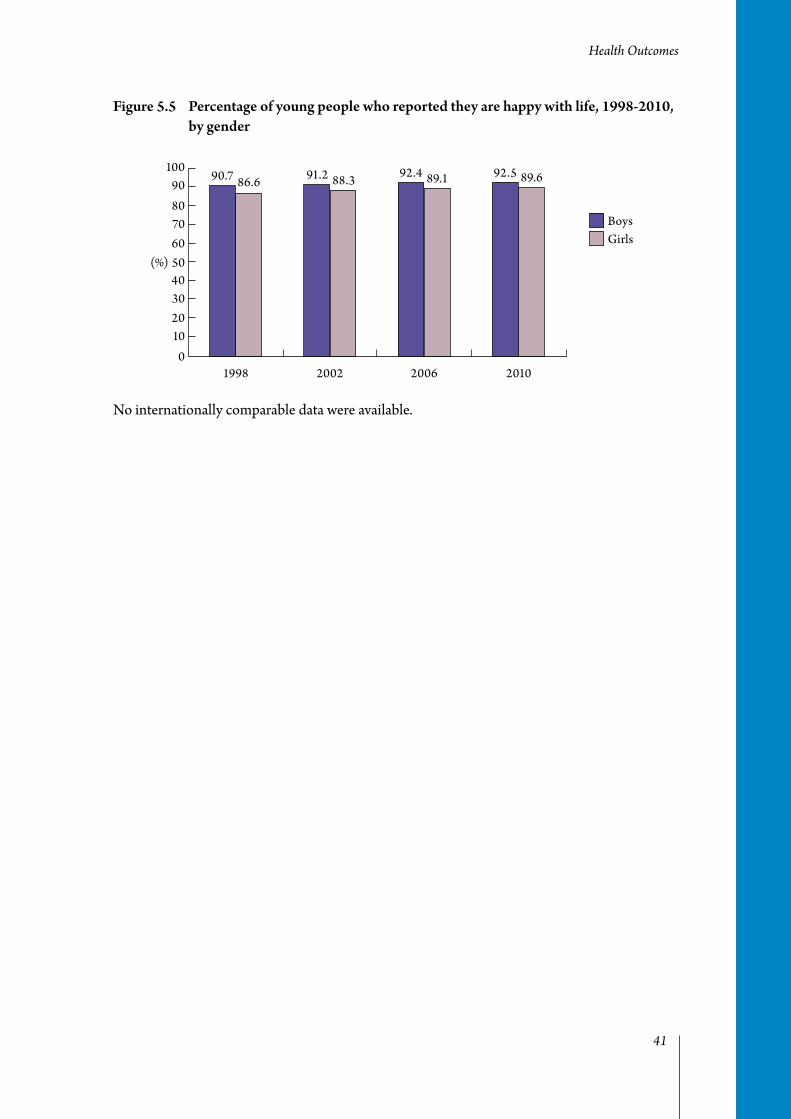
5.2.2 INDICATOR: Happy with life
Measure:Youngpeoplewereaskedhowtheyfeelabouttheirlifeatpresent.Theresponseoptionsrangedfrom‘veryhappy’to‘nothappyatall’.Thefindingspresentedbelowshowtheproportionsofyoungpeoplewhoreportedtheyare‘veryhappy’or‘quitehappy’withtheirlifeatpresent.
Findings
Overall, there was a statistically significant increase between 1998 and 2010 in the percentage of young people who reported they are happy with their life. The increases between 1998 and 2002 and 2002 and 2006 were statistically significant, but the increase between 2006 and 2010 was not statistically significant. The increase between 1998 and 2010 was evident among both boys and girls. A higher percentage of boys, younger children and those from higher social classes reported they are happy with their life across all four surveys.
Table.5.8. Percentage.of.young.people.who.reported.they.are.happy.with.life.by.gender,.age.group,.social.class.and.year,.1998-2010
1998 2002 2006 2010Overall 88.6 89.5 90.8 91.1
Girls All 86.6 88.3 89.1 89.6
10.to.11 93.6 96.0 95.6 94.112.to.14 87.1 88.9 90.4 90.515.to.17 81.1 84.5 85.0 86.4
Boys
All 90.7 91.2 92.4 92.510.to.11 92.8 93.3 95.0 94.812.to.14 92.2 91.6 92.6 93.215.to.17 86.9 89.6 91.7 90.6
Girls
SC.1-2 86.6 89.1 89.3 91.2SC.3-4 87.9 87.8 90.0 89.4SC.5-6 86.4 88.4 90.3 87.5
Boys
SC.1-2 90.1 91.7 94.1 93.1SC.3-4 90.8 92.1 92.7 93.6SC.5-6 93.6 89.9 90.9 90.8
HealthOutcomes
41
Figure.5.5. Percentage.of.young.people.who.reported.they.are.happy.with.life,.1998-2010,.by.gender
100
80
60
40
20
01998
90.7 86.6
BoysGirls
201020062002
91.2 88.3 92.4 89.1 92.5 89.690
70
(%) 50
30
10
No internationally comparable data were available.

HBSCIrelandTrends2013
42
5.2.3 INDICATOR: Life satisfaction
Measure:Youngpeoplewereaskedtoratetheirlifesatisfactionusingthe‘CantrilLadder’.Thetopoftheladderindicatesthebestpossiblelifeandthebottom,theworst.Youngpeoplewereaskedtoindicatethestepoftheladderatwhichtheywouldplacetheirlivesatpresent(from0to10).Thefindingspresentedbelowshowtheproportionofyoungpeoplewhoreportedhighlifesatisfaction(ascoreof7ormore).
Findings
Overall, there was a statistically significant increase between 2002 and 2010 in the percentage of young people who reported high life satisfaction. The increase between 2002 and 2006 was statistically significant, but the increase between 2006 and 2010 was not statistically significant. A higher percentage of boys, younger children and those from higher social classes reported high life satisfaction across all four surveys.
Table.5.9. Percentage.of.young.people.who.reported.high.life.satisfaction.(rank.7.or.higher.on.the.scale).by.gender,.age.group,.social.class.and.year,.2002-2010
1998 2002 2006 2010Overall - 75.1 76.6 76.2
Girls All - 73.0 74.4 73.6
10.to.11 - 87.6 87.0 85.812.to.14 - 75.4 78.0 76.015.to.17 - 64.5 64.8 65.9
Boys
All - 78.1 78.7 78.610.to.11 - 83.4 86.9 83.412.to.14 - 79.6 81.1 81.615.to.17 - 73.4 74.2 72.8
Girls
SC.1-2 - 74.7 75.6 77.1SC.3-4 - 72.4 75.2 72.6SC.5-6 - 72.1 74.6 69.5
Boys
SC.1-2 - 78.8 81.5 80.7SC.3-4 - 78.8 78.6 78.7SC.5-6 - 76.4 76.6 74.3

HealthOutcomes
43
Figure.5.6. Percentage.of.young.people.who.reported.high.life.satisfaction.(rank.7.or.higher.on.the.scale),.2002-2010,.by.gender
100
80
60
40
20
02002
78.173.0
BoysGirls
20102006
78.7 74.4 78.673.6
90
70
(%) 50
30
10
International Comparisons
The relative ranking of children in Ireland decreased between 2002 and 2010. In 2010 children in Ireland were below the international HBSC average for this indicator.
Table.5.10. Summary.international.data:.high.life.satisfaction.(rank.7.or.higher.on.the.scale),.15.year.olds,.1998-2010,.overall.and.by.gender
OVERALL BOYS GIRLS
1998 2002* 2006** 2010 1998 2002 2006 2010 1998 2002 2006 2010
HBSC 27 min - 52.0 56.2 54.7 - 55.3 58.5 59.4 - 49.0 53.1 50.2
HBSC 27 max - 76.1 77.1 74.8 - 82.2 81.7 78.7 - 72.0 73.2 71.3
HBSC 27 mean - 63.9 66.1 67.1 - 68.7 71.1 71.4 - 59.7 61.4 63.0
Ireland - 66.0 65.7 65.0 - 72.3 70.6 67.9 - 62.3 60.0 61.2
Ireland Rank 11 15 21 - 9 16 21 9 13 19
*Belgium French (different coding) and Greece (no data) not included
** Belgium French not included (different coding)

44
CONTEXTS OF CHILDREN’S LIVES
6.1 Family6.1.1 INDICATOR: Communication with mother
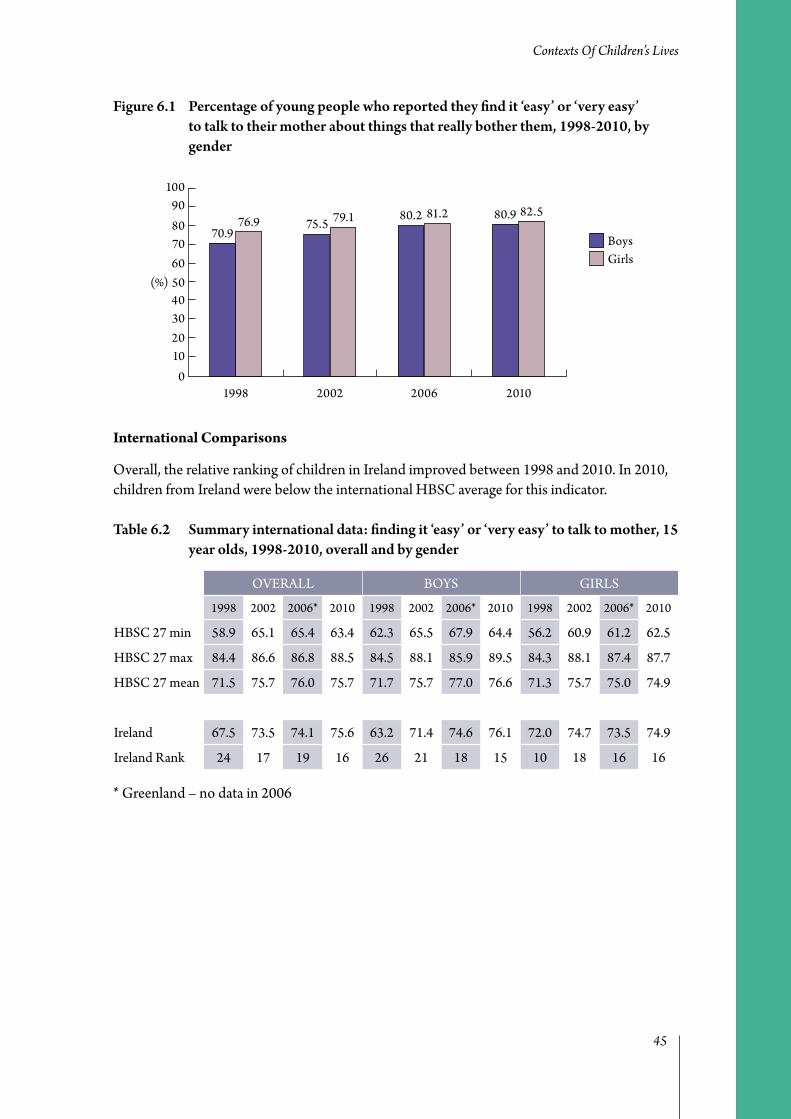
Measure:Youngpeoplewereaskedhoweasyitisforthemtotalktotheirmotheraboutthingsthatreallybotherthem.Theresponseoptionsrangedfrom‘veryeasy’to‘verydifficult’.Thefindingspresentedbelowshowtheproportionswhoreportedfindingit‘easy’or‘veryeasy’.
Findings
Overall, there was a statistically significant increase between 1998 and 2010 in the percentage of young people who reported that they find it ‘easy’ or ‘very easy’ to talk to their mother about things that really bother them. The increase between 1998 and 2002, and 2002 and 2006 was statistically significant, but the change between 2006 and 2010 was not. The increase over time was evident among both boys and girls, with a higher percentage of girls reporting positive maternal communication in each sequential survey. The percentage of young people who reported they find it ‘easy’ or ‘very easy’ to talk to their mother about things that really bother them was highest among younger children and decreased with age across all surveys. There was no clear social class pattern.
Table.6.1. Percentage.of.young.people.who.reported.they.find.it.‘easy’.or.‘very.easy’.to.talk.to.their.mother.about.things.that.really.bother.them,.by.gender,.age.group,.social.class.and.year.1998-2010
1998 2002 2006 2010Overall 74.0 77.6 80.7 81.7
GirlsAll 76.9 79.1 81.2 82.5
10-11 84.2 87.8 91.7 89.212-14 78.9 81.9 84.7 84.715-17 68.3 72.5 72.3 77.3
BoysAll 70.9 75.5 80.2 80.9
10-11 77.4 85.4 89.8 88.912-14 73.9 76.6 82.9 83.115-17 61.7 68.9 74.5 75.8
GirlsSC.1-2 76.5 78.3 80.7 83.7SC.3-4 78.1 80.4 81.4 83.2SC.5-6 76.7 77.9 82.2 79.6
BoysSC.1-2 70.9 74.0 79.9 80.2SC.3-4 70.4 76.1 81.1 81.5SC.5-6 72.2 79.1 79.8 81.5
6
ContextsOfChildren’sLives
45
Figure.6.1. Percentage.of.young.people.who.reported.they.find.it.‘easy’.or.‘very.easy’.to.talk.to.their.mother.about.things.that.really.bother.them,.1998-2010,.by.gender
100
80
60
40
20
01998
70.976.9
BoysGirls
201020062002
75.5 79.1 80.2 81.2 80.9 82.590
70
(%) 50
30
10
International Comparisons
Overall, the relative ranking of children in Ireland improved between 1998 and 2010. In 2010, children from Ireland were below the international HBSC average for this indicator.
Table.6.2. Summary.international.data:.finding.it.‘easy’.or.‘very.easy’.to.talk.to.mother,.15.year.olds,.1998-2010,.overall.and.by.gender
OVERALL BOYS GIRLS
1998 2002 2006* 2010 1998 2002 2006* 2010 1998 2002 2006* 2010
HBSC 27 min 58.9 65.1 65.4 63.4 62.3 65.5 67.9 64.4 56.2 60.9 61.2 62.5
HBSC 27 max 84.4 86.6 86.8 88.5 84.5 88.1 85.9 89.5 84.3 88.1 87.4 87.7
HBSC 27 mean 71.5 75.7 76.0 75.7 71.7 75.7 77.0 76.6 71.3 75.7 75.0 74.9
Ireland 67.5 73.5 74.1 75.6 63.2 71.4 74.6 76.1 72.0 74.7 73.5 74.9
Ireland Rank 24 17 19 16 26 21 18 15 10 18 16 16
* Greenland – no data in 2006
HBSCIrelandTrends2013
46
6.1.2 INDICATOR: Communication with father
Measure:Youngpeoplewereaskedhoweasyitisforthemtotalktotheirfathersaboutthingsthatreallybotherthem.Theresponseoptionsrangedfrom‘veryeasy’to‘verydifficult’.Thefindingspresentedbelowshowtheproportionswhoreportedfindingit‘easy’or‘veryeasy’.
Findings
Overall, there was a statistically significant increase between 1998 and 2010 in the percentage of young people who reported they find it ‘easy’ or ‘very easy’ to talk to their father about things that really bother them. The increases between 1998 and 2002, 2002 and 2006, and 2006 and 2010 were all statistically significant. The increase over time was evident among both boys and girls, with a higher percentage of boys reporting positive paternal communication in each sequential survey. The percentage of young people who reported they find it ‘easy’ or ‘very easy’ to talk to their father about things that really bother them was highest among younger children and decreased with age across all surveys. There was no clear social class pattern.
Table.6.3. Percentage.of.young.people.who.reported.they.find.it.‘easy’.or.‘very.easy’.to.talk.to.their.father.about.things.that.really.bother.them,.by.gender,.age.group,.social.class.and.year.1998-2010
1998 2002 2006 2010Overall. 48.0 56.2 64.1 66.7
GirlsAll 42.0 50.4 56.6 59.8
10-11 54.3 64.4 71.4 69.012-14 43.0 51.4 59.6 60.915-17 31.7 43.7 46.6 54.1
BoysAll 54.3 64.0 71.1 73.2
10-11 67.1 79.7 83.5 81.912-14 57.0 66.1 76.1 76.615-17 41.7 53.2 62.3 65.6
GirlsSC.1-2 40.8 51.0 58.2 61.4SC.3-4 44.3 50.4 54.6 59.4SC.5-6 41.3 47.7 55.7 56.2
BoysSC.1-2 51.4 63.1 70.5 73.5SC.3-4 54.9 63.8 70.7 73.8SC.5-6 57.0 65.0 72.4 72.5

ContextsOfChildren’sLives
47
Figure.6.2. Percentage.of.young.people.who.reported.they.find.it.‘easy’.or.‘very.easy’.to.talk.to.their.father.about.things.that.really.bother.them,.1998-2010,.by.gender
100
80
60
40
20
01998
54.3
42.0
BoysGirls
201020062002
64.0
50.4
71.1
56.6
73.2
59.8
90
70
(%) 50
30
10
International Comparisons
Overall, the relative ranking of children in Ireland improved between 1998 and 2010. In 2010, children from Ireland were slightly above the HBSC average for this indicator.
Table.6.4. Summary.international.data:.finding.it.‘easy’.or.‘very.easy’.to.talk.to.father,.15.year.olds,.1998-2010,.overall.and.by.gender
OVERALL BOYS GIRLS
1998 2002 2006* 2010 1998 2002 2006* 2010 1998 2002 2006* 2010
HBSC 27 min 37.9 45.4 43.9 38.3 45.4 52.5 56.4 50.3 30.0 33.3 31.0 27.7
HBSC 27 max 66.8 68.3 73.2 76.4 77.3 79.3 79.7 83.2 61.2 63.7 68.2 70.9
HBSC 27 mean 48.5 54.2 56.5 57.9 57.4 63.6 66.5 67.6 40.3 45.4 46.9 48.5
Ireland 40.2 48.1 58.9 62.6 45.4 56.1 66.1 69.4 34.9 43.4 50.4 53.7
Ireland Rank 26 21 8 6 27 25 13 11 19 15 8 8
* Greenland – no data in 2006

HBSCIrelandTrends2013
48
6.1.3 INDICATOR: Live with both parents
Measure:Youngpeoplewereaskedabouttheircurrentlivingarrangements.Thefindingspresentedbelowshowtheproportionofchildrenwhoreportedboththeirmotherandfatherarecurrentlylivinginthemainhome.
Findings
Overall, there was a statistically significant decrease between 1998 and 2010 in the percentage of young people who reported they currently live with both their mother and father. The decreases between 1998 and 2002, 2002 and 2006, and 2006 and 2010 were statistically significant. The decrease over time was evident for both boys and girls, with no clear gender differences. The percentage of young people who reported they currently live with both their mother and father was lowest among those in social class 5-6 across all four surveys.
Table.6.5. Percentage.of.young.people.who.reported.they.currently.live.with.both.their.mother.and.father,.by.gender,.age.group,.social.class.and.year.1998-2010
1998 2002 2006 2010Overall 91.4 85.6 80.5 73.7
GirlsAll 91.2 86.3 79.4 73.8
10-11 91.7 86.4 80.5 75.012-14 91.4 86.9 80.7 74.715-17 90.7 85.7 77.8 74.7
BoysAll 91.6 84.7 81.6 73.7
10-11 91.8 84.9 84.0 74.712-14 92.0 85.3 81.8 74.315-17 91.0 84.1 81.5 73.9
GirlsSC.1-2 92.2 89.6 84.5 82.8SC.3-4 92.3 86.9 81.2 73.6SC.5-6 90.6 83.7 74.3 68.6
BoysSC.1-2 94.4 89.2 86.9 81.5SC.3-4 91.9 85.3 82.2 78.9SC.5-6 90.9 79.1 78.0 71.6

ContextsOfChildren’sLives
49
Figure.6.3. Percentage.of.young.people.who.reported.they.currently.live.with.both.their.mother.and.father,.1998-2010,.by.gender
100
80
60
40
20
01998
91.6 91.2
BoysGirls
201020062002
84.7 86.381.6 79.4
73.7 73.8
90
70
(%) 50
30
10
No internationally comparable data were available.

HBSCIrelandTrends2013
50
6.2 School6.2.1 INDICATOR: Liking School
Measure:Youngpeoplewereaskedhowtheyfeelaboutschoolatpresent.Theresponseoptionsrangedfrom‘Ilikeitalot’to‘Idon’tlikeitatall’.Thefindingspresentedbelowshowtheproportionreportingthattheylikeschool‘alot’or‘some’.
Findings
Overall, there was a statistically significant increase between 2002 and 2010 in the percentage of young people who reported they like school ‘a lot’ or ‘some’. The decrease between 2002 and 2006 was not statistically significant, but the increase between 2006 and 2010 was significant. In general, the increase was evident for both genders, and greater among girls compared to boys with a higher percentage of girls reporting that they like school in each sequential survey. A higher percentage of younger children reported that they like school ‘a lot’ or ‘some’, and there were no clear social class patterns.
Table.6.6. Percentage.of.young.people.who.reported.they.like.school.‘a.lot’.or.‘some’,.by.gender,.age.group,.social.class.and.year.2002-2010
1998 2002 2006 2010Overall - 68.8 67.8 70.9
GirlsAll - 73.9 73.5 75.5
10-11 - 80.7 82.6 81.712-14 - 75.3 76.1 78.615-17 - 69.8 66.7 69.1
BoysAll - 61.9 62.4 66.7
10-11 - 65.7 66.9 70.412-14 - 64.7 66.0 68.615-17 - 55.9 57.0 62.8
GirlsSC.1-2 - 76.5 76.8 78.4SC.3-4 - 73.5 72.2 75.4SC.5-6 - 71.1 72.8 69.1
BoysSC.1-2 - 63.9 66.6 70.4SC.3-4 - 59.2 60.7 66.6SC.5-6 - 63.4 61.1 63.5

ContextsOfChildren’sLives
51
Figure.6.4. Percentage.of.young.people.who.reported.they.like.school.‘a.lot’.or.‘some’,.2002-2010,.by.gender
100
80
60
40
20
02002
61.9
73.9BoysGirls
20102006
62.4
73.566.7
75.590
70
(%) 50
30
10
International Comparisons
Overall, the relative rank remained stable across the four survey cycles, with children in Ireland below the HBSC international average except in 2002. Among girls the relative ranking has decreased between 1998 and 2010.
Table.6.7. Summary.international.data:.liking.school.‘a.lot’.or.‘some’,.15.year.olds,.1998-2010,.overall.and.by.gender
OVERALL BOYS GIRLS
1998 2002 2006 2010 1998 2002 2006 2010 1998 2002 2006 2010
HBSC 27 min 46.9 45.0 48.8 49.4 37.8 41.2 42.1 44.1 56.0 47.9 52.8 55.0
HBSC 27 max 93.8 85.2 83.0 81.9 92.1 85.8 83.4 84.2 94.9 84.8 84.8 84.0
HBSC 27 mean 68.9 62.6 66.5 68.8 65.6 59.4 63.7 65.9 72.0 65.4 69.2 71.5
Ireland 63.9 63.4 60.8 59.8 54.8 58.3 55.8 57.4 73.4 66.4 66.8 62.9
Ireland Rank 20 12 20 24 22 17 20 22 11 12 16 24

HBSCIrelandTrends2013
52
6.2.2 INDICATOR: Organising school events
Measure:Youngpeoplewereaskedifstudentsintheirschoolwereinvolvedinorganisingschoolevents.Theresponseoptionsrangedfrom‘stronglyagree’to‘stronglydisagree’.Thefindingspresentedbelowshowtheproportionthatresponded‘stronglyagree’or‘agree’.
Findings
Overall, there was a statistically significant increase between 2002 and 2010 in the percentage of young people who reported students in their school help organise school events. The increases between 2002 and 2006, and 2006 and 2010 were statistically significant. The increase over time was evident for both boys and girls with a higher percentage of girls reporting involvement in organising school events in all three surveys. In general, the percentage who reported students in their school organise school events was higher among younger children and those in lower social classes.
Table.6.8. Percentage.of.young.people.who.reported.students.in.their.school.help.organise.school.events.by.gender,.age.group,.social.class.and.year.2002-2010
1998 2002 2006 2010Overall - 55.8 57.6 60.8
GirlsAll - 59.2 61.3 64.7
10-11 - 67.6 70.1 66.412-14 - 57.5 60.0 63.715-17 - 57.6 59.5 65.3
BoysAll - 51.1 54.0 57.1
10-11 - 61.9 68.4 66.512-14 - 51.8 55.9 56.815-17 - 44.2 48.3 53.9
GirlsSC.1-2 - 58.2 60.6 64.2SC.3-4 - 58.8 60.6 64.6SC.5-6 - 63.2 62.5 65.0
BoysSC.1-2 - 49.2 51.1 55.8SC.3-4 - 51.5 54.8 57.6SC.5-6 - 56.8 57.0 58.6
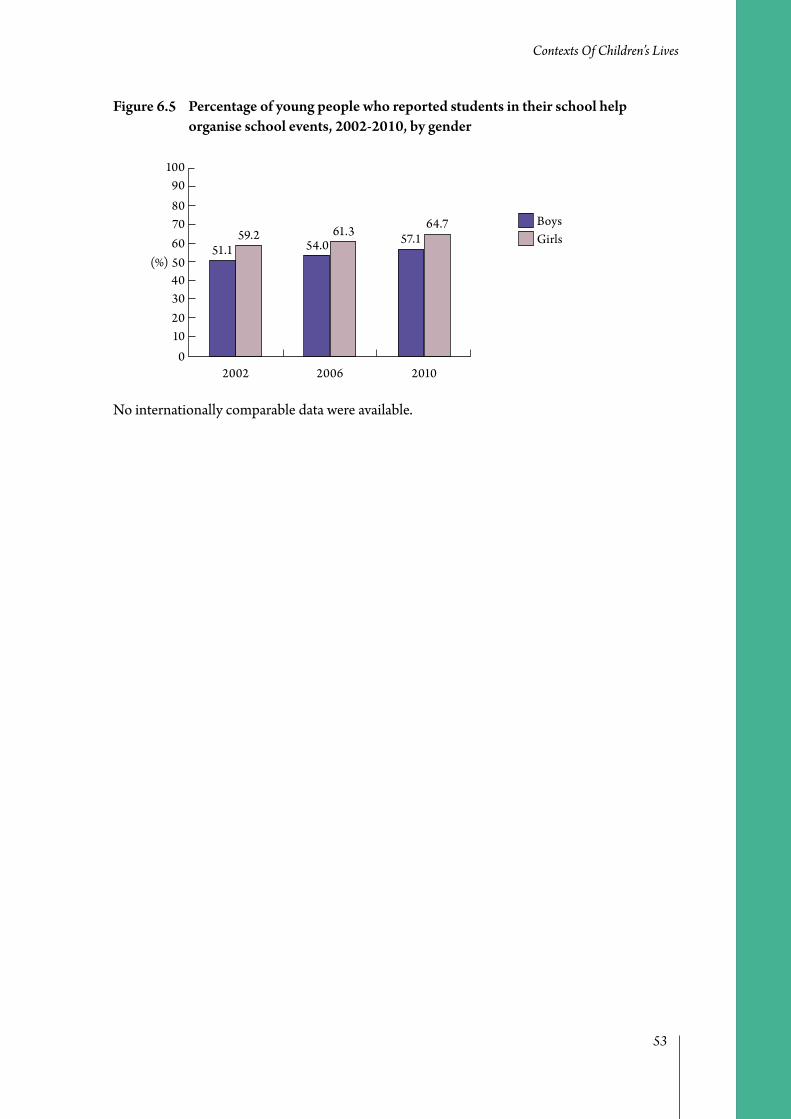
ContextsOfChildren’sLives
53
Figure.6.5. Percentage.of.young.people.who.reported.students.in.their.school.help.organise.school.events,.2002-2010,.by.gender
100
80
60
40
20
02002
51.159.2
BoysGirls
20102006
54.061.3 57.1
64.7
90
70
(%) 50
30
10
No internationally comparable data were available.

HBSCIrelandTrends2013
54
6.2.3 INDICATOR: Pressured by school work
Measure:Youngpeoplewereaskedhowpressuredtheyfeelbytheschoolworktheyhavetodo.Theresponseoptionsrangedfrom‘alot’to‘notatall’.Thefindingspresentedbelowshowtheproportionwhoreportedfeelingpressuredbyschoolworkeither‘alot’or‘some’.
Findings
Overall, there was a statistically significant increase between 1998 and 2010 in the percentage of young people who reported they feel pressured by their school work. The increases between 1998 and 2002, and 2002 and 2006 were statistically significant, and the decrease between 2006 and 2010 was statistically significant. The increase over time was evident among both boys and girls, with a higher percentage of girls reporting that they feel pressured by schoolwork across all four surveys. The percentage of young people who reported feeling pressured by schoolwork increased with age for boys and girls, with no clear social class patterns.
Table.6.9. Percentage.of.young.people.who.reported.they.feel.pressured.by.school.work,.by.gender,.age.group,.social.class.and.year.1998-2010
1998 2002 2006 2010Overall 32.3 35.1 41.0 38.7
Girls All 33.3 36.5 42.3 41.1
10.to.11 18.4 18.9 18.5 24.7 12.to.14 32.2 32.6 40.4 38.515.to.17 45.9 44.1 54.7 51.3
Boys
All 31.3 33.2 39.7 36.410.to.11 24.0 29.9 23.4 25.312.to.14 30.5 31.9 39.3 35.115.to.17 36.9 36.0 44.2 41.7
Girls
SC.1-2 34.0 37.2 44.0 35.2SC.3-4 30.7 36.1 41.5 35.2SC.5-6 32.8 34.8 38.8 41.8
Boys
SC.1-2 32.7 33.3 40.8 42.1SC.3-4 29.9 32.8 38.8 40.1SC.5-6 30.5 33.5 37.2 40.6

ContextsOfChildren’sLives
55
Figure.6.6. Percentage.of.young.people.who.reported.they.feel.pressured.by.school.work,.1998-2010,.by.gender
50
40
(%) 30
20
10
01998
31.3 33.3 BoysGirls
201020062002
33.236.5
39.742.3
36.441.1
International Comparisons
Overall, the relative rank of children in Ireland remained stable between 1998 and 2010. In 2010, children in Ireland were above the HBSC international average for this indicator.
Table.6.10. Summary.international.data:.feeling.pressured.by.schoolwork,.15.year.olds,.1998-2010,.overall.and.by.gender
OVERALL BOYS GIRLS
1998* 2002 2006 2010 1998* 2002 2006 2010 1998* 2002 2006 2010
HBSC 27 min 10.6 23.9 23.4 21.6 10.8 19.5 17.1 17.4 10.4 25.9 23.0 20.9
HBSC 27 max 66.3 67.9 67.6 67.0 64.0 62.8 62.5 55.2 68.5 73.4 73.1 76.3
HBSC 27 mean 40.9 44.1 44.0 42.8 38.0 40.3 39.2 37.9 43.6 47.5 48.6 47.6
Ireland 42.7 46.3 53.4 50.3 38.5 42.0 47.4 44.6 47.0 48.9 60.5 57.7
Ireland Rank 12 14 9 10 12 13 9 10 12 15 7 8
* Lithuania – no data in 1998

HBSCIrelandTrends2013
56
6.2.4 INDICATOR: Teachers treat students fairly
Measure:Youngpeoplewereaskedifteachersintheirschooltreatstudentsfairly.Theresponseoptionsrangedfrom‘stronglyagree’to‘stronglydisagree’.Thefindingspresentedbelowshowtheproportionthatresponded‘stronglyagree’or‘agree’.
Findings
Overall, there was a statistically significant increase between 1998 and 2010 in the percentage of young people who reported teachers in their school treat students fairly. There was a significant increase between 1998 and 2002, a significant decrease between 2002 and 2006, and a significant increase between 2006 and 2010. The increase between 1998 and 2010 was evident for both boys and girls. A higher percentage of girls reported that teacher’s treat students fairly, except in 2002. The percentage of young people who reported that teachers in their school treat students fairly was higher among younger children across all four surveys, with no clear social class patterns.
Table.6.11. Percentage.of.young.people.who.reported.teachers.in.their.school.treat.students.fairly.by.gender,.age.group,.social.class.and.year.1998-2010
1998 2002 2006 2010Overall 55.4 60.4 57.9 63.0
Girls All 58.1 59.9 59.6 64.2
10.to.11 73.6 80.6 82.5 83.712.to.14 58.7 59.8 61.6 66.115.to.17 45.4 51.5 47.0 54.4
Boys
All 52.6 61.2 56.4 61.910.to.11 63.9 74.1 78.0 76.612.to.14 54.1 64.1 58.4 64.815.to.17 42.8 50.2 48.4 53.1
Girls
SC.1-2 54.8 59.8 58.9 63.3SC.3-4 61.5 59.6 58.5 66.0SC.5-6 60.8 61.4 62.2 64.2
Boys
SC.1-2 50.4 60.0 57.4 63.2SC.3-4 52.3 62.1 55.7 61.3SC.5-6 57.0 64.1 58.0 63.0

ContextsOfChildren’sLives
57
Figure.6.7. Percentage.of.young.people.who.reported.teachers.in.their.school.treat.students.fairly,.1998-2010,.by.gender
100
80
60
40
20
01998
52.658.1
BoysGirls
201020062002
61.2 59.9 56.4 59.6 61.9 64.2
90
70
(%) 50
30
10
No internationally comparable data were available.

HBSCIrelandTrends2013
58
6.3 Peers6.3.1 INDICATOR: Close friends of the same sex
Measure:Youngpeoplewereaskedhowmanyclosemaleandfemalefriendstheycurrentlyhave.Theresponseoptionsrangedfrom‘none’to‘threeormore’andwereansweredseparatelyformaleandfemalefriends.Thefindingspresentedbelowshowtheproportionwhoreportedhaving‘threeormore’friendsoftheirowngender.
Findings
Overall, the percentage of young people who report they have ‘three or more’ friends of the same gender remained stable between 2002 and 2010 with no statistically significant changes between survey years. There were no clear patterns by gender, age group or social class.
Table.6.12. Percentage.of.young.people.who.reported.they.have.‘three.or.more.friends’.of.the.same.sex.by.gender,.age.group,.social.class.and.year,.2002-2010
1998 2002 2006 2010Overall. - 89.6 89.5 89.3
Girls All - 90.3 90.1 90.4
10.to.11 - 89.7 90.2 86.912.to.14 - 91.4 90.9 91.215.to.17 - 89.4 89.6 90.9
Boys
All - 88.6 89.0 88.310.to.11 - 88.7 88.7 87.212.to.14 - 89.2 89.9 89.915.to.17 - 87.8 88.3 87.2
Girls
SC.1-2 - 91.0 90.5 91.3SC.3-4 - 90.8 90.5 89.9SC.5-6 - 87.0 90.9 90.1
Boys
SC.1-2 - 88.4 89.2 89.7SC.3-4 - 90.1 89.6 88.4SC.5-6 - 87.4 90.9 87.1
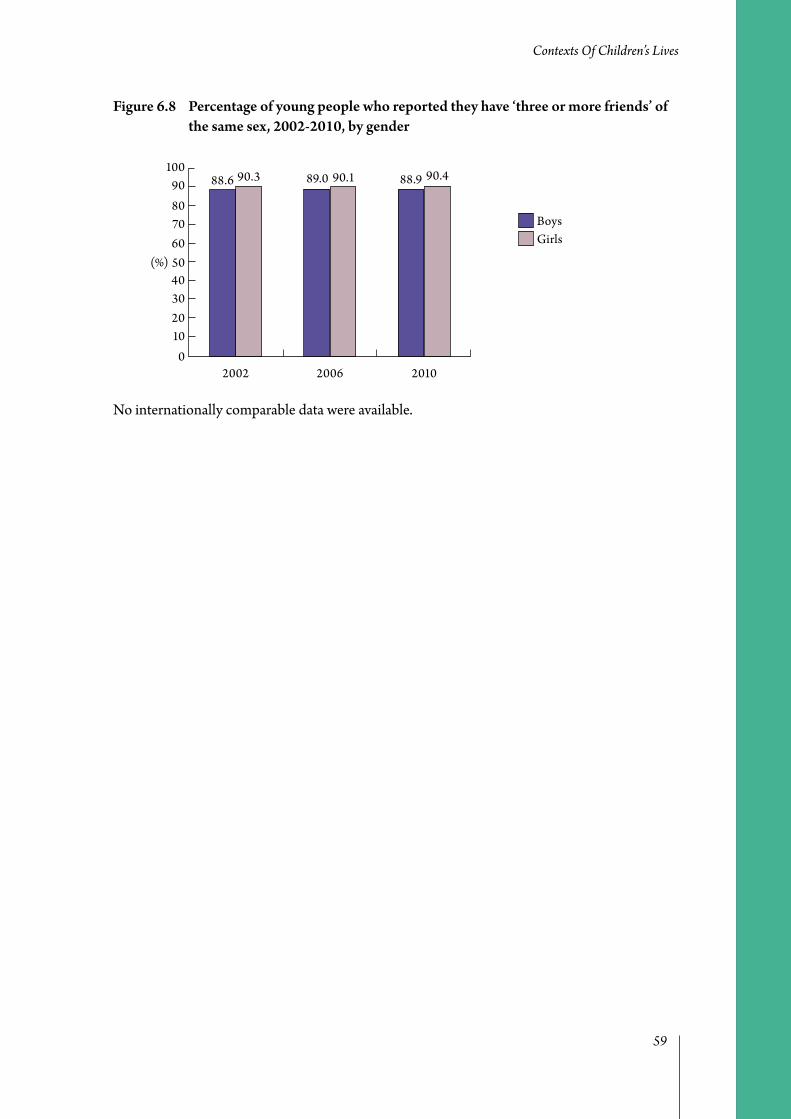
ContextsOfChildren’sLives
59
Figure.6.8. Percentage.of.young.people.who.reported.they.have.‘three.or.more.friends’.of.the.same.sex,.2002-2010,.by.gender
100
80
60
40
20
02002
88.6 90.3
BoysGirls
20102006
89.0 90.1 88.9 90.490
70
(%) 50
30
10
No internationally comparable data were available.

HBSCIrelandTrends2013
60
6.3.2 INDICATOR: Four or more evenings with friends
Measure:Youngpeoplewereaskedhowmanyeveningsperweekafterschooltheyusuallyspendoutwiththeirfriends.Theresponseoptionswere‘0’to‘7’evenings.Thefindingspresentedbelowshowtheproportionwhoreportedspendingfourormoreeveningsperweekoutwithfriends.
Findings
Overall, there was a statistically significant increase between 1998 and 2010 in the percentage of young people who reported they spend four or more evenings after school out with friends. There was a statistically significant increase between 1998 and 2002, the increase between 2002 and 2006 was not significant, and between 2006 and 2010 there was a statistically significant decrease. In general, a higher percentage of boys, younger children and those from lower social classes reported they spend four or more evenings a week with friends.
Table.6.13. Percentage.of.young.people.who.reported.they.spend.four.or.more.evenings.a.week.with.friends.by.gender,.age.group,.social.class.and.year,.1998-2010
1998 2002 2006 2010Overall. 37.7 39.5 42.2 38.7
Girls All 31.8 34.8 38.0 34.3
10.to.11 37.7 37.1 43.1 44.512.to.14 33.0 36.0 40.0 36.215.to.17 25.3 32.2 33.3 28.2
Boys
All 43.8 45.9 46.4 42.910.to.11 46.3 44.1 50.8 46.412.to.14 46.3 48.6 47.5 45.415.to.17 37.9 42.7 44.1 38.7
Girls
SC.1-2 22.2 28.4 28.5 26.6SC.3-4 37.6 39.1 41.1 38.7SC.5-6 37.6 41.7 46.4 45.8
Boys
SC.1-2 33.7 40.7 37.8 37.4SC.3-4 50.9 48.3 50.3 46.1SC.5-6 46.7 52.5 52.9 43.2

ContextsOfChildren’sLives
61
Figure.6.9. Percentage.of.young.people.who.reported.they.spend.four.or.more.evenings.a.week.with.friends,.1999-2010,.by.gender
100
80
60
40
20
01998
43.8
31.8
BoysGirls
201020062002
45.934.8
46.438.0
42.934.3
90
70
(%) 50
30
10
International Comparisons
The relative rank of children in Ireland remained stable between 1998 and 2010. In 2010, children in Ireland were above the HBSC international average for this indicator.
Table.6.14. Summary.international.data:.spending.four.or.more.evenings.per.week.after.school.with.friends,.15.year.olds,.1998-2010,.overall.and.by.gender
OVERALL BOYS GIRLS
1998 2002 2006 2010 1998 2002 2006 2010 1998 2002 2006 2010
HBSC 27 min 7.6 5.0 6.5 4.3 11.8 7.0 9.7 6.3 3.8 3.3 3.9 2.7
HBSC 27 max 65.6 68.4 71.2 73.3 70.7 75.0 73.2 75.3 60.1 63.7 69.3 71.6
HBSC 27 mean 32.2 30.1 29.0 27.0 36.0 33.5 32.6 30.0 28.8 27.0 25.7 24.2
Ireland 34.1 33.5 38.5 31.8 41.0 35.0 43.3 37.3 26.9 32.6 32.9 24.9
Ireland Rank 12 13 9 10 10 13 9 9 15 9 9 13
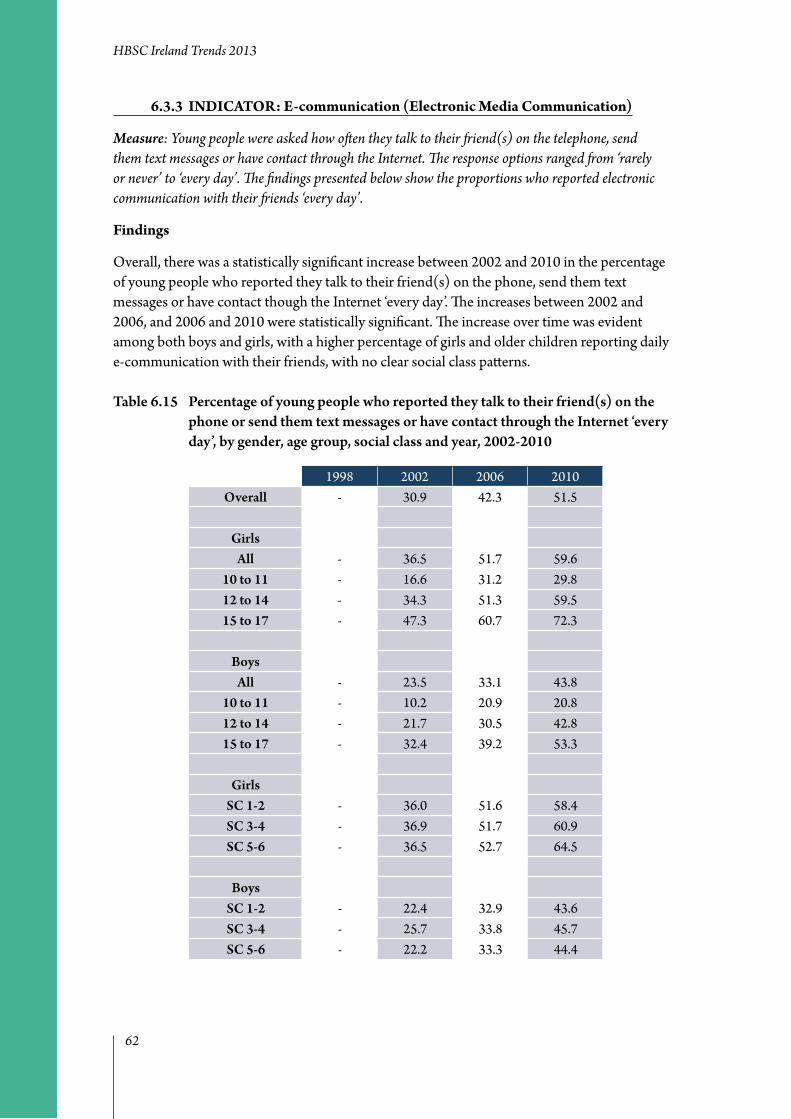
HBSCIrelandTrends2013
62
6.3.3 INDICATOR: E-communication (Electronic Media Communication)
Measure:Youngpeoplewereaskedhowoftentheytalktotheirfriend(s)onthetelephone,sendthemtextmessagesorhavecontactthroughtheInternet.Theresponseoptionsrangedfrom‘rarelyornever’to‘everyday’.Thefindingspresentedbelowshowtheproportionswhoreportedelectroniccommunicationwiththeirfriends‘everyday’.
Findings
Overall, there was a statistically significant increase between 2002 and 2010 in the percentage of young people who reported they talk to their friend(s) on the phone, send them text messages or have contact though the Internet ‘every day’. The increases between 2002 and 2006, and 2006 and 2010 were statistically significant. The increase over time was evident among both boys and girls, with a higher percentage of girls and older children reporting daily e-communication with their friends, with no clear social class patterns.
Table.6.15. Percentage.of.young.people.who.reported.they.talk.to.their.friend(s).on.the.phone.or.send.them.text.messages.or.have.contact.through.the.Internet.‘every.day’,.by.gender,.age.group,.social.class.and.year,.2002-2010
1998 2002 2006 2010Overall - 30.9 42.3 51.5
Girls All - 36.5 51.7 59.6
10.to.11 - 16.6 31.2 29.812.to.14 - 34.3 51.3 59.515.to.17 - 47.3 60.7 72.3
Boys
All - 23.5 33.1 43.810.to.11 - 10.2 20.9 20.812.to.14 - 21.7 30.5 42.815.to.17 - 32.4 39.2 53.3
Girls
SC.1-2 - 36.0 51.6 58.4SC.3-4 - 36.9 51.7 60.9SC.5-6 - 36.5 52.7 64.5
Boys
SC.1-2 - 22.4 32.9 43.6SC.3-4 - 25.7 33.8 45.7SC.5-6 - 22.2 33.3 44.4

ContextsOfChildren’sLives
63
Figure.6.10.Percentage.of.young.people.who.reported.they.talk.to.their.friend(s).on.the.phone.or.send.them.text.messages.or.have.contact.through.the.Internet.‘every.day’,.2002-2010,.by.gender
100
80
60
40
20
02002
23.5
36.5
BoysGirls
20102006
33.1
51.743.8
59.6
90
70
(%) 50
30
10
International Comparisons
Overall, the relative rank of children in Ireland was inconsistent. In 2010, children in Ireland were slightly above the HBSC international average, with girls above and boys below the average for this indicator.
Table.6.16. Summary.international.data:.e-communication.‘every.day’,.15.year.olds,.1998-2010,.overall.and.by.gender
OVERALL BOYS GIRLS
1998 2002* 2006** 2010+ 1998 2002** 2006* 2010+ 1998 2002** 2006* 2010+
HBSC 27 min - 19.3 33.3 47.1 - 16.2 33.2 39.0 - 21.5 33.4 50.0
HBSC 27 max - 56.5 76.1 73.4 - 50.0 69.5 66.3 - 62.7 82.7 81.2
HBSC 27 mean - 39.2 51.8 60.1 - 32.7 44.8 52.4 - 45.1 58.4 67.4
Ireland - 40.9 47.9 60.4 - 31.0 36.4 50.7 - 46.9 61.0 72.7
Ireland Rank 13 20 12 18 23 13 15 8 7
*Hungary not included (no data in 2002)
**Norway not included (no data in 2006)
+ Germany not included (different coding)

HBSCIrelandTrends2013
64
6.3.4 INDICATOR: Talk to friend of same sex
Measure:Youngpeoplewereaskedhoweasyitisforthemtotalktoafriendofthesamesexaboutthingsthatreallybotherthem.Theresponseoptionsrangedfrom‘veryeasy’to‘verydifficult’.Thefindingspresentedbelowshowtheproportionsofyoungpeoplewhoreportedfindingit‘easy’or‘veryeasy’.
Findings
Overall, there was a statistically significant increase between 1998 and 2010 in the percentage of young people who reported they find it ‘easy’ or ‘very easy’ to talk to a friend of the same sex about things that really bother them. The changes between 1998 and 2002, 2002 and 2006, 2006 and 2010 were not statistically significant. In general, a higher percentage of girls and older children reported they find it ‘easy’ or ‘very easy’ to talk to a friend of the same gender about things that really bother them. There were no clear social class patterns across the four surveys.
Table.6.17. Percentage.of.young.people.who.reported.they.find.it.‘easy’.or.‘very.easy’.to.talk.to.a.friend.of.the.same.sex.when.something.is.bothering.them,.by.gender,.age.group,.social.class.and.year,.1998-2010
1998 2002 2006 2010Overall. 79.8 82.2 82.0 82.6
Girls All 87.2 87.6 88.8 89.3
10.to.11 78.4 83.9 85.8 81.812.to.14 87.7 86.9 90.0 90.015.to.17 92.6 89.8 88.4 90.7
Boys
All 71.6 74.2 75.2 76.310.to.11 65.7 75.7 73.4 72.212.to.14 73.8 74.1 76.7 76.715.to.17 71.6 73.5 73.9 76.8
Girls
SC.1-2 86.3 87.7 88.2 90.3SC.3-4 88.5 88.5 89.3 88.9SC.5-6 88.1 85.2 88.6 89.5
Boys
SC.1-2 71.9 73.4 75.0 75.3SC.3-4 72.0 76.6 76.6 77.5SC.5-6 70.5 73.2 73.0 76.3

ContextsOfChildren’sLives
65
Figure.6.11.Percentage.of.young.people.who.reported.they.find.it.easy.or.very.easy.to.talk.to.a.friend.of.the.same.sex.when.something.is.bothering.them,.1998-2010,.by.gender
100
80
60
40
20
01998
71.6
87.2
BoysGirls
201020062002
74.2
87.6
75.2
88.8
76.3
89.390
70
(%) 50
30
10
No internationally comparable data were available.

HBSCIrelandTrends2013
66
6.4 Locality6.4.1 INDICATOR: Feel safe in local area
Measure:Youngpeoplewereaskediftheyfeltsafeintheirlocalarea.Theresponseoptionsrangedfrom‘always’to‘rarelyornever’.Thefindingspresentedbelowshowtheproportionswhoreported‘always’feelingsafeintheirlocalarea.
Findings
Overall, the percentage of young people who reported ‘always’ feeling safe in their local area remained stable between 2002 and 2010 with no statistically significant changes between survey years. In general, a higher percentage of boys and younger children reported ‘always’ feeling safe in their local area. Among boys, across all three surveys, feeling safe in their local area was lowest among those in the lower social classes; this pattern was not evident among girls.
Table.6.18. Percentage.of.young.people.who.reported.‘always’.feeling.safe.in.their.local.area.by.gender,.age.group,.social.class.and.year,.1998-2010
1998 2002 2006 2010Overall. - 52.9 53.0 53.5
Girls All - 50.4 49.6 49.6
10.to.11 - 59.0 53.7 58.812.to.14 - 50.6 52.7 52.515.to.17 - 46.8 44.0 42.6
Boys
All - 56.2 56.3 57.210.to.11 - 59.4 55.2 59.612.to.14 - 55.5 56.7 58.215.to.17 - 55.5 56.2 55.2
Girls
SC.1-2 - 50.5 51.0 51.4SC.3-4 - 50.1 49.1 48.7SC.5-6 - 50.2 49.4 48.5
Boys
SC.1-2 - 58.0 60.0 59.4SC.3-4 - 55.7 54.7 55.9SC.5-6 - 55.4 52.9 54.7

ContextsOfChildren’sLives
67
Figure.6.12.Percentage.of.young.people.who.reported.they.‘always’.feel.safe.in.their.local.area,.1998-2010,.by.gender
100
80
60
40
20
02002
56.250.4
BoysGirls
20102006
56.349.6
57.249.6
90
70
(%) 50
30
10
No internationally comparable data were available.

HBSCIrelandTrends2013
68
6.4.2 INDICATOR: Good places to go to spend free time
Measure:Youngpeoplewereaskedifthereweregoodplacesintheirareatogotospendfreetime.Theresponseoptionsrangedfrom‘stronglyagree’to‘stronglydisagree’.Thefindingspresentedbelowshowtheproportionswhoreported‘stronglyagree’or‘agree’.
Findings
Overall, there was a statistically significant increase between 2002 and 2010 in the percentage of young people who reported there are good places in their area to go to spend free time. The decrease between 2002 and 2006 was statistically significant and the increase between 2006 and 2010 was statistically significant. The increase between 2002 and 2010 was evident among both boys and girls. A higher percentage of boys and younger children reported that there are good places to go to spend free time, with no clear social class patterns across the three surveys.
Table.6.19. Percentage.of.young.people.who.reported.there.are.good.places.to.go.to.spend.free.time.by.gender,.age.group,.social.class.and.year,.2002-2010
1998 2002 2006 2010Overall - 43.8 42.2 51.2
Girls All - 41.0 39.0 49.0
10.to.11 - 59.4 54.9 62.112.to.14 - 43.7 41.9 54.415.to.17 - 31.0 28.5 36.3
Boys
All - 47.8 45.4 53.410.to.11 - 60.0 56.6 67.412.to.14 - 52.4 49.7 57.815.to.17 - 34.9 37.6 42.8
Girls
SC.1-2 - 39.0 36.1 48.0SC.3-4 - 42.7 38.5 49.8SC.5-6 - 42.5 43.4 44.7
Boys
SC.1-2 - 49.1 44.3 52.2SC.3-4 - 47.7 44.7 53.3SC.5-6 - 45.2 48.5 52.9

ContextsOfChildren’sLives
69
Figure.6.13.Percentage.of.young.people.who.reported.there.are.good.places.to.go.to.spend.free.time,.2002-2010,.by.gender
100
80
60
40
20
02002
47.841.0
BoysGirls
20102006
45.439.0
53.4 49.0
90
70
(%) 50
30
10
No internationally comparable data were available.

HBSCIrelandTrends2013
70
6.4.3 INDICATOR: Can ask for help or a favour from neighbours
Measure:Youngpeoplewereaskediftheycanaskforhelporafavourfromtheirneighbours.Theresponseoptionsrangedfrom‘stronglyagree’to‘stronglydisagree’.Thefindingspresentedbelowshowtheproportionwhoreported‘stronglyagree’or‘agree’.
Findings
Overall, there was a statistically significant increase between 2002 and 2010 in the percentage of young people who reported they can ask for help or a favour from their neighbours. The increases between 2002 and 2006, and 2006 and 2010 were statistically significant. A higher percentage of younger children and those from higher social classes reported they can ask for help or a favour from neighbours across all three surveys. There were no apparent gender differences over time.
Table.6.20. Percentage.of.young.people.who.reported.they.can.ask.for.help.or.a.favour.from.neighbours.by.gender,.age.group,.social.class.and.year,.2002-2010
1998 2002 2006 2010Overall - 74.5 78.7 80.0
Girls All - 75.9 79.5 80.1
10.to.11 - 79.1 85.3 83.712.to.14 - 76.1 81.0 81.815.to.17 - 74.6 75.3 76.4
Boys
All - 72.7 78.0 80.010.to.11 - 77.9 86.2 82.912.to.14 - 72.6 80.0 80.815.to.17 - 69.8 73.9 78.2
Girls
SC.1-2 - 75.8 79.8 81.4SC.3-4 - 76.6 80.4 80.6SC.5-6 - 77.1 77.8 77.0
Boys
SC.1-2 - 73.6 80.6 82.1SC.3-4 - 73.7 78.1 81.1SC.5-6 - 71.5 79.3 77.9

ContextsOfChildren’sLives
71
Figure.6.14.Percentage.of.young.people.who.reported.they.can.ask.for.help.or.a.favour.from.their.neighbours,.2002-2010,.by.gender
100
80
60
40
20
02002
72.7 75.9BoysGirls
20102006
78.0 79.5 80.0 80.190
70
(%) 50
30
10
No internationally comparable data were available.

HBSCIrelandTrends2013
72

73
APPENDICES

HBSCIrelandTrends2013
74

75
Table 7.1 Summary of findings in HBSC Ireland Trends 1998-2010; direction of statistically significant differences between rounds of data collection ............................................ 78
Table 7.2 Summary of findings in HBSC Ireland Trends 2002-2010; direction of statistically significant differences between rounds of data collection ............................................ 79
Table 7.3 Representativeness of HBSC survey data in comparison to CSO data ..................... 80Table 7.4 Social class group breakdown by survey year .................................................................. 81Table 7.5 Percentage of young people who report that they find communication with
their step-mothers easy or very easy (of those that have step-mothers). .................. 82Table 7.6 Trends analysis for communication with step-mothers ................................................ 82Table 7.7 Percentage of young people who report that they find communication with
their step-father easy or very easy (of those that have step-fathers). ......................... 83Table 7.8: Trends analysis for communication with step-father ..................................................... 83Table 7.9 Percentage of young people who report that they find communication with
their elder brother easy or very easy (of those that have elder brothers). ................. 84Table 7.10 Trends analysis for communication with elder brother ................................................ 84Table 7.11 Percentage of young people who report that they find communication with
their elder sister easy or very easy (of those that have elder sisters). ......................... 85Table 7.12 Trends analysis for communication with elder sisters ................................................... 85Table 7.13 Percentage of young people who report that their family is very or quite well-off .. 86Table 7.14 Trends analysis for family being well-off .......................................................................... 86Table 7.15 Percentage of young people who report that there is a computer in their home ..... 87Table 7.16 Trends analysis for having a computer at home .............................................................. 87Table 7.17 Percentage of young people who report that their family owns a car, van or truck . 88Table 7.18 Trends analysis for vehicle ownership .............................................................................. 88Table 7.19 Percentage of young people who report that they have their own bedroom ............ 89Table 7.20 Trends analysis for having own bedroom ......................................................................... 89Table 7.21 Percentage of young people who report that they have been on holidays with
their family in the last year ................................................................................................... 90Table 7.22 Trends analysis for going on holidays in the last year .................................................... 90Table 7.23 Percentage of young people who agree that students in their class(es) enjoy
being together ........................................................................................................................ 91Table 7.24 Trends analysis for students enjoying being together .................................................... 91Table 7.25 Percentage of young people who agree that most of the students in their
class(es) are kind and helpful .............................................................................................. 92Table 7.26 Trends analysis for students being kind and helpful ...................................................... 92Table 7.27 Percentage of young people who agree that other students in their class(es)
accept them as they are ........................................................................................................ 93Table 7.28 Trends analysis for other students accepting them as they are .................................... 93Table 7.29 Percentage of young people who agree that students in their school take part in
making school rules .............................................................................................................. 94Table 7.30 Trends analysis for taking part in school rules ................................................................ 94Table 7.31 Percentage of young people who agree that students in their school are treated
too strictly ............................................................................................................................... 95Table 7.32 Trends analysis for students being treated too strictly ................................................... 95
Contents

HBSCIrelandTrends2013
76
Table 7.33 Percentage of young people who agree that their school rules are fair ....................... 96Table 7.34 Trends analysis for school rules being fair ........................................................................ 96Table 7.35 Percentage of young people who agree that their school is a nice place to be .......... 97Table 7.36 Trends analysis for school being a nice place to be ........................................................ 97Table 7.37 Percentage of young people who agree that they belong at their school ................... 98Table 7.38 Trends analysis for feeling they belong at their school .................................................. 98Table 7.39 Percentage of young people who agree that they feel safe at school ........................... 99Table 7.40 Trends analysis for feeling safe at school .......................................................................... 99Table 7.41 Percentage of young people who agree that students in their school are
encouraged to express their views.................................................................................... 100Table 7.42 Trends analysis for students being encouraged to express their own views ............ 100Table 7.43 Percentage of young people who agree that they can get extra help from their
teachers if they need it ........................................................................................................ 101Table 7.44 Trends analysis for getting extra help from teachers when needed ........................... 101Table 7.45 Percentage of young people who agree that their teachers are interested in
them as a person .................................................................................................................. 102Table 7.46 Trends analysis for teachers being interested in them as a person ............................ 102Table 7.47 Percentage of young people who report that they find it easy or very easy
to talk to their best friend .................................................................................................. 103Table 7.48 Trends analysis for finding it easy to talk to their best friend ..................................... 103Table 7.49 Percentage of young people who report that they find it easy or very easy
to talk to friends of the opposite sex ................................................................................ 104Table 7.50 Trends analysis for finding it easy to talk to friends of the opposite sex .................. 104Table 7.51 Percentage of young people who report that their local area is quite or very
well-off ................................................................................................................................... 105Table 7.52 Trends analysis for local area being well-off ................................................................... 105Table 7.53 Percentage of young people who report that there are lots or some groups
of young people causing trouble in their local area ...................................................... 106Table 7.54 Trends analysis for groups causing trouble in the local area ....................................... 106Table 7.55 Percentage of young people who report that there is some or lots of litter,
broken glass or rubbish lying around in their local area .............................................. 107Table 7.56 Trends analysis for litter, broken glass or rubbish in local area .................................. 107Table 7.57 Percentage of young people who report that there are some or lots of run
down houses or buildings in their local area .................................................................. 108Table 7.58 Trends analysis for run down houses or buildings in local area ................................. 108Table 7.59 Percentage of young people who agree that their local area is a good place to live ....109Table 7.60 Trends analysis for local area being a good place to live .............................................. 109Table 7.61 Percentage of young people who agree that it is safe for younger children to
play outside during the day in their local area ............................................................... 110Table 7.62 Trends analysis for being safe for younger children to play outside in local area ... 110Table 7.63 Percentage of young people who report that they ever smoked tobacco ................. 111Table 7.64 Trends analysis for lifetime tobacco smoking ................................................................ 111Table 7.65 Percentage of young people who report that they had ever taken cannabis in
their lifetime ......................................................................................................................... 112Table 7.66 Trends analysis for lifetime cannabis use ....................................................................... 112

77
Table 7.67 Percentage of young people who report that they consume soft drinks containing sugar more than daily ..................................................................................... 113
Table 7.68 Trends analysis for more than daily soft drinks consumption ................................... 113Table 7.69 Percentage of young people who report that they consume ‘diet’ soft drinks
more than daily .................................................................................................................... 114Table 7.70 Trends analysis for more than daily ‘diet’ soft drinks consumption ......................... 114Table 7.71 Percentage of young people who report that they consume crisps more than
daily ........................................................................................................................................ 115Table 7.72 Trends analysis for more than daily crisp consumption .............................................. 115Table 7.73 Percentage of young people who report that they consume vegetables more
than daily ............................................................................................................................... 116Table 7.74 Trends analysis for more than daily vegetable consumption ..................................... 116Table 7.75 Percentage of young people who report that they have been in a physical fight
during the last 12 months .................................................................................................. 117Table 7.76 Trends analysis for physical fighting in the last 12 months ......................................... 117Table 7.77 Percentage of young people who report that they watch television for two or
more hours per day on weekdays ..................................................................................... 118Table 7.78 Trends analysis for watching television for two or more hours on weekdays ......... 118Table 7.79 Percentage of young people who report that watch television for two or more
hours per day on weekends ............................................................................................... 119Table 7.80 Trends analysis for watching television for two or more hours per day on
weekends ............................................................................................................................... 119Table 7.81 Percentage of young people who report being physically active for at least 60
minutes per day for four or more of the last seven days .............................................. 120Table 7.82 Trends analysis for physical activity over the last seven days ..................................... 120Table 7.83 Percentage of young people who report that they have had stomach-ache
weekly or more frequently over the last six months ..................................................... 121Table 7.84 Trends analysis for at least weekly stomach-ache ........................................................ 121Table 7.85 Percentage of young people who report that they have had backache weekly
or more frequently over the last six months................................................................... 122Table 7.86 Trends analysis for at least weekly backache .................................................................. 122Table 7.87 Percentage of young people who report that they have had irritability or
bad temper weekly or more frequently over the last six months ............................... 123Table 7.88 Trends analysis for at least weekly irritability or bad temper ..................................... 123Table 7.89 Percentage of young people who report that they felt nervous weekly or more
frequently over the last six months .................................................................................. 124Table 7.90 Trends analysis for at least weekly nervousness ............................................................ 124Table 7.91 Percentage of young people who report that they felt dizzy weekly or more
frequently over the last six months .................................................................................. 125Table 7.92 Trends analysis for at least weekly dizziness .................................................................. 125Table 7.93 Percentage of young people who report that they have been bullied at
school in the past couple of months ................................................................................ 126Table 7.94 Trends analysis for being bullied at school in the last couple of months ................. 126Table 7.95 Percentage of young people who report that they think their body is too fat ......... 127Table 7.96 Trends analysis for thinking they are too fat .................................................................. 127

78
APPENDICES
Table.7.1. Summary.of.findings.in.HBSC.Ireland.Trends.1998-2010;.direction.of.statistically.significant.differences.between.rounds.of.data.collection
Overall.(1998-2010) 1998-2002 2002-2006 2006-2010
Communication.with.mother (↑) (↑) (↑) ( - )
Communication.with.father (↑) (↑) (↑) (↑)
Living.with.both.parents (↓) (↓) (↓) (↓)
Pressured.by.schoolwork (↑) (↑) (↑) (↓)
Teachers.treat.students.fairly (↑) (↑) (↓) (↑)
4+.evenings.with.friends (↑) (↑) ( - ) (↓)
Talk.to.friend.of.same.sex (↑) ( - ) ( - ) ( - )
Current.Smoker (↓) (↓) (↓) (↓)
Ever.been.drunk (↓) ( - ) (↑) (↓)
Cannabis.use.last.12.months (↓) ( - ) ( - ) (↓)
Bully.others (↓) (↓) ( - ) (↓)
Tooth.brushing (↑) (↑) (↑) (↑)
Seatbelt. (↑) (↑) (↑) (↑)
Exercise.4+.days.per.week (↓) (↓) (↑) (↓)
Headache. ( - ) ( - ) ( - ) ( - )
Feeling.low. (↑) (↑) (↓) ( - )
Times.injured (↓) (↑) (↓) (↓)
Happy.with.life. (↑) (↑) (↑) ( - )
(↑): indicates an increase
(↓): indicates a decrease
( - ): no statistically significant change over time
7

Appendices
79
Table.7.2. Summary.of.findings.in.HBSC.Ireland.Trends.2002-2010;.direction.of.statistically.significant.differences.between.rounds.of.data.collection
Overall.(2002-2010)
2002-2006 2006-2010
Liking.school.. (↑) ( - ) (↑)
Organise.school.events. (↑) (↑) (↑)
Close.friends.of.the.same.gender ( - ) ( - ) ( - )
E-communication. (↑) (↑) (↑)
Feel.safe.in.the.local.area ( - ) ( - ) ( - )
Good.places.to.spend.free.time (↑) (↓) (↑)
Can.ask.neighbours.for.help.. (↑) (↑) (↑)
Age.of.first.cigarette.(age.≤13) (↓) (↓) (↓)
Fruit.consumption (↑) (↑) ( - )
On.a.diet. ( - ) (↓) (↑)
Self-reported.health. (↑) (↑) (↓)
Life.satisfaction. (↑) (↑) ( - )
(↑): indicates an increase
(↓): indicates a decrease
( - ): no statistically significant change over time

HBSCIrelandTrends2013
80
Tabl
e.7.
3.R
epre
sent
ativ
enes
s.of.H
BSC
.surv
ey.d
ata.
in.co
mpa
riso
n.to
.CSO
.dat
a
%H
BSC
.199
8C
SO.1
996
HB
SC.2
002
CSO
.200
2H
BSC
.200
6C
SO.2
006
HB
SC.2
010
CSO
.201
1G
ende
rB
oys.(
10-1
8.ye
ars)
48.8
51.4
(9-1
6 Ye
ars)
43.0
51.2
51.1
51.2
51.4
51.1
(11-
19
Year
s)G
irls
.(10-
18.y
ears
)51
.248
.6 (9
-16
Year
s)57
.048
.848
.948
.848
.648
.9 (1
1-19
Ye
ars)
Age
10.y
ears
3.6
2.8
10.4
1.8
10.8
11.3
11.6
(11
Year
s)11
.yea
rs16
.011
.4 (9
Yea
rs)
13.0
10.7
11.6
10.7
11.3
11.7
(12
Year
s)12
.yea
rs17
.611
.6 (1
0 Ye
ars)
15.2
10.6
13.3
10.6
12.5
11.4
(13
Year
s)13
.yea
rs15
.711
.8 (1
1 Ye
ars)
16.2
10.6
17.0
10.9
15.8
11.3
(14
Year
s)14
.yea
rs17
.212
.2 (1
2 Ye
ars)
16.1
11.1
17.0
11.3
15.7
10.9
(15
Year
s)15
.yea
rs16
.012
.8 (1
3 Ye
ars)
15.8
11.4
16.5
11.6
14.5
10.7
(16
Year
s)16
.yea
rs11
.313
.2 (1
4 Ye
ars)
14.8
11.5
14.9
11.2
11.9
10.7
(17
Year
s)17
.yea
rs2.
313
.5 (1
5 Ye
ars)
5.5
11.8
7.0
11.3
5.9
10.8
(18
Year
s)18
.yea
rs0.
313
.6 (1
6 Ye
ars)
0.7
11.8
0.9
11.6
1.0
10.9
(19
Year
s)
Gen
der.&
.Age
2.5
10.3
1.2
10.9
10.6
11.6
(11
Year
s)B
oy.(1
1.ye
ars)
15.0
11.
4 (9
Yea
rs)
14.2
10.8
9.5
10.7
11.0
11.7
(12
Year
s)B
oy.(1
2.ye
ars)
16.8
11.6
(10
Year
s)16
.510
.611
.310
.611
.511
.5 (1
3 Ye
ars)
Boy
.(13.
year
s)16
.211
.8 (1
1 Ye
ars)
16.8
10.6
18.2
11.0
16.1
11.3
(14
Year
s)B
oy.(1
4.ye
ars)
18.3
12.2
(12
Year
s)15
.511
.118
.211
.316
.511
.0 (1
5 Ye
ars)
Boy
.(15.
year
s)16
.512
.8 (1
3 Ye
ars)
14.9
11.5
17.6
11.7
15.0
10.7
(16
Year
s)B
oy.(1
6.ye
ars)
11.7
13.1
(14
Year
s)13
.511
.514
.911
.212
.010
.7 (1
7 Ye
ars)
Boy
.(17.
year
s)2.
113
.5 (1
5 Ye
ars)
5.4
11.9
7.3
11.2
6.2
10.9
(18
Year
s)B
oy.(1
8.ye
ars)
0.2
13.6
(16
Year
s)0.
711
.81.
211
.51.
110
.7 (1
9 Ye
ars)
3.0
10.5
2.4
10.7
12.1
11.6
(11
Year
s)G
irl.(
11.y
ears
)17
.011
.3 (9
Yea
rs)
12.1
10.6
13.8
10.7
11.7
11.6
(12
Year
s)G
irl.(
12.y
ears
)18
.311
.6 (1
0 Ye
ars)
14.2
10.6
14.7
10.6
13.4
11.4
(13
Year
s)G
irl.(
13.y
ears
)15
.211
.7 (1
1 Ye
ars)
15.7
10.6
15.8
10.9
15.5
11.2
(14
Year
s)G
irl.(
14.y
ears
)16
.112
.2 (1
2 Ye
ars)
16.5
11.2
15.8
11.4
14.9
10.9
(15
Year
s)G
irl.(
15.y
ears
)15
.612
.9 (1
3 Ye
ars)
16.5
11.3
15.3
11.5
13.9
10.7
(16
Year
s)G
irl.(
16.y
ears
)10
.913
.2 (1
4 Ye
ars)
15.7
11.6
14.9
11.3
11.9
10.6
(17
Year
s)G
irl.(
17.y
ears
)2.
413
.5 (1
5 Ye
ars)
5.5
11.7
6.7
11.3
5.6
10.8
(18
Year
s)G
irl.(
18.y
ears
)0.
413
.5 (1
6 Ye
ars)
0.7
11.8
0.7
11.7
0.9
11.1
(19
Year
s)

Appendices
81
Table.7.4. Social.class.group.breakdown.by.survey.year
2010 2006 2002 1998
SC 1-2 43.9 SC 1-2 38.6 SC 1-2 44.1 SC 1-2 45.3
SC 3-4 29.9 SC 3-4 36.8 SC 3-4 34.9 SC 3-4 33.7
SC 5-6 8.5 SC 5-6 12.4 SC 5-6 12.1 SC 5-6 16.3
Unknown/Sysmis
17.7Unknown/
Sysmis12.2
Unknown/Sysmis
9.0Unknown/
Sysmis9.9
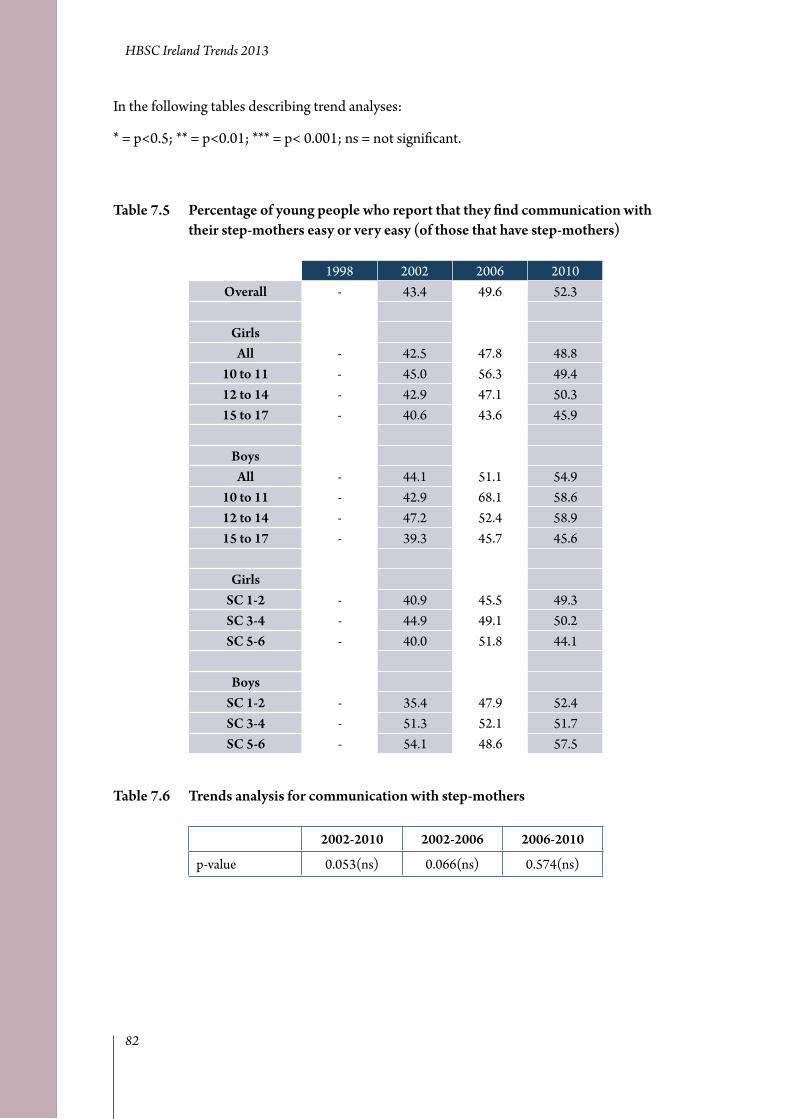
HBSCIrelandTrends2013
82
In the following tables describing trend analyses:
* = p<0.5; ** = p<0.01; *** = p< 0.001; ns = not significant.
Table.7.5. Percentage.of.young.people.who.report.that.they.find.communication.with.their.step-mothers.easy.or.very.easy.(of.those.that.have.step-mothers)
1998 2002 2006 2010Overall - 43.4 49.6 52.3
GirlsAll - 42.5 47.8 48.8
10.to.11 - 45.0 56.3 49.412.to.14 - 42.9 47.1 50.315.to.17 - 40.6 43.6 45.9
Boys
All - 44.1 51.1 54.910.to.11 - 42.9 68.1 58.612.to.14 - 47.2 52.4 58.915.to.17 - 39.3 45.7 45.6
Girls
SC.1-2 - 40.9 45.5 49.3SC.3-4 - 44.9 49.1 50.2SC.5-6 - 40.0 51.8 44.1
Boys
SC.1-2 - 35.4 47.9 52.4SC.3-4 - 51.3 52.1 51.7SC.5-6 - 54.1 48.6 57.5
Table.7.6. Trends.analysis.for.communication.with.step-mothers
2002-2010 2002-2006 2006-2010
p-value 0.053(ns) 0.066(ns) 0.574(ns)

Appendices
83
Table.7.7. Percentage.of.young.people.who.report.that.they.find.communication.with.their.step-father.easy.or.very.easy.(of.those.that.have.step-fathers)
1998 2002 2006 2010Overall - 42.1 51.5 54.2
GirlsAll - 36.3 45.1 46.9
10.to.11 - 52.7 57.0 58.112.to.14 - 27.7 47.3 45.615.to.17 - 35.6 36.3 44.1
Boys
All - 48.1 56.9 59.810.to.11 - 58.0 69.5 71.212.to.14 - 53.7 56.1 61.515.to.17 - 32.9 54.5 52.5
Girls
SC.1-2 - 33.3 43.7 50.6SC.3-4 - 36.0 45.5 48.6SC.5-6 - 40.0 55.3 39.6
Boys
SC.1-2 - 43.8 54.5 56.2SC.3-4 - 60.2 55.4 59.9SC.5-6 - 51.3 55.4 61.5
Table.7.8:..Trends.analysis.for.communication.with.step-father
2002-2010 2002-2006 2006-2010
p-value 0.001*** 0.004** 0.357(ns)
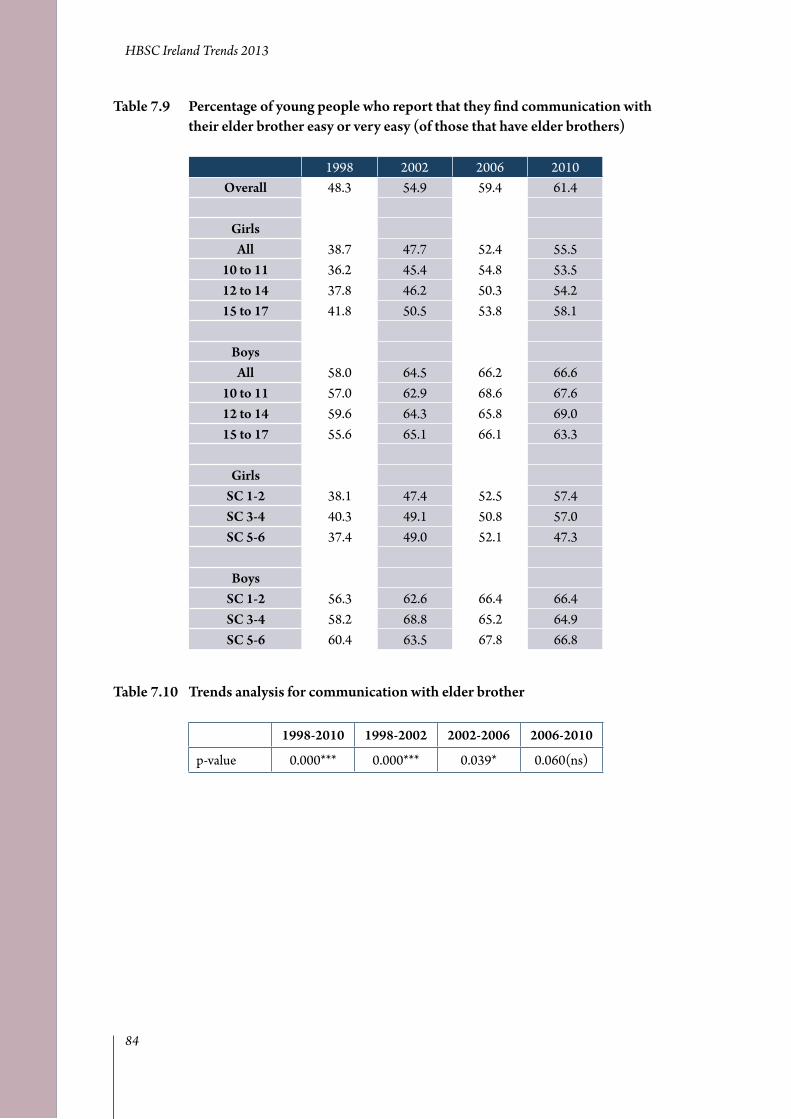
HBSCIrelandTrends2013
84
Table.7.9. Percentage.of.young.people.who.report.that.they.find.communication.with.their.elder.brother.easy.or.very.easy.(of.those.that.have.elder.brothers)
1998 2002 2006 2010Overall 48.3 54.9 59.4 61.4
GirlsAll 38.7 47.7 52.4 55.5
10.to.11 36.2 45.4 54.8 53.512.to.14 37.8 46.2 50.3 54.215.to.17 41.8 50.5 53.8 58.1
Boys
All 58.0 64.5 66.2 66.610.to.11 57.0 62.9 68.6 67.612.to.14 59.6 64.3 65.8 69.015.to.17 55.6 65.1 66.1 63.3
Girls
SC.1-2 38.1 47.4 52.5 57.4SC.3-4 40.3 49.1 50.8 57.0SC.5-6 37.4 49.0 52.1 47.3
Boys
SC.1-2 56.3 62.6 66.4 66.4SC.3-4 58.2 68.8 65.2 64.9SC.5-6 60.4 63.5 67.8 66.8
Table.7.10. Trends.analysis.for.communication.with.elder.brother
1998-2010 1998-2002 2002-2006 2006-2010
p-value 0.000*** 0.000*** 0.039* 0.060(ns)
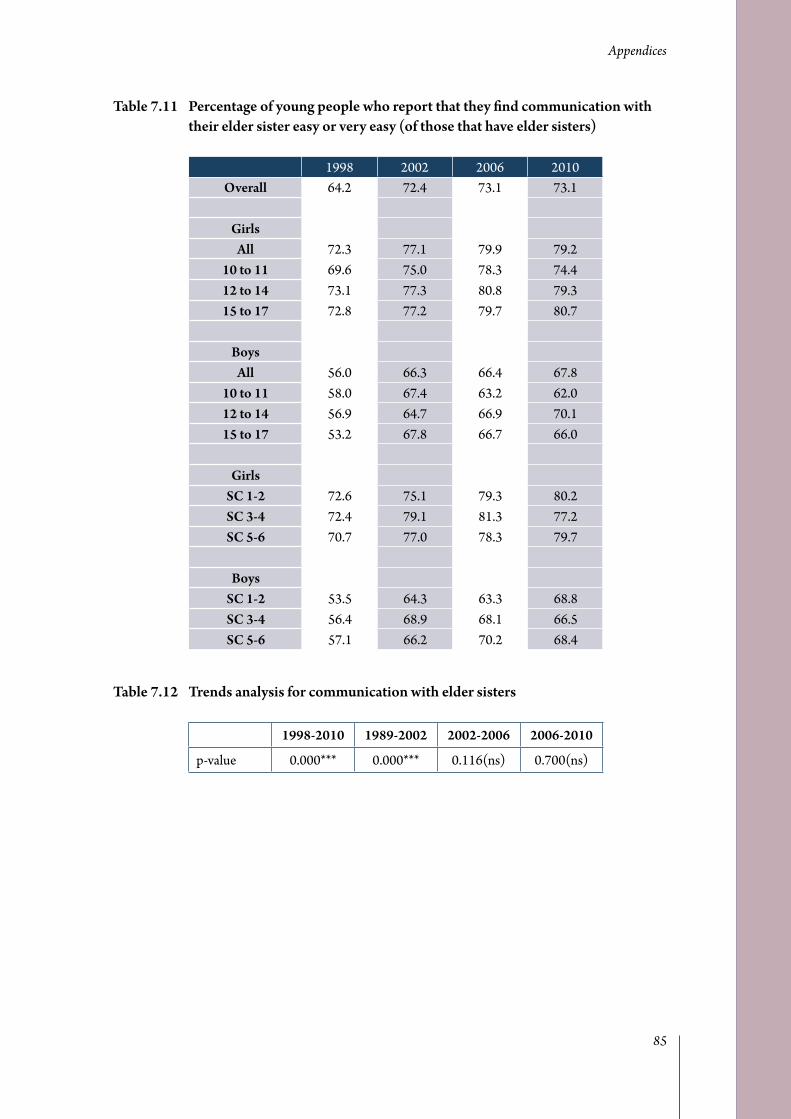
Appendices
85
Table.7.11. Percentage.of.young.people.who.report.that.they.find.communication.with.their.elder.sister.easy.or.very.easy.(of.those.that.have.elder.sisters)
1998 2002 2006 2010Overall 64.2 72.4 73.1 73.1
GirlsAll 72.3 77.1 79.9 79.2
10.to.11 69.6 75.0 78.3 74.412.to.14 73.1 77.3 80.8 79.315.to.17 72.8 77.2 79.7 80.7
Boys
All 56.0 66.3 66.4 67.810.to.11 58.0 67.4 63.2 62.012.to.14 56.9 64.7 66.9 70.115.to.17 53.2 67.8 66.7 66.0
Girls
SC.1-2 72.6 75.1 79.3 80.2SC.3-4 72.4 79.1 81.3 77.2SC.5-6 70.7 77.0 78.3 79.7
Boys
SC.1-2 53.5 64.3 63.3 68.8SC.3-4 56.4 68.9 68.1 66.5SC.5-6 57.1 66.2 70.2 68.4
Table.7.12. Trends.analysis.for.communication.with.elder.sisters
1998-2010 1989-2002 2002-2006 2006-2010
p-value 0.000*** 0.000*** 0.116(ns) 0.700(ns)

HBSCIrelandTrends2013
86
Table.7.13. Percentage.of.young.people.who.report.that.their.family.is.very.or.quite.well-off
1998 2002 2006 2010Overall 46.7 51.4 56.6 49.0
GirlsAll 42.5 48.9 53.1 45.2
10.to.11 49.9 54.1 57.2 46.912.to.14 43.0 51.8 55.9 47.615.to.17 36.4 44.2 48.1 41.3
Boys
All 51.1 54.8 60.0 52.710.to.11 57.5 59.5 64.0 53.012.to.14 52.7 57.7 62.8 56.215.to.17 44.7 48.4 56.2 48.2
Girls
SC.1-2 48.7 55.0 61.6 51.3SC.3-4 41.7 45.6 49.8 40.9SC.5-6 35.1 40.4 44.5 37.0
Boys
SC.1-2 58.0 59.3 67.9 58.5SC.3-4 49.7 53.0 57.8 48.7SC.5-6 44.0 47.9 48.4 46.7
Table.7.14. Trends.analysis.for.family.being.well-off
1998-2010 1998-2002 2002-2006 2006-2010
p-value 0.000*** 0.000*** 0.000*** 0.000***

Appendices
87
Table.7.15. Percentage.of.young.people.who.report.that.there.is.a.computer.in.their.home
1998 2002 2006 2010Overall - 84.9 91.9 97.6
GirlsAll - 84.4 91.6 97.9
10.to.11 - 82.7 89.0 96.412.to.14 - 85.1 91.1 98.315.to.17 - 84.7 93.4 98.0
Boys
All - 85.5 92.3 97.310.to.11 - 84.4 90.7 95.512.to.14 - 85.0 92.3 97.615.to.17 - 87.1 92.8 97.6
Girls
SC.1-2 - 90.2 96.5 98.7SC.3-4 - 83.0 91.2 98.4SC.5-6 - 75.0 87.3 98.0
Boys
SC.1-2 - 89.6 96.1 98.4SC.3-4 - 85.4 93.0 98.4SC.5-6 - 77.3 86.2 96.6
Table.7.16. Trends.analysis.for.having.a.computer.at.home
2002-2010 2002-2006 2006-2010
p-value 0.000*** 0.000*** 0.000***

HBSCIrelandTrends2013
88
Table.7.17. Percentage.of.young.people.who.report.that.their.family.owns.a.car,.van.or.truck
1998 2002 2006 2010Overall 93.0 94.9 94.7 95.9
GirlsAll 93.0 95.2 94.7 95.6
10.to.11 91.5 95.8 94.1 95.912.to.14 93.4 95.1 94.4 95.615.to.17 94.0 95.0 95.3 95.8
Boys
All 93.1 94.6 94.7 96.110.to.11 91.5 94.4 94.8 95.212.to.14 93.3 94.5 95.3 95.915.to.17 93.9 94.5 94.3 96.8
Girls
SC.1-2 98.1 97.4 98.5 98.1SC.3-4 93.6 96.4 96.3 96.8SC.5-6 89.7 91.3 89.4 92.4
Boys
SC.1-2 98.0 96.6 97.8 98.0SC.3-4 94.5 94.9 96.4 97.3SC.5-6 87.0 90.7 89.1 93.2
Table.7.18. Trends.analysis.for.vehicle.ownership
1998-2010 1998-2002 2002-2006 2006-2010
p-value 0.000*** 0.198(ns) 0.070(ns) 0.013*

Appendices
89
Table.7.19. Percentage.of.young.people.who.report.that.they.have.their.own.bedroom
1998 2002 2006 2010Overall 62.3 71.6 76.1 80.6
GirlsAll 63.1 73.1 76.8 81.6
10.to.11 58.2 69.8 71.4 75.512.to.14 63.7 71.7 75.0 80.715.to.17 66.2 76.2 81.4 85.2
Boys
All 61.5 69.6 75.3 79.610.to.11 55.3 64.7 69.5 72.012.to.14 59.6 69.0 73.7 78.915.to.17 68.2 72.3 79.0 82.9
Girls
SC.1-2 69.7 78.1 82.6 85.9SC.3-4 62.6 70.8 76.3 80.0SC.5-6 56.0 66.0 70.4 74.9
Boys
SC.1-2 68.0 71.9 80.4 82.9SC.3-4 60.2 69.6 72.9 79.1SC.5-6 52.9 63.7 69.5 75.3
Table.7.20. Trends.analysis.for.having.own.bedroom
1998-2010 1998-2002 2002-2006 2006-2010
p-value 0.000*** 0.000*** 0.000*** 0.000***

HBSCIrelandTrends2013
90
Table.7.21. Percentage.of.young.people.who.report.that.they.have.been.on.holidays.with.their.family.in.the.last.year
1998 2002 2006 2010Overall 75.4 81.0 79.9 80.0
GirlsAll 73.6 82.6 79.1 80.1
10.to.11 80.5 85.4 81.3 83.112.to.14 77.3 85.2 81.1 82.415.to.17 62.9 78.4 76.0 76.0
Boys
All 77.3 79.0 80.8 79.910.to.11 82.5 83.6 85.4 86.212.to.14 80.5 81.8 84.7 83.015.to.17 68.7 73.1 75.6 74.2
Girls
SC.1-2 77.7 86.4 84.4 84.0SC.3-4 75.8 81.0 78.1 80.5SC.5-6 66.4 78.0 76.2 73.3
Boys
SC.1-2 78.9 80.3 84.6 84.5SC.3-4 79.3 80.3 80.6 80.3SC.5-6 73.3 74.4 75.3 74.1
Table.7.22. Trends.analysis.for.going.on.holidays.in.the.last.year
1998-2010 1998-2002 2002-2006 2006-2010
p-value 0.000*** 0.000*** 0.960(ns) 0.965(ns)

Appendices
91
Table.7.23. Percentage.of.young.people.who.agree.that.students.in.their.class(es).enjoy.being.together
1998 2002 2006 2010Overall 79.0 75.4 74.4 77.6
GirlsAll 79.7 75.2 74.4 76.8
10.to.11 85.4 82.3 81.8 80.712.to.14 80.7 77.6 74.0 77.415.to.17 73.7 69.3 72.1 74.7
Boys
All 78.4 75.6 74.4 78.310.to.11 83.0 83.9 83.5 80.912.to.14 80.4 77.3 74.7 78.915.to.17 72.5 69.3 71.5 76.7
Girls
SC.1-2 79.0 74.5 74.8 78.5SC.3-4 80.8 75.7 74.5 76.2SC.5-6 79.2 74.8 72.8 74.9
Boys
SC.1-2 77.7 76.3 77.3 78.0SC.3-4 79.2 76.0 73.3 80.5SC.5-6 80.9 74.4 71.2 77.0
Table.7.24. Trends.analysis.for.students.enjoying.being.together
1998-2010 1998-2002 2002-2006 2006-2010
p-value 0.000*** 0.000*** 0.437(ns) 0.000***

HBSCIrelandTrends2013
92
Table.7.25. Percentage.of.young.people.who.agree.that.most.of.the.students.in.their.class(es).are.kind.and.helpful
1998 2002 2006 2010Overall 68.3 68.5 67.6 73.1
GirlsAll 76.7 74.0 73.8 78.5
10.to.11 79.4 80.2 84.6 84.512.to.14 76.5 73.2 74.4 78.515.to.17 75.0 72.4 68.9 76.4
Boys
All 59.5 61.0 61.6 68.110.to.11 69.1 73.0 78.1 76.312.to.14 59.7 61.5 62.0 68.915.to.17 53.2 54.5 56.7 64.1
Girls
SC.1-2 76.7 74.4 74.0 79.2SC.3-4 77.3 73.9 74.1 78.7SC.5-6 76.8 73.5 71.4 77.6
Boys
SC.1-2 59.1 61.1 62.8 70.3SC.3-4 59.2 62.2 61.9 70.7SC.5-6 62.1 56.7 61.9 63.6
Table.7.26. Trends.analysis.for.students.being.kind.and.helpful
1998-2010 1998-2002 2002-2006 2006-2010
p-value 0.000*** 0.772(ns) 0.254(ns) 0.000***
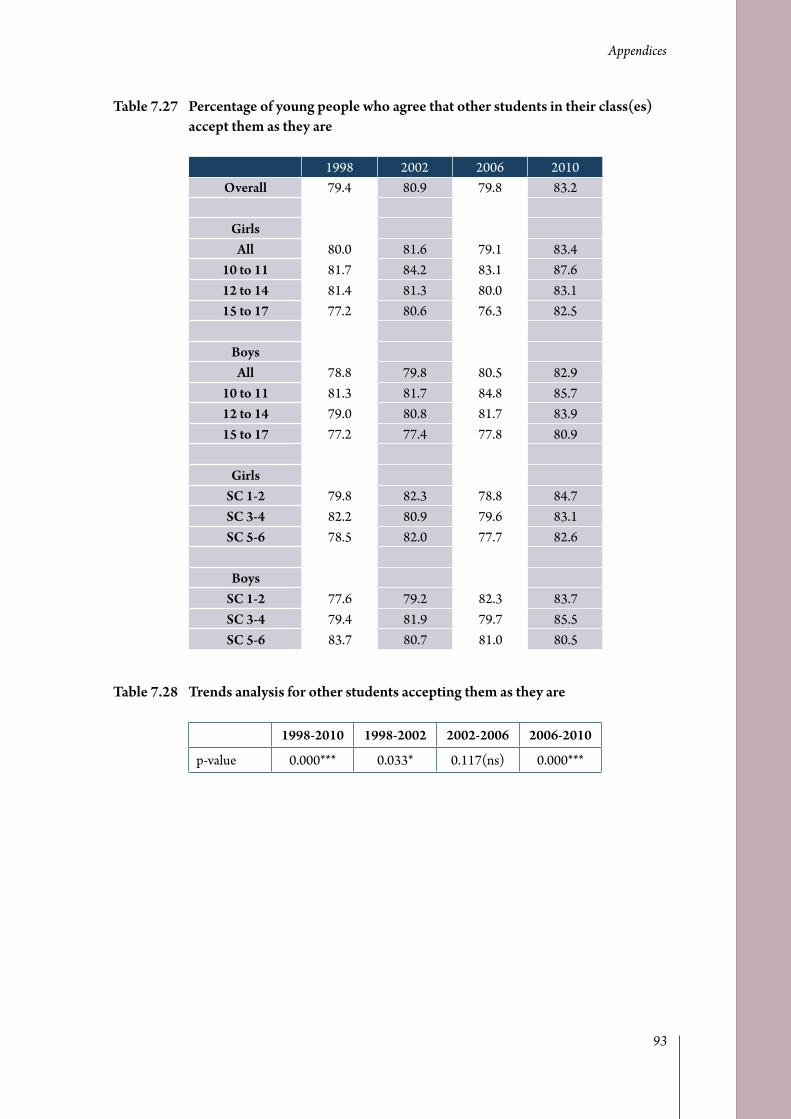
Appendices
93
Table.7.27. Percentage.of.young.people.who.agree.that.other.students.in.their.class(es).accept.them.as.they.are
1998 2002 2006 2010Overall 79.4 80.9 79.8 83.2
GirlsAll 80.0 81.6 79.1 83.4
10.to.11 81.7 84.2 83.1 87.612.to.14 81.4 81.3 80.0 83.115.to.17 77.2 80.6 76.3 82.5
Boys
All 78.8 79.8 80.5 82.910.to.11 81.3 81.7 84.8 85.712.to.14 79.0 80.8 81.7 83.915.to.17 77.2 77.4 77.8 80.9
Girls
SC.1-2 79.8 82.3 78.8 84.7SC.3-4 82.2 80.9 79.6 83.1SC.5-6 78.5 82.0 77.7 82.6
Boys
SC.1-2 77.6 79.2 82.3 83.7SC.3-4 79.4 81.9 79.7 85.5SC.5-6 83.7 80.7 81.0 80.5
Table.7.28. Trends.analysis.for.other.students.accepting.them.as.they.are
1998-2010 1998-2002 2002-2006 2006-2010
p-value 0.000*** 0.033* 0.117(ns) 0.000***

HBSCIrelandTrends2013
94
Table.7.29. Percentage.of.young.people.who.agree.that.students.in.their.school.take.part.in.making.school.rules
1998 2002 2006 2010Overall - 23.5 22.5 32.5
GirlsAll - 22.4 23.1 34.5
10.to.11 - 38.0 42.5 49.112.to.14 - 23.9 23.6 39.015.to.17 - 13.9 14.0 23.1
Boys
All - 25.0 21.9 30.610.to.11 - 33.7 33.2 40.712.to.14 - 27.9 24.6 35.115.to.17 - 15.5 15.9 21.4
Girls
SC.1-2 - 21.3 21.0 32.9SC.3-4 - 21.8 23.0 36.0SC.5-6 - 23.7 25.4 34.2
Boys
SC.1-2 - 24.8 19.6 29.3SC.3-4 - 26.1 21.9 31.3SC.5-6 - 25.4 23.6 30.2
Table.7.30. Trends.analysis.for.taking.part.in.school.rules
2002-2010 2002-2006 2006-2010
p-value 0.000*** 0.275(ns) 0.000***

Appendices
95
Table.7.31. Percentage.of.young.people.who.agree.that.students.in.their.school.are.treated.too.strictly
1998 2002 2006 2010Overall 33.0 36.7 33.0 34.7
GirlsAll 29.0 33.8 31.0 32.5
10.to.11 22.7 25.2 21.0 22.412.to.14 28.4 34.9 30.3 30.715.to.17 34.5 36.2 36.3 39.1
Boys
All 37.2 40.7 34.8 36.810.to.11 31.2 35.7 24.8 30.112.to.14 38.6 40.6 33.9 37.015.to.17 38.2 43.4 38.6 39.1
Girls
SC.1-2 27.4 30.7 29.3 30.5SC.3-4 29.5 36.3 31.7 32.3SC.5-6 29.0 34.3 30.7 34.3
Boys
SC.1-2 35.8 39.0 32.9 33.7SC.3-4 37.6 40.5 34.1 38.5SC.5-6 37.5 44.9 35.4 35.8
Table.7.32. Trends.analysis.for.students.being.treated.too.strictly
1998-2010 1998-2002 2002-2006 2006-2010
p-value 0.000*** 0.000*** 0.000*** 0.008**

HBSCIrelandTrends2013
96
Table.7.33. Percentage.of.young.people.who.agree.that.their.school.rules.are.fair
1998 2002 2006 2010Overall 55.3 55.2 55.0 60.3
GirlsAll 57.7 54.9 57.8 61.3
10.to.11 69.1 72.6 81.0 79.812.to.14 58.4 55.6 59.3 64.615.to.17 48.0 46.4 45.7 49.6
Boys
All 52.8 55.6 52.4 59.310.to.11 63.0 68.1 74.7 75.512.to.14 52.6 59.5 55.7 62.715.to.17 47.2 43.3 42.7 48.9
Girls
SC.1-2 56.2 54.6 56.9 61.4SC.3-4 58.2 54.5 57.0 62.7SC.5-6 60.7 56.3 61.9 59.6
Boys
SC.1-2 53.1 55.2 53.5 60.6SC.3-4 52.7 57.4 53.3 59.0SC.5-6 52.4 55.0 49.7 64.4
Table.7.34. Trends.analysis.for.school.rules.being.fair
1998-2010 1998-2002 2002-2006 2006-2010
p-value 0.000*** 0.130(ns) 0.174(ns) 0.000***

Appendices
97
Table.7.35. Percentage.of.young.people.who.agree.that.their.school.is.a.nice.place.to.be
1998 2002 2006 2010Overall 54.2 58.0 57.7 63.9
GirlsAll 60.3 60.9 62.7 68.3
10.to.11 72.5 76.4 84.1 79.712.to.14 61.4 60.4 64.3 70.915.to.17 49.4 55.4 51.6 60.4
Boys
All 47.7 53.9 52.9 59.710.to.11 53.5 65.5 72.7 73.412.to.14 50.1 56.3 56.2 62.215.to.17 39.5 44.1 43.6 51.7
Girls
SC.1-2 61.0 62.4 62.9 70.7SC.3-4 59.4 60.6 61.7 67.4SC.5-6 62.6 55.6 63.9 63.7
Boys
SC.1-2 48.7 56.2 54.7 61.7SC.3-4 47.2 52.8 51.4 60.5SC.5-6 46.9 53.9 51.8 61.1
Table.7.36. Trends.analysis.for.school.being.a.nice.place.to.be
1998-2010 1998-2002 2002-2006 2006-2010
p-value 0.000*** 0.000*** 0.205(ns) 0.000***

HBSCIrelandTrends2013
98
Table.7.37. Percentage.of.young.people.who.agree.that.they.belong.at.their.school
1998 2002 2006 2010Overall 62.1 65.8 67.8 68.8
GirlsAll 66.6 68.2 70.5 71.2
10.to.11 74.1 78.8 83.1 79.912.to.14 68.2 68.1 72.0 73.315.to.17 58.9 63.8 63.4 65.3
Boys
All 57.3 62.7 65.2 66.510.to.11 62.3 70.3 79.3 76.112.to.14 59.3 65.7 68.3 69.015.to.17 51.3 54.5 58.1 59.9
Girls
SC.1-2 67.8 69.2 71.4 72.8SC.3-4 66.2 68.3 70.0 71.6SC.5-6 69.0 64.7 71.4 68.2
Boys
SC.1-2 59.0 63.3 67.2 68.5SC.3-4 57.0 63.2 65.3 68.0SC.5-6 57.4 62.6 65.2 67.0
Table.7.38. Trends.analysis.for.feeling.they.belong.at.their.school
1998-2010 1998-2002 2002-2006 2006-2010
p-value 0.000*** 0.000*** 0.000*** 0.091(ns)

Appendices
99
Table.7.39. Percentage.of.young.people.who.agree.that.they.feel.safe.at.school
1998 2002 2006 2010Overall 85.5 72.5 72.1 76.2
GirlsAll 86.9 74.9 74.7 80.6
10.to.11 87.9 85.8 89.5 90.312.to.14 86.7 74.3 75.2 81.115.to.17 86.7 71.2 67.9 76.5
Boys
All 83.9 69.3 69.6 72.010.to.11 87.7 79.9 83.8 82.612.to.14 82.2 69.8 69.3 73.215.to.17 84.8 63.2 66.4 66.8
Girls
SC.1-2 88.5 75.5 75.9 82.6SC.3-4 87.1 74.5 74.4 80.5SC.5-6 86.2 76.3 74.9 76.6
Boys
SC.1-2 85.6 69.9 71.8 74.7SC.3-4 83.9 69.7 69.2 73.4SC.5-6 85.1 71.2 70.1 69.6
Table.7.40. Trends.analysis.for.feeling.safe.at.school
1998-2010 1998-2002 2002-2006 2006-2010
p-value 0.000*** 0.000*** 0.294(ns) 0.000***

HBSCIrelandTrends2013
100
Table.7.41. Percentage.of.young.people.who.agree.that.students.in.their.school.are.encouraged.to.express.their.views
1998 2002 2006 2010Overall 59.2 62.1 62.8 68.6
GirlsAll 63.1 63.3 65.1 70.8
10.to.11 65.4 70.2 77.3 73.412.to.14 63.3 62.0 65.2 70.815.to.17 61.6 62.0 60.0 69.3
Boys
All 55.1 60.4 60.5 66.610.to.11 55.4 63.0 73.5 68.412.to.14 56.2 62.7 61.0 67.715.to.17 53.4 55.6 56.9 64.2
Girls
SC.1-2 64.6 63.6 66.3 71.8SC.3-4 62.7 63.4 64.1 70.7SC.5-6 61.7 65.1 65.5 71.5
Boys
SC.1-2 55.4 58.7 61.3 67.0SC.3-4 53.6 62.4 61.1 67.1SC.5-6 58.2 65.5 60.2 66.8
Table.7.42. Trends.analysis.for.students.being.encouraged.to.express.their.own.views
1998-2010 1998-2002 2002-2006 2006-2010
p-value 0.000*** 0.000*** 0.086(ns) 0.000***

Appendices
101
Table.7.43. Percentage.of.young.people.who.agree.that.they.can.get.extra.help.from.their.teachers.if.they.need.it
1998 2002 2006 2010Overall 67.9 66.2 69.5 71.3
GirlsAll 69.8 67.5 70.2 71.6
10.to.11 78.3 81.0 84.9 83.912.to.14 69.3 67.0 70.3 72.415.to.17 64.7 62.6 63.9 66.1
Boys
All 65.9 64.5 68.8 71.010.to.11 73.4 73.3 83.1 83.512.to.14 66.0 64.0 69.4 71.415.to.17 61.0 60.3 64.6 66.5
Girls
SC.1-2 66.4 67.5 68.9 71.7SC.3-4 73.5 66.5 70.4 71.8SC.5-6 71.5 71.1 71.8 71.9
Boys
SC.1-2 63.6 64.5 68.7 71.3SC.3-4 67.5 64.2 68.7 72.8SC.5-6 68.3 69.1 69.5 72.7
Table.7.44. Trends.analysis.for.getting.extra.help.from.teachers.when.needed
1998-2010 1998-2002 2002-2006 2006-2010
p-value 0.000*** 0.391(ns) 0.000*** 0.000***

HBSCIrelandTrends2013
102
Table.7.45. Percentage.of.young.people.who.agree.that.their.teachers.are.interested.in.them.as.a.person
1998 2002 2006 2010Overall 43.6 48.5 50.0 51.2
GirlsAll 47.4 49.4 52.7 53.3
10.to.11 58.5 68.8 77.9 69.412.to.14 48.9 50.5 53.2 54.715.to.17 36.3 40.1 41.3 45.1
Boys
All 39.7 47.4 47.4 49.310.to.11 47.0 59.6 67.2 60.112.to.14 40.0 49.9 48.8 50.515.to.17 34.3 36.9 40.4 43.8
Girls
SC.1-2 45.6 48.3 50.6 53.5SC.3-4 49.4 50.3 53.0 53.1SC.5-6 50.1 52.2 54.2 52.2
Boys
SC.1-2 38.5 45.8 47.9 49.7SC.3-4 40.1 50.2 47.0 49.3SC.5-6 42.0 49.2 47.7 50.9
Table.7.46. Trends.analysis.for.teachers.being.interested.in.them.as.a.person
1998-2010 1998-2002 2002-2006 2006-2010
p-value 0.000*** 0.000*** 0.014* 0.039*

Appendices
103
Table.7.47. Percentage.of.young.people.who.report.that.they.find.it.easy.or.very.easy.to.talk.to.their.best.friend
1998 2002 2006 2010Overall - 88.3 87.8 88.3
GirlsAll - 92.0 92.8 93.1
10.to.11 - 88.9 89.6 88.712.to.14 - 91.5 93.1 93.715.to.17 - 93.8 93.7 94.0
Boys
All - 83.0 82.8 83.810.to.11 - 83.6 80.4 77.412.to.14 - 80.7 82.8 83.615.to.17 - 85.8 83.8 85.8
Girls
SC.1-2 - 92.3 93.5 93.6SC.3-4 - 91.8 92.5 92.9SC.5-6 - 91.1 91.3 92.6
Boys
SC.1-2 - 82.5 82.5 83.1SC.3-4 - 84.9 83.8 84.8SC.5-6 - 82.1 82.7 84.6
Table.7.48. Trends.analysis.for.finding.it.easy.to.talk.to.their.best.friend
2002-2010 2002-2006 2006-2010
p-value 0.209(ns) 0.872(ns) 0.140(ns)
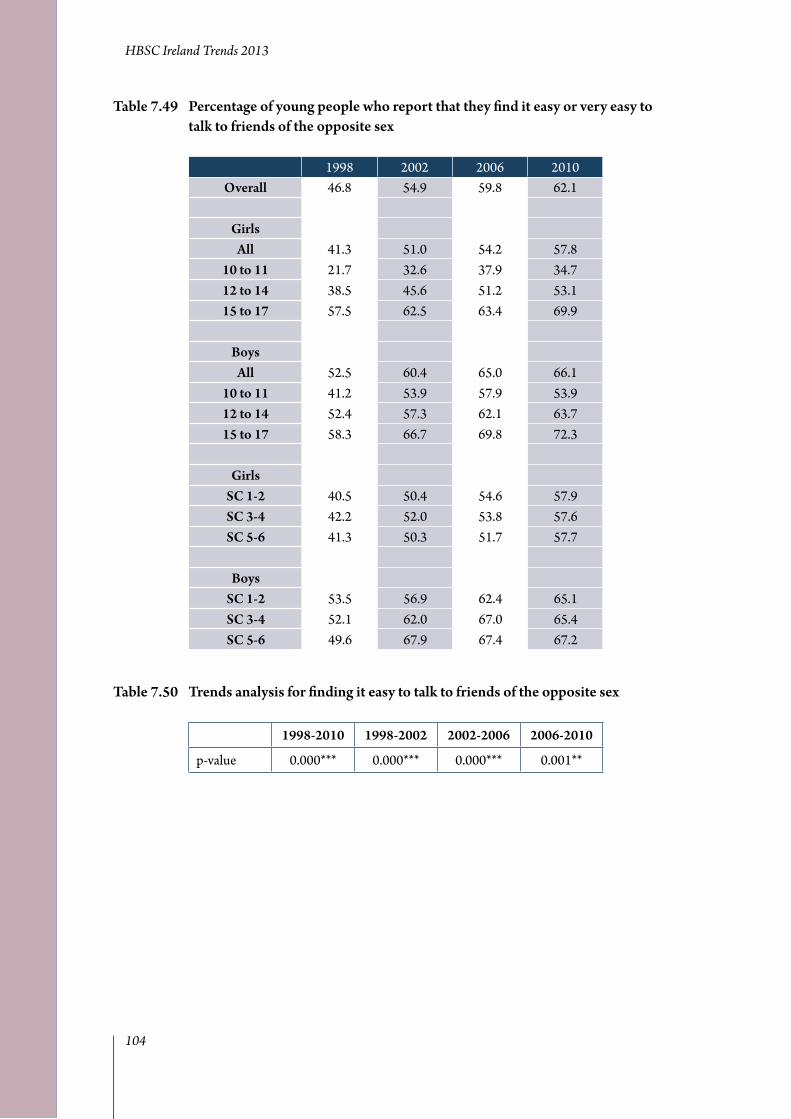
HBSCIrelandTrends2013
104
Table.7.49. Percentage.of.young.people.who.report.that.they.find.it.easy.or.very.easy.to.talk.to.friends.of.the.opposite.sex
1998 2002 2006 2010Overall 46.8 54.9 59.8 62.1
GirlsAll 41.3 51.0 54.2 57.8
10.to.11 21.7 32.6 37.9 34.712.to.14 38.5 45.6 51.2 53.115.to.17 57.5 62.5 63.4 69.9
Boys
All 52.5 60.4 65.0 66.110.to.11 41.2 53.9 57.9 53.912.to.14 52.4 57.3 62.1 63.715.to.17 58.3 66.7 69.8 72.3
Girls
SC.1-2 40.5 50.4 54.6 57.9SC.3-4 42.2 52.0 53.8 57.6SC.5-6 41.3 50.3 51.7 57.7
Boys
SC.1-2 53.5 56.9 62.4 65.1SC.3-4 52.1 62.0 67.0 65.4SC.5-6 49.6 67.9 67.4 67.2
Table.7.50. Trends.analysis.for.finding.it.easy.to.talk.to.friends.of.the.opposite.sex
1998-2010 1998-2002 2002-2006 2006-2010
p-value 0.000*** 0.000*** 0.000*** 0.001**

Appendices
105
Table.7.51. Percentage.of.young.people.who.report.that.their.local.area.is.quite.or.very.well-off
1998 2002 2006 2010Overall - 44.8 46.2 38.2
GirlsAll - 44.2 45.5 37.1
10.to.11 - 46.5 46.7 35.212.to.14 - 46.6 48.1 38.315.to.17 - 40.6 41.9 35.3
. Boys
All - 45.7 46.8 39.210.to.11 - 48.0 46.5 39.612.to.14 - 49.8 48.9 41.015.to.17 - 38.8 44.8 36.9
. Girls
SC.1-2 - 50.1 53.0 42.0SC.3-4 - 41.0 42.1 34.5SC.5-6 - 33.1 37.9 29.0
. Boys
SC.1-2 - 51.6 54.4 43.0SC.3-4 - 42.7 43.6 37.7SC.5-6 - 38.4 41.4 37.6
Table.7.52. Trends.analysis.for.local.area.being.well-off
2002-2010 2002-2006 2006-2010
p-value 0.000*** 0.004** 0.000***

HBSCIrelandTrends2013
106
Table.7.53. Percentage.of.young.people.who.report.that.there.are.lots.or.some.groups.of.young.people.causing.trouble.in.their.local.area
1998 2002 2006 2010Overall - 59.1 54.5 55.8
GirlsAll - 58.1 52.9 55.2
10.to.11 - 50.0 44.0 42.912.to.14 - 56.1 50.5 53.815.to.17 - 63.7 59.6 61.7
Boys
All - 60.5 56.0 56.510.to.11 - 51.2 50.8 52.512.to.14 - 59.4 53.6 54.215.to.17 - 67.3 59.9 60.8
Girls
SC.1-2 - 57.9 48.4 51.3SC.3-4 - 58.1 53.3 57.9SC.5-6 - 58.0 59.4 60.9
Boys
SC.1-2 - 57.0 50.5 52.5SC.3-4 - 61.9 57.3 57.6SC.5-6 - 64.3 64.8 64.2
Table.7.54. Trends.analysis.for.groups.causing.trouble.in.the.local.area
2002-2010 2002-2006 2006-2010
p-value 0.000*** 0.000*** 0.002**
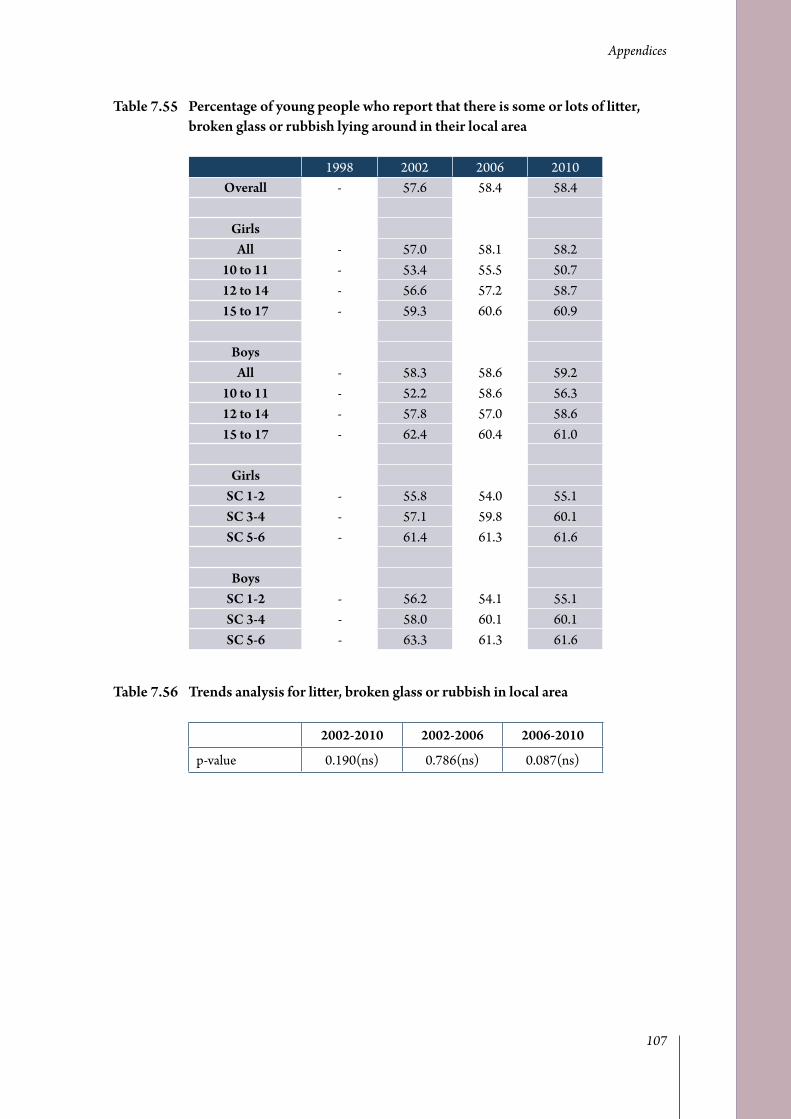
Appendices
107
Table.7.55. Percentage.of.young.people.who.report.that.there.is.some.or.lots.of.litter,.broken.glass.or.rubbish.lying.around.in.their.local.area
1998 2002 2006 2010Overall - 57.6 58.4 58.4
GirlsAll - 57.0 58.1 58.2
10.to.11 - 53.4 55.5 50.712.to.14 - 56.6 57.2 58.715.to.17 - 59.3 60.6 60.9
Boys
All - 58.3 58.6 59.210.to.11 - 52.2 58.6 56.312.to.14 - 57.8 57.0 58.615.to.17 - 62.4 60.4 61.0
Girls
SC.1-2 - 55.8 54.0 55.1SC.3-4 - 57.1 59.8 60.1SC.5-6 - 61.4 61.3 61.6
Boys
SC.1-2 - 56.2 54.1 55.1SC.3-4 - 58.0 60.1 60.1SC.5-6 - 63.3 61.3 61.6
Table.7.56. Trends.analysis.for.litter,.broken.glass.or.rubbish.in.local.area
2002-2010 2002-2006 2006-2010
p-value 0.190(ns) 0.786(ns) 0.087(ns)

HBSCIrelandTrends2013
108
Table.7.57. Percentage.of.young.people.who.report.that.there.are.some.or.lots.of.run.down.houses.or.buildings.in.their.local.area
1998 2002 2006 2010Overall - 25.5 30.6 32.9
GirlsAll - 23.7 30.0 32.2
10.to.11 - 13.7 18.7 19.512.to.14 - 24.1 29.2 30.615.to.17 - 27.0 35.1 39.5
Boys
All - 28.0 31.2 33.510.to.11 - 19.5 23.0 27.712.to.14 - 25.7 28.2 30.315.to.17 - 35.8 36.8 39.4
Girls
SC.1-2 - 22.2 27.2 30.1SC.3-4 - 23.8 31.9 33.6SC.5-6 - 26.7 29.3 36.2
Boys
SC.1-2 - 25.9 29.0 33.0SC.3-4 - 28.2 31.4 31.1SC.5-6 - 29.2 31.4 38.5
Table.7.58. Trends.analysis.for.run.down.houses.or.buildings.in.local.area
2002-2010 2002-2006 2006-2010
p-value 0.000*** 0.000*** 0.000***

Appendices
109
Table.7.59. Percentage.of.young.people.who.agree.that.their.local.area.is.a.good.place.to.live
1998 2002 2006 2010Overall - 72.1 75.3 77.4
GirlsAll - 72.9 75.0 76.7
10.to.11 - 82.6 81.0 86.012.to.14 - 74.7 78.1 79.115.to.17 - 67.0 68.7 69.5
Boys
All - 70.8 75.6 78.010.to.11 - 79.4 81.5 82.712.to.14 - 72.8 78.1 80.415.to.17 - 63.1 71.9 73.4
Girls
SC.1-2 - 77.2 80.8 81.0SC.3-4 - 69.6 74.8 75.8SC.5-6 - 70.4 66.6 68.2
Boys
SC.1-2 - 75.5 81.4 81.4SC.3-4 - 69.6 74.6 79.4SC.5-6 - 62.9 69.0 69.2
Table.7.60. Trends.analysis.for.local.area.being.a.good.place.to.live
2002-2010 2002-2006 2006-2010
p-value 0.000*** 0.000*** 0.081
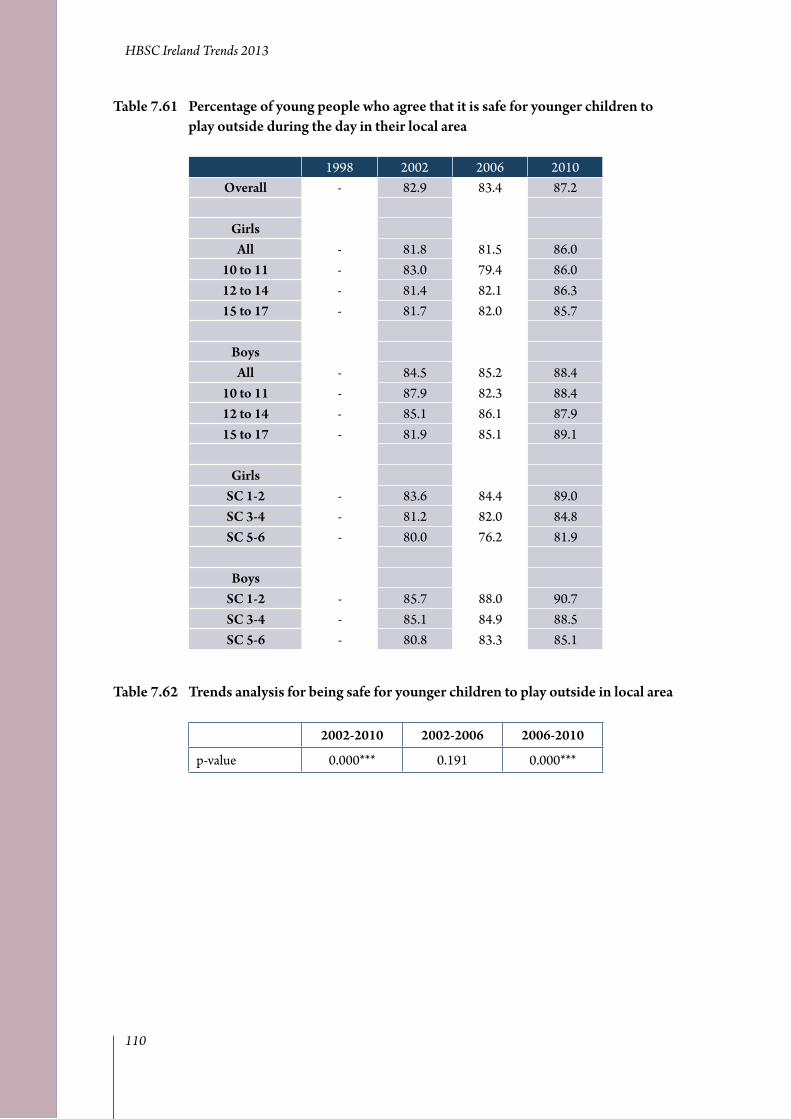
HBSCIrelandTrends2013
110
Table.7.61. Percentage.of.young.people.who.agree.that.it.is.safe.for.younger.children.to.play.outside.during.the.day.in.their.local.area
1998 2002 2006 2010Overall - 82.9 83.4 87.2
GirlsAll - 81.8 81.5 86.0
10.to.11 - 83.0 79.4 86.012.to.14 - 81.4 82.1 86.315.to.17 - 81.7 82.0 85.7
Boys
All - 84.5 85.2 88.410.to.11 - 87.9 82.3 88.412.to.14 - 85.1 86.1 87.915.to.17 - 81.9 85.1 89.1
Girls
SC.1-2 - 83.6 84.4 89.0SC.3-4 - 81.2 82.0 84.8SC.5-6 - 80.0 76.2 81.9
Boys
SC.1-2 - 85.7 88.0 90.7SC.3-4 - 85.1 84.9 88.5SC.5-6 - 80.8 83.3 85.1
Table.7.62. Trends.analysis.for.being.safe.for.younger.children.to.play.outside.in.local.area
2002-2010 2002-2006 2006-2010
p-value 0.000*** 0.191 0.000***
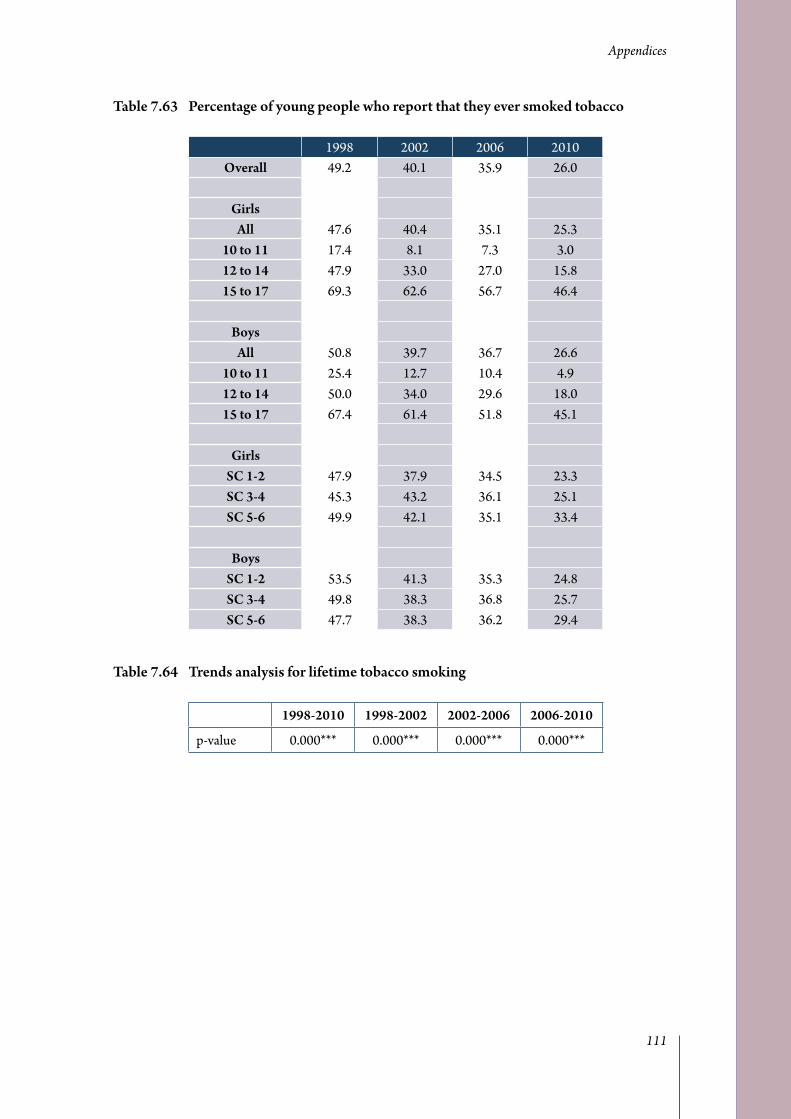
Appendices
111
Table.7.63. Percentage.of.young.people.who.report.that.they.ever.smoked.tobacco
1998 2002 2006 2010Overall 49.2 40.1 35.9 26.0
GirlsAll 47.6 40.4 35.1 25.3
10.to.11 17.4 8.1 7.3 3.012.to.14 47.9 33.0 27.0 15.815.to.17 69.3 62.6 56.7 46.4
Boys
All 50.8 39.7 36.7 26.610.to.11 25.4 12.7 10.4 4.912.to.14 50.0 34.0 29.6 18.015.to.17 67.4 61.4 51.8 45.1
Girls
SC.1-2 47.9 37.9 34.5 23.3SC.3-4 45.3 43.2 36.1 25.1SC.5-6 49.9 42.1 35.1 33.4
Boys
SC.1-2 53.5 41.3 35.3 24.8SC.3-4 49.8 38.3 36.8 25.7SC.5-6 47.7 38.3 36.2 29.4
Table.7.64. Trends.analysis.for.lifetime.tobacco.smoking
1998-2010 1998-2002 2002-2006 2006-2010
p-value 0.000*** 0.000*** 0.000*** 0.000***

HBSCIrelandTrends2013
112
Table.7.65. Percentage.of.young.people.who.report.that.they.had.ever.taken.cannabis.in.their.lifetime
1998 2002 2006 2010Overall 12.3 12.1 15.7 10.3
GirlsAll 8.6 10.2 13.2 8.1
10.to.11 1.2 0.3 0.1 0.812.to.14 4.9 4.0 6.4 3.515.to.17 20.4 21.7 26.4 16.6
Boys
All 16.2 14.6 18.1 12.310.to.11 4.6 1.4 1.5 1.412.to.14 12.3 6.7 10.1 6.315.to.17 30.0 32.3 31.3 23.5
Girls
SC.1-2 7.8 9.3 12.0 6.9SC.3-4 9.4 10.9 13.9 7.3SC.5-6 8.0 12.2 13.5 11.5
Boys
SC.1-2 16.6 14.2 16.4 10.7SC.3-4 15.6 14.1 17.3 11.9SC.5-6 13.7 15.8 17.0 12.7
Table.7.66. Trends.analysis.for.lifetime.cannabis.use
1998-2010 1998-2002 2002-2006 2006-2010
p-value 0.000*** 0.018* 0.004** 0.000***

Appendices
113
Table.7.67. Percentage.of.young.people.who.report.that.they.consume.soft.drinks.containing.sugar.more.than.daily
1998 2002 2006 2010Overall - 23.2 15.3 12.5
GirlsAll - 20.1 13.0 11.4
10.to.11 - 17.0 9.2 8.812.to.14 - 19.2 13.2 11.815.to.17 - 22.6 14.5 12.1
Boys
All - 27.2 17.4 13.610.to.11 - 16.7 10.9 8.512.to.14 - 27.3 15.6 14.115.to.17 - 32.2 21.0 14.6
Girls
SC.1-2 - 14.5 8.1 7.5SC.3-4 - 23.6 15.1 12.8SC.5-6 - 28.3 16.0 15.8
Boys
SC.1-2 - 22.3 13.0 9.8SC.3-4 - 30.2 19.1 13.7SC.5-6 - 33.0 22.8 21.1
Table.7.68. Trends.analysis.for.more.than.daily.soft.drinks.consumption
2002-2010 2002-2006 2006-2010
p-value 0.000*** 0.000*** 0.000***

HBSCIrelandTrends2013
114
Table.7.69. Percentage.of.young.people.who.report.that.they.consume.‘diet’.soft.drinks.more.than.daily
1998 2002 2006 2010Overall - 7.8 5.9 4.8
GirlsAll - 8.4 5.8 5.2
10.to.11 - 8.6 5.9 4.012.to.14 - 7.6 6.2 5.415.to.17 - 9.1 5.0 5.4
Boys
All - 7.0 6.0 4.410.to.11 - 7.4 5.1 4.412.to.14 - 7.6 6.1 4.815.to.17 - 6.1 5.9 3.9
Girls
SC.1-2 - 6.1 3.8 3.3SC.3-4 - 10.1 5.9 5.9SC.5-6 - 10.0 8.2 8.0
Boys
SC.1-2 - 6.0 4.0 2.9SC.3-4 - 7.5 6.8 4.4SC.5-6 - 6.5 7.2 7.4
Table.7.70. Trends.analysis.for.more.than.daily.‘diet’.soft.drinks.consumption
2002-2010 2002-2006 2006-2010
p-value 0.000*** 0.000*** 0.000***

Appendices
115
Table.7.71. Percentage.of.young.people.who.report.that.they.consume.crisps.more.than.daily
1998 2002 2006 2010Overall - 11.8 6.9 5.0
GirlsAll - 10.9 6.7 5.0
10.to.11 - 9.9 6.2 4.312.to.14 - 11.2 6.9 4.915.to.17 - 11.2 6.7 5.0
Boys
All - 13.0 7.0 5.110.to.11 - 13.5 4.1 3.212.to.14 - 12.5 7.0 5.215.to.17 - 13.4 7.5 5.8
Girls
SC.1-2 - 8.1 4.0 2.7SC.3-4 - 11.3 7.4 5.4SC.5-6 - 13.9 9.3 8.0
Boys
SC.1-2 - 9.7 4.6 3.6SC.3-4 - 14.2 7.8 4.5SC.5-6 - 17.6 8.9 8.9
Table.7.72. Trends.analysis.for.more.than.daily.crisp.consumption
2002-2010 2002-2006 2006-2010
p-value 0.000*** 0.000*** 0.000***

HBSCIrelandTrends2013
116
Table.7.73. Percentage.of.young.people.who.report.that.they.consume.vegetables.more.than.daily
1998 2002 2006 2010Overall - 16.9 17.9 20.0
GirlsAll - 18.3 20.2 21.4
10.to.11 - 17.3 21.4 22.912.to.14 - 18.9 19.6 21.915.to.17 - 17.6 20.4 20.4
Boys
All - 15.0 15.6 18.710.to.11 - 16.2 15.2 18.912.to.14 - 15.0 15.9 19.715.to.17 - 14.1 15.4 17.3
Girls
SC.1-2 - 20.6 24.1 24.6SC.3-4 - 16.0 18.3 19.4SC.5-6 - 17.0 18.3 18.0
Boys
SC.1-2 - 14.6 17.7 21.7SC.3-4 - 14.3 14.0 16.5SC.5-6 - 17.1 14.0 17.0
Table.7.74. Trends.analysis.for.more.than.daily.vegetable.consumption
2002-2010 2002-2006 2006-2010
p-value 0.000*** 0.000*** 0.000***
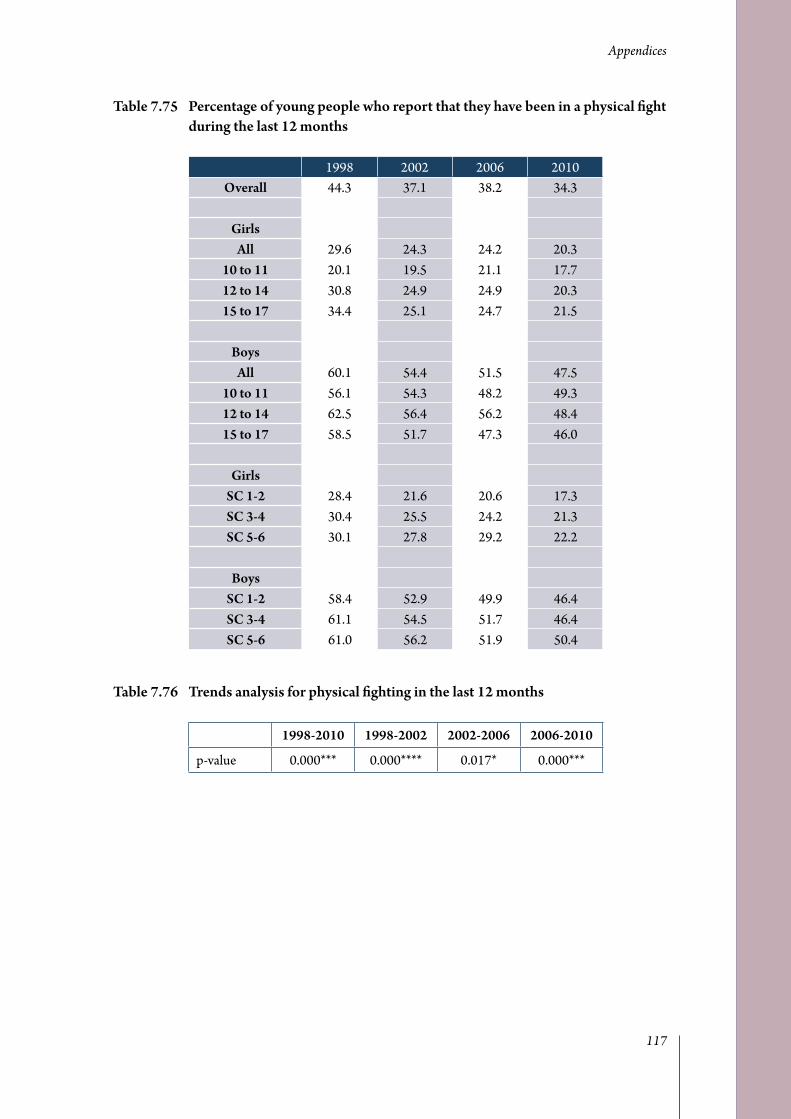
Appendices
117
Table.7.75. Percentage.of.young.people.who.report.that.they.have.been.in.a.physical.fight.during.the.last.12.months
1998 2002 2006 2010Overall 44.3 37.1 38.2 34.3
GirlsAll 29.6 24.3 24.2 20.3
10.to.11 20.1 19.5 21.1 17.712.to.14 30.8 24.9 24.9 20.315.to.17 34.4 25.1 24.7 21.5
Boys
All 60.1 54.4 51.5 47.510.to.11 56.1 54.3 48.2 49.312.to.14 62.5 56.4 56.2 48.415.to.17 58.5 51.7 47.3 46.0
Girls
SC.1-2 28.4 21.6 20.6 17.3SC.3-4 30.4 25.5 24.2 21.3SC.5-6 30.1 27.8 29.2 22.2
Boys
SC.1-2 58.4 52.9 49.9 46.4SC.3-4 61.1 54.5 51.7 46.4SC.5-6 61.0 56.2 51.9 50.4
Table.7.76. Trends.analysis.for.physical.fighting.in.the.last.12.months
1998-2010 1998-2002 2002-2006 2006-2010
p-value 0.000*** 0.000**** 0.017* 0.000***

HBSCIrelandTrends2013
118
Table.7.77. Percentage.of.young.people.who.report.that.they.watch.television.for.two.or.more.hours.per.day.on.weekdays
1998 2002 2006 2010Overall - 63.9 61.7 53.4
GirlsAll - 62.0 60.9 53.2
10.to.11 - 58.1 54.9 46.212.to.14 - 62.9 61.4 52.415.to.17 - 62.4 63.2 57.0
Boys
All - 68.8 65.6 56.110.to.11 - 67.6 62.6 49.912.to.14 - 69.3 65.0 55.715.to.17 - 68.7 67.2 58.8
Girls
SC.1-2 - 57.0 56.6 49.4SC.3-4 - 65.4 64.2 55.8SC.5-6 - 68.3 64.0 60.2
Boys
SC.1-2 - 65.3 61.7 53.3SC.3-4 - 72.8 68.8 58.6SC.5-6 - 70.1 70.1 59.2
Table.7.78. Trends.analysis.for.watching.television.for.two.or.more.hours.on.weekdays
2002-2010 2002-2006 2006-2010
p-value 0.000*** 0.002** 0.000***

Appendices
119
Table.7.79. Percentage.of.young.people.who.report.that.watch.television.for.two.or.more.hours.per.day.on.weekends
1998 2002 2006 2010Overall - 75.7 72.2 68.5
GirlsAll - 76.3 71.7 69.7
10.to.11 - 67.6 61.1 59.712.to.14 - 76.8 72.8 69.315.to.17 - 78.9 75.0 74.0
Boys
All - 78.9 76.0 70.510.to.11 - 72.8 70.9 62.412.to.14 - 79.6 75.0 69.815.to.17 - 81.3 78.7 74.4
Girls
SC.1-2 - 77.0 71.9 70.3SC.3-4 - 76.3 72.5 69.1SC.5-6 - 75.7 72.7 69.8
Boys
SC.1-2 - 78.8 76.2 70.4SC.3-4 - 80.2 77.0 71.7SC.5-6 - 77.1 77.0 72.2
Table.7.80. Trends.analysis.for.watching.television.for.two.or.more.hours.per.day.on.weekends
2002-2010 2002-2006 2006-2010
p-value 0.000*** 0.000*** 0.000***

HBSCIrelandTrends2013
120
Table.7.81. Percentage.of.young.people.who.report.being.physically.active.for.at.least.60.minutes.per.day.for.four.or.more.of.the.last.seven.days
1998 2002 2006 2010Overall - 61.2 69.8 67.1
GirlsAll - 53.4 61.5 58.3
10.to.11 - 68.6 84.7 77.512.to.14 - 59.1 69.6 65.115.to.17 - 40.7 41.7 42.3
Boys
All - 71.6 77.8 75.310.to.11 - 78.1 89.4 83.512.to.14 - 75.5 83.1 80.315.to.17 - 63.3 68.9 67.2
Girls
SC.1-2 - 54.4 61.9 59.5SC.3-4 - 52.2 60.3 58.6SC.5-6 - 53.4 64.1 55.4
Boys
SC.1-2 - 72.8 78.4 76.6SC.3-4 - 72.9 78.0 76.2SC.5-6 - 68.0 79.5 70.7
Table.7.82. Trends.analysis.for.physical.activity.over.the.last.seven.days
2002-2010 2002-2006 2006-2010
p-value 0.000*** 0.000*** 0.000***

Appendices
121
Table.7.83. Percentage.of.young.people.who.report.that.they.have.had.stomach-ache.weekly.or.more.frequently.over.the.last.six.months
1998 2002 2006 2010Overall 14.5 13.6 15.0 15.4
GirlsAll 16.7 16.3 19.4 19.3
10.to.11 19.7 14.4 16.8 16.712.to.14 16.9 16.7 17.0 19.215.to.17 13.9 16.5 23.1 20.4
Boys
All 12.1 10.1 10.7 11.610.to.11 14.5 10.4 10.9 10.412.to.14 11.9 10.4 11.3 11.215.to.17 10.9 9.5 10.1 12.5
Girls
SC.1-2 15.9 15.5 18.4 17.0SC.3-4 17.9 17.2 18.4 18.7SC.5-6 14.6 14.8 21.3 23.7
Boys
SC.1-2 10.2 10.6 9.4 9.6SC.3-4 13.4 9.9 10.5 10.8SC.5-6 12.0 8.1 13.6 16.1
Table.7.84. Trends.analysis.for.at.least.weekly.stomach-ache.
1998-2010 1998-2002 2002-2006 2006-2010
p-value 0.012* 0.090(ns) 0.007** 0.721(ns)

HBSCIrelandTrends2013
122
Table.7.85. Percentage.of.young.people.who.report.that.they.have.had.backache.weekly.or.more.frequently.over.the.last.six.months
1998 2002 2006 2010Overall 15.3 14.7 17.1 19.0
GirlsAll 14.4 13.7 17.5 20.0
10.to.11 9.4 7.9 6.4 9.012.to.14 14.2 12.6 15.9 19.115.to.17 17.9 17.1 23.8 25.3
Boys
All 16.3 16.1 16.7 17.910.to.11 11.8 9.5 9.5 9.712.to.14 15.4 14.4 15.1 16.515.to.17 20.8 21.4 20.3 22.5
Girls
SC.1-2 14.8 13.9 16.4 19.3SC.3-4 14.0 14.0 18.0 20.2SC.5-6 12.9 12.5 17.6 19.5
Boys
SC.1-2 17.3 15.9 15.4 16.4SC.3-4 16.0 16.9 17.0 17.0SC.5-6 13.7 15.0 17.1 21.1
Table.7.86. Trends.analysis.for.at.least.weekly.backache
1998-2010 1998-2002 2002-2006 2006-2010
p-value 0.000*** 0.061(ns) 0.003** 0.001**
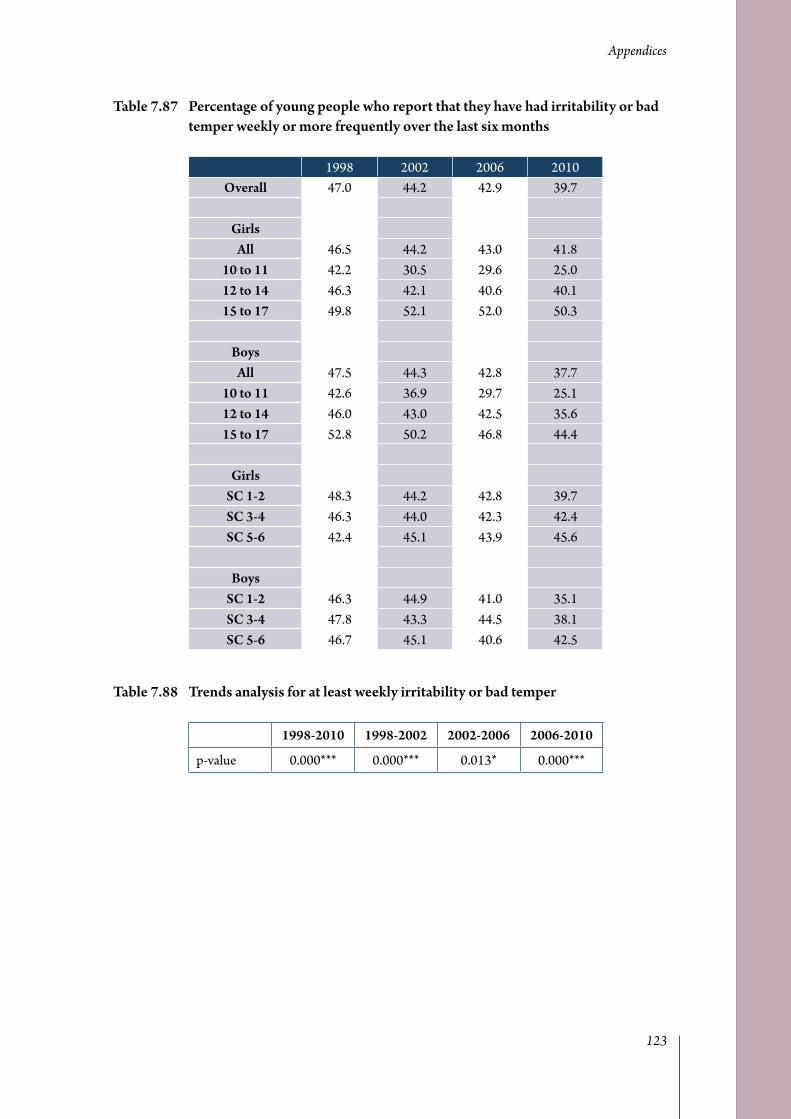
Appendices
123
Table.7.87. Percentage.of.young.people.who.report.that.they.have.had.irritability.or.bad.temper.weekly.or.more.frequently.over.the.last.six.months
1998 2002 2006 2010Overall 47.0 44.2 42.9 39.7
GirlsAll 46.5 44.2 43.0 41.8
10.to.11 42.2 30.5 29.6 25.012.to.14 46.3 42.1 40.6 40.115.to.17 49.8 52.1 52.0 50.3
Boys
All 47.5 44.3 42.8 37.710.to.11 42.6 36.9 29.7 25.112.to.14 46.0 43.0 42.5 35.615.to.17 52.8 50.2 46.8 44.4
Girls
SC.1-2 48.3 44.2 42.8 39.7SC.3-4 46.3 44.0 42.3 42.4SC.5-6 42.4 45.1 43.9 45.6
Boys
SC.1-2 46.3 44.9 41.0 35.1SC.3-4 47.8 43.3 44.5 38.1SC.5-6 46.7 45.1 40.6 42.5
Table.7.88. Trends.analysis.for.at.least.weekly.irritability.or.bad.temper
1998-2010 1998-2002 2002-2006 2006-2010
p-value 0.000*** 0.000*** 0.013* 0.000***
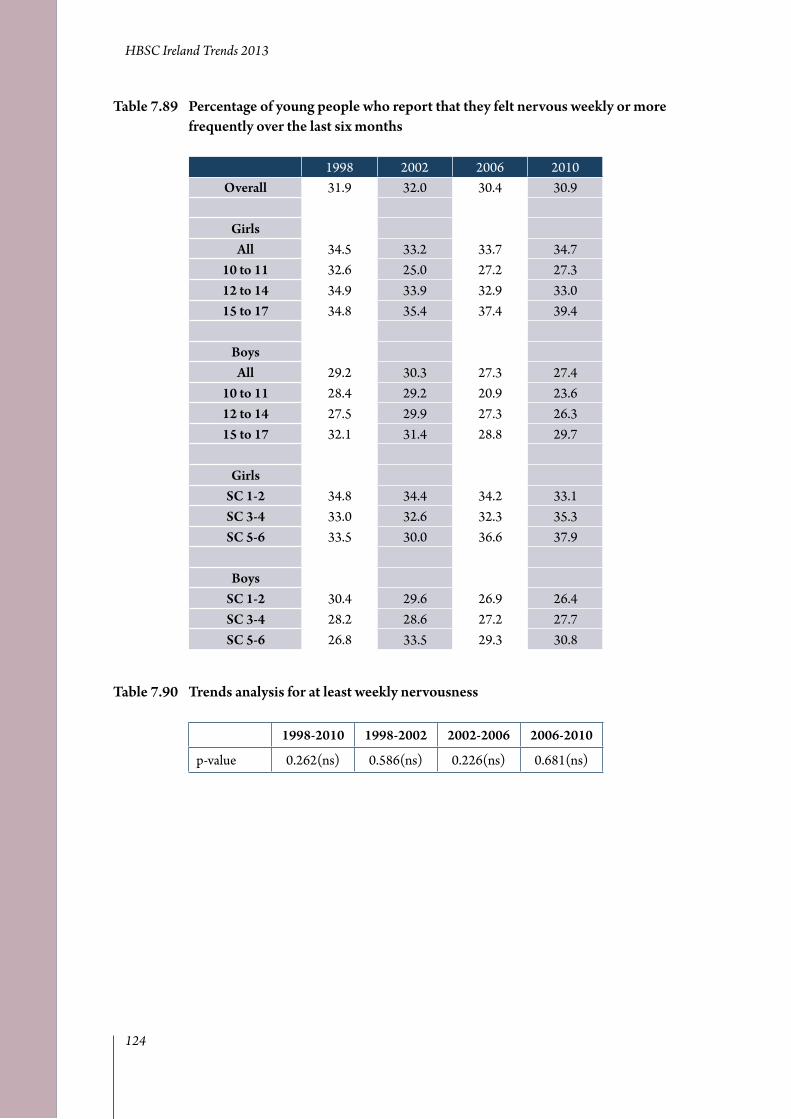
HBSCIrelandTrends2013
124
Table.7.89. Percentage.of.young.people.who.report.that.they.felt.nervous.weekly.or.more.frequently.over.the.last.six.months
1998 2002 2006 2010Overall 31.9 32.0 30.4 30.9
GirlsAll 34.5 33.2 33.7 34.7
10.to.11 32.6 25.0 27.2 27.312.to.14 34.9 33.9 32.9 33.015.to.17 34.8 35.4 37.4 39.4
Boys
All 29.2 30.3 27.3 27.410.to.11 28.4 29.2 20.9 23.612.to.14 27.5 29.9 27.3 26.315.to.17 32.1 31.4 28.8 29.7
Girls
SC.1-2 34.8 34.4 34.2 33.1SC.3-4 33.0 32.6 32.3 35.3SC.5-6 33.5 30.0 36.6 37.9
Boys
SC.1-2 30.4 29.6 26.9 26.4SC.3-4 28.2 28.6 27.2 27.7SC.5-6 26.8 33.5 29.3 30.8
Table.7.90. Trends.analysis.for.at.least.weekly.nervousness
1998-2010 1998-2002 2002-2006 2006-2010
p-value 0.262(ns) 0.586(ns) 0.226(ns) 0.681(ns)

Appendices
125
Table.7.91. Percentage.of.young.people.who.report.that.they.felt.dizzy.weekly.or.more.frequently.over.the.last.six.months
1998 2002 2006 2010Overall 16.6 14.9 16.3 19.2
GirlsAll 16.6 15.3 18.5 22.4
10.to.11 10.7 8.6 10.4 13.512.to.14 16.5 13.7 16.7 21.115.to.17 20.1 20.0 23.8 27.3
Boys
All 16.7 14.4 14.2 16.110.to.11 14.7 11.3 10.2 14.612.to.14 15.7 13.4 13.4 14.415.to.17 19.7 17.5 16.2 18.7
Girls
SC.1-2 16.1 14.2 16.9 21.4SC.3-4 17.6 15.9 18.8 21.7SC.5-6 14.4 15.5 18.3 22.6
Boys
SC.1-2 15.5 13.7 11.9 15.2SC.3-4 17.9 12.6 15.0 15.2SC.5-6 15.1 16.4 15.5 18.2
Table.7.92. Trends.analysis.for.at.least.weekly.dizziness
1998-2010 1998-2002 2002-2006 2006-2010
p-value 0.000*** 0.000*** 0.030* 0.000***

HBSCIrelandTrends2013
126
Table.7.93. Percentage.of.young.people.who.report.that.they.have.been.bullied.at.school.in.the.past.couple.of.months
1998 2002 2006 2010Overall 24.6 23.3 24.5 24.2
GirlsAll 19.9 21.0 23.4 22.9
10.to.11 27.2 29.5 30.2 31.212.to.14 20.1 22.6 23.9 24.315.to.17 14.0 15.8 19.5 18.0
Boys
All 29.5 26.4 25.6 25.410.to.11 36.2 26.8 27.9 28.212.to.14 30.5 29.9 28.2 26.115.to.17 23.7 21.7 22.1 23.7
Girls
SC.1-2 18.8 20.5 23.3 21.4SC.3-4 20.4 21.0 22.9 22.1SC.5-6 20.1 23.7 23.7 27.4
Boys
SC.1-2 28.1 26.6 26.5 25.1SC.3-4 29.6 25.9 24.9 24.6SC.5-6 30.6 24.5 25.0 26.0
Table.7.94. Trends.analysis.for.being.bullied.at.school.in.the.last.couple.of.months
1998-2010 1998-2002 2002-2006 2006-2010
p-value 0.348(ns) 0.937(ns) 0.119(ns) 0.212(ns)

Appendices
127
Table.7.95. Percentage.of.young.people.who.report.that.they.think.their.body.is.too.fat
1998 2002 2006 2010Overall 32.1 30.6 29.2 27.9
GirlsAll 46.5 37.8 36.8 34.9
10.to.11 30.7 18.5 19.0 19.112.to.14 45.9 37.6 34.0 33.615.to.17 58.5 46.2 47.8 42.7
Boys
All 26.1 20.8 21.9 21.310.to.11 22.3 18.4 19.9 18.012.to.14 29.0 22.2 23.2 20.815.to.17 23.7 20.1 21.0 22.9
Girls
SC.1-2 48.0 37.4 36.2 34.0SC.3-4 43.8 39.4 36.3 35.9SC.5-6 48.6 34.8 37.1 37.0
Boys
SC.1-2 27.0 19.2 19.6 20.7SC.3-4 27.2 21.7 24.2 21.9SC.5-6 23.3 24.2 22.8 22.6
Table.7.96. Trends.analysis.for.thinking.they.are.too.fat
1998-2010 1998-2002 2002-2006 2006-2010
p-value 0.000*** 0.000*** 0.382(ns) 0.180(ns)