the growth of fish - jeb.biologists.org · fig. 2. the incremen int wet weight of 100 embryo is n...
TRANSCRIPT

no
THE GROWTH OF FISH
II. THE GROWTH-RATE OF THE EMBRYO OF SALMO FARIO
BY J. GRAYKing's College, Cambridge.
(From the Zoological Laboratory, Cambridge.)
{Received July 7th, 1928.)
(With Seven Test-figures.)
ACCORDING to Minot (1908) the amount of new tissue formed per gram ofmammalian embryo per unit time falls with decreasing velocity as the embryo getsolder, so that for very young embryos this specific growth-rate is astonishingly high,whilst the decrease in its value is not in any obvious way associated with a scarcity ofthe raw materials for growth. How far such an inherent decline characterises thespecific growth-rate of a cold blooded animal is entirely unknown. Within morerecent years, Robertson (1923) has suggested that the growing period of an animaFslife can be resolved into one or more independent cycles and during each of thesecycles the growth-rate is controlled by two factors. One of these factors is alwaysproportional to the size of the organism, and therefore constantly increases; theother factor is a linear function of the size of the organism, but decreases as theanimal grows, so that the rate of growth (Bx/St) is proportional to x (a — x) where xis the weight of the organism and a is a constant representing the maximum weightreached by the animal at the end of a particular phase of growth. If this be so,it follows that the growth-rate must reach a maximum when the animal is half
grown.Since the larvae of the trout can be obtained in very large numbers and can be
incubated under strictly controlled conditions, they provide a most suitablematerial for investigating the precise nature of a growth-curve as far as this is apracticable operation (see Gray, 1928).
The material for each experiment in the present work consisted of carefully selectedova of Salmo fario all of which were of approximately the same size and all of which werefertilised on the same day and incubated under strictly controlled conditions of watersupply and temperature. For the determination of each observation in Fig. 1 and Table I100 eggs were removed from the hatchery at various moments, anaesthetised with ether,dried on filter paper under standard although arbitrary conditions and weighed. Theembryos were then carefully dissected away from the yolk sac and weighed separately.For observations of the weight of the embryo prior to hatching it was found necessary(owing to the fragility of the embryos) to harden the eggs for some hours in dilute formalin

The Growth of Fish inbefore starting a series of observations; after hatching only fresh material was used. Sincethe percentage of water in the embryo remains constant at about 16 per cent., and thatin the yolk at 41 per cent. (Gray, 1926), it was deemed unnecessary to determine the dryweight of embryos by direct methods. As the size of an embryo depends on the size ofthe whole egg, it was thought desirable to test the variability of the material by selectingfrom time to time 100 larvae, and weighing the embryos in ten samples of ten each. Inthis way it was found that when calculated from the mean weight of 100 embryos, theweight of a single embryo could be assumed to be correct to the third place of decimals.For the sake of convenience all the weights given in this paper represent those of 100individuals selected at random.
010 10020 30 40 50 60 70
Days after fertilisation
Fig. 1. Growth-curve of embryo of Salmo fario incubated at io° C. The ordinates represent thewet weight in grams of 100 embryos.
A consideration of Fig. 1 reveals the fact that the growth-curve is not symmetricalabout its central point (i.e. when the embryos are half grown and weigh approxi-mately 7-0 gm. per 100). It is obvious that for approximately 55 days (whenincubated at io° C.) the curve is markedly convex to the time axis; it then remainsmore or less linear until 80 days, after which it suddenly becomes concave untildevelopment is complete at 100 days after fertilisation. The details of this curveare best seen from Table II and Fig. 2, in which are plotted the successive four-dailyincrements at different periods; it will be noticed that the period of maximum

J. GRAY
growth-rate occurs between 69th and 73rd days, since 100 embryos form 1*7 gm.of new tissue during this period, and at that time they weigh approximately 9-5 gm.
Table I.
Days afterfertilisation.T=io°C.
283442475 i5761656973778185899 2
1001
Wet weight of100 embryos
in grams
0-4380-8691-2542-0602-8614-1355-6547-0268-567
10-274n-6o612-67513-29413-43813-84013-983
100l-
010 70 80 90 100
Days after fertilisation
Fig. 2. The increment in wet weight of 100 embryos in successive periods of four days. Note thatthe curve is asymmetrical, reaching a maximum about 71 days after fertilisation.
at the middle of the period (71st day); in other words, the velocity of growth reaches

The Growth of Fish 113
a maximum when 70 per cent, and not 50 per cent, of the total growth has beenaccomplished.
As explained elsewhere (Gray, 1928) it is exceedingly dangerous to base aconception of the factors controlling growth on the form of the growth-curve.In this particular case, however, it is possible to proceed to some extent from firstprinciples.
Table II.
Day
3 0434751
\ 55596367717579838791
Increment in grams wet weightof embryo in four days
Absoluteincrement
O ' 2
o-50-7o-8i - oi ' 31-41'51-71'31-1
c-6O - 2O-2
% maximumincrement
1 2
304 047597782-588
1007769351 21 2
The increments are those observed during the two days prior to and succeeding the days givenin column i.
There are two obvious variables during incubation, (i) the increase in size of thegrowing embryo, (ii) the decrease in the amount of available yolk. During larvallife all the tissues are growing, and although they are not all growing at the samerelative rates, the changes in the proportions of the various organs do not appear to begreat except where the total weights of the organs are veiy small. The muscles, skinand cartilaginous skeleton all maintain roughly the same proportions during the periodof larval life here considered. If this be true, we can look upon the embryo as a systemwhose heterogeneity is not changing very markedly (see Gray, 1928) and which repre-sents therefore a natural entity of growth, whose growing powers are proportional tothe total size. As the embryo grows, so the amount of yolk in the yolk sac decreases,and it is clear that the period of slow growth between the 80th and 100th day ischaracterised by a small yolk sac which is rapidly decreasing in size. It is, therefore,conceivable that the rapid decline in growth-rate towards the end of incubation iscorrelated with a scarcity of the raw materials for growth, this suggestion beingsupported by the fact that the growth-rate rapidly rises again as soon as the youngfish begins to take in extraneous food. Confirmatory evidence correlating growth-rate with the amount of yolk available is derived from the fact that the absolute sizeof an embryo at a given age is dependent on the size of the newly fertilised egg.Small eggs give small embryos, large eggs yield large embryos. If a fine ligature isattached to the posterior end of the yolk sac, the position distal to the ligaturebecomes opaque and falls off; the resultant larva completes its development and
oBJEB'Vlil °

G R A Y
is normal in all respects except that it is consistently smaller than it would have beenhad the full amount of yolk been available.
At any particular moment the yolk which is passing into the embryo is beingused for two distinct processes, (i) to maintain the respiratory and other katabolicprocesses of the tissues, (ii) to form new tissues. Let us assume for the momentthat the rate of growth of the embryo (Bx/St) is proportional to its dry weight (x)and to the amount of dry yolk (y) available
$x , ...£t = k.x.y (l).
If, however, the amount of yolk required for maintaining the embryo has anaverage value of k± per gm. of embryo1, then the rate of disappearance of yolk(— Syfit) is given by equation (ii)
iIf x = x0 when y = y0, then equation (ii) can be integrated in the form of
equation (iii)k(x + y) k(x + y) fclog £ ^
At the beginning of development when y0 is the total yolk in the unfertilisedegg, x0 is very small so that, if k^ = k^k, equation (iii) can be written
~ge
y i
and at the end of incubation when y — o the weight of the embryo is given byequation (v)
x = yQ-k2\ogey° , 2 (v),
and from this k2 can be calculated.If the underlying assumptions are justified, it follows that it is possible at any
moment during development to express the weight of embryo in terms of theamount of yolk remaining in the yolk sac, or (what is more useful) the weight ofthe whole larva in terms of this yolk or in terms of embryo. The dry weightof the whole larva is obviously x + y, and if we substitute for x the value given inequation (iv) we get a value for the dry weight of the larva in terras of yolk.
If, instead of calculating the dry weight of the larva, we determine its wetweight, then
Wet weight ot larva = -?- -\° io 41
Substituting for x the value given in (iv)
yo — y — h loge ̂ 5 + 2-443;y + «
= 6-25̂ 0 - 3-813/ - &2$h k g ^ r n r1 The rate of oxygen consumption per gram of embryo is constant from 46th~7oth day of incu-
bation at io°, after which it declines under the particular conditions which existed during themeasurements (Gray, 1926).

The Growth of Fish 115
Equation (vi) is of importance because, if the initial assumptions underlyingequation (ii) are sound, it shows that the wet weight of the larva should reach amaximum before the embryonic growth cycle is completed; there ought to be a periodtowards the end of the larval life when the wet weight of the larva is decreasingalthough the wet weight of the embryo is still increasing, whereas during the majorportion of incubation the wet weight of both will increase. From equation (vi) itfollows that the wet weight of the larva will increase as the embryo grows until thewet weight of yolk left in the yolk sac is reduced to i*56^2,
1 after which the wetweight of the whole larva will decrease although that of the embryo continues to
15-0r-
10 20 30 40 50 60 70 80 90 100Days after fertilisation
Fig. 3. Growth-curve of the whole larva (embryo + yolk). The ordinates represent the wet weightin grams of 100 larvae. Note that the larva reaches a maximum weight at about the 85th dayof incubation whereas the embryo continues to increase in weight until 100th day (see fig. 1).The curve indicates the theoretical values obtained from equation (vi). The dots are observedvalues.
increase. At io° C. k2 = 0*55, so that the maximum weight of the larva should bereached when there are o-86 gm. of yolk still unconsumed; the amount actuallyobserved was I-IO gm.
Again, if the initial assumptions are sound, the size of the embryo at the end of
1 If z =ay0 —by —ak^ logey^r* then z reaches a maximum value when y = -^—h- *n equa-^ r
tion (vi) a =6*25, b =3-81, hence x is a maximum when y =1*56 k%.8-2

n6 J. GRAY
incubation will decrease with increasing values of k2. Now it is very unlikely thatboth k and kx will be equally affected by changes in temperature, so that if thetemperature be changed there ought to be a measurable difference in the size of theyoung fish at the end of the larval phase. We have, therefore, two definite qualitativetests of the hypothesis that the rate of growth of a unit weight of embryo is pro-portional to the amount of yolk available.
The wet weight of the whole larva as determined by direct observation is shownin Fig. 3 and Table III. It is quite clear that the larva attains a maximum weight
Table III.
Days afterfertilisation
344 2475 i576 1656973778 185.92
1 0 0
Wet weight of100 larvae
8-759-209-40
10-0410-2710-3911-9812-7713-84I4-2514-5614-6314-2213-98
Wet weight of 100embryos in gm.
0-871-252-062-864135-657-038-57
10-27n-6r12-6713-29J3'4413-98
about fifteen days before the embryo itself ceases to grow. This period representsa time when the wet weight of the yolk being used up for maintaining the embryois greater than the wet weight of larva being formed. The observed facts give,therefore, a considerable measure of support to the original assumptions here made;this support is increased by what follows.
EFFECT OF TEMPERATURE ON THE FINAL SIZE OF THE EMBRYO.
After forty-three days of incubation at io° C. a batch of eggs from a selectedfemale was divided into two groups; one of these was incubated at 150 C , the otherat io° C. The temperature of each hatchery was maintained at the required levelby a supply of water running from a suitable thermostat, and contained the bulbof a recording thermometer. As soon as the larvae ceased to show a tendency toorientate themselves away from the light but swam actively in the hatchery traysthey were removed and weighed in batches of ten. The results are recorded inTable IV.
A confirmatory experiment was carried out with another batch of eggs incubatedat three different temperatures (Table V). The mortality was high at 17-5° C ,whereas at lower temperatures it was negligible.
It is clear that the higher the temperature the smaller is the final size of theembryo at the end of incubation, although at the higher temperature the processof incubation is markedly accelerated (see Gray, 1928 b). This result is obviously

The Growth of Fish 117
in harmony with the assumption that the rate of growth of the embryo is pro-portional to its size and to the amount of available yolk. By raising the temperaturethe value of 1% is increased, or in other words the temperature coefficient of theprocess of maintenance is higher than that of actual growth.
Table IV.
Wet weight in grains of different samplesof 10 fish at the end of incubation
15° C. io°C.
1-42061-367
1-387i*3ooi'245i-3ooI-35O1-3061-3^51-3601-230i'35°i*3O5i'33O1-370i*37o
Mean weight of
13*35 dbo«i6
1-4821-6051-6231-4641-4261-4261-503i*495i*5351*4851-4801-5461-5201*4661-467
100 fish
15*07 -fco'i8
Table V.
Temperature ofincubation
5°C9°C.
17*5° C,
Wet weight of 100 larvaeat the end of incubation
13*311-69'2
Table VI.
Temperature
i7°C.
37°
Maximum densityof bacteria
18,272,00015,164,00010,448,000
Time in daysrequired to teach.maximum density
853
These results form a striking parallel to those observed by Graham Smith (1920)for the effect of temperature on the rate of growth and maximum density of aculture of bacteria. The higher the temperature, the lower is the maximum densityreached in a given culture medium, although the characteristic maximum is reachedmore quickly at the higher temperatures (Table VI). The value of this maximumdepends also on the concentration of nutrient material in the medium.

n8 J. GRAY
It has now been shown that the assumed proportionality of the specific growth-rate to the amount of yolk in the yolk sac is in harmony with two distinct piecesof qualitative evidence, (i) the maximum wet weight of the larva is reached beforethe embryonic growth cycle is completed, (ii) the final size of the embryo varieswith the temperature of incubation. We may now proceed to inquire how far theobserved growth-rate of the larva runs parallel to the observed amount of yolkavailable.
CORRELATION OF SPECIFIC GROWTH-RATE WITH AMOUNTOF YOLK AVAILABLE.
It has already been shown that the maximum growth-rate of the embryo isattained at about the 71st day of incubation at io° C , and when the embryo isabout 70 per cent, of its final size. If equation (i) is correct, then the product ofdry yolk and dry weight of embryo should also reach a maximum on the 71st day.The two variables were measured by direct experiment and the results are recordedin Table VII.
Table VII.
Day
4347S i55575961
6567697 17 375777981
i38587899 i9 2
4 daily incrementin grams wet
weight of embryo
o-50-7o-8i-o—1-3
—
i-5
1-7—i ' 3—
—
o-6—O-2—O-2—
% maximumgrowth-rate
3 04 i4759
77
82-5—88—
1 0 0—77—79
35—1 2—1 2—
Embryo(#) x yolkCv)grams dry weight
—0-99-•34—
1-67—
2-II
2-25
2'35
2-39—
2*OI
1-58
1*17
o-54—
0-36
% maximumof product x.y
—
56—69—
8-9
90-4—98—
100—83—66—49—2 2—
15
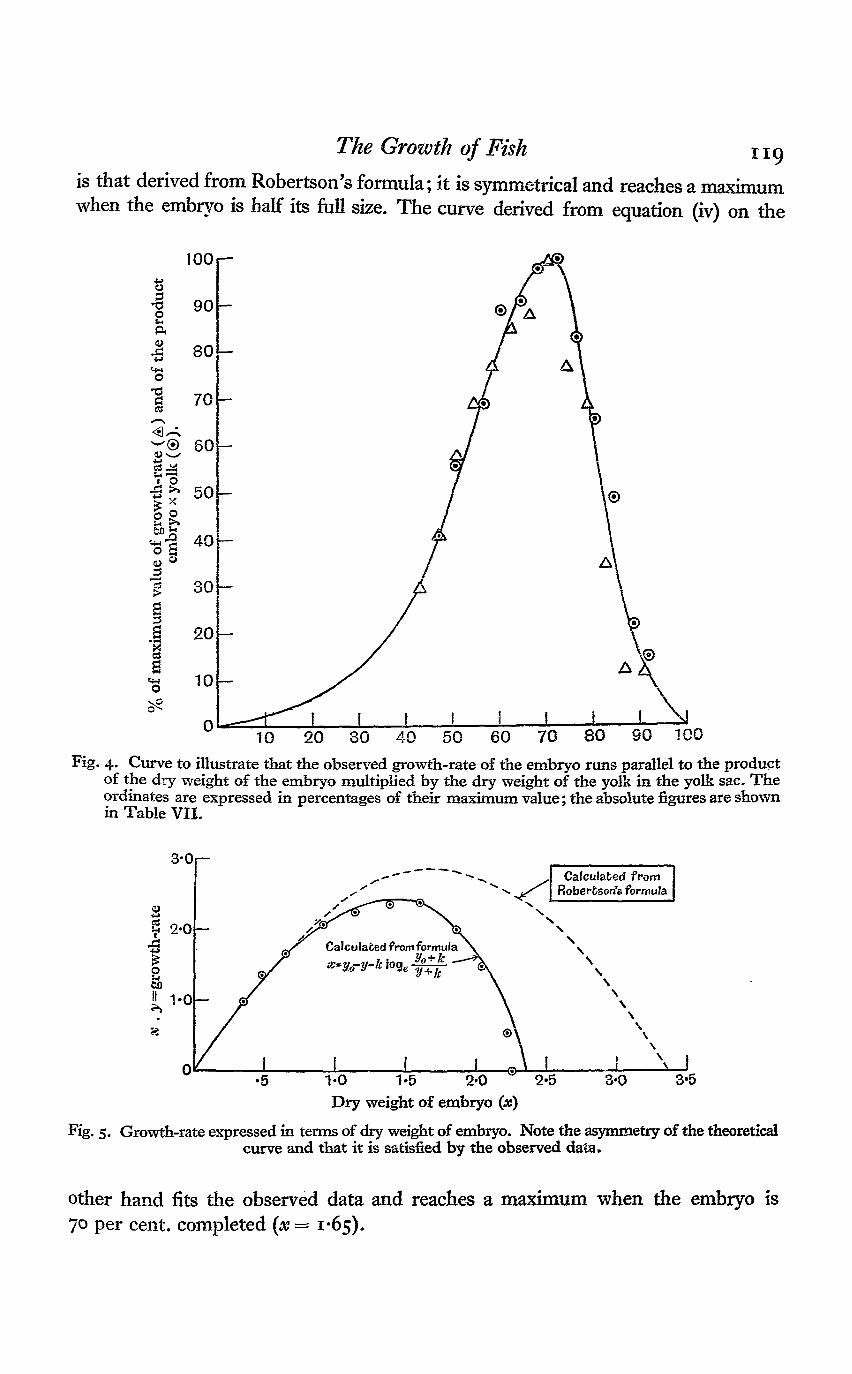
The parallel between the total growth-rate and the product of embryo x yolkis illustrated in Fig. 4. It is clear that both these values reach their maximumwhen the embryo is about 70 per cent, of its full size, at about 7ist~73rd day ofincubation. It should, however, be noted that precise determinations of growthduring short periods of time are not easy to obtain.
The asymmetrical nature of the growth-curve is readily seen in Fig. 5 wherethe growth-rate is plotted as a function of the size of the embryo. The dotted curve
The Growth of Fish 119
is that derived from Robertson's formula; it is symmetrical and reaches a maximumwhen the embryo is half its full size. The curve derived from equation (iv) on the
1001—
10 20 30 40 50 60 70 80 90 100
Fig. 4. Curve to illustrate that the observed growth-rate of the embryo runs parallel to the productof the dry weight of the embryo multiplied by the dry weight of the yolk in the yolk sac. Theordinates are expressed in percentages of their maximum value; the absolute figures are shownin Table VII.
CafcuJated fromRobertson's formula
Calculated fromformula
1-0 1-5 2«0 " 2-5Dry weight of embryo (x)
3-0 3-5
Fig. 5. Growth-rate expressed in terms of dry weight of embryo. Note the asymmetry of the theoreticalcurve and that it is satisfied by the observed data,
other hand fits the observed data and reaches a maximum when the embryo is70 per cent, completed (x= 1*65).

120 J. GRAY
THE "EFFICIENCY" OF DEVELOPMENTAL PROCESSES.
The efficiency of developmental processes is usually expressed as the ratiobetween the dry weight of the embryonic tissue formed and the dry weight of yolkwhich has been utilised during the period of development. In a previous paperthis value (in the case of the trout embryo) was given as 0-63, and it was pointed outthat this figure holds with approximate accuracy for a variety of organisms. Theconceptions outlined above suggest, however, that this representation of the factsis not of any real value. The so-called "efficiency" ratio represents in actualpractice
weight of embryo formedweight of embryo formed + weight of yolk used for maintenance'
Now the weight of yolk used for maintenance can be obtained by integratingthe growth-curve as long as the intensity of maintenance is constant, and it thereforefollows that the "efficiency" ratio cannot remain constant during development butmust fall as time proceeds. For example, making use of equation (iv), and puttingyQ = ^-36 and kz= i*o (the approximate value characteristic of incubation at 150 C.)we get
x= 1-89- y + 2-3log10(j4- 1).
Table VIII.
Dry weights of
Yolk lefty
3-353'333-3O3-002'5°2-OO1-50i-oo0-50
0
Yolk used3*6 —y
0*010-030-060-36o-861-36i-862-362-863-36
EmbryoX
0-008550-02390-0470*270-630-9871311-581-7951-89
Cumulativeefficiency
0-85o-8o0-78o-750-730-720-700-670-630-56
Efficiencyfor successive
•5 gm. yolk used
0-710-65o-54o*430-19
The fall in the "efficiency" with advancing periods of development is seenwhen the values are calculated for successive periods (Table VIII). Thus for thefirst half gram of yolk which is used, there are formed 0-38 gm. of embryo givingan efficiency of 76 per cent., whereas for the last half gram of yolk used there areonly 0-095 ?m- °f embryo formed with an efficiency of 19 per cent. In actualpractice it is doubtful how far the available data are sufficiently accurate to calculatethese percentages for short periods with any degree of precision. It is quite clear,however, that no single value can represent the efficiency of development at allperiods of incubation. The facts simply indicate that development is an extremelyefficient process (not much less than 100 per cent.—see Gray, 1926) and that,owing to the necessity for maintaining the embryo once it is formed, only two-thirdsof the original yolk in the fertilised egg is actually converted into embryonic tissue.

The Growth of Fish 121
DISCUSSION.The available facts indicate the possibility that the growth-rate of the trout's
embryo is proportional to its mass and to the amount of yolk in the yolk sac. Thisconclusion is based on three main facts. Firstly, the final size of the embryo at theend of larval life is determined by that quantity of yolk in the newly fertilised eggwhich will not be required for maintaining the embryo during its period of life.At any instant, the growth-rate per gram of embryo is proportional to the amountof yolk available (Fig. 6). Secondly, the very characteristic decline in the wet weightof the whole larva which is shown to occur towards the end of incubation furnishesindependent, although not conclusive, evidence that the decline in the growth of the
3-5r-
10 20 30 40 50 60 70 80Number of days after fertilisation
90 100
Fig. 6. Curve illustrating the proportionality between specific growth-rate and the amount of yolkin the yolk sac. The curve is the calculated curve for specific growth-rate reduced to an ap-propriate scale of ordinates. The points indicate the observed weight of dry yolk in the yolk sac.
embryo during this period is the result of a diminished supply of yolk. Thirdly,when incubation is carried out at higher temperatures the final size of an embryois less than that of an egg incubated at lower temperatures. It is interesting tonote that the growth-rate during larval life is determined for any given temperatureby food supply, just as is the case during post-larval life.
The facts described in this paper show a striking parallel between the processesof growth of a fish embryo with those displayed by a culture of bacteria. In bothcases we are dealing with an increasing population of cells growing at the expense
122 J. G R A Y
of a limited amount of food. The food is being used for two purposes—themaintenance of the growing cells and for the production of new cells or tissue. If,in either case, the expenditure of food for the purpose of maintenance is mademore intense by raising the temperature, the less food is available for the productionof new tissue and the smaller is the amount of new cells or tissue formed beforeall the food has been utilised. In order to produce the maximum amount of tissue,incubation should be effected slowly by lowering the temperature.
Although the known facts clearly harmonize with the simple assumptions heremade, there are certain criticisms which cannot be ignored. Firstly, it is by nomeans obvious why the growth-rate should be proportional to the total weight ofthe yolk in the yolk sac. Very little is known of the mechanism of yolk absorptionexcept that it appears to be effected by the syncytial wall of the yolk sac and thenutritive material conveyed to the embryo by means of the large vitelHne vein.One would have expected that the amount of yolk reaching the embryo would bedetermined by the mass of the syncytium and not of the yolk; if the thickness ofthe absorptive membrane remains constant, the amount of yolk reaching theembryo might well be proportional to the surface of the yolk rather than to itsmass. Since the yolk sac does not remain spherical and no pertinent informationis, as yet, available concerning the syncytial wall, the validity of this criticism isnot easy to assess. Secondly, when the embryo is large and the amount of yolk issmall, there is little doubt that the growth-rate falls for lack of food, but it is notaltogether clear why this should also be the case when the embryo is very smalland the amount of yolk large. One would expect, in the latter case, that food ispresent in excess and is not a critical factor controlling the specific growth-rate.Here, again, it is not easy to test this suggestion since determinations of the growth-rate of very small embryos are not easy and the error introduced by a factor whichvaries with the amount of yolk is not large until the embryo is of a considerablesize. Finally, it must be remembered that the quantitative analysis carried out inthis paper assumes that the rate of growth is also proportional to the weight of thewhole embryo. In other words it is assumed that, although all the tissues are notgrowing at a uniform rate, the proportion of one tissue to another does not changematerially throughout development. This, of course, is only true within limits.Until further data are available one can only suppose that the errors due to thethree above causes are either small or cancel one another, leaving the possibilityof correlating the growth-rate with the simple variables expressed by the totalamount of yolk available and by the weight of the whole embryo.
Two secondary points may now be considered. Firstly, it wiil be noted thatthe departure of the observed growth-curve from the type advocated by Robertsonis due to the fact that all the yolk is not converted into embryonic tissue. That theobserved curve of growth cannot be expressed by Robertson's formula is clearlyestablished, and the fact that the growth-rate rises again as soon as the larval fishtakes in extraneous food makes it unnecessary to postulate any fundamentaldifference between the factors controlling larval and post-larval growth. Secondly,the specific growth-rate when plotted against age does not fall with decreasing
-Minot
The Growth of Fish 123
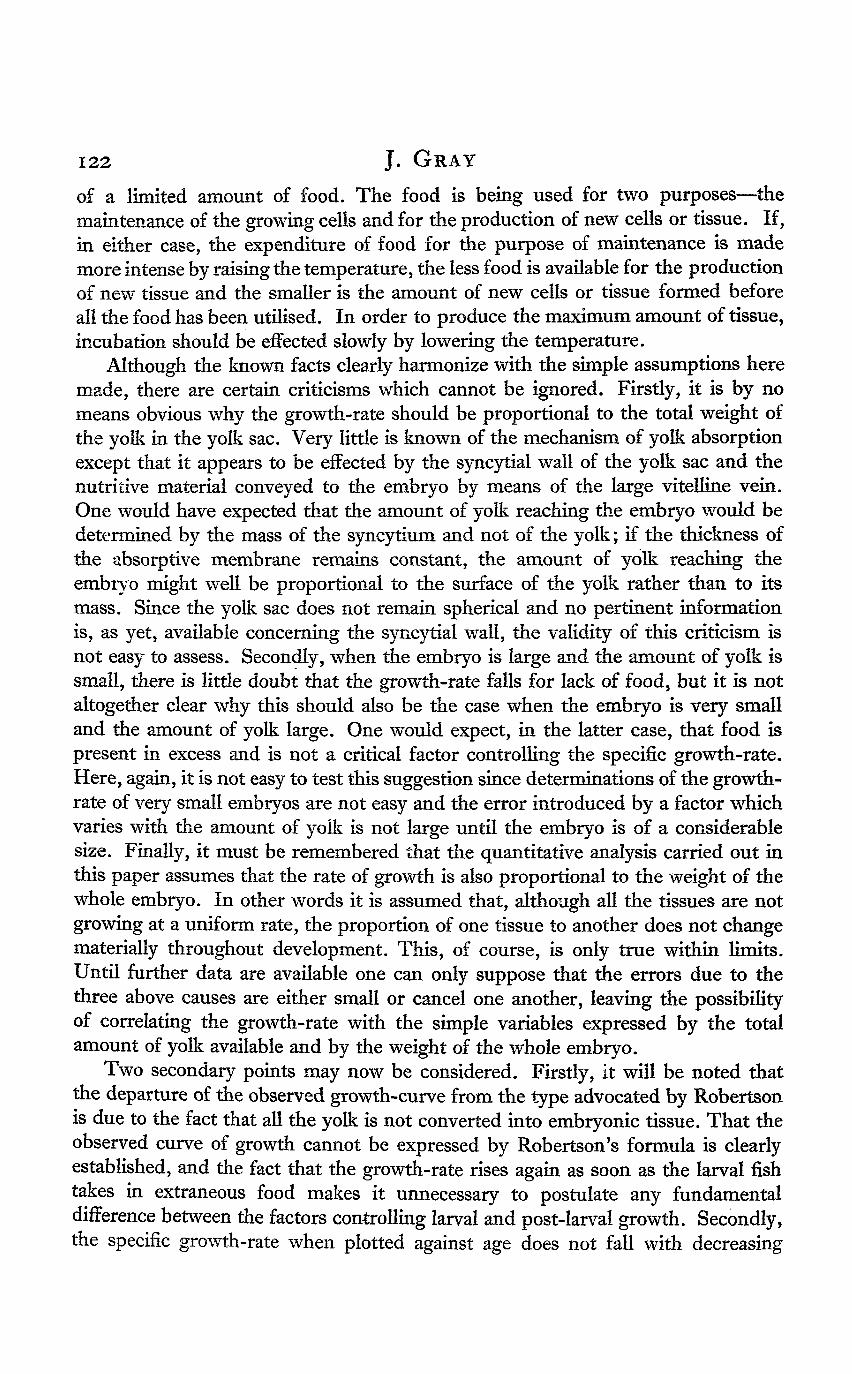
acceleration as was suggested by Minot and later implied by Murray (1925) forchick embryos. The specific growth-rate falls first with increasing acceleration andthen with decreasing acceleration giving asigmoid curve illustrated by Fig. 7. It wouldbe interesting but difficult to confirm this con-clusion by direct observation of the rate ofgrowth in the very early stages of segmenta-tion. If the present analysis is sound, thepotentialities for growth of embryonic fishtissue do not materially decrease with age.The specific growth-rate of the embryo de-creases because there is a reduction in the rateat which the tissues are supplied with the rawmaterials for manufacturing new tissue. It ispossible, however, that there may be also aslow decline in the true potentiality for growththe effect of which is swamped by the muchgreater effect exerted by a declining supplyof yolk. From a preliminary study of post-larval growth it would appear that such adecline in potential growth-rate occurs inlater life.
Fig. 7. The full curve illustrates dia-grammatically the change in specificgrowth-rate actually observed; thedotted curve is that put forward byMinot. Note that the observed curvecannot be obtained by extrapolationof the values found by Minot's laterobservations.
SUMMARY.1. The growth-curve of the embryo of
Salmo fario is asymmetrical and inflects whenthe embryo has completed approximately70 per cent, of its development.
2. For any given temperature of incuba-tion the final size of the embryo is proportionalto the total amount of yolk present in thenewly fertilised egg. If the amount of yolk is reduced experimentally the final sizeof the embryo is reduced, but its morphological form is normal.
3. The growth-rate of the embryo is shown to be proportional to its own sizeand to the amount of yolk in the yolk sac. Assuming that the amount of yolkrequired for the maintenance of a gram of embryo at all periods of its life is constant,the dry weight of the embryo (x) can be expressed in terms of the yolk in the yolksac (y) by means of the equation
where y0 = the dry weight of yolk in the newly fertilised egg, and where ^ is aconstant which alters with the temperature of incubation.
4. On theoretical grounds there should be a period towards the end of

124 J- G R A Y
incubation when the total wet weight of the larva is decreasing, whereas the wetweight of the embryo is still increasing. This is shown to be the case.
5. If the temperature is raised, the final size of the embryo at the end ofincubation is reduced. This fact is also deducible from the initial assumption thatthe specific rate of growth is proportional to the amount of yolk available.
6. The factors controlling the specific rate of growth of a fish embryo are,therefore, (i) temperature, (ii) food, i.e. the amount of yolk in the yolk sac. Thesetwo factors operate in precisely the same way as on a culture of bacteria, and itmay be concluded that the processes of metazoon growth in vivo are similar tothose of bacteria.
7. The so-called "efficiency" of development falls as incubation proceeds, andno single figure holds good over more than very limited periods.
BIBLIOGRAPHY.GRAHAM-SMITH, G. S. (1920). Journ. of Hygiene, 19, 133.GRAY, J. (1926). Brit. Journ. Exp. Biol. 4, 213.
(1928). Brit. Journ. Exp. Biol. 6.MINOT, C. S. (1908). The problems of Age, Grozoth, and Death. New York.MURRAY, H. A. (1925). Journ. Gen. Physiol. 9, 39.ROBERTSON, T. B. (1923). Chemical basis of growth and senescence. Philadelphia.