the greenhouse effect. spm 3 concentration of carbon dioxide and methane have risen greatly since...
Post on 19-Dec-2015
220 views
TRANSCRIPT
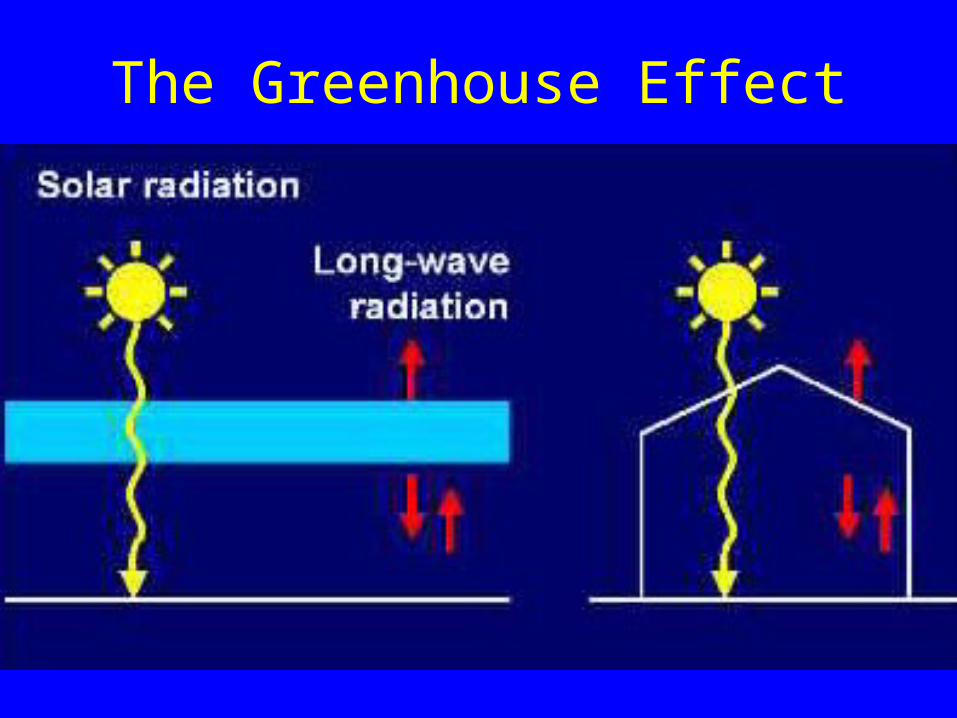
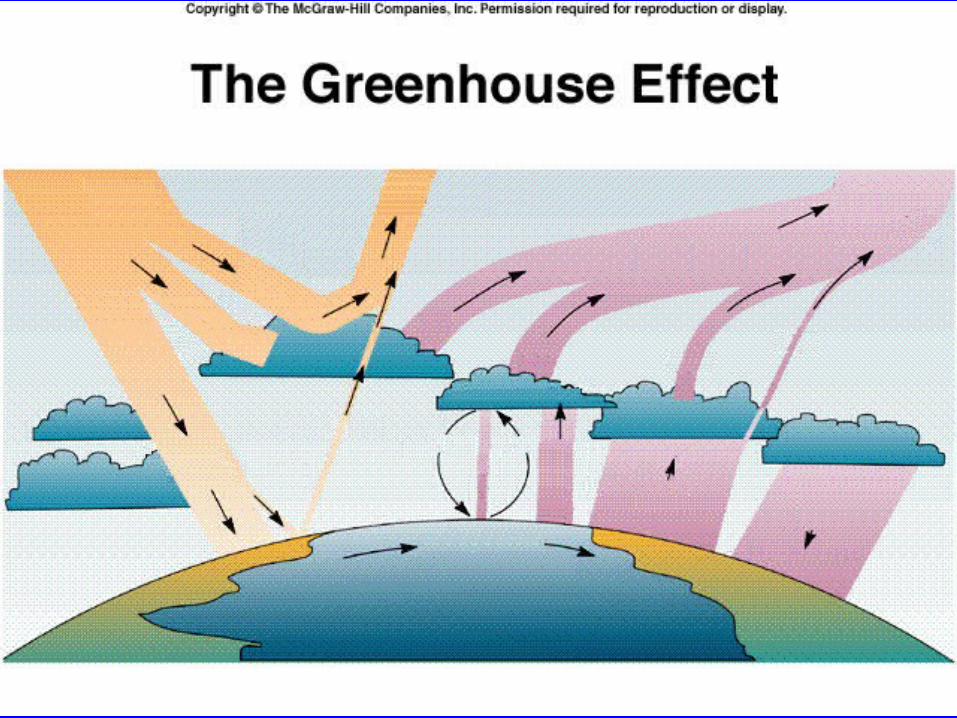
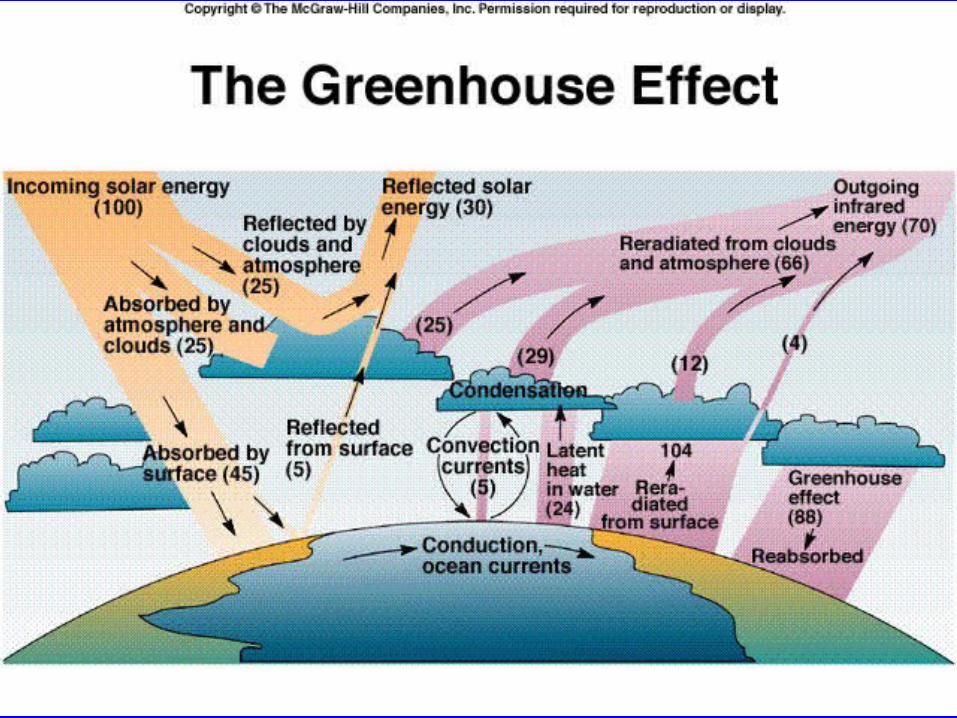
The Greenhouse Effect
SPM 3
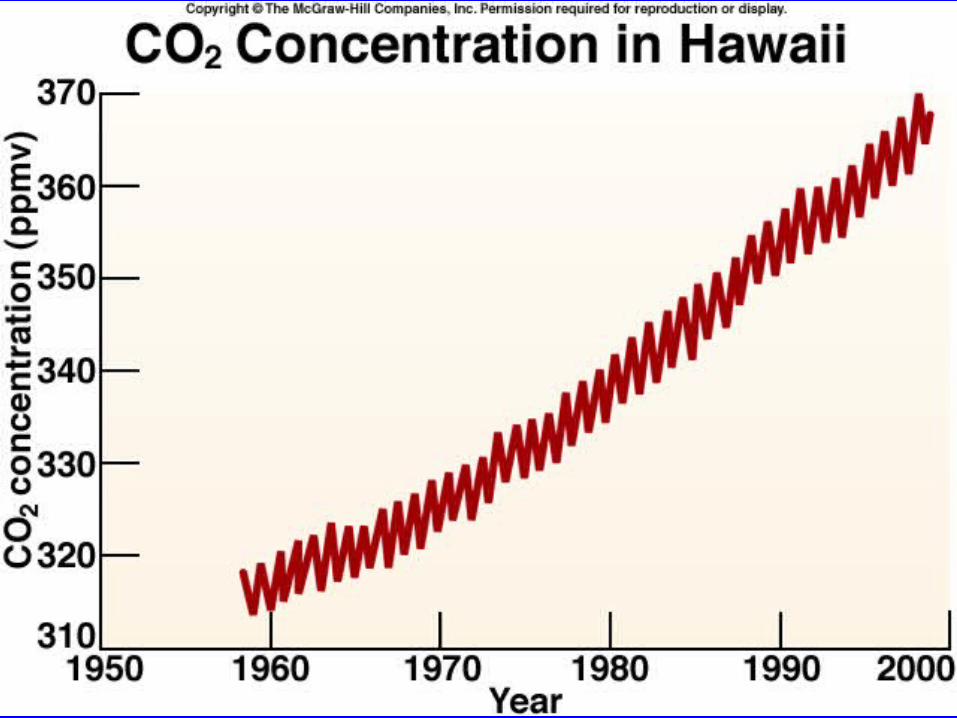
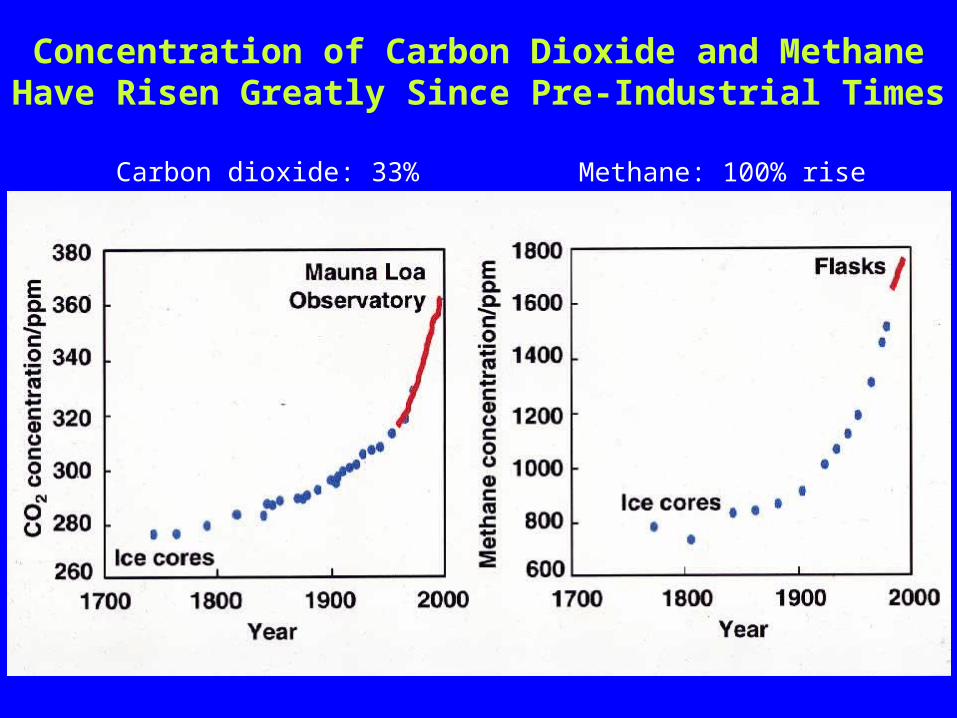
Concentration of Carbon Dioxide and Methane Have Risen Greatly Since Pre-Industrial Times
Carbon dioxide: 33% rise Methane: 100% rise
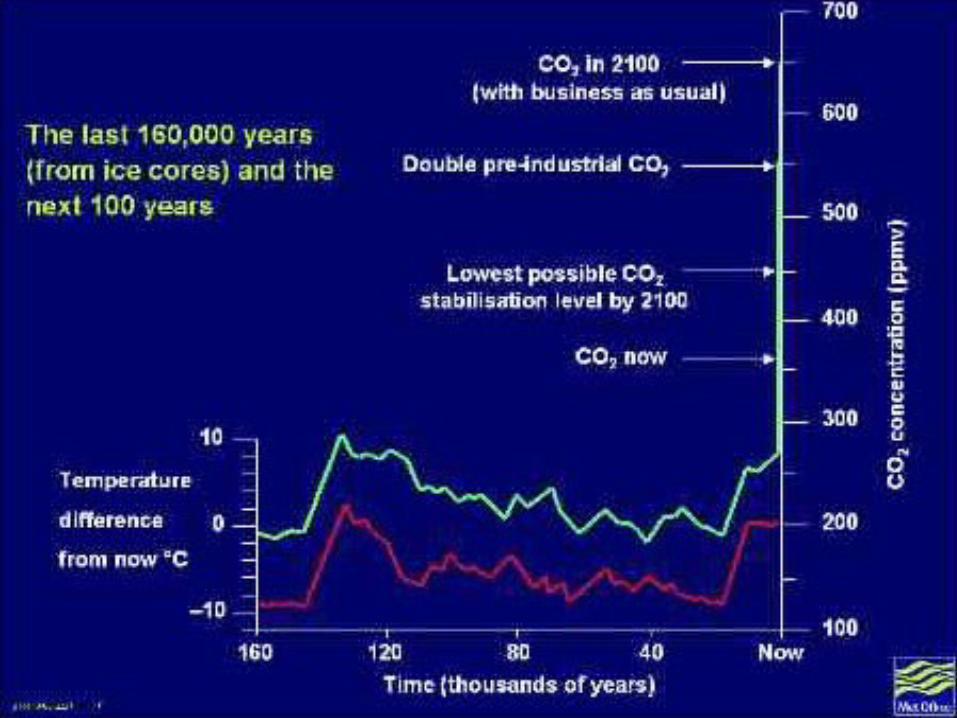
The MetOffice. Hadley Center for Climate Prediction and Research.
BW 5
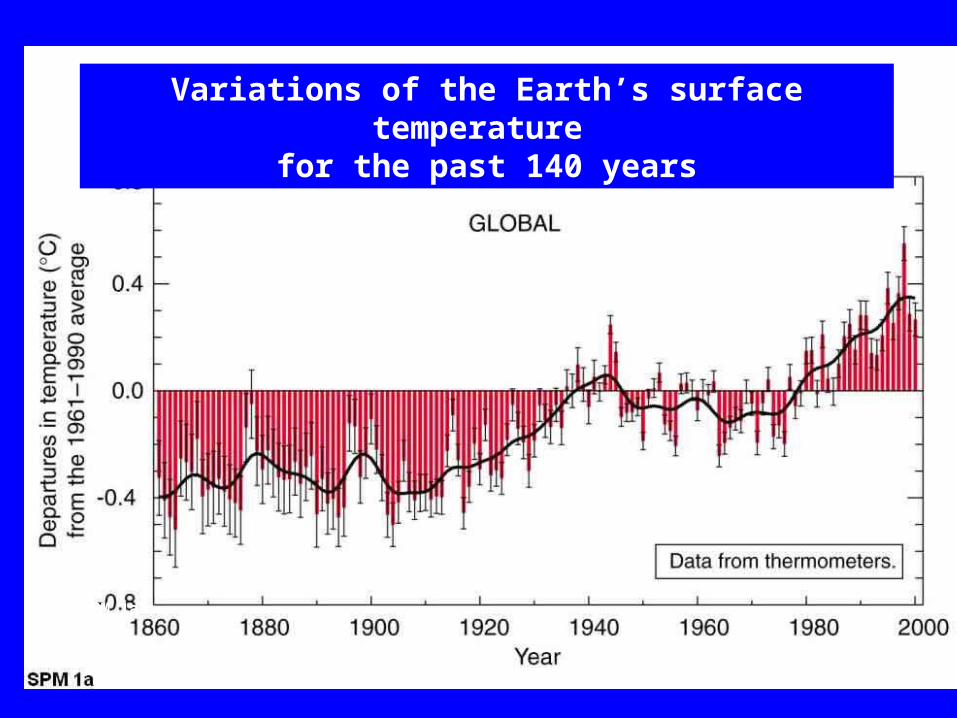
Variations of the Earth’s surface temperature for the past 140 years
SPM 1a
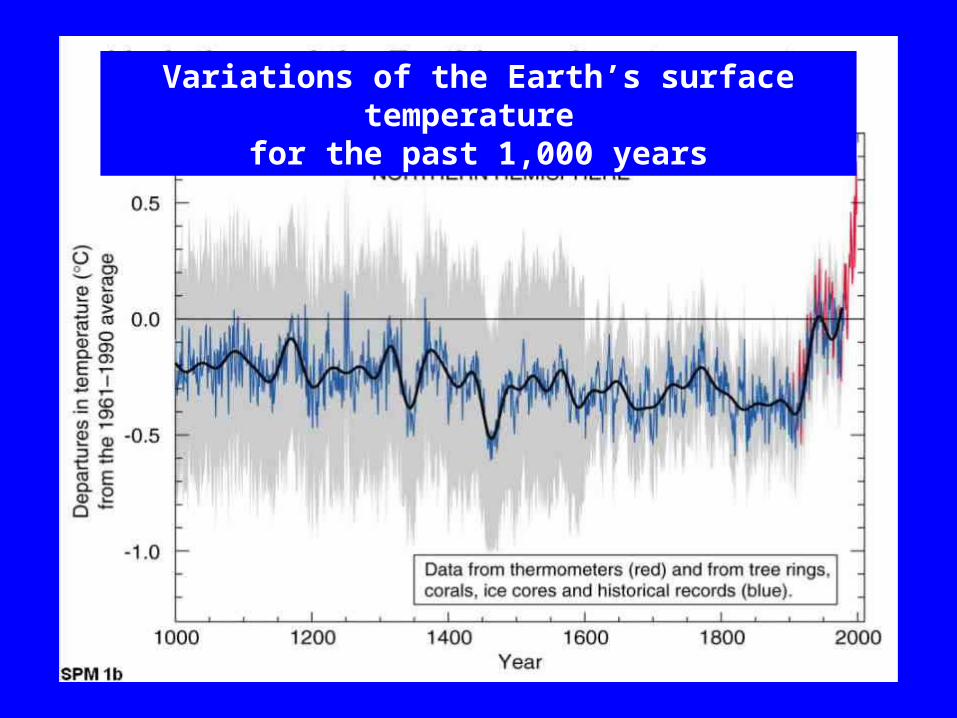
Variations of the Earth’s surface temperature for the past 1,000 years
SPM 1b
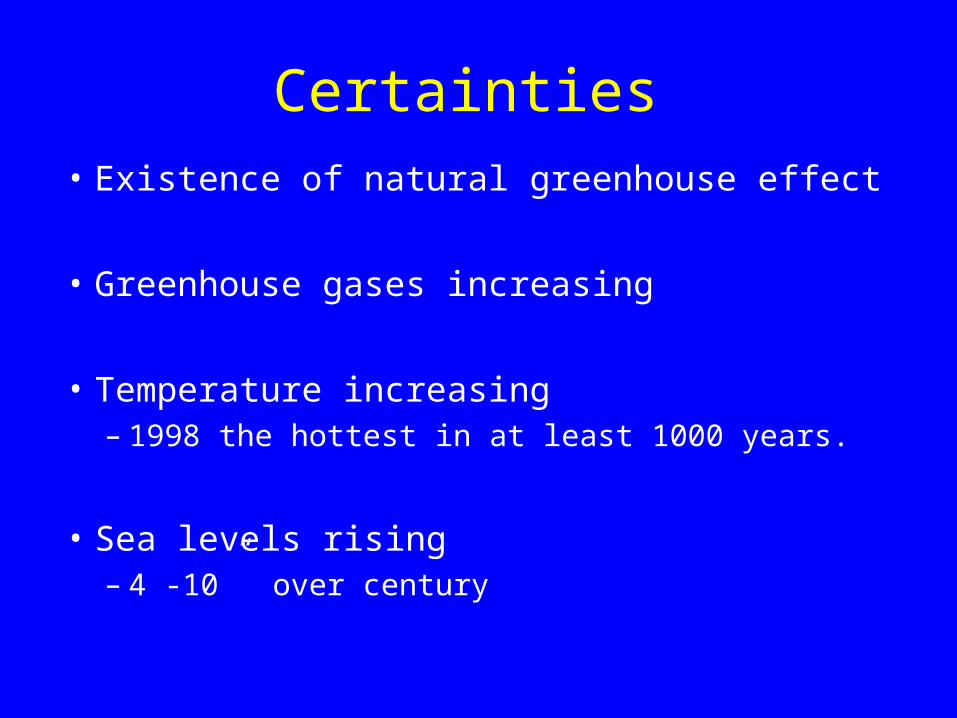
Certainties
• Existence of natural greenhouse effect
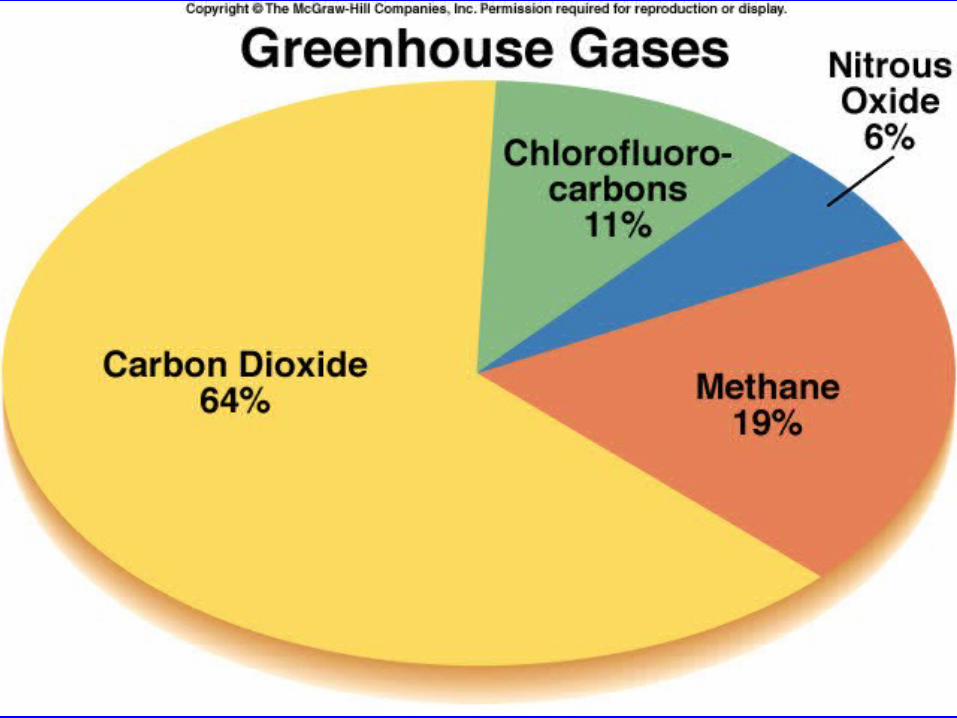
• Greenhouse gases increasing
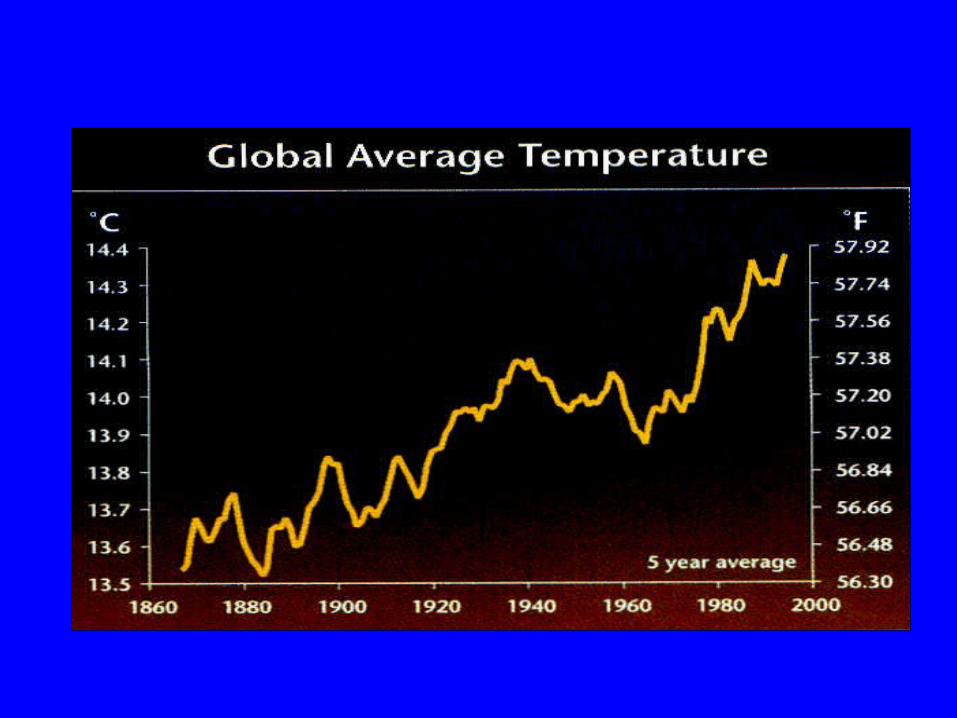
• Temperature increasing – 1998 the hottest in at least 1000 years.
• Sea levels rising – 4 -10” over century

Uncertainties
• Timing of atmospheric warming, glaciers
• The effects of increased cloudiness
• Uneven health and ecological impacts
• Unanticipated events
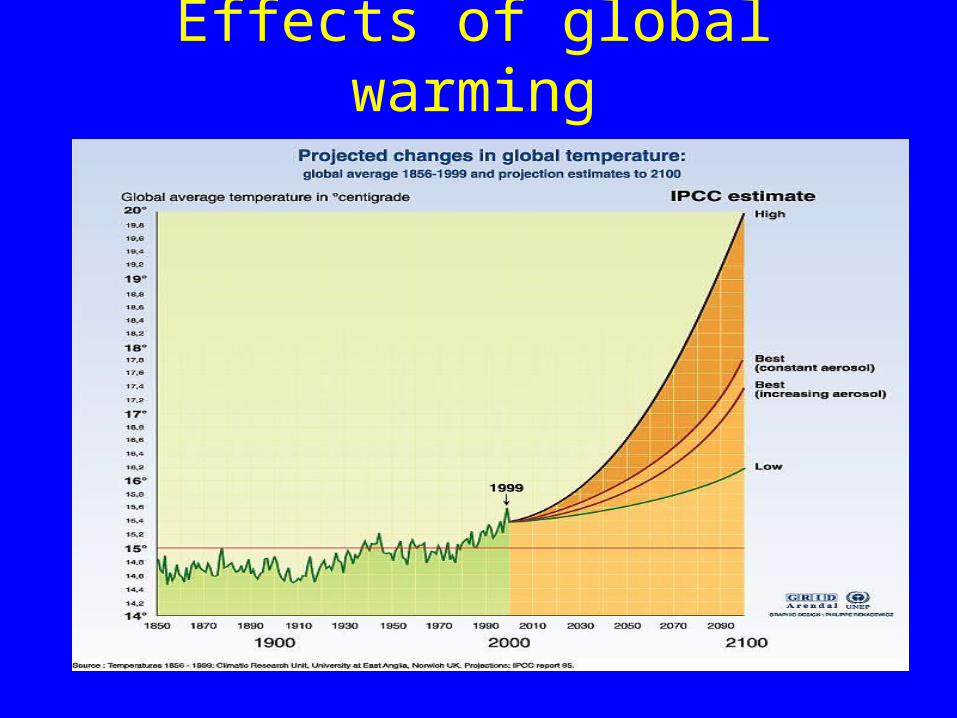
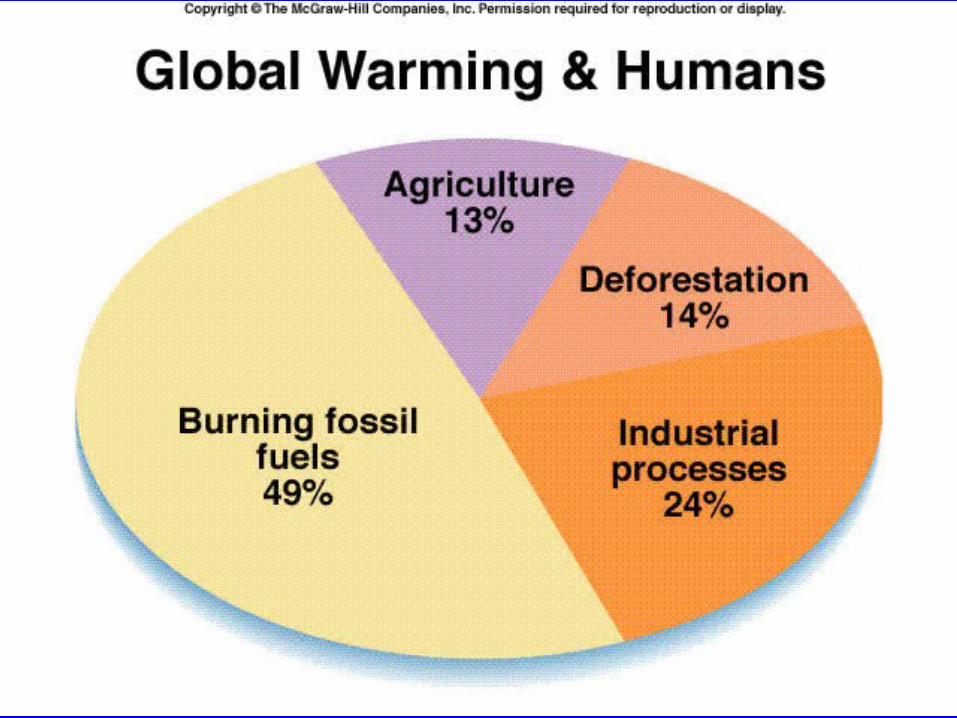
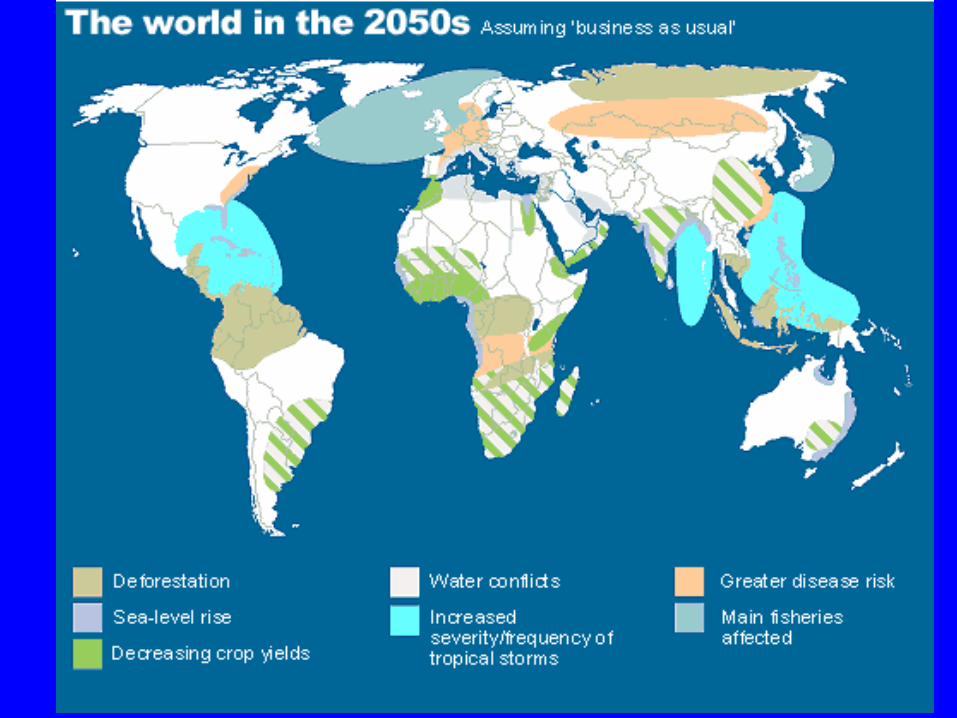
Effects of global warming
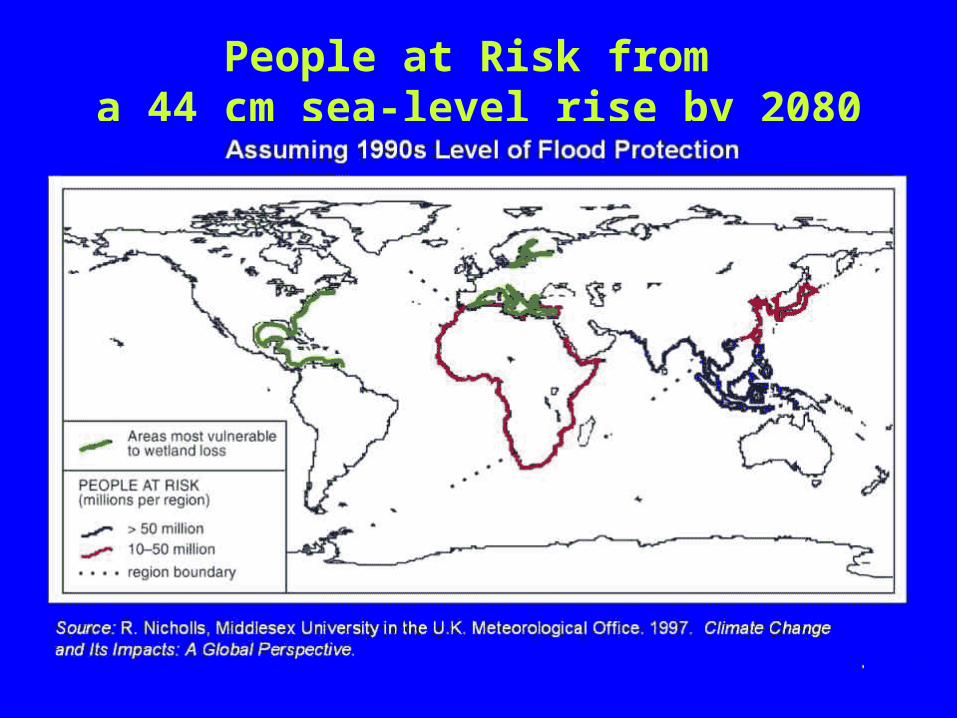
People at Risk from a 44 cm sea-level rise by 2080
Assuming 1990s Level of Flood Protection
Source: R. Nicholls, Middlesex University in the U.K. Meteorological Office. 1997. Climate Change and Its Impacts: A Global Perspective.
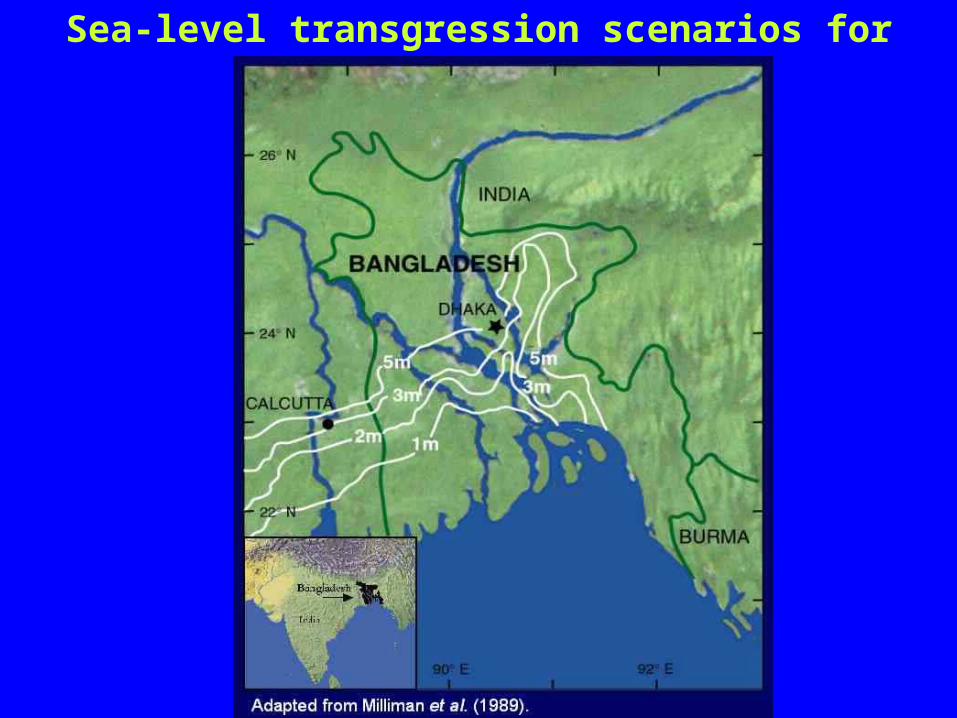
Sea-level transgression scenarios for Bangladesh
Adapted from Milliman et al. (1989).

Forest fires in drying forests
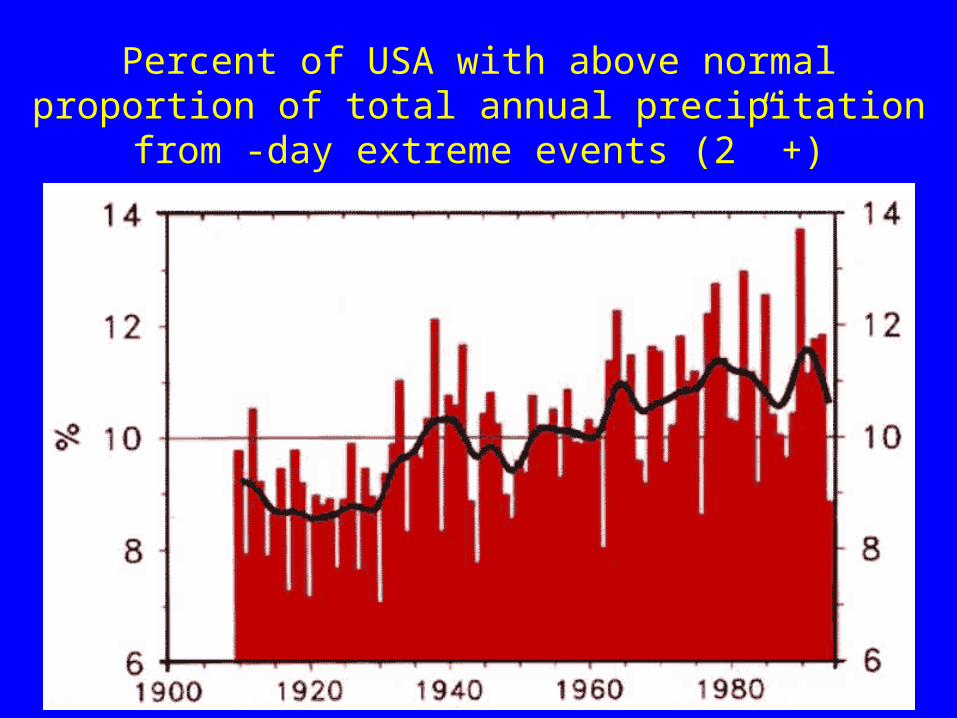
Percent of USA with above normal proportion of total annual precipitation from -day extreme events (2” +)
Karl et al. 1996
BW 7
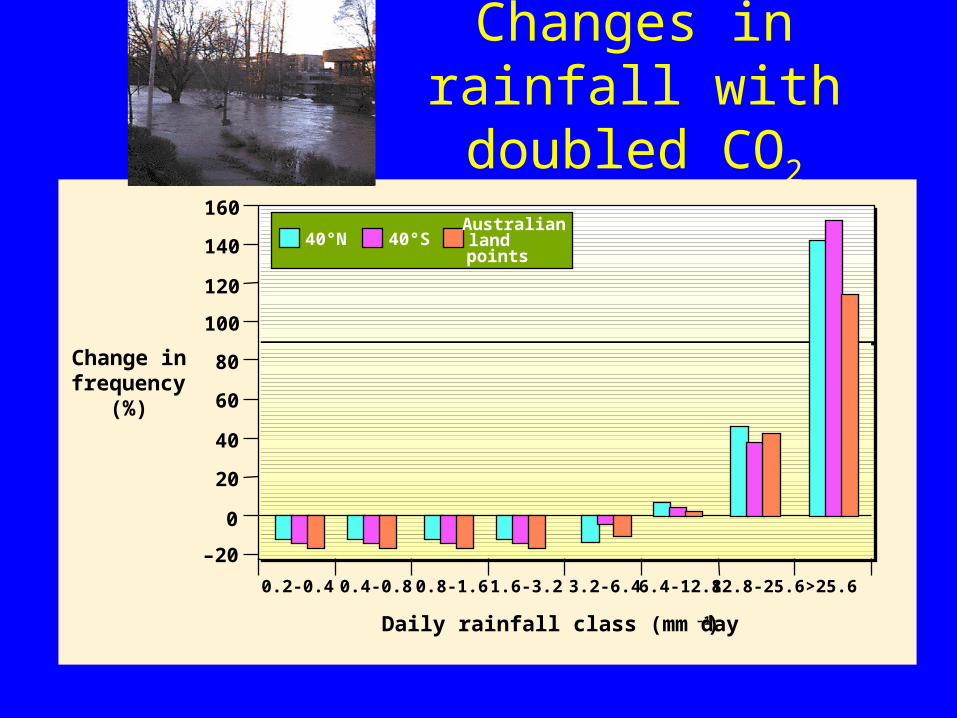
Changes in rainfall with doubled CO2
>25.6
Daily rainfall class (mm day–1)
0.2-0.4 0.4-0.8 0.8-1.6 1.6-3.2 3.2-6.4 6.4-12.8 12.8-25.6
160
140
120
80
60
40
20
0
–20
100
Change infrequency
(%)
40°N 40°SAustralianlandpoints
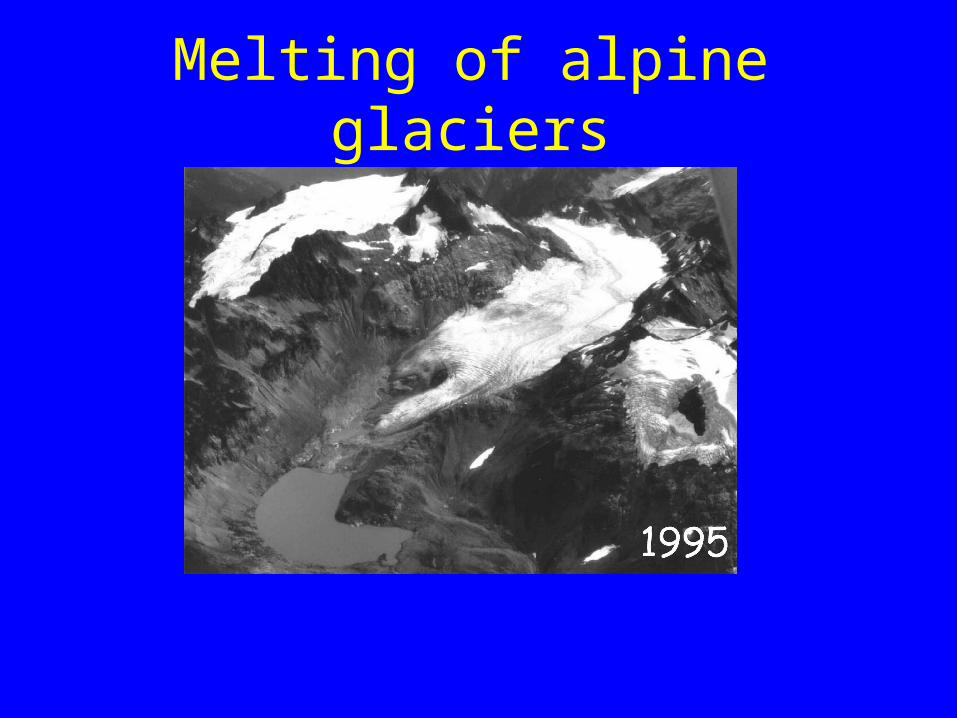
Melting of alpine glaciers
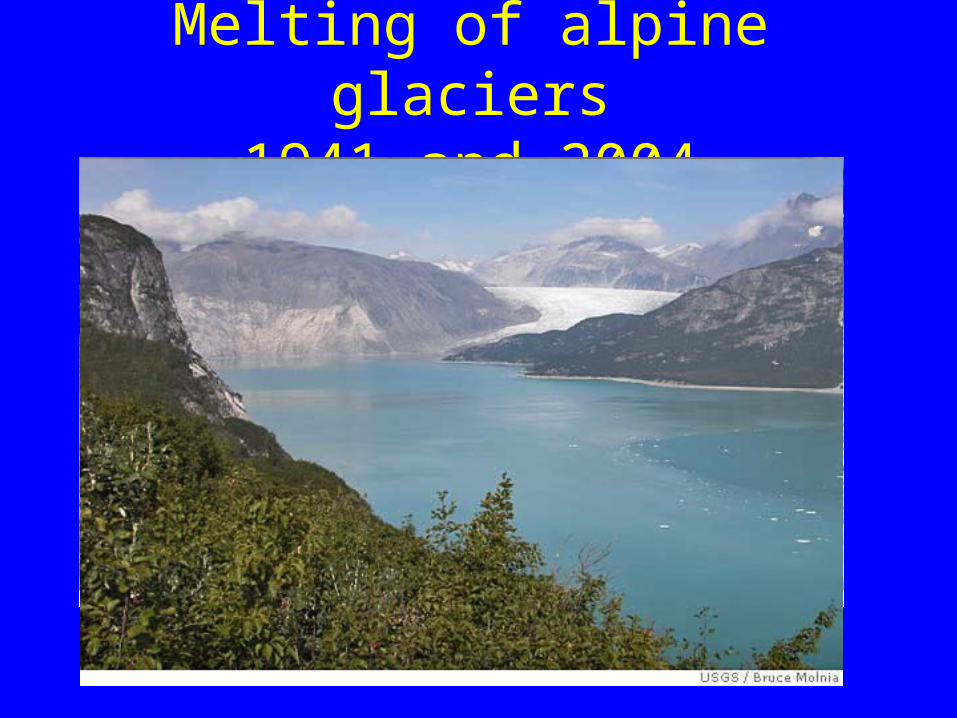
Melting of alpine glaciers1941 and 2004
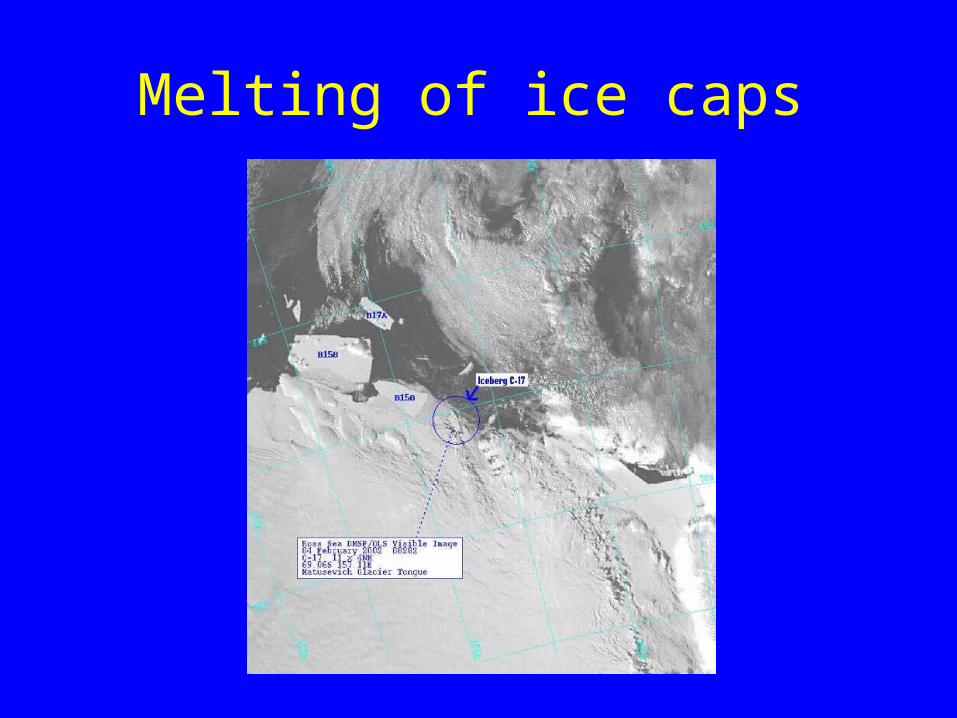
Melting of ice caps
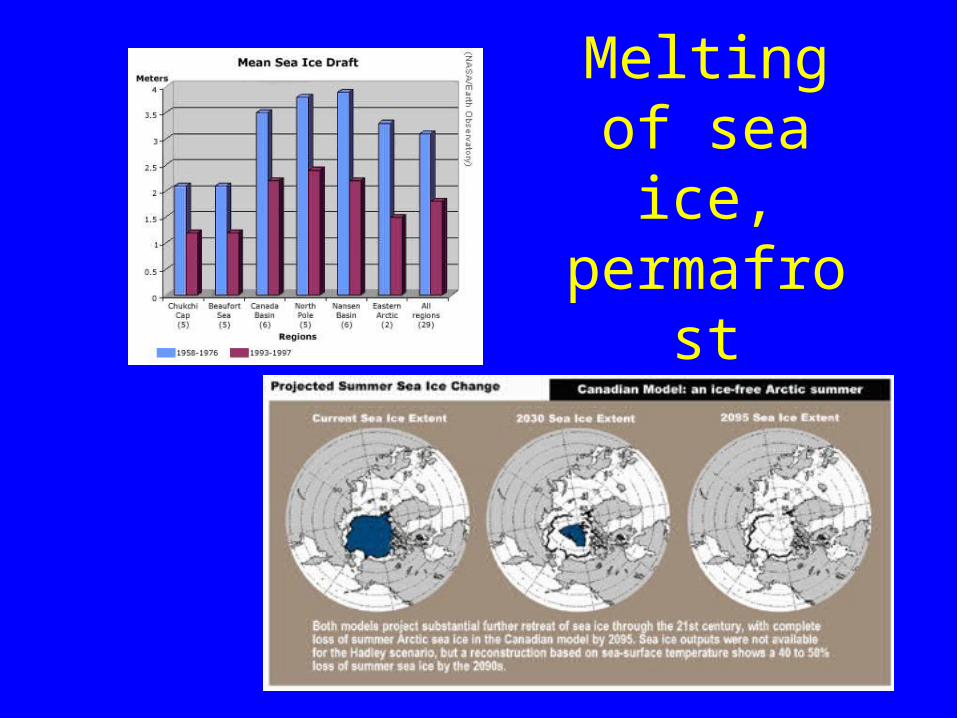
Melting of sea ice,
permafrost
Other impacts
• Tropical diseases, insects move north
• Loss of agricultural land
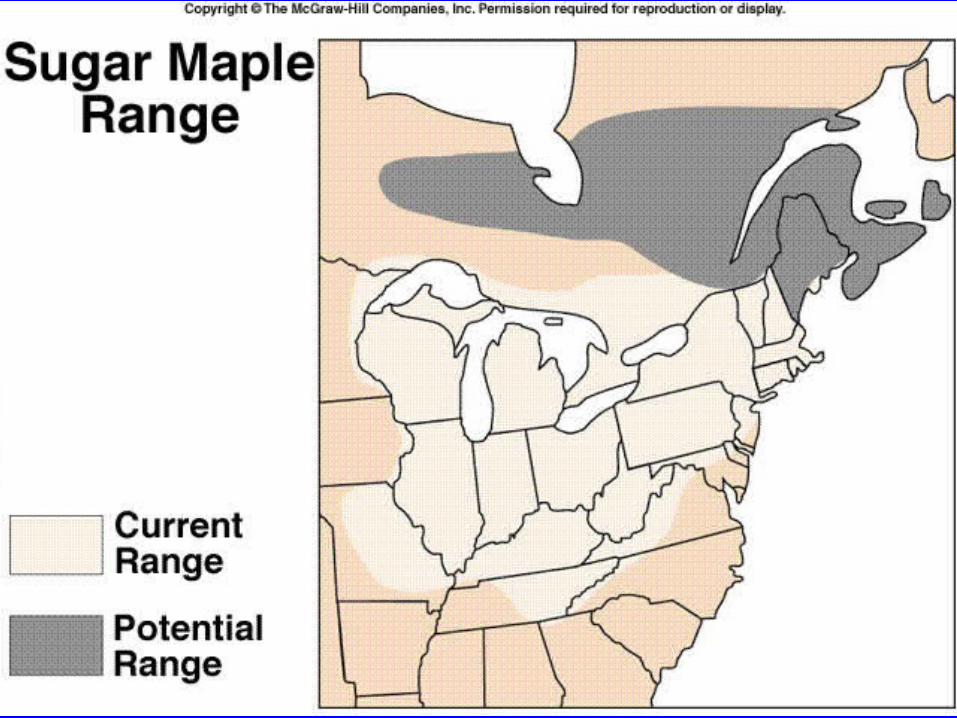
• End of ecosystems that cannot shift
Future goals?
• Reduce CO2 emissions, change economy
• World-wide shift to non-fossil energy
• Increased energy efficiency

29
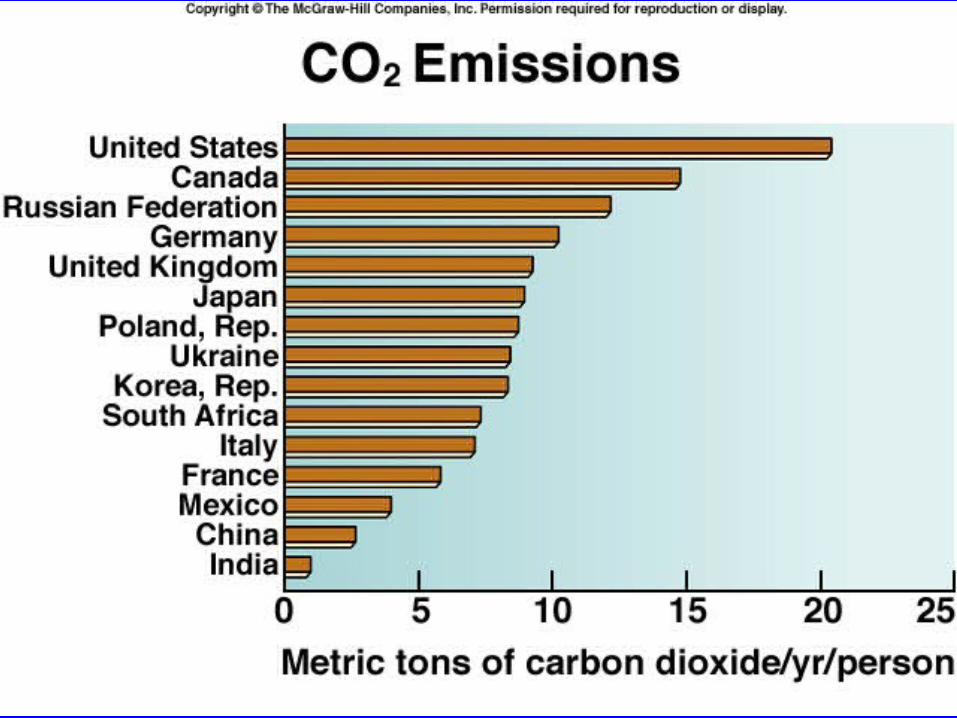
CO2 emissions per capita
1997 Kyoto Protocol
• Cut gases to under 1990 levels by 2012
• China, India exempted for present
• Europeans met most goals
• U.S. would have to cut energy use 40%;
Bush withdrew 2001
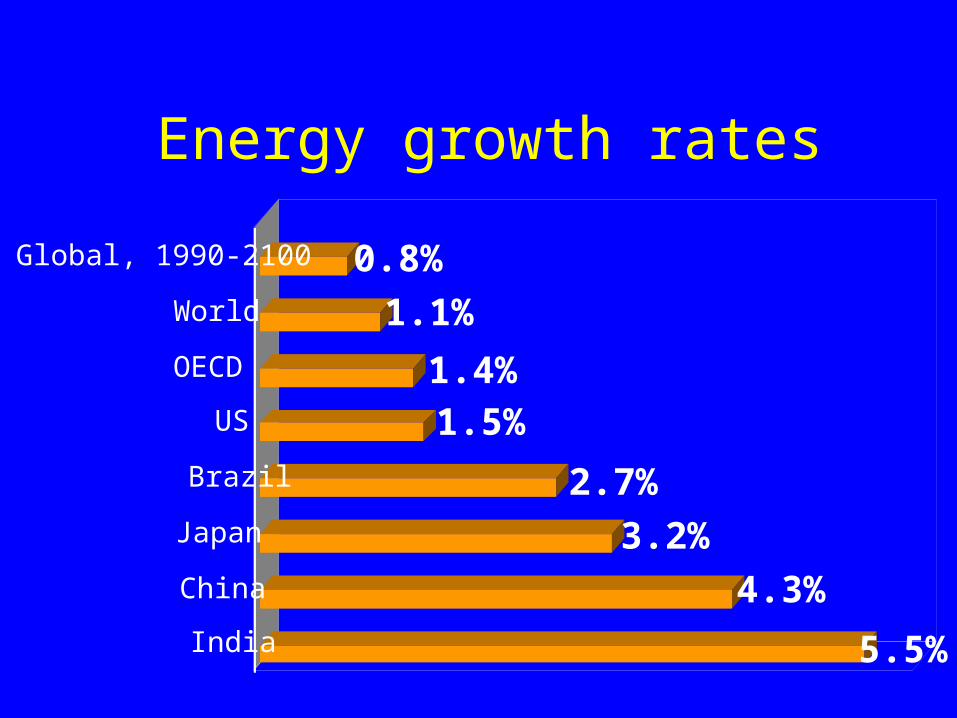
Energy growth rates
5.5%
4.3%
3.2%
2.7%
1.5%
1.4%
1.1%
0.8%
India
China
Japan
Brazil
US
OECD
World
Global, 1990-2100
Conservation• Homes
– insulation, less heat, efficient appliances
• Vehicles – Drive less, higher mpg
• Industry– Less waste, renewable and efficient energy
• Land use– More tress (carbon sinks), no sprawl
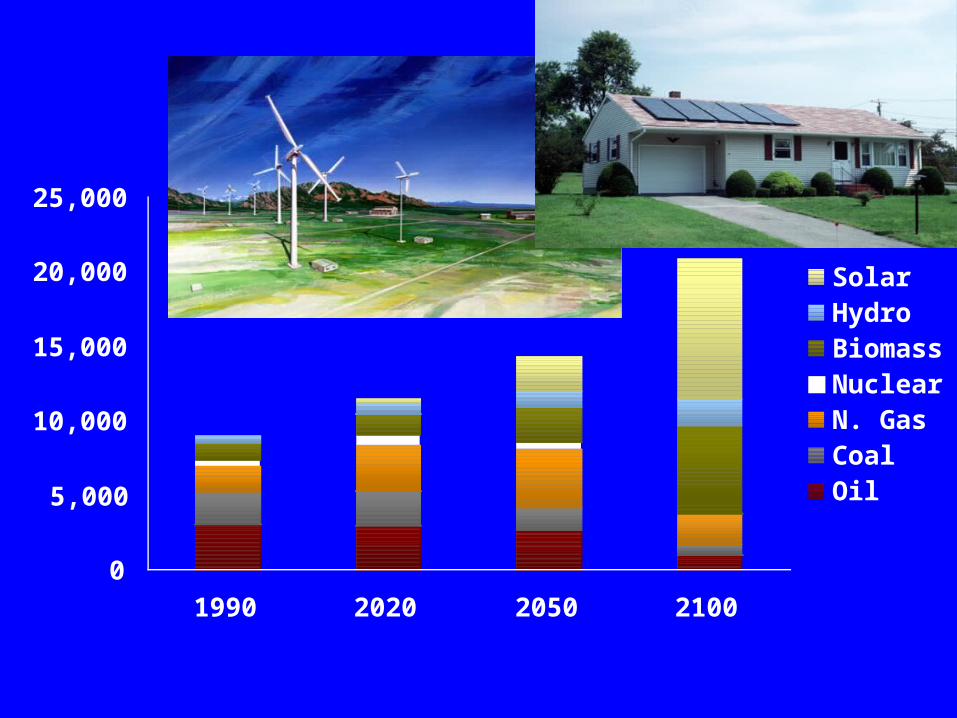
0
5,000
10,000
15,000
20,000
25,000
1990 2020 2050 2100
SolarHydroBiomassNuclearN. GasCoalOil
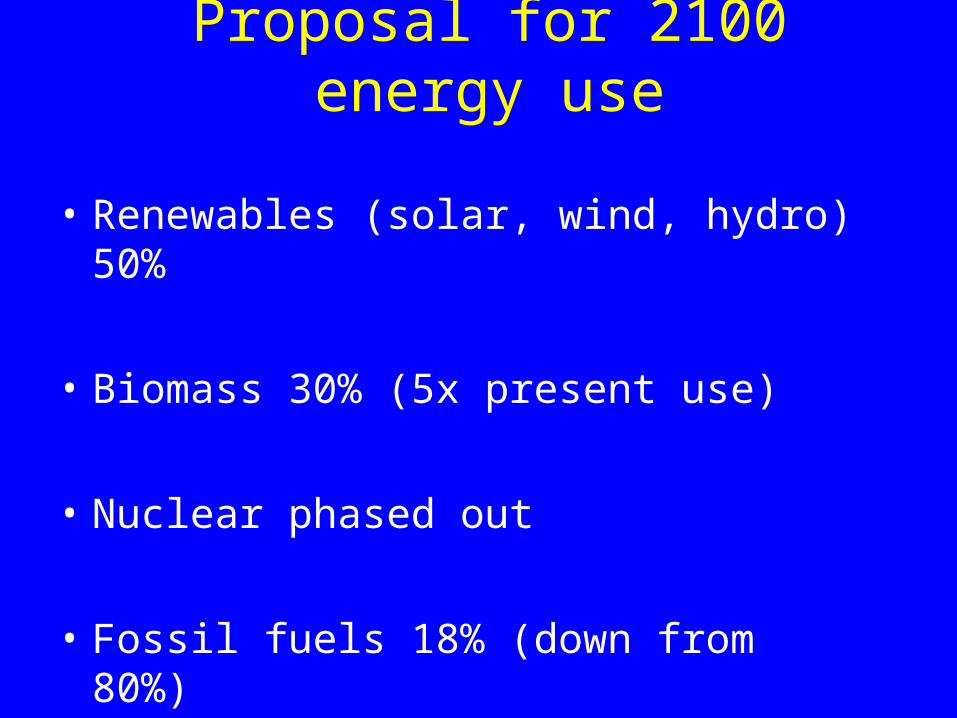
Proposal for 2100 energy use
• Renewables (solar, wind, hydro) 50%
• Biomass 30% (5x present use)
• Nuclear phased out
• Fossil fuels 18% (down from 80%)

Mtc
0
1,000
2,000
3,000
4,000
5,000
6,000
7,000
1980 2000 2020 2040 2060 2080 2100 2120
CO2 emissions (1990 -2100)
Year
Global energy websitesWorld Resources Institute
www.wri.org
World Energy Council
www.worldenergy.org/
World Energy Assessment
www.undp.org/seed/eap/activities/wea/
UN Development Program
www.undp.org/seed/eap/