the greek biofuel market: trends, prospects and challenges · 2020, following the trend of global...
TRANSCRIPT

___________________________________________________________________________________________
Πανεπιστήμιο Πειραιώς / Τμ. Διεθνών & Ευρωπαϊκών Σπουδών
Ευρωπαϊκή Έδρα Jean Monnet στο Δίκαιο & Πολιτικές ΕΕ
Ενεργειακά Τετράδια / Energy Papers
Διευθυντής Σειράς:
Νικόλαος Ε. Φαραντούρης, Καθηγητής της Ευρωπαϊκής Έδρας Jean Monnet, Πανεπιστήμιο Πειραιώς
Ανδρούτσου 150, 185 32 Πειραιεύς
T: +30 210 414 2394
http://www.des.unipi.gr/metaptichiako-stin-energia/
The Greek Biofuel Market: Trends, Prospects and challenges
Η Ελληνική Αγορά Βιοκαυσίμων: Τάσεις, Προοπτικές και Προκλήσεις
Μιχαήλ Ν. Φωτιάδης
Περίληψη
Οι παγκόσμιες ενεργειακές προκλήσεις, η ανάγκη για εξοικονόμηση πόρων, η πραγματοποιούμενη κλιματική αλλαγή και η αυξανόμενη στροφή στις ανανεώσιμες πηγές ενέργειας, υπενθυμίζουν και αναβαθμίζουν τον ρόλο των βιοκαυσίμων στο διεθνές και εγχώριο περιβάλλον. Η παρούσα μελέτη εξετάζει την ιστορική εξέλιξη και συμβολή των βιοκαυσίμων, αναλύει το νομικό/ρυθμιστικό πλαίσιο που τα διέπει, φωτίζει πτυχές των μηχανισμών της αγοράς τους, παρουσιάζει τις σύγχρονες τάσεις όσον αφορά την τεχνολογία, την τιμολόγηση και το marketing και μας εισάγει σε θέματα trading και διαχείρισης των κινδύνων τους. Η εργασία ξεκινά με παγκόσμιο πρίσμα και στη συνέχεια εστιάζει στην Ελληνική πραγματικότητα. Αφού αναλυθεί η εγχώρια αγορά μέσω βιβλιογραφικής έρευνας αλλά και έρευνας απευθυνόμενης σε βασικούς stakeholders της αγοράς, επιχειρείται για πρώτη φορά στην Ελλάδα, η εφαρμογή οικονομετρικού υποδείγματος πρόβλεψης της μελλοντικής ζήτησης για βιοντίζελ στην χώρα για τα επόμενα 5 και 15 χρόνια. Προκειμένου να προσδιοριστεί η πρόβλεψη, πραγματοποιείται εμπειρική/οικονομετρική ανάλυση της ζήτησης για πετρέλαιο κίνησης, η οποία βασίζεται στην εξέταση ιστορικών δεδομένων από το 1978 έως σήμερα - και άρα ενσωματώνει την άρση της απαγόρευσης κίνησης οχημάτων diesel σε Αθήνα και Θεσσαλονίκη του 2011 - και στόχος της είναι να μοντελοποιήσει την επίδραση των στατιστικά σημαντικών παραγόντων για την διαμόρφωσή της ζήτησης, δηλαδή τον στόλο οχημάτων, την τιμή των καυσίμων (συνεπώς και τους φόρους/επιβαρύνσεις που επιβάλλονται) και το ΑΕΠ. Το αποτέλεσμα της εμπειρικής μελέτης είναι η διαμόρφωση 3 εναλλακτικών σεναρίων, του βασικού, της υπό-απόδοσης και της υπέρ-απόδοσης της ελληνικής οικονομίας. Τέλος, εφαρμόζοντας 3 διαφορετικά πιθανά σενάρια πολιτικής επί των προηγούμενων σεναρίων, καταλήγουμε στην κατά το δυνατόν πληρέστερη επιστημονικά σκιαγράφηση της μελλοντικής αγοράς βιοκαυσίμων στην Ελλάδα σε βραχυπρόθεσμο και μακροπρόθεσμο ορίζοντα.

___________________________________________________________________________________________
Πανεπιστήμιο Πειραιώς / Τμ. Διεθνών & Ευρωπαϊκών Σπουδών
Ευρωπαϊκή Έδρα Jean Monnet στο Δίκαιο & Πολιτικές ΕΕ
Ενεργειακά Τετράδια / Energy Papers
__________________________________________________________________________________________
Chapter 1: Introduction & Global Outlook
1.1 Biofuels in general
The huge increase in oil and other fuel prices over the last few years and a concern
that we have reached (or will soon reach) peak oil – after which oil extraction begins to
decrease – have renewed the interest in alternative sources of energy. These include solar,
wind, ocean wave and tidal flow, geothermal, and biofuels which at their initial outbreak
were considered as the society’s liberator from liquid fossil fuels. However, long disputes
regarding the biofuel viability, enriched with high controversy about their actual
sustainability, positive and negative effects to the society and so on, have been challenging
their acceptance globally from time to time.
The idea behind biofuels is simple. Plants capture the energy of the sun and produce
substances – sugars, starch, oils, and cellulose - that can be harvested and then converted
into sources of energy for us to use. Growing plants to produce fuel is supposed to be more
ecologically sound because – in contrast to diesel oil and gasoline which add new carbon
dioxide to the atmosphere when burned – when biofuel energy is used, the carbon dioxide
that returns to the atmosphere is simply that which had recently been captured by plants
during their lifetime cycle.
First generation biofuels
The three main types of first generation biofuels used commercially are biodiesel (bio-
esters), ethanol, and biogas of which large quantities have been produced worldwide so
far and for which the production process is considered ‘established technology’. Biodiesel
is a substitute of diesel and is produced through transesterification of vegetable, residual
oils and fats, with minor engine modifications; it can serve as a full substitute as well.
Bioethanol is a substitute of gasoline and it is a full substitute for gasoline in so-called flexi-
fuel vehicles. It is derived from sugar or starch through fermentation. Bioethanol can also
serve as feedstock for ethyl tertiary butyl ether (ETBE) which blends more easily with
gasoline.
Second generation biofuels
Second generation biofuels are produced from biomass in a more sustainable fashion,
which is truly carbon neutral or even carbon negative in terms of its impact on CO2
concentrations. In the context of biofuel production, the term ‘plant biomass’ refers largely
to lignocellulosic material as this makes up the majority of the cheap and abundant
nonfood materials available from plants. At present, the production of such fuels is not
cost-effective because there are a number of technical barriers that need to be overcome

___________________________________________________________________________________________
Πανεπιστήμιο Πειραιώς / Τμ. Διεθνών & Ευρωπαϊκών Σπουδών
Ευρωπαϊκή Έδρα Jean Monnet στο Δίκαιο & Πολιτικές ΕΕ
Ενεργειακά Τετράδια / Energy Papers
__________________________________________________________________________________________
before their potential can be realized. Plant biomass represents one of the most abundant
and underutilized biological resources on the planet, and is seen as a promising source of
material for fuels and raw materials.
1.1.2 Contribution & Question
Over the last two decades, there has been a continuous long standing worldwide
debate over the biofuels’ positive and negative impacts. The main argument of the
advocates of biofuels’ positive contribution is the reduction of the emissions of gases
producing the greenhouse effect, particularly CO2 emissions. This is because organisms
(that biomass comes from) during their lives absorb CO2 equal to the amount emitted
when biomass (or biofuel produced from it) is burned. At the other side of the spectrum
those who are opposed to their usefulness and positive effects claim among other, that
the biofuels production in general, deprives land crops from food production, causing food
prices to increase and therefore endangers poor peoples’ food security. The latter
argument has been commonly addressed as the “Fuel vs. Food” debate
For almost every positive effect of biofuels, there lies a negative one too. According
to recent literature, most scholars seem to conclude that the issue of biofuels pros and
cons should be addressed both locally and globally and of course in the short and long term
1.2 Penetration & Prospects
1.2.1 View through renewables
Renewable sources of energy have been increasing their market share in the global
energy mix for more than 40 years. Renewable energy technologies became suddenly but
briefly fashionable 4 decades ago in response to the oil embargoes of the 1970s, but the
initially enthusiastic interest and support for their development was not sustained. In
recent years however, dramatic improvements in the performance and affordability of
solar cells, wind turbines and biofuels have paved the way for mass commercialization.
What is more, high and wildly fluctuating prices for oil and natural gas have made
renewable alternatives more appealing.
In 2013, new renewable power capacity expanded at its fastest pace to date, while
globally, renewable electricity generation was estimated on par with that from natural gas.
However, the renewables growth rate of former years is expected to level off through
2020, following the trend of global energy consumption in total, but will still be the highest
among all fuels over the forecast period until 2035, estimated at 6.4% per annum.

___________________________________________________________________________________________
Πανεπιστήμιο Πειραιώς / Τμ. Διεθνών & Ευρωπαϊκών Σπουδών
Ευρωπαϊκή Έδρα Jean Monnet στο Δίκαιο & Πολιτικές ΕΕ
Ενεργειακά Τετράδια / Energy Papers
__________________________________________________________________________________________
Figure 4. Projection of consumption by fuel
Source: BP (2014), Energy outlook booklet 2035, p.12, BP, London, UK
The above growth rate of the renewables (always including biofuels) enables them to
increase their share from approximately 2% in 2014 to 7% by 2035, overtaking the share
of nuclear energy by 2025 and matching at the end the one of hydro energy, according to
the BP Outlook 2035 (2014).
1.2.2 In line with transportation
Since the transportation sector is by far the most important sector for the use of
biofuels (due to their special properties of mixing with liquid fuels, as aforementioned in
1.1), its prospects are at least causal and at most crucial for the future of biofuels.
The rising prosperity around the world is expected to increase the fuel demand for
transportation fuels. An expanding middle class, developing primarily in the non-OECD
countries, will be buying vehicles for the first time and the growing commercial activity all
over the globe will be in need of more liquid fuels too. According to the Exxon Mobil

___________________________________________________________________________________________
Πανεπιστήμιο Πειραιώς / Τμ. Διεθνών & Ευρωπαϊκών Σπουδών
Ευρωπαϊκή Έδρα Jean Monnet στο Δίκαιο & Πολιτικές ΕΕ
Ενεργειακά Τετράδια / Energy Papers
__________________________________________________________________________________________
Outlook 2040 (2015), the global energy demand for transportation is expected to rise by
40 percent from 2010 to 2040 from approximately 45 MBDOE to 63 MBDOE (MBDOE
stands for Million Barrels per Day of Oil Equivalent), while the global GDP is expected to
rise by 140 percent during the same period.
On the other hand, the “rampaging” energy efficiency in vehicles mainly – BP Outlook
2035 (2014) estimates the fuel economy of vehicle fleet to improve by 2% per annum until
2035 – and the switching trend from traditional fuels such as Diesel (especially for the
heavy-duty transportation sector) to compressed natural gas (CNG) and liquefied natural
gas (LNG), will curb global liquids (petroleum products and biofuels) demand growth.
According to Exxon Mobil Outlook 2040 (2015), the energy efficiency will save
approximately about 35 MBDOE and the energy switch will account for about another 5
MBDOE. So, if the above reversing factors were to be set aside, the global demand for
liquid fuels of the transportation sector would more or less double by 2040, as illustrated
in the following figure.
Figure 7. Transportation liquid fuels demand
Source: Exxon Mobil (2015), The outlook for energy: A view to 2040, p. 23, Exxon Mobil Corporation, Texas, USA
___________________________________________________________________________________________
Πανεπιστήμιο Πειραιώς / Τμ. Διεθνών & Ευρωπαϊκών Σπουδών
Ευρωπαϊκή Έδρα Jean Monnet στο Δίκαιο & Πολιτικές ΕΕ
Ενεργειακά Τετράδια / Energy Papers
__________________________________________________________________________________________
1.2.3 Biofuels global perspective
After a period of rapid growth, biofuel production and consumption in the United
States, the European Union and Brazil appear to be shifting gears. In the United States, the
main center of ethanol productions and consumption globally, the design shortcomings of
previous biofuel mandates have become manifest, leading to policy reviews that have
introduced uncertainty in the market. In the BRICS (Brazil, Russia, India, China, South
Africa) and particularly in Brazil, the second largest producer and consumer, the ethanol
industry’s economic situation is worsening, partly due to inflation-targeted gasoline price
regulations that undermine ethanol economics. Brazil has been a pioneer in the production
of biofuels, with a share of 20% in 1990. This share declined to a minimum of 12.5% in
2001 and stood at 22.8% in 2009. In the European Union, ongoing controversy about the
sustainability of biofuels has led to a proposed cap on conventional biofuel use that is
leaving the industry in limbo until a final decision on the proposal is taken. At the same
time, policy support is burgeoning in non-OECD countries, notably oil-importing
economies in Southeast Asia and Africa that subsidize fuel consumption, where rising
domestic biofuel production promises a valuable option to lowering fuel import bills.
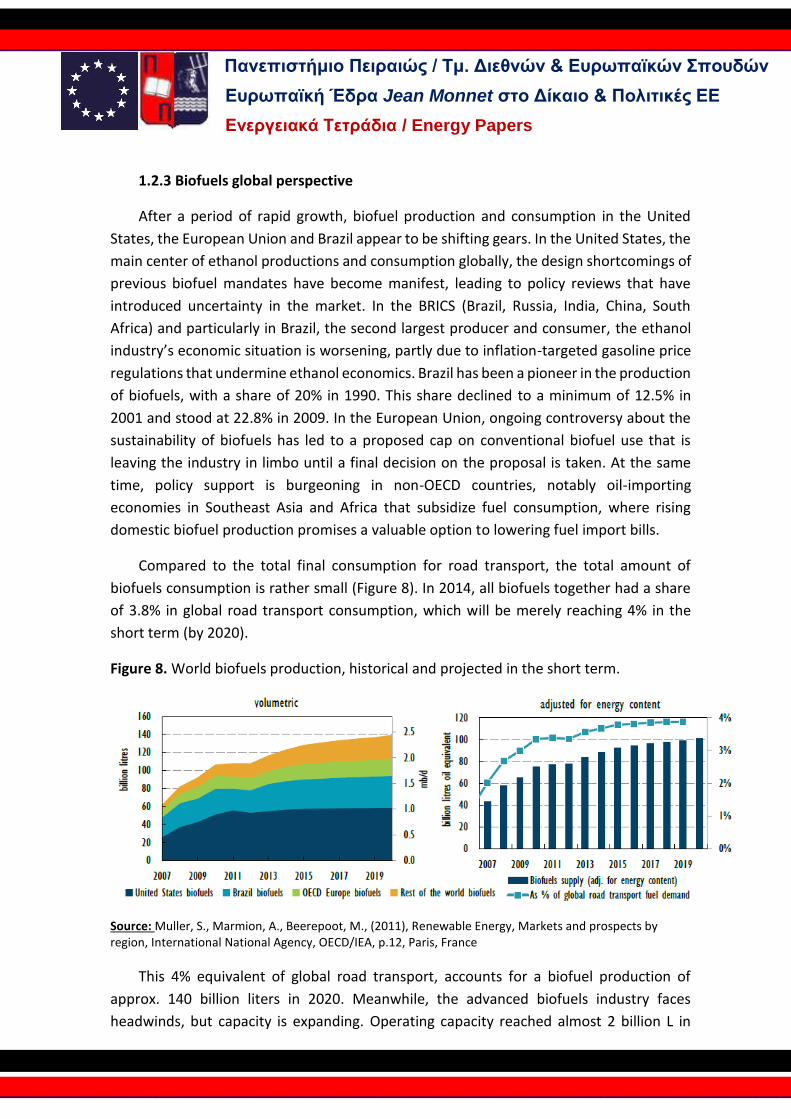
Compared to the total final consumption for road transport, the total amount of
biofuels consumption is rather small (Figure 8). In 2014, all biofuels together had a share
of 3.8% in global road transport consumption, which will be merely reaching 4% in the
short term (by 2020).
Figure 8. World biofuels production, historical and projected in the short term.
Source: Muller, S., Marmion, A., Beerepoot, M., (2011), Renewable Energy, Markets and prospects by region, International National Agency, OECD/IEA, p.12, Paris, France
This 4% equivalent of global road transport, accounts for a biofuel production of
approx. 140 billion liters in 2020. Meanwhile, the advanced biofuels industry faces
headwinds, but capacity is expanding. Operating capacity reached almost 2 billion L in

___________________________________________________________________________________________
Πανεπιστήμιο Πειραιώς / Τμ. Διεθνών & Ευρωπαϊκών Σπουδών
Ευρωπαϊκή Έδρα Jean Monnet στο Δίκαιο & Πολιτικές ΕΕ
Ενεργειακά Τετράδια / Energy Papers
__________________________________________________________________________________________
2013, and could reach 4 billion L in 2020, if projects under development now in the pipeline
continue as planned. Yet a number of companies have cancelled or postponed projects as
they struggle to secure investments in light of an increasingly uncertain policy framework
in the two key markets, the European Union and the United States. Developments in
advanced biofuels also continue to remain limited to these two regions.
Currently, the world biofuels supply is dominated by bioethanol, assuming a share of
about 80% in 2010, which is estimated to decline to 71% by 2030. While the other
dominant biofuels type, biodiesel, currently holding a 20% share is expected to lose
approximately 40%, being substituted (bioethanol as well by approx. 10%) by biomass to
liquids or BTL.
Figure 9. World biofuels supply by type
Source: Alfstad, T.,(2008), World Biofuels Study, Scenario analysis of global biofuels markets, p.viii, Brookhaven National Laboratory, prepared for U.S. Department of Energy, Upton NY, USA
1.3 Policies and Regulatory Frameworks
Several developed and developing countries have established regulatory frameworks
for biofuels, often including blending mandates of biofuels with fossil fuels. Countries have

___________________________________________________________________________________________
Πανεπιστήμιο Πειραιώς / Τμ. Διεθνών & Ευρωπαϊκών Σπουδών
Ευρωπαϊκή Έδρα Jean Monnet στο Δίκαιο & Πολιτικές ΕΕ
Ενεργειακά Τετράδια / Energy Papers
__________________________________________________________________________________________
also provided different kinds of subsidies and incentives to support biofuel industries such
as blending regulations, tax incentives, government purchasing policies and other
measures. This various policy mix globally has indisputably contributed to the
development of infrastructure and technologies, successfully increasing the biofuels
production on a worldwide scale. These developments have created a large international
biofuel market, which amounted to 22.5 billion liters of biodiesel and 83.1 billion liters of
bioethanol by 2012.
1.3.5 Greece
The European Directive (Directive 2003/30/EC) was adopted by amending and
supplementing Law 3054/2002 (Organization of the oil market and miscellaneous
provisions) with Law 3423/2005 (Introduction of biofuels and other renewable fuels in the
Greek market). In 2012, the latest European Directives concerning biofuels, 2009/28/EC
and 2009/30/EC, were adopted in Law 4062/2012 in section C and chapters A (Promotion
of energy use from renewable sources – integration of European Directive 2009/28/EC)
and B (Sustainability criteria of biofuels and bioliquids - integration of European Directive
2009/30/EC), as published on 30 March 3012.
Biodiesel
Blending of biodiesel
The actual blending of biodiesel with diesel began at the end of 2005 at a rate of 2.5%.
Within five years it was progressively increased at 5.75 and from 2013 until now it is
regulated at 7%. However, Fuel Retailers are allowed to offer automotive diesel with even
higher than 7% biodiesel blend, provided that there is a respectively special labelling at the
selling points (although this option has not been utilized yet).
Initially and until the end of December 2007, in order to promote the consumption of
biodiesel, a tax exemption from automotive diesel’s excise duty for the amount of
biodiesel in the final blend was in force. After the tax exemption termination, the quota of
biodiesel blended with diesel bears the same excise duty with diesel (the excise duty was
293 €/1000 Liters in 2008 and is now set at 330 €/1000 Liters).
Biodiesel Allocation Program
Biodiesel Call

___________________________________________________________________________________________
Πανεπιστήμιο Πειραιώς / Τμ. Διεθνών & Ευρωπαϊκών Σπουδών
Ευρωπαϊκή Έδρα Jean Monnet στο Δίκαιο & Πολιτικές ΕΕ
Ενεργειακά Τετράδια / Energy Papers
__________________________________________________________________________________________
According to Law 3054/2002 and its amendments, it is mandatory for the producers
and distributors of petrol and diesel to blend their fuels with a certain amount, "quota" of
biofuels which is specified in the distribution scheme, reviewed every year (art. 15A par. 3
Law No. 3054/2002 which was incorporated in Law 3054/2002 amended by the art. 3 of
Law 3423/2005, the art. 55 of Law 3653/2008 and art. 22 of Law 3769/2002). Every year,
before the 15th of April, a Ministerial Decision by the Ministry of Environment and Energy
is issued that determines the total quantity of biodiesel to be allocated to beneficiaries for
the coming year (from July 1st of current year to June 31st of coming year) and calls any
candidate beneficiaries to submit their will to participate in the allocation program.
Table 5. Yearly Biodiesel allocation quantity and blending rate with automotive diesel
YEAR BIODIESEL QUANTITY (L) BLENDING RATE (%)
2005 2.500 2,00
2006 91.000 3,00
2007 114.000 4,00
2008 123.000 4,50
2009 154.750 5,00
2010 164.000 5,75
2011 132.000 6,50
2012 132.000 6,50
2013 92.000 7,00
2014 133.000 7,00
2015 140.000 7,00
2016 132.000 7,00
Source: Data retrieved from Ministry of Environment and Energy (www.ypeka.gr) and Foundation
for economic & industrial research (2010), The sector of renewable fuels in Greece: issues and
prospects, p.16, Athens, Greece
Following the determination of the total allocation quantity, the process of the
beneficiaries’ qualification and allocation per beneficiary begins, led by a joint ministerial
committee assembled by three members one from each ministry (Ministry of Finance,
Ministry of Rural Development and Food, Ministry of Development).
Bioethanol
The bioethanol in Greece is overall in an extremely primitive stage. Despite the fact
that the European legislation, which is transposed in Greek legislation, is not limited only
to biodiesel when referring to biofuels, no specific policies promoting the production or
use of bioethanol in Greece have been in effect. In fact, until nowadays, not even one litre
___________________________________________________________________________________________
Πανεπιστήμιο Πειραιώς / Τμ. Διεθνών & Ευρωπαϊκών Σπουδών
Ευρωπαϊκή Έδρα Jean Monnet στο Δίκαιο & Πολιτικές ΕΕ
Ενεργειακά Τετράδια / Energy Papers
__________________________________________________________________________________________
of bioethanol has been produced in the Greek territory and no related investments are
known to be undergoing.
Only recently, in August 2013, technical regulation (D3/Α΄/oik.15225) regarding the
storage and distribution of biofuels was published prescribing the proper way to store,
blend and distribute apart from biodiesel, bioethanol as well. It is worth noting that due
to the fact that the bioethanol is very sensitive to any presence of water, whose incidence
is frequent in the supply chain of fuels, it is recommended by the regulation to blend
bioethanol with gasoline at terminal and depots or refinery truck filling stations, so as to
be as close as possible, in terms of storage time, to the retail fuel stations. Furthermore,
the regulation suggests that the blending process should take place in specially insulated
storage tanks (not in tanks with external floating cover, as most gasoline storage tanks in
Greece have), or in the tank trucks during loading at the filling station of the depot or
refinery.
Chapter 2: Market Analysis
2.1 Biofuels market analysis in general
The first decade of the 21st century was by far the golden era of biofuels, as their
production and consumption soared all over the world. From 2000 until 2010, the world’s
production increased more than 500%.
Figure 10. World Ethanol and Biodiesel Production, 1975 - 2012

___________________________________________________________________________________________
Πανεπιστήμιο Πειραιώς / Τμ. Διεθνών & Ευρωπαϊκών Σπουδών
Ευρωπαϊκή Έδρα Jean Monnet στο Δίκαιο & Πολιτικές ΕΕ
Ενεργειακά Τετράδια / Energy Papers
__________________________________________________________________________________________
Source: Worldwatch Institute (2014), F.O. Licht, RENZI
The combination of high fuel prices, the allure for a greener future and the generous
regulatory support had been driving investments in the biofuels industry at a very high
speed.
However, this dynamic is not currently maintained. In 2012, the combined global
production of ethanol and biodiesel fell for the first time since 2000, down 0.4 percent
from the figure in 2011. As McKinsey’s principals Bill Caesar, Jens Riese and Thomas Seitz
noted already in 2007, while billions were pouring into biofuels, the biofuels business was
starting getting surrounded by increased uncertainty. According to their analysis, the
variables that directly influence the profitability and environmental impact of biofuels are
the fuel prices, the cost and availability of feedstock, the government regulation and the
conversion technologies and are all significantly interrelated. Obviously, the way that the
above factors will be developing depending on each other will determine the result of an
investment in biofuels nowadays.
McKinsey’s analysis goes beyond and introduces imponderables into a supply and
demand model trying to predict the potentials of the biofuel industry. This model is
partially exhibited in the following figure, where the curve of the biofuels potential share
in total transportation fuels and the crude oil price are evolving together. The higher the
price of crude oil, the greater the penetration of biofuels in the transportation sector, until
a certain level naturally, when the availability of feedstock will be constraining any further
growth.

___________________________________________________________________________________________
Πανεπιστήμιο Πειραιώς / Τμ. Διεθνών & Ευρωπαϊκών Σπουδών
Ευρωπαϊκή Έδρα Jean Monnet στο Δίκαιο & Πολιτικές ΕΕ
Ενεργειακά Τετράδια / Energy Papers
__________________________________________________________________________________________
Figure 11. Impact of crude oil prices on economic-replacement potential of biofuels
Source: Caesar, B. et al, (2007), Betting on biofuels, The McKinsey Quarterly, p.59, McKinsey &
Company, New York, USA
2.1.1 Marketing
From the very early years of biofuels development, the idea that the government
policies ought to lead the penetration of biofuels in transportation fuels has been
prevailing. Blending mandates, tax exemptions, subsidies and direct/indirect financing of
different sort were thought, at least initially, to be the most appropriate measures to
encourage the biofuels sector growth worldwide. However, now that biofuels markets are
showing signs of maturity, such regulatory intervention is not considered sustainable in
the long run.
The work of M. E. Edeseyi et al suggests that the future of biofuels cannot be heavily reliant
on government policies. Of course, tax exemption policies directly rewarding the biofuel-
consuming public could be efficient. Yet, the authors innovate by proposing that the
biofuels should be marketed as any other product and the industry should design and apply
strategies customized on the specific market environment. Sustainability, being the
zeitgeist of our times, can be accredited to biofuels with great success, as they are
renewable, cleaner, considered to harm the environment much less than fossil fuels and
overall quite satisfactory in terms of transportation efficiency. Therefore, some consumers
would even pay a premium for them, without the driving force of state regulations.
According to the authors, in order to revitalize the market of biofuels and explore better
their potential, the biofuel products have to be reassessed using the 4 P’s, product
classification, pricing, place and promotion marketing methodology.

___________________________________________________________________________________________
Πανεπιστήμιο Πειραιώς / Τμ. Διεθνών & Ευρωπαϊκών Σπουδών
Ευρωπαϊκή Έδρα Jean Monnet στο Δίκαιο & Πολιτικές ΕΕ
Ενεργειακά Τετράδια / Energy Papers
__________________________________________________________________________________________
It is worth noting here that apart from the traditional road transportation sector which
almost engrosses the production of biofuels worldwide, significant opportunities are
beginning to emerge having to do with the aviation and marine sector.
Aviation Sector
In July 2011, the world widely accepted U.S.-based technical-standards group, ASTM
International, granted airlines the final approval to power their jets with a blend made
from traditional kerosene and biofuels derived from inedible plants and organic waste,
revising and publishing the standard ASTM D7566 (Standard Specification for Aviation
Turbine Fuel Containing Synthesized Hydrocarbons). In short, the conventional jet fuel can
contain up to 50 percent bioderived synthetic blending components. Considering that
global aviation accounted in 2009 for the 10% of global energy in the transport sector, the
aviation perspective of biofuels appears to be colossal.
Figure 13. 2009 Global Transport Energy Distribution
Source: EBTP (2015), Biofuels for Air Transport: Biofuels in Aviation - An Overview, European
Biofuels Technology Platform, http://biofuelstp.eu/aviation-biofuels.html, EU

___________________________________________________________________________________________
Πανεπιστήμιο Πειραιώς / Τμ. Διεθνών & Ευρωπαϊκών Σπουδών
Ευρωπαϊκή Έδρα Jean Monnet στο Δίκαιο & Πολιτικές ΕΕ
Ενεργειακά Τετράδια / Energy Papers
__________________________________________________________________________________________
Airline carriers being major energy consumers are at the same time major greenhouse
gases emitters. The advanced liquid biofuels are their only low-CO2 alternative for
substituting the conventional jet fuel, as they can offer the high specific energy content
indispensable for aviation use. Electrification is not an option for air transportation due to
its energy content, nor are the first generation biofuels, due to their gaseous emissions. In
the EU there are currently several initiatives aiming to promote the use of aviation biofuels
such as the European Advanced Biofuels Flight path and the FlightPath 2050: Europe's
Vision for Aviation.82
Marine Sector
Another potential major customer of biofuels in the near future is shipping. Similarly with
the aviation sector, marine fuels account for 10% of global transportation energy as well.
82 Having less stringent standards for fuel quality and safety than aircrafts, ships could
possibly substitute their conventional fuels (Marine Gas Oil or Marine Fuel Oil) even more
easily. Although marine transport is one of the least energy intensive way of transporting
goods, however, it is also one of the sectors with the fewest available alternatives to fossil
fuels. In order to tackle global warming, all industrial sectors should take measures to cut
emissions and biofuels can help achieve this in the marine transport sector.
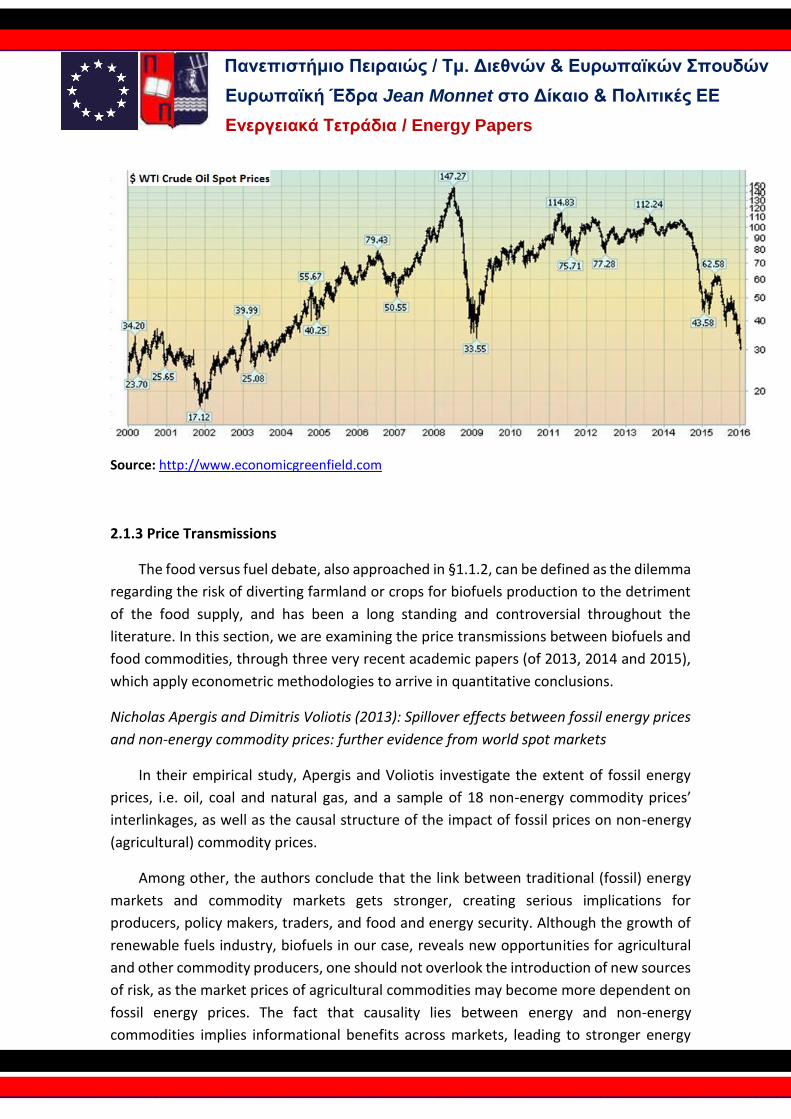
2.1.2 Pricing
In general, most enterprises and countries intend to hold the end price (“price at the
pump”) of biofuels at or near the price of petroleum fuels. Interestingly, maintaining costs
before 2005, when crude oil was traded below 50 USD per barrel, was not possible. From
2005 until 2014, when the price of fossil fuels rose dramatically, biofuels became attractive
and blossomed worldwide. But even during that period, government subsidy was often
necessary to make biofuels fully competitive. From October 2014 until nowadays, the
falling fossil fuel prices challenge again the competitiveness of alternative fuels and
probably maintain the call for state support actions.
Figure 14. West Texas Intermediate Crude oil spot prices in US Dollars per barrel from 2000
until 2015 Jan 2016
___________________________________________________________________________________________
Πανεπιστήμιο Πειραιώς / Τμ. Διεθνών & Ευρωπαϊκών Σπουδών
Ευρωπαϊκή Έδρα Jean Monnet στο Δίκαιο & Πολιτικές ΕΕ
Ενεργειακά Τετράδια / Energy Papers
__________________________________________________________________________________________
Source: http://www.economicgreenfield.com
2.1.3 Price Transmissions
The food versus fuel debate, also approached in §1.1.2, can be defined as the dilemma
regarding the risk of diverting farmland or crops for biofuels production to the detriment
of the food supply, and has been a long standing and controversial throughout the
literature. In this section, we are examining the price transmissions between biofuels and
food commodities, through three very recent academic papers (of 2013, 2014 and 2015),
which apply econometric methodologies to arrive in quantitative conclusions.
Nicholas Apergis and Dimitris Voliotis (2013): Spillover effects between fossil energy prices
and non-energy commodity prices: further evidence from world spot markets
In their empirical study, Apergis and Voliotis investigate the extent of fossil energy
prices, i.e. oil, coal and natural gas, and a sample of 18 non-energy commodity prices’
interlinkages, as well as the causal structure of the impact of fossil prices on non-energy
(agricultural) commodity prices.
Among other, the authors conclude that the link between traditional (fossil) energy
markets and commodity markets gets stronger, creating serious implications for
producers, policy makers, traders, and food and energy security. Although the growth of
renewable fuels industry, biofuels in our case, reveals new opportunities for agricultural
and other commodity producers, one should not overlook the introduction of new sources
of risk, as the market prices of agricultural commodities may become more dependent on
fossil energy prices. The fact that causality lies between energy and non-energy
commodities implies informational benefits across markets, leading to stronger energy

___________________________________________________________________________________________
Πανεπιστήμιο Πειραιώς / Τμ. Διεθνών & Ευρωπαϊκών Σπουδών
Ευρωπαϊκή Έδρα Jean Monnet στο Δίκαιο & Πολιτικές ΕΕ
Ενεργειακά Τετράδια / Energy Papers
__________________________________________________________________________________________
and crop portfolio diversification, better forecasting ability, and, potentially, to higher
profits.
Bernardina Algieri (2014): The influence of biofuels, economic and financial factors on daily
returns of commodity futures prices
In her study, B. Algieri examines the impact of biofuels on corn, rapeseed, soybean,
soybean oil, sugar and wheat futures returns, using GARCH (Generalized Autoregressive
Conditional Heteroskedasticity) family models and controlling for financial and economic
factors, such as the Standard & Poor's 500, crude oil, the U.S. dollar/euro exchange rate,
and monetary liquidity variables such as the Outstanding Open Market Operation by the
ECB (European Central Bank) and the Lending Rate by the FED (Central Banking System of
the United States).
Summarizing the results of this study, first of all, energy policies such as mandates,
targets and subsidies that support production of biofuels should be carefully monitored,
and some biofuel programs should be redesigned in order to avoid or reduce the fuel
versus food conflict. Secondly, there is a shift in focus from first-generation to second-
generation or advanced biofuel technologies. In any case, multiple and complex
interactions between factors are existent and so are drivers which influence each other
through various linkages and feedback loops. Conclusively, the spillover effects between
energy prices and corn, wheat, sugar and soybeans, which are the main feedstock of first
generation biofuels, indicate that biofuel policies should be closely monitored and
probably altered in order to save resources from unnecessary first generation biofuels
subsidization.
Constantinos Katrakilidis, Moise Sidiropoulos, Nikolaos Tabakis (2015): An empirical
investigation of the price linkages between oil, biofuels and selected agricultural
commodities
Their work aims to move the relevant research one step further by investigating
simultaneously three different groups of variables for more robust results. In line with the
previous papers, their results also provide evidence of cointegration between crude oil and
agricultural commodities. Long run causality from crude oil to corn and sugar has been
identified, as well as long run causality running from corn to ethanol. There is also evidence
of long run causality from crude oil to ethanol. As regards to the short run dynamics, short
run causality between crude oil and agricultural commodities, from crude oil to corn, sugar
and food price index has been found. Furthermore, the results show short run causality
from the general food price index to biodiesel and from crude oil to biodiesel. Concluding,
the high dependence of agricultural commodities with fossil fuels is evident, implying that
the threat of sudden and unanticipated rises in oil prices, which will consequently lead to

___________________________________________________________________________________________
Πανεπιστήμιο Πειραιώς / Τμ. Διεθνών & Ευρωπαϊκών Σπουδών
Ευρωπαϊκή Έδρα Jean Monnet στο Δίκαιο & Πολιτικές ΕΕ
Ενεργειακά Τετράδια / Energy Papers
__________________________________________________________________________________________
rises in food prices, cannot be avoided, unless we substitute part of our oil based energy
needs with alternative fuels.
2.1.4 Trading and Risk Management
One of biofuels’ particularities – especially of liquid biofuels - is that they bridge the
agricultural commodity markets (dry) with the oil/petroleum markets (wet). Biofuels act
as an intermediate, retrieving their feedstock from the agricultural world and providing
products to be blended with the fossil fuels. Nowadays, large corporations - traditionally
trading agricultural commodities - have entered the biofuels business and so have done
some of the world’s top oil trading companies.
Due to the fact that the biofuels trading history is rather short, counting more or less
approximately 20 years, their trading compared with other commodities lacks contract
standardization and liquidity, which results in absence of commoditization. In this
direction, the world’s two most significant information providers for the commodities and
energy markets, Platts and Argus Media are providing daily price assessments on various
products of biofuels on a global level. Platts reports on ethanol, biodiesel, MTBE (Methyl
tertiary butyl ether — an octane booster and oxygenate used for gasoline blending, ETBE
(Ethyl tertiary butyl ether - an oxygenate gasoline additive in the production of gasoline
from crude oil), RINs and feedstocks such as wheat, corn, sugar (including the respective
freight assessments). Similarly, Argus Media reports on Biodiesel physical and paper
markets, Ethanol and feedstocks such as rapeseed oil, Asian palm oil and Argentinian
soybean oil, including freight assessments as well.
Thereafter, it is clear that various financial products now exist ranging from the areas of
feedstock (agricultural), biofuels to of course oil/petroleum, equipping investors,
producers, traders and other stakeholders with tools to hedge their positions throughout
the supply chain and thus limit their exposure to price fluctuations. Furthermore, there is
concrete evidence that price correlations between agricultural, biofuel and oil products do
exist, as mentioned in the previous paragraph. Consequently, the value of these financial
hedging tools will be increasing, likewise with the majority of financial products, as the
liquidity of the commodity markets increases too.
2.2 The Greek case
2.2.1. Market basics and scope
The term of liquid biofuels in Greece is practically identical to the one of biodiesel. The
reason is that as mentioned in $ 1.3.5, there is no bioethanol production locally nor any
bioethanol imports have been performed. Despite the fact that the European legislation
and regulatory framework regarding bioethanol are present, it seems that no targeted

___________________________________________________________________________________________
Πανεπιστήμιο Πειραιώς / Τμ. Διεθνών & Ευρωπαϊκών Σπουδών
Ευρωπαϊκή Έδρα Jean Monnet στο Δίκαιο & Πολιτικές ΕΕ
Ενεργειακά Τετράδια / Energy Papers
__________________________________________________________________________________________
policies aiming to promote the production, import and consumption of bioethanol have
taken place. We will endeavor to investigate the real causes underlying this critical
discrepancy compared with other European countries in the sections to come.
2.2.3 The Micro-Environment analysis
SWOT framework: Analysis of the strengths, weaknesses, opportunities and threats of the
Greek biofuels industry
Strengths
1. Development of agricultural economy and rural areas. The cultivation of energy crops is
already a strong driver for the agricultural economy.
2. In addition to the generation of direct employment in the agricultural world, biofuels have
a positive effect creating direct and indirect jobs throughout the supply chain from the
farmland to the fuel retail station.
3. A traditional stronghold of biofuel supporters globally is the claim that biofuels help
reducing the emission of greenhouse gases, due to the fact mainly that through the growth
of the feedstock they sequester carbon dioxide (since CO2 is absorbed by the plants during
photosynthesis).
4. The reinforcement of energy security via the diversification of energy resources,
independent from fossil fuels is one of biofuel key dimensions.
Weaknesses
1. As highlighted before ($1.3.5 and $2.2.1) biofuels in Greece are limited to biodiesel. No
bioethanol infrastructure exists whereas to build such, would require extensive capital
investment and significant time. According to various references from projects globally,
the cost would be some tens of million euros and five years for completion seem certain.
For example, the average-sized ethanol plant in USA in 2005 cost approximately 65 million
US dollars.
2. The biodiesel cost in Greece for the end consumer is significantly high compared to the
cost of the conventional diesel.
3. The energy crops mix of Greece includes only three different kinds and is dominated by
one, the sunflower.
Figure 15. Energy Crops Mix in Greece in 2013 and Environmentally compatible mix for
energy crops for 2020 by EEA
Rapeseed5%
Sunflower1%
Sugarbeet0%
Cereals26%
Perennial grasses
Short rotation
trees17%
Environmentallycompatible mix in EU for 2020
Rapeseed5% Soya
bean3%
Sunflower
92%
Energy Crops Mix in Greece

___________________________________________________________________________________________
Πανεπιστήμιο Πειραιώς / Τμ. Διεθνών & Ευρωπαϊκών Σπουδών
Ευρωπαϊκή Έδρα Jean Monnet στο Δίκαιο & Πολιτικές ΕΕ
Ενεργειακά Τετράδια / Energy Papers
__________________________________________________________________________________________
Source: Greek Payment Authority of Common Agricultural Policy (OPEKEPE) (2013) & European
Environment Agency (2013), http://www.eea.europa.eu/data-and-maps/figures/mix-of-energy-
crops-200620132008
4. The risk of land use change: In line with the global trend, areas in Greece could also be
used for the cultivation of energy crops instead of food, causing shortages in the market
which increase food prices either directly or indirectly through imports that replace such
shortages.
5. Biodiversity and ecosystems can be endangered in case the demand for biofuels is robust.
Higher yields will eventually require more land to plant energy crops into, possibly
displacing established natural ecosystems and possibly damaging the soil, air and water
provided that intensive agricultural practices are deployed..
6. Overcapacity of infrastructure: Although not only a Greek phenomenon, significant
overcapacity of biodiesel production units is being reported. The root cause behind this
asymmetry according to the majority of the biofuels’ producers of the questionnaire is that
the EU, beginning in 2003, incentivized the investment in the biofuel sector heavily having
a very ambitious vision about the penetration of biofuels.
Opportunities
1. Since biodiesel is currently the only available liquid biofuel in Greece, the further
promotion of its penetration by the policy makers looks like an one-way road towards the
accomplishment of national targets regarding the renewable energy in transport (10%
substitution of energy for transportation by renewable energy sources and 20% cut in
greenhouse gas emissions from 1990 levels). Higher blending mandates with diesel could
lift off the market and optimize the operation of existing biodiesel plants. Even after the
forthcoming 7% cap on crop based biofuels is applied, a Greek market of higher biodiesel
blending rate (10 or 15%) and with the current supply structure (energy crops mainly)
would be within the allowed limits. The consumption of diesel for transport in 2013 was
2,043.107 ktoe (thousands tons of oil equivalent) or 40% of total energy consumption for
transport, whereas the consumption of gasoline was 2,774.485 ktoe. To reach the 10%
renewable target would mean to substitute approx. 480 ktoe with biofuels. Provided that
only biodiesel is currently available, the 480 ktoe equal to 23% percent of diesel
___________________________________________________________________________________________
Πανεπιστήμιο Πειραιώς / Τμ. Διεθνών & Ευρωπαϊκών Σπουδών
Ευρωπαϊκή Έδρα Jean Monnet στο Δίκαιο & Πολιτικές ΕΕ
Ενεργειακά Τετράδια / Energy Papers
__________________________________________________________________________________________
consumption. The 7% cap on crop based biofuels is actually the 70% of the 10% target,
which results in 336 ktoe or 16.5% blending rate. Thus, without changing the current
market structurally, but meeting other conditions such as new blending standards,
feasibility approvals etc., the overall yearly biodiesel allocation could increase by at least
200%. Conclusively, more than doubling of the current blending rate – from 7% to 15%,
seems feasible. Such policy would contribute very essentially to achieving the national
target of renewables in transportation, augmenting greatly the utilization of installed
infrastructure with many upsides for the economy (creation of jobs, support of rural areas,
increase of tax income and so on).
2. As stated above, the import and production of bioethanol is totally a new ground for
business. According to the biodiesel producers, a concrete legal and investment
framework is of key importance to attract potential entrepreneurs to invest. Provided that
the blending of bioethanol with gasoline is imposed as a mandate, similar to biodiesel and
relative practices in the EU and globally, a large market would instantly emerge. Taking
into account the 2013 gasoline consumption for transport in Greece which was 2,643
thousand tons or approximately 3,600 thousand cubic meters (the average density of
gasoline is 0.735 ton per cubic meter at the temperature of 15 Celsius degrees) and a
hypothetical blending mandate of ethanol with gasoline at 3.9% (as in Spain in 2013 – a
country with resembling climatic conditions to Greece and member of EU), the required
bioethanol would amount to 140 thousand cubic meters which is exactly the size of the
Greek biodiesel market (140 thousand cubic meters in 2015).
3. Apart from the transportation sector which absorbs totally the liquid biofuels in Greece,
there could be other appliances as well. As analyzed in §2.1.1, the aviation and marine
sectors are potential new customers of biofuels with capacity to intake massive quantities
of them. However this is unlikely at least for the short term or mid- term future, as no sign
of moving into that direction in Greece has shown up until now. Other potential and more
probable appliances, due to the fact that the legal framework is present (L.3468/2006),
include the blending of biodiesel with heating gas oil for industrial and residential heating
purposes and the usage of blended diesel for power generation. The heating gas oil market
in Greece was approximately 4,000 thousand cubic meters and a 5% blend of biodiesel (i.e.
200,000 cubic meters of biodiesel) with heating gas oil is technically viable without any
adjustment on installed heating infrastructure (burners). While, regarding power
generation, the National Power Company consumes 480 thousand cubic meters to supply
its diesel fuelled power plants. So, a blending rate of 5 - 7% would lead to another 30 to 33
thousand cubic meters new demand of biodiesel per year.
4. Double counting which refers to the contribution of biofuels from non-food crops to the
10% renewables in transport target, offers opportunity for development. Biofuels from
used cooking oil (UCO) and animal fats as well as advanced biofuels from lignocellulosic
materials and innovative fuels created from these feedstocks that enable greater

___________________________________________________________________________________________
Πανεπιστήμιο Πειραιώς / Τμ. Διεθνών & Ευρωπαϊκών Σπουδών
Ευρωπαϊκή Έδρα Jean Monnet στο Δίκαιο & Πολιτικές ΕΕ
Ενεργειακά Τετράδια / Energy Papers
__________________________________________________________________________________________
reductions in greenhouse gases (GHGs), would count double in the 10% target provided
that such a provision is adopted in the local legislation.
Figure 16. GHG emissions of conventional and innovative fuels from advanced biofuels.
Source: http://biofuelstp.eu/sustainability.html, GHG reduction and Sustainable Production of
Biofuels, European Biofuels Technology Platform
5. Marginal lands which in general are of poor quality with regard to agricultural use could
possibly be used for biomass production.
Threats
1. Although the absence of bioethanol activity in Greece has been described as an
opportunity for new business, it poses a threat at the same time. Given that the
enhancement of the biofuel sector with bioethanol has been delayed for so long, the
achievement of national targets until the very close horizon of 2020 remains doubtful.
2. While achieving the 2020 targets seems dubious, there has been no sign of updated
national planning beyond 2020 until nowadays. The lack of such strategic plan will be
deferring the potential development of the local biofuels’ market, depriving it of
competitiveness against markets of other countries more advanced in terms of
organization and planning.

___________________________________________________________________________________________
Πανεπιστήμιο Πειραιώς / Τμ. Διεθνών & Ευρωπαϊκών Σπουδών
Ευρωπαϊκή Έδρα Jean Monnet στο Δίκαιο & Πολιτικές ΕΕ
Ενεργειακά Τετράδια / Energy Papers
__________________________________________________________________________________________
3. A stable legal and regulatory framework is fundamental for the advancing of any sector.
Just in eight years, four major legal acts have been introduced, the one amending the
other, accompanied by numerous ministerial decisions, technical standards and customs
provisions. As argued by all the biofuel producers of our questionnaire, the frequently
changing institutional framework is wounding the industry.
4. High relative costs limit the sustainability and question the viability of the industry. The
sector study performed by the Foundation for Economic & Industrial Research highlights
the presence of greater costs compared to other EU countries, throughout the supply
chain, including the cost of feedstock, production, logistics, storage and handling. The
relatively high cost of feedstock in Greece is considered to be the most material factor for
the high price of the final product. Similarly to other crops, energy cultivations also suffer
from the extended segmentation of land in small ownerships, which blocks the economies
of scale.
Chapter 3: Modeling Diesel and Biodiesel Demand
3.1 Literature and Review
The aim of this chapter is to provide an up-to-date empirical analysis of the demand
for automotive fuels in Greece including the most recent historical data available, develop
an econometric model so as to estimate their future demand and end up in assessing the
potential demand for biofuels according to various possible policy scenarios on the
thresholds of 2020, 2030 and even further.
As highlighted several times before, the only biofuel substituting automotive fuels
currently in Greece is biodiesel. Therefore, our model will be designed to fulfill the
specifications of diesel demand and naturally our target will be to estimate the demand
for biodiesel in the end. Of course, the potential demand for gasoline and bioethanol could
also be investigated likewise, creating opportunity for further elaboration on the matter.
Thus, the analysis and forecasting of diesel demand for road transport is a key milestone
in our effort to assess the demand for biodiesel. Although it is a rather complicated topic,
road energy demand has been studied by economists mainly globally and in a few cases
locally for a long time.
This paper aspires to contribute in the research of the field of road transport energy
demand and be innovative due to the fact that:
1. Employing up-to-date data from 1978 until 2014, the results will also include the impact
of the great economic recession Greece has been suffering since 2009.
2. The focus will be on the automotive diesel demand which has been studied much less
compared to the gasoline demand worldwide, capturing as well the recent lifting

___________________________________________________________________________________________
Πανεπιστήμιο Πειραιώς / Τμ. Διεθνών & Ευρωπαϊκών Σπουδών
Ευρωπαϊκή Έδρα Jean Monnet στο Δίκαιο & Πολιτικές ΕΕ
Ενεργειακά Τετράδια / Energy Papers
__________________________________________________________________________________________
(November, 2011) of the ban on the movement of vehicles with diesel engines in Attica
and Thessaloniki, which is transforming the car market.
3. For the first time, the biofuel future demand will be linked on one hand with results derived
from empirical analysis and econometric model and on the other hand with possible policy
scenarios concerning the biodiesel blending mandates.
The following specifications for the long-run road demand for diesel are employed:
+ - + ln(DIESELCONSUMPTIONt) = b0 + b1ln(GDPt) + b2ln(DIESELPRICEt) + b3ln(DIESELFLEETt) +
ut
where DIESELCONSUMPTIONt is the dependent variable and stands for the per capita
diesel consumption for road transport at time t, GDPt stands for the gross domestic
product per capita income at time t, DIESELPRICEt stands for the real price of diesel (final
one - including taxation) at time t, DIESELFLEETt stands for the per capita diesel-engined
fleet at time t, and finally ut stands for the disturbance term at time t. The positive and
negative signs on top of the independent variables indicate the respective relationship
with the dependent variable they are expected to have. The effects of other fuels, possibly
substitutes, such as the price of gasoline and autogas (autogas refers to liquefied
petroleum gas for vehicles) have been studied as well in order to be included as
independent variables in the model. However, not only was their impact statistically
insignificant but also created severe distortion to the function of the model. Although it is
difficult to economically interpret this effect, we believe that the main reason behind it is
that in Greece, there has been no or very low substitutability between diesel and gasoline
or diesel and autogas. Until 2011, the great majority of diesel vehicles have been heavy
duty trucks, light duty trucks, buses, taxis, agricultural and other special vehicles. These
vehicle types run only on diesel. Perhaps taxi drivers could turn to gasoline, but for reasons
that are explicitly analyzed in the following section (§3.2.1), it is by far more economical
to run on diesel than gasoline. Thus, all taxi cars are diesel fueled. Few light duty trucks
could operate with gasoline, but yet again, limited outside the Athens and Thessaloniki
cities’ limits until 2011. Therefore, their number would be insubstantial. Furthermore,
there is no economically feasible solution for the transformation of diesel engine to
gasoline or to autogas, as in the case of gasoline engines. Such technical transformations
of gasoline fueled engines to autogas fueled have been made very economical in the past
few years (costing on average approx. 1,000 € per vehicle), resulting in a growing market
for lpg in Greece. Summarizing, until 2011, the majority of commercial/duty vehicles were
diesel fueled, whereas the majority of passenger cars were gasoline fueled (in 2010,
approx. 95% of total fleet were registered as gasoline and 5% as diesel). From 2011
and on, the diesel car market is reborn and substitutability between diesel and gasoline is
___________________________________________________________________________________________
Πανεπιστήμιο Πειραιώς / Τμ. Διεθνών & Ευρωπαϊκών Σπουδών
Ευρωπαϊκή Έδρα Jean Monnet στο Δίκαιο & Πολιτικές ΕΕ
Ενεργειακά Τετράδια / Energy Papers
__________________________________________________________________________________________
commencing. Diesel cars increased their market share by 2014 to 8%. Nevertheless, there
are only 4 years out of our sample’s 37 in total of clear substitutability, which are relatively
very few to be capable of creating statistical significant effect to our model.
The data used in the empirical estimation are national time series data expressed in
logarithms (ln) covering the period 1978 – 2014. The 2015 records were not included for
they had not been yet finalized at the time of the analysis. The per capita consumption for
diesel oil (DIESELCONSUMPTION) is measured in kilograms per capita. These data were
made available from the International Energy Agency. The per capita GDP is expressed in
constant 2009 prices, is measured in euros per capita and is obtained from the Eurostat
Database. Energy prices for diesel (DIESELPRICE) are taken from Energy Prices and Taxes
(IEA), include all taxation (VAT, Excise Duties, Other Fees), are expressed in euros per liter
and have been deflated by the consumer price index (2009=100). Finally, the variable that
measures the per capita fleet (DIESELFLEET) of diesel engine vehicles (buses, heavy
commercial vehicles and passenger cars from 2011 and on) is obtained from the database
of the Association of Motor Vehicle Importers Representatives (AMVIR) and is expressed
in vehicles per capita.
3.2 Empirical Analysis
3.2.1 Stationarity Test
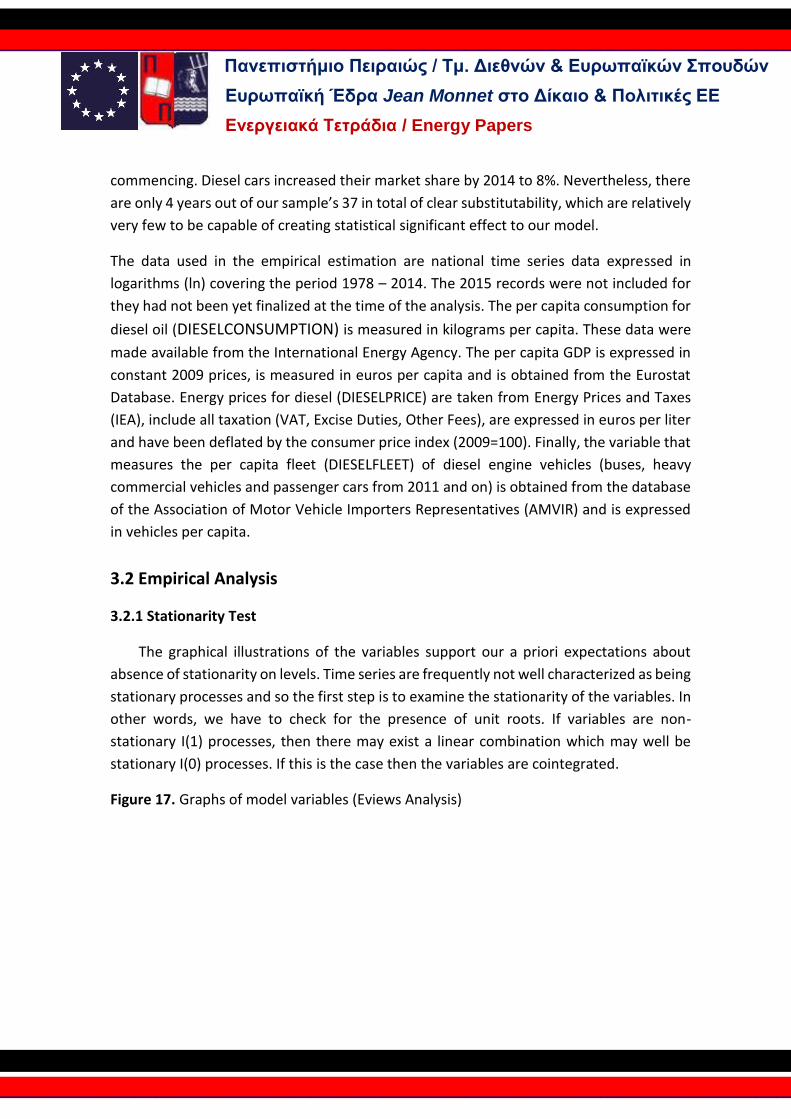
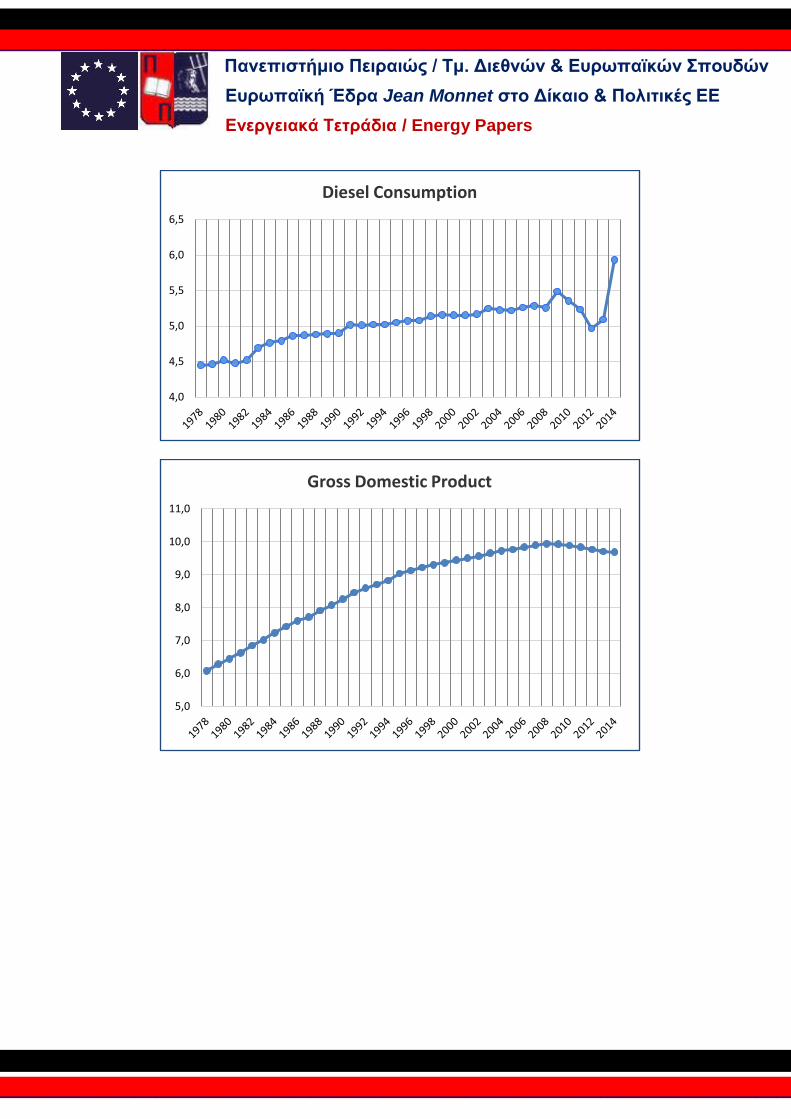
The graphical illustrations of the variables support our a priori expectations about
absence of stationarity on levels. Time series are frequently not well characterized as being
stationary processes and so the first step is to examine the stationarity of the variables. In
other words, we have to check for the presence of unit roots. If variables are non-
stationary I(1) processes, then there may exist a linear combination which may well be
stationary I(0) processes. If this is the case then the variables are cointegrated.
Figure 17. Graphs of model variables (Eviews Analysis)
___________________________________________________________________________________________
Πανεπιστήμιο Πειραιώς / Τμ. Διεθνών & Ευρωπαϊκών Σπουδών
Ευρωπαϊκή Έδρα Jean Monnet στο Δίκαιο & Πολιτικές ΕΕ
Ενεργειακά Τετράδια / Energy Papers
__________________________________________________________________________________________
4,0
4,5
5,0
5,5
6,0
6,5
Diesel Consumption
5,0
6,0
7,0
8,0
9,0
10,0
11,0
Gross Domestic Product

___________________________________________________________________________________________
Πανεπιστήμιο Πειραιώς / Τμ. Διεθνών & Ευρωπαϊκών Σπουδών
Ευρωπαϊκή Έδρα Jean Monnet στο Δίκαιο & Πολιτικές ΕΕ
Ενεργειακά Τετράδια / Energy Papers
__________________________________________________________________________________________
Source: Author’s Econometric Analysis
As the economy grew (GDP graph) from 1978 to 2008, so did the fleet of diesel vehicles
and naturally the diesel oil consumption. It is worth noticing though, that despite the
turnaround of the economy which can be at first merely observed in 2009, becoming
clearer afterwards, the variables of diesel fleet and consumption drive a different course.
This seemingly controversial trend is due to the fact that as we mentioned before, the
diesel cars’ market was reborn in 2011, following the end of the prohibition on the
circulation of diesel cars in the areas of Attica and Thessaloniki, which host the majority of
passenger cars throughout the country. Based on 2007 records, 57% of total passenger
cars in Greece were registered in Attica and Thessaloniki. However, it is quite common for
Greeks to register their cars in other prefectures (i.e. in their home towns) even if they
-1,00
-0,80
-0,60
-0,40
-0,20
0,00
0,20
1978 1981 1984 1987 1990 1993 1996 1999 2002 2005 2008 2011 2014
Diesel Price
-5,5
-5,0
-4,5
-4,0
-3,5
-3,0
-2,5
-2,0
Diesel Vehicle Fleet

___________________________________________________________________________________________
Πανεπιστήμιο Πειραιώς / Τμ. Διεθνών & Ευρωπαϊκών Σπουδών
Ευρωπαϊκή Έδρα Jean Monnet στο Δίκαιο & Πολιτικές ΕΕ
Ενεργειακά Τετράδια / Energy Papers
__________________________________________________________________________________________
reside in Athens/Thessaloniki. Thus, the ratio of passenger cars actually moving in these
cities is expected to be even higher. The high attractiveness of modern diesel fueled
engines versus gasoline fueled in Greece derives from the blending of the following factors
which together offer lower cost per kilometer:
Diesel engines are in general more efficient in terms of fuel consumption. Their superiority
in efficiency cannot be quantified, as it varies greatly depending on type of car, company,
model etc. In the past, diesel engines were considered not capable of meeting the gasoline
engines performance, but this perception is now obsolete, as almost all car companies
have invested greatly to upgrade their diesel technology.
The taxation on diesel is much lower. The excise duties for all kinds of gasoline are
nowadays 0.67 €/liter while for diesel 0.33 €/liter. The VAT is the same (23%), however it
is imposed on the price of the fuel including the excise duties, resulting in greater VAT
effect. The costs of the basic fuels, diesel oil or gasoline, are fluctuating as their
commodities are fully commercialized and depend on regional and global supply and
demand variations. Usually the price of basic diesel is slightly lower compared to basic
gasoline. In 2015 on average, the cost of the basic diesel oil for Greece (Ultra Low Sulfur
Diesel with Sulfur content 10 parts per million) was 509 USD/Metric Ton. During the same
period, the basic gasoline for Greece (Gasoline of 95 octanes EN 228) cost 570 USD/Metric
Ton. Thus, the basic diesel oil was approximately 10% cheaper than gasoline. Summarizing
and taking into account the total of the cost elements, from 2005 - when biodiesel was
first introduced in Greece and blended with diesel oil - until 2014, the total price of gasoline
was 32% higher than the one of diesel oil.
In order to proceed further into the stationarity testing of the above time series, we
have to check for the presence of unit roots. The graphical illustrations provide evidence
that our variables are probably non-stationary I(1). In order to examine the order of
integration, we apply a series of diagnostic tests both in levels and first differences of these
variables (Augmented Dickey-Fuller, Phillips-Perron, KPSS and Ng-Perron tests).
The results of the above tests are presented in below table:

___________________________________________________________________________________________
Πανεπιστήμιο Πειραιώς / Τμ. Διεθνών & Ευρωπαϊκών Σπουδών
Ευρωπαϊκή Έδρα Jean Monnet στο Δίκαιο & Πολιτικές ΕΕ
Ενεργειακά Τετράδια / Energy Papers
__________________________________________________________________________________________
Table 8. Tests for unit roots.
Variables Augmented Dickey-Fuller Phillips-Perron KPSS Ng-Perron Orders of
integration
Lags τt τμ τt τμ nt nμ MZa MZt MSB MPT
Levels
GDP 1 -1.50 -1.18 -0.95 -1.17 0.11 0.58** -9.60 -2.01 0.21 10.23
Ι(1) (0.811) (0.671) (0.939) (0.677) [4] [5] [1] [1] [1] [1]
DIESELPRICE 0 -2.59 -1.56 -2.26 -1.78 0.16** 0.51** -6.82 -1.83 0.27 13.37
Ι(1) (0.285) (0.490) (0.446) (0.385) [4] [4] [0] [0] [0] [0]
DIESELFLEET 0 -1.93 -0.33 -2.12 -0.31 0.11*** 0.74** -4.85 -1.43 0.29 18.06
Ι(1) (0.620) (0.911) (0.519) (0.913) [4] [5] [0] [0] [0] [0]
DIESELCONSUMPTION 5 -2.28
(0.435) -2.99
(0.466) -2.09
(0.536) -2.21
(0.208) 0.20**
[3] 0.66**
[5] 0.58 [3]
0.48 [3]
0.81 [3]
44.48 [3]
I(1)
First Differences
Δ(GDP) 0 -3.51* -3.49** -3.48* -3.47**
- 0,20 -14.04** -2.65** 0.19** 6.50**
Ι(0) (0.054) (0.014) (0.058) (0.015) [4] [0] [0] [0] [0]
Δ(DIESELPRICE) 0 -4.75*** -4.80*** -6.23*** -5.15*** 0.11 0.11 -15.9* -2.82* 0.18* 5.73*
Ι(0) (0.003) (0.000) (0.000) (0.000) [8] [8] [0] [0] [0] [0]
Δ(DIESELFLEET) 0 -5.93*** -6.01*** -5.95*** -6.03*** 0.19** 0.19 -17.30** -2.93** 0.17** 5.32** Ι(0)
(0.620) (0.000) (0.000) (0.000) [2] [2] [0] [0] [0] [0]
Δ(DIESELCONSUMPTION) 3 -4.03*** (0.017)
-0.53*** (0.000)
-5.82*** (0.000)
-5.20*** (0.000)
0.31 [25]
0.50* [35]
-201.95*** [2]
-9.96*** [2]
0.05*** [2]
0.23*** [2]
Ι(0)

___________________________________________________________________________________________
Πανεπιστήμιο Πειραιώς / Τμ. Διεθνών & Ευρωπαϊκών Σπουδών
Ευρωπαϊκή Έδρα Jean Monnet στο Δίκαιο & Πολιτικές ΕΕ
Ενεργειακά Τετράδια / Energy Papers
__________________________________________________________________________________________
Notes: The relevant tests are derived from the OLS estimation of the following autoregression for the variable involved: ΔΥt = δ + βYt-1 + γt + ΣαiΔYt-
i + ut
τμ is the t-statistic for testing the significance of β when a time trend is not included in the equation and τt is the t-statistic for testing the significance
of β when a time trend is included in the equation. The calculated statistics are those reported in Dickey and Fuller (1981). The critical value at 5 and
1% for N=50 are given in Dickey and Fuller (1981). The optimal lag length structure is determined by minimizing the Schwarz Info Criterion (SIC). The
critical values for the Phillips-Perron unit root tests are obtained from Dickey and Fuller (1981). The numbers in parenthesis denote the MacKinnon
(1996) one-sided p-values. The numbers in brackets [] denote the lags using the Newey-West bandwidth. nμ and nt are the KPSS statistics for testing
the null hypothesis that the series are I(0) when the residuals are computed from a regression equation with only an intercept and intercept and
time trend respectively. The critical values are given in Kwiatkowski et al. (1992). The Ng-Perron statistic tests the null hypothesis that the series are
I(1) including an intercept and a deterministic trend.
*** denotes the significance in 1% level. ** denotes the significance in 5% level. * denotes the significance in 10%
level.

___________________________________________________________________________________________
Πανεπιστήμιο Πειραιώς / Τμ. Διεθνών & Ευρωπαϊκών Σπουδών
Ευρωπαϊκή Έδρα Jean Monnet στο Δίκαιο & Πολιτικές ΕΕ
Ενεργειακά Τετράδια / Energy Papers
___________________________________________________________________________________________
Διευθυντής Σειράς:
Νικόλαος Ε. Φαραντούρης, Καθηγητής της Ευρωπαϊκής Έδρας Jean Monnet, Πανεπιστήμιο Πειραιώς
Ανδρούτσου 150, 185 32 Πειραιεύς
T: +30 210 414 2394
http://www.des.unipi.gr/metaptichiako-stin-energia/
The conducted tests show that the null hypothesis of a unit root (no stationarity) cannot
be rejected in levels for all the variables. Following the examination of stationarity at levels,
we apply the tests at first differences. The results of each variable test support that the
stationarity hypothesis cannot be rejected.
3.2.2 Cointegration Analysis
We continue our empirical analysis with the elaboration of cointegration techniques in
our model in order to examine whether there is a long-run (structural) co-movement of the
variables. Since non stationary time series result to spurious regressions and hence do not
allow statistical interpretation of the estimations, we ought to apply cointregration
techniques, in our case the Johansen methodology of maximum likelihood. We bring to test
two alternative statistics, first the maximum eigenvalues and secondly the trace statistic, in
comparison with the Osterwald-Lenum critical values.
The results of the cointegration tests are shown below in table 9. The estimation of trace
statistic provides solid evidence that one vector of cointegration between the model’s
variables exists. More specifically, we carry out tests on four different specifications: 1) No
intercept and no deterministic trend, 2) Intercept and no deterministic trend, 3) Intercept no
linear deterministic trend, 4) Intercept and linear deterministic trend 5) Intercept and
quadratic deterministic trend.
Table 9. Johansen's maximum likelihood method test for cointegration relationship.
Null Hypothesis Ho Alternative Hypothesis
Eigenvalue Critical Values
95% 99%
Intercept and linear deterministic trend
Trace statistic
r=0 r=1 70.72*** 62.99 70.05
r≤1 r=2 42.03 42.44 48.45
Maximum eigenvalues
r=0 r=1 28.69 31.46 36.65
Source: Author’s Econometric Analysis
r denotes the number of cointegration vectors
*** denotes significance at 1% level.

________________________________________________________________________ __________________
Πανεπιστήμιο Πειραιώς / Τμ. Διεθνών & Ευρωπαϊκών Σπουδών
Ευρωπαϊκή Έδρα Jean Monnet στο Δίκαιο & Πολιτικές ΕΕ
Ενεργειακά Τετράδια / Energy Papers
_ _______________________________________________________________________________________________
The trace statistic tests result in the existence of one cointegration vector at 1% statistical
significance level for specification 4 (as per Table 9) which is considered appropriate and at
least two cointegration vectors for the other specifications.
Summarizing the results of the cointegration analysis, it becomes clear that the null
hypothesis (no cointegration) is rejected at 1% level. In other words, one cointegration vector
exists at 1% statistical significance level.
3.2.3 Long Run Regression Analysis
Having defined that our series are all stationary at their first differences and cointegrated
as well, our next step is to assess the long run elasticities of the model. We follow the two-
step Engle and Granger methodology by estimating an error correction model (ECM) through
the Ordinary Least Squares (OLS) approach. The main reason for using this approach instead
of using a vector autoregression model (VAR) is that the latter is more sensitive to the number
of lags that can be used.
The OLS resulting estimates of our model are as follows:
DIESELCONSUMPTION = 0.60 GDP – 0.34 DIESELPRICE + 0.39 DIESELFLEET + U
Table 10. Long run regression
Variables
DIESELCONSUMPTION
Coefficient Std. Error t-Statistic Prob.
C 0.62 1.19 0.52 0.606
GDP 0.60*** 0.11 5.49 0.000
DIESELPRICE -0.34*** 0.08 -4.33 0.000
DIESELFLEET 0.39*** 0.05 7.46 0.000
Diagnostics
Adjusted R-squared 0.88
Durbin-Watson stat 0.91
LM Test 2.87
[0.110]
White test 2.55
[0.150]
J. Bera 6.74
[0.034]
ARCH test 2.77
[0.105]
Chow-test 5.77 11.32 5.27

________________________________________________________________________ __________________
Πανεπιστήμιο Πειραιώς / Τμ. Διεθνών & Ευρωπαϊκών Σπουδών
Ευρωπαϊκή Έδρα Jean Monnet στο Δίκαιο & Πολιτικές ΕΕ
Ενεργειακά Τετράδια / Energy Papers
_ _______________________________________________________________________________________________
Breakpoints 1992, 2003, 2011 [0.002] [0.000] [ 0.000]
Numbers inside brackets denote the p values.
***denotes significance at 1% level.
Source: Author’s Econometric Analysis
Our first observation concerns the statistical significance of the independent variables. All
of them are found to be significant at 1% level, except for the constant term (C), which is not
statistically significant, not affecting however the quality of the model. The fact that the total
of the variables’ coefficients are statistically significant and at the same level, which also
happens to be the highest (1%), supports the acceptance of the model so far. With reference
to the diagnostics carried out for the long run regression, we have performed tests for the
existence of autocorrelation and heteroskedasticity through Durbin Watson, LM, White and
Arch tests, the results of which reject their existence (of autocorrelation and
heteroskedasticity). Moreover, we applied to our sample data the Jarque-Bera test and found
that it matches a normal distribution. Finally, the Chow Breakpoint tests for years 1992, 2003,
2011 – all of them considered as milestones for the local oil products’ market, since the
deregulation of the market first began in 1992, was completed in 2002 and the ban on diesel
was lifted in 2011 – show that there have been structural breaks in the diesel demand as
expected. Regarding the coefficients, they do have the anticipated signs as described in §3.1.
The income effect (GDP) is positive with relevant long-run elasticity below unity (0.60). The
diesel price has a negative effect (-0.34), while the diesel fleet has positive (0.39). Both of them
have almost the same magnitude (0.34 vs 0.39) with relative long-run elasticities below unity.
1% variation of GDP will lead to 0.6% variation of diesel demand, whereas 1% variation of the
diesel price or fleet will lead to 0.3% variation of diesel demand (almost half compared to the
GDP effect). Thus, we come to conclude that the diesel demand appears to be inelastic to
variations of all its determining factors. The above results are in line and close to those
reported in other countries, such as M. Bakhat et al (2013) report for Spain (being of significant
value as we believe since this report was conducted very recently in a country whose economy
has been under recession and international financial supervision somehow related to Greece),
F. Dunkerlay et al (2014) report for UK and T. Sterner (2006) reports for the OECD countries in
his comprehensive research.
3.2.4 Short Run Regression Analysis
Following the long-run regression analysis, we carry on with assessing our model’s
responses (elasticities) in the short run, maintaining of course the error correction model
approach the results of which are accumulated in table 11 below. Each coefficient of the

________________________________________________________________________ __________________
Πανεπιστήμιο Πειραιώς / Τμ. Διεθνών & Ευρωπαϊκών Σπουδών
Ευρωπαϊκή Έδρα Jean Monnet στο Δίκαιο & Πολιτικές ΕΕ
Ενεργειακά Τετράδια / Energy Papers
_ _______________________________________________________________________________________________
variables denotes the short-run elasticity. All the coefficients of the variables of the diesel
demand are in alignment with the theory and are statistically significant, except for the fleet
of diesel vehicles which is not (in the short-run). Short-run income elasticity is below unity and
is estimated to be 0.59, implying that a 1% increase of per capita GDP will increase diesel
demand at a much lower rate (0.59%). The short run elasticity with respect to own price is
estimated to be less than unity as well (0.23) implying low level response of diesel demand to
its own price fluctuations which reveals the difficulty of consumers to substitute diesel with
other energy products (gasoline, lpg, natural gas, hydrogen, fuel cells, etc.). The short run
elasticities of both statistical significant variables are lower (at least slightly lower at the case
of GDP) than the long run ones, satisfying the LeChatelier principle. The error correction term
(ECT)t-1 is strongly significant (t statistic -3,73 and p value 0,0008) with an adjustment
coefficient of -0.52, implying that, in the case we are off the long-run demand curve, diesel
consumption adjusts towards its long-run level with about 52% of this adjustment taking place
within the first year.
Table 11. Short run regression
Variables
D(DIESELCONSUMPTION)
Coefficient Std. Error t-Statistic Prob.
D(GDP) 0.59** 0.28 2.12 0.042
D(DIESELPRICE) -0.23** 0.10 -2.33 0.026
D(DIESELFLEET) -0.06 0.21 -0.27 0.786
ECM_RESID(-1) -0.52*** 0.14 -3.73 0.001
Diagnostics
Adjusted R-squared 0.35
Durbin-Watson stat 1.47
LM Test 2.3
[0.119]
White test 1.36
[0.256]
J. Bera 9.98
[0.007]
ARCH test 0.54

________________________________________________________________________ __________________
Πανεπιστήμιο Πειραιώς / Τμ. Διεθνών & Ευρωπαϊκών Σπουδών
Ευρωπαϊκή Έδρα Jean Monnet στο Δίκαιο & Πολιτικές ΕΕ
Ενεργειακά Τετράδια / Energy Papers
_ _______________________________________________________________________________________________
[0.468]
Numbers inside brackets denote the p values.
** denotes significance at 5% level.
*** denotes significance at 1% level.
Source: Author’s Econometric Analysis
3.3 Forecasting
After having calculated and tested our demand estimation model, we enter the area of
forecasting, aiming to meet our end target, which comprises two consecutive steps: The first
step to take would be to estimate the future demand of diesel oil. Secondly, we will proceed
with the application of policy scenarios, regarding possible regulatory mandates of biodiesel
blending, on the future diesel oil estimates. Thus, this process will enable us to formulate basic
views of how the local biodiesel demand could potentially develop.
3.3.1 Diesel Demand
Our forecasts will stretch from 2015 to 2030. It is not recommended to extend further in
the future, as the longer the forecast is, the lesser its probability to occur. We apply two
forecast approaches:
1) The first one is rather short-term, extending from 2015 to 2020 and following the Box-Jenkins
or ARIMA (autoregressive integrated moving average) methodology. This method which is
widely used for the analysis of time series, conducts forecasts for a time series Yt based on its
past values only, without any other structural information. For example, no information
regarding which determinant variables have an impact on time series Yt is required. Since our
series (DIESELCONSUMPTION) is not stationary on levels, we take the first differences and
formulate a new series as follows:
D(DIESELCONSUMPTION)t = DIESELCONSUMPTIONt – DIESELCONSUMPTIONt-1
Then we apply the ARIMA (1, 1, 1) model on the new series, which has below form:
D(DIESELCONSUMPTION)t = bo + b1D(DIESELCONSUMPTIONt-1) + et + a1et-1
Whereas b1 is the autoregressive coefficient, a1 is the moving average coefficient and et are
the error terms (generally assumed to be independent, identically distributed variables
sampled from a normal distribution with zero mean).

________________________________________________________________________ __________________
Πανεπιστήμιο Πειραιώς / Τμ. Διεθνών & Ευρωπαϊκών Σπουδών
Ευρωπαϊκή Έδρα Jean Monnet στο Δίκαιο & Πολιτικές ΕΕ
Ενεργειακά Τετράδια / Energy Papers
_ _______________________________________________________________________________________________
In general, the ARIMA models are considered to be appropriate for short-term predictions and
this is the main reason for applying such technique for our up to 2020 forecast. The credibility
of ARIMA models is evaluated with the calculation of the statistic RMSE (Root mean squared
error).
The results of this method are shown below:

________________________________________________________________________ __________________
Πανεπιστήμιο Πειραιώς / Τμ. Διεθνών & Ευρωπαϊκών Σπουδών
Ευρωπαϊκή Έδρα Jean Monnet στο Δίκαιο & Πολιτικές ΕΕ
Ενεργειακά Τετράδια / Energy Papers
_ _______________________________________________________________________________________________
Figure 18. Short-term forecast of diesel oil demand (ARIMA model).
Notes:
On the verticals axis is the forecasted diesel consumption per capita in Ln values.
The dotted curves (red) represent forecasts with ± 2 standard errors.
Source: Author’s Econometric Analysis
Figure 19. Diesel oil demand curve from 1978 to 2014 (historic values) and short-term forecast
until 2020 (ARIMA model).
5.1
5.2
5.3
5.4
5.5
5.6
5.7
5.8
5.9
6.0
2015 2016 2017 2018 2019 2020
DIESELCONSF ± 2 S.E.
DIESEL CONSUMPTION 1978 - 2020

________________________________________________________________________ __________________
Πανεπιστήμιο Πειραιώς / Τμ. Διεθνών & Ευρωπαϊκών Σπουδών
Ευρωπαϊκή Έδρα Jean Monnet στο Δίκαιο & Πολιτικές ΕΕ
Ενεργειακά Τετράδια / Energy Papers
_ _______________________________________________________________________________________________
Table 12. Diagnostics of ARIMA method.
ARIMA DIAGNOSTICS
Forecast DIESELCONSF
Actual DIESELCONSUMPTION
Forecast sample 1978 - 2020
Adjusted sample 1980 - 2020
Included observations 35
Root Mean Squared Error 0,189537
Mean Absolute Error 0,175647
Mean Abs. Percent Error 3,470638
Theil Inequality Coefficient 0,019085
Bias Proportion 0,61233
Variance Proportion 0,000355
Covariance Proportion 0,387315 Source: Author’s Econometric Analysis
As mentioned before, our dependent variable – the diesel consumption – is the natural
logarithm (Ln) of the diesel consumption measured in thousand tons per capita (divided by
1,000,000 in order to limit the digits of the numbers). So, we continue with the conversion of
the forecasted logarithms into absolute numbers aiming to estimate the future demand of
diesel oil in its basic unit of measure globally, i.e. thousand tons or kT.
Table 13. Forecast of Diesel Demand in thousand tons & annual change until 2020.
Year Ln of Diesel Demand per Capita
Diesel Demand in kT Diesel Demand VS Last Year
2014 5.34 2,317
2015 5.38 2,410 4%
2016 5.41 2,482 3%
2017 5.45 2,559 3%
2018 5.48 2,630 3%
2019 5.50 2,702 3%
2020 5.53 2,769 2%
Source: Author’s Econometric Analysis
The second approach which is more long-term as it extends from 2015 to 2030 follows the
methodology of simple linear models and is recommended to apply if the values of
determinant variables/factors are known or can be predicted. The linear model to be used
will be the one we studied and tested in the section of the empirical analysis of the long run
regression in specific i.e.:

________________________________________________________________________ __________________
Πανεπιστήμιο Πειραιώς / Τμ. Διεθνών & Ευρωπαϊκών Σπουδών
Ευρωπαϊκή Έδρα Jean Monnet στο Δίκαιο & Πολιτικές ΕΕ
Ενεργειακά Τετράδια / Energy Papers
_ _______________________________________________________________________________________________
DIESELCONSUMPTION = 0.60 GDP – 0.34 DIESELPRICE + 0.39 DIESELFLEET + U
The greatest and most crucial challenge of this approach is of course the prediction of the
determinant variables. To this end, we have developed three scenarios: First of all, we focus
on one Reference scenario (RS) which is the most probable and afterwards, in line with the
basics of sensitivity analysis, we design two alternative scenarios of equal deviation from the
reference scenario and in our opinion of similar likelihood, the Over Performance scenario
(OPS) and the Under Performance scenario (UPS).
The predictions for the evolution of the GDP, Diesel price and Diesel fleet differ in all three
scenarios. Their logic is going to be detailed further on. The only factor remaining unchanged
throughout the scenarios, affecting indirectly two out of three determinant variables and the
dependable variable as well, is the population. We remind that GDP, Diesel Fleet and Diesel
Consumption stand for variables per capita. We chose not to differentiate the population
evolution projections, since on one hand no tangible studies with more than one probable to
happen scenarios could be retrieved and on the other hand it is a far more complex issue that
expands beyond economic implications and is associated greatly with social and cultural
developments of high indeterminacy impact. The population evolution is derived from the
Global Forecasting Model of University of Denver.
Regarding the evolution of the GDP, our Reference Scenario takes into consideration the
most recent release of OECD. From 2016 and on the economy is growing continuously, more
intensively in the first 3 years (5% per year) and then gradually less intensively but significantly
(3% for a period of ten years). The basic assumption of the two alternative scenarios is that
the economy of Greece performs better and worse respectively compared to OECD forecasts.
In order to achieve symmetry between the alternative scenarios, we applied equal – in
absolute value – deviation rate from the reference one. Moreover, the deviation rate should
be significant so that the differentiations on the results would matter but not be chaotic,
risking to provide unrealistic scenarios. Thus, in the OPS, the GDP evolution from 2015 to 2030
is accelerated by 50% each year, while in UPS, is decelerated by 50%. The GDP progress in all
scenarios is the driver that designates the course of the other two determinant variables as
well (Diesel Fleet and Diesel price partly).
With reference to Diesel Fleet, in the RS, we assume that the speed of replacing gasoline
fueled cars with diesel oil we have witnessed during the previous years of the recession and
following the diesel ban lifting in 2011 will keep up. During 2011 – 2014, the average rate of
diesel fleet growth has been 10% yearly which we maintain until 2030, while the average rate
of gasoline fleet shrinkage has been 1.25%. We assume that this rate increases slightly to 2%

________________________________________________________________________ __________________
Πανεπιστήμιο Πειραιώς / Τμ. Διεθνών & Ευρωπαϊκών Σπουδών
Ευρωπαϊκή Έδρα Jean Monnet στο Δίκαιο & Πολιτικές ΕΕ
Ενεργειακά Τετράδια / Energy Papers
_ _______________________________________________________________________________________________
until 2030, given the fact that the economy is expected to start growing again from 2016, so
that people will even more decisively wish to replace their gasoline fueled vehicles. By 2030,
the diesel vehicles’ market share will have risen from 8% in 2014 to 35%, much closer to the
current EU average of 53% (according to ACEA). The total fleet will count 8,273 million cars,
3% more than in 2014. In the OPS, we assume that the replacement rates will be even higher,
with diesel fleet to be growing 15% for the first six years and then gradually balancing to 10%
yearly, whereas the gasoline fleet will be shrinking 3% annually. In 2030, the diesel market
share will hit 48% being very close to EU current average, while the total fleet will be 8% more
than in 2014. Finally, in the UPS, the replacement rates will be approximately half compared
to the RS, 5% increase of diesel fleet and 1% reduction of the gasoline fleet per year. Such
course will to a diesel market share of 18% and total fleet approximately 4% less than it was
in the beginning.
Predicting price variations can be a very complicated exercise with great uncertainties.
Especially when dealing with fully commercialized commodities such as fuels, the prices of
which are influenced in multiple manners and in various fields such as at physical markets,
exchange houses, through over the counter transactions, due to supply and demand curves,
speculation, arbitrage, political pressure, technology innovation, depletion of oil fields,
competition from substitutes and so on. Although very few forecast schemes for the prices of
petroleum products exist, for example by the Platts published daily under their Forward
Curves assessment platform, they are rather short or medium term as they extend up to 36
months. Necessarily, we will have to simplify the process by adopting the following approach.
Firstly, we decompose the end price (retail price) of diesel oil. It is comprised of taxation and
commodity value. Then we decompose the taxation component which basically is VAT and
Excise Duty. Their cost contribution is known, e.g. the excise duty of diesel oil in 2014 is 330 €
per 1,000 Liters and VAT is 23%. Removing the taxation from the end price leads us to the
value of the commodity. So, our task now is about predicting the evolution of taxation and
commodity. The commodity of interest is diesel oil, which is one of the many distillates of
crude oil. Due to the fact that long run projections for petroleum products are not available,
we make the assumption that the diesel oil evolution will follow the crude oil evolution in the
long run. According to literature and historical data, such an assumption is realistic. The
following charts clearly show that the long-term price fluctuations between crude and
products are highly correlated.
Figure 20. Unleaded and Diesel Prices & Oil Price
UK price, £ per liter of Products, $ per barrel of Crude

________________________________________________________________________ __________________
Πανεπιστήμιο Πειραιώς / Τμ. Διεθνών & Ευρωπαϊκών Σπουδών
Ευρωπαϊκή Έδρα Jean Monnet στο Δίκαιο & Πολιτικές ΕΕ
Ενεργειακά Τετράδια / Energy Papers
_ _______________________________________________________________________________________________
Source: http://www.eia.gov/dnav/pet/pet_pri_spt_s1_w.htm
Figure 21. Change in Prices – Crude Oil vs Petrol (Gasoline) vs Diesel
Source: http://capitalmind.in/

________________________________________________________________________ __________________
Πανεπιστήμιο Πειραιώς / Τμ. Διεθνών & Ευρωπαϊκών Σπουδών
Ευρωπαϊκή Έδρα Jean Monnet στο Δίκαιο & Πολιτικές ΕΕ
Ενεργειακά Τετράδια / Energy Papers
_ _______________________________________________________________________________________________
Therefore, we will parallel our predictions for the evolution of the commodity value of
diesel with the latest forecast of World Bank for crude oil, applying the same to all three
scenarios naturally, since the local economic developments are very much unlikely to
influence the global prices of crude oil. After completing the curve for the commodity value
of diesel, we enter the area of tax policy forecast. Given the fact that historically governments
tend to raise the taxation when the economy is under performing while they tend to leave it
as is in case of normal or better performance, we formulate the following assumptions. In the
RS, the VAT of 23% in 2014 will increase to 24% in 2016 (as it is already decided) and remain
at this level throughout the period. The average VAT in EU is currently 21.5%. The excise duty
which is 330 € per 1,000 Liters in 2014, will increase to 410 € in 2017 (adopted legislation) and
will gradually reach 438 € per 1,000 Liters by 2030, i.e. current average of EU. It is noted that
the current excise duty of 330 € is the minimum allowed in accordance with the Energy
Directive (Council Directive 2003/96/EC). In the OPS, the VAT shall increase to 24% in 2016
(adopted legislation) and gradually deescalate to 21.5% (EU average). The excise duty will rise
to 410 € in 2017 (adopted legislation) and remain at this level. In the UPS, both VAT and excise
duty will gradually increase to the highest in the EU as per current levels, i.e. the VAT will rise
to 27% (as is currently in Hungary) and the excise duty will reach 623 € per 1,000 Liters (as is
currently in Sweden).
Figure 22. Diesel oil demand curve from 1978 to 2014 (historic values) and long-term forecast
until 2030 based on alternative scenarios (Linear model).

________________________________________________________________________ __________________
Πανεπιστήμιο Πειραιώς / Τμ. Διεθνών & Ευρωπαϊκών Σπουδών
Ευρωπαϊκή Έδρα Jean Monnet στο Δίκαιο & Πολιτικές ΕΕ
Ενεργειακά Τετράδια / Energy Papers
_ _______________________________________________________________________________________________
4.4
4.8
5.2
5.6
6.0
6.4
6.8
1980 1985 1990 1995 2000 2005 2010 2015 2020 2025 2030
Over Performance Scenario
Reference Scenario
Under Performance Scenario
ForecastHistorical Data
3.3.2 Biodiesel Demand
In the second and last part of our forecasting process we aim to apply alternative policy
scenarios regarding the biodiesel blending rate on diesel demand projections so as to outline
the biodiesel demand potential in Greece for the next 15 years.
As aforementioned the current blending rate – valid from 2013 – has been regulated at
7%. This blended fuel is also called B7. Thereafter, the 7% blending rate will be our base case
scenario. Beyond this though, as analyzed with much detail in the very comprehensive report
of Delft University “Bringing biofuels on the market: Options to increase EU biofuels volumes
beyond the current blending limits”, which was commissioned by the European Commission,
DG Energy, with reference to biofuels potential, “there is an almost unlimited number of
options. Each one of the options have specific advantages with respect to vehicle costs, fuel
costs or infrastructure costs. Developing all the options at the same time would place an
unacceptable burden on vehicle development & production and infrastructure development
& operation.”
The results of the overall assessment the study team performed for biofuels in the EU are
summarized in the following tables 17 and 18, which for the purposes of this essay have been
limited to diesel and biodiesel (FAME) related scenarios. According to the authors, the most
probable blending rate to adopt would be 10%, with diesel fuel B10. While there are few more
advanced scenarios suggesting 20 and 30% blending rates respectively (B20 and B30). While
we share the perspective of the 10% scenario being the most probable development in terms
of feasibility in Greece, with the least technical and economic constraints to overcome, a

________________________________________________________________________ __________________
Πανεπιστήμιο Πειραιώς / Τμ. Διεθνών & Ευρωπαϊκών Σπουδών
Ευρωπαϊκή Έδρα Jean Monnet στο Δίκαιο & Πολιτικές ΕΕ
Ενεργειακά Τετράδια / Energy Papers
_ _______________________________________________________________________________________________
blending rate over 15% seems unlikely even as a mere possibility. Given the fact that the
biodiesel production in Greece is mainly energy crop based and a 7% cap on renewable energy
for road transport deriving from energy crops has been legislated, the biodiesel blending rate,
without any significant restructuring of the market, could rise up to 15% approximately
(substituting the share of the non-existing bioethanol as analyzed in §2.2.3 Swot
Analysis/Opportunities). Concluding, our three alternative scenarios will be composed of the
base case ratio 7%, the most probable case ratio 10% and the maximum case ratio 15%.
At the base case the 7% ratio is obviously maintained up to 2030, whereas at the most
probable case, we assume that the 10% ratio is adopted from 2018 onwards. We know for
fact that the blending ratio is not going to change for 2016 and we assume the same for 2017,
as no formal initiatives have been made public yet. Respectively, at the maximum case ratio,
we assume that before adopting the 15% ratio, there will be an adjustment period of 10%
ratio between 2018 and 2020.
The aforementioned rationale of the alternative biodiesel policy scenarios is then applied
to the three alternative diesel demand projections, i.e. at the under-performance scenario,
the reference and the over-performance one, creating the following results:
Figure 23. Forecast of base case blending ratio 7%. Values of vertical axis are the projected
biodiesel demand volumes in thousand cubic meters or million liters.

________________________________________________________________________ __________________
Πανεπιστήμιο Πειραιώς / Τμ. Διεθνών & Ευρωπαϊκών Σπουδών
Ευρωπαϊκή Έδρα Jean Monnet στο Δίκαιο & Πολιτικές ΕΕ
Ενεργειακά Τετράδια / Energy Papers
_ _______________________________________________________________________________________________
Source: Author’s Econometric Analysis
Figure 24. Forecast of most probable case blending ratio 10%. Values of vertical axis are the
projected biodiesel demand volumes in thousand cubic meters or million liters.
0
50
100
150
200
250
300
350
400
450
2016 2017 2018 2019 2020 2021 2022 2023 2024 2025 2026 2027 2028 2029 2030
UNDER PERFORMANCE
REFERENCE SCENARIO
OVER PERFORMANCE

________________________________________________________________________ __________________
Πανεπιστήμιο Πειραιώς / Τμ. Διεθνών & Ευρωπαϊκών Σπουδών
Ευρωπαϊκή Έδρα Jean Monnet στο Δίκαιο & Πολιτικές ΕΕ
Ενεργειακά Τετράδια / Energy Papers
_ _______________________________________________________________________________________________
Source: Author’s Econometric Analysis
Figure 25. Forecast of maximum case blending ratio 15%. Values of vertical axis are the
projected biodiesel demand volumes in thousand cubic meters or million liters.
0
100
200
300
400
500
600
700
2016 2017 2018 2019 2020 2021 2022 2023 2024 2025 2026 2027 2028 2029 2030
UNDER PERFORMANCE
REFERENCE SCENARIO
OVER PERFORMANCE

________________________________________________________________________ __________________
Πανεπιστήμιο Πειραιώς / Τμ. Διεθνών & Ευρωπαϊκών Σπουδών
Ευρωπαϊκή Έδρα Jean Monnet στο Δίκαιο & Πολιτικές ΕΕ
Ενεργειακά Τετράδια / Energy Papers
_ _______________________________________________________________________________________________
Source: Author’s Econometric Analysis
0
200
400
600
800
1000
2016 2017 2018 2019 2020 2021 2022 2023 2024 2025 2026 2027 2028 2029 2030
UNDER PERFORMANCE
REFERENCE SCENARIO
OVER PERFORMANCE

___________________________________________________________________________________________
Πανεπιστήμιο Πειραιώς / Τμ. Διεθνών & Ευρωπαϊκών Σπουδών
Ευρωπαϊκή Έδρα Jean Monnet στο Δίκαιο & Πολιτικές ΕΕ
Ενεργειακά Τετράδια / Energy Papers
___________________________________________________________________________________________
Διευθυντής Σειράς:
Νικόλαος Ε. Φαραντούρης, Καθηγητής της Ευρωπαϊκής Έδρας Jean Monnet, Πανεπιστήμιο Πειραιώς
Ανδρούτσου 150, 185 32 Πειραιεύς
T: +30 210 414 2394
http://www.des.unipi.gr/metaptichiako-stin-energia/
Μιχαήλ Ν. Φωτιάδης
Ο Μιχάλης Φωτιάδης είναι απόφοιτος του τμήματος Λογιστικής &
Χρηματοοικονομικής του Οικονομικού Πανεπιστήμιου Αθήνας, με
μεταπτυχιακές σπουδές στην Ενέργεια: Στρατηγική, Δίκαιο και Οικονομία του
Πανεπιστήμιου Πειραιά. Εργάζεται επί σειρά ετών σε ηγέτιδα εταιρεία στον
χώρο της ενέργειας (πετρελαιοειδή) στην Ελλάδα σε διάφορα αντικείμενα όπως
stock control, logistics, business/financial analysis, risk management & trading.
Οι θέσεις που αναφέρονται είναι αποκλειστικά του συγγραφέα.