the global wind outlook - global wind energy council · hydro 17% onshore wind 8% utility-scale pv,...
TRANSCRIPT

Global Wind Power Installations & Financing Outlook Vietnam Wind Power Conference, 2019
Ashish Sethia
June 11, 2019
@asethia@BloombergNEF

1 June 11, 2019
Sustainable materials
& circular economy
BloombergNEFStrategies for a cleaner future Solar Wind Storage Decentralized
energy
Frontier power Heat Impact on
power & utilities
IoT technologies
& platformsAdvanced
analytics
& automation
Digital business
model evolutionDigitialization of
energy, industry
& supply chains
Electrified
transportMobility
services
Connected &
autonomous
vehicles
Impact on
transport
Impact on
oil & power
Carbon Power markets Oil & products
Gas & LNG Chemicals Metals
3D printing &
green manufacturing
Composites, bioplastics &
new materials
Impact on industrials,
utilities & manufacturing
Policy
Economics
& forecasts
Sustainability
Innovation
& tech
Finance

2 June 11, 2019
Source: The Institute of Future, Gartner
Amara’s Law & Hype Cycles“We tend to overestimate the effect of a technology in the short run and
underestimate the effect in the long run”, Roy Amara

3 June 11, 2019
Technology led transitions of the past
Selected technologies’ penetration of U.S. households
Source: Michael Felton, NY tImes, https://www.census.gov/history/pdf/sipp-data-appliances.pdf

4 June 11, 2019
Source: BloombergNEF
How far are we in the energy transition?
Renewable
power (18%)Rooftop
solar (~2%)
Natural gas
power (35%)
Current penetration of selected technologies in power generation, U.S.

5 June 11, 2019
-
200
400
600
800
1,000
1,200
Cumulative GW
Small-scale PV
Utility-scale PV
Offshorewind
Onshorewind
Source: Bloomberg NEF.
Wind and solar are at terawatt scale, storage is accelerating
Global wind and solar installations Global stationary energy storage installations
0
1
2
3
4
5
6
7
8
9
10
2010 2011 2012 2013 2014 2015 2016 2017 2018
Cumulative GW
EMEA
AMER
APAC

6 June 11, 2019
Source: BloombergNEF Note: the PV LCOE is for a tracking PV system.
PV tracking capacity factors in the US: 14%-30% in 2018 and onshore
wind: 29%-49% in 2018
Source: BloombergNEF Note: PV capacity factors in China: 12%-18%
in 2018, onshore wind 23%-32%. Coal and gas plants LCOEs include
a carbon price.
China U.S.
Utility-scale PV
CCGT
Onshore wind
Coal
0
20
40
60
80
100
2018 2025 2030 2035 2040 2045 2050
LCOE ($/MWh, real 2017)
Utility-scale PV
Onshore wind
CCGT
Coal
0
10
20
30
40
50
60
70
80
2018 2025 2030 2035 2040 2045 2050
LCOE ($/MWh, real 2017)
Tipping point 1: new renewables vs new fossils

7 June 11, 2019
Source: BloombergNEF. Note: PV capacity factors in India: 18%-20%
in 2018, onshore wind 25%-35%.
Source: BloombergNEF Note: the PV LCOE is for a tracking PV system.
PV tracking capacity factors in the US: 14%-30% in 2018 and onshore
wind: 29%-49% in 2018
U.S. India
Tipping point 2: new renewables vs existing fossils
CCGT
Utility-scale PV
Coal
Onshore wind
0
10
20
30
40
50
60
70
80
2018 2025 2030 2035 2040 2045 2050
LCOE vs running costs ($/MWh, 2017 real)
CCGT
Utility-scale PV
Coal
Onshore wind
0
10
20
30
40
50
60
2018 2025 2030 2035 2040 2045 2050
LCOE vs running costs ($/MWh, 2017 real)

8 June 11, 2019
Source: BloombergNEF
Total installed capacity, 2017 (GW) Total installed capacity, 2050 (GW)
79% of new power generating capacity will be renewable
Coal30%
Gas19%
Peaker Gas4%
Oil5%
Nuclear5%
Hydro17%
Onshore wind8%
Utility-scale PV, 4%
6,596GW
Coal5% Gas
9%Peaker
Gas6%
Nuclear2%
Hydro9%
Onshore wind15%
Offshore wind2%
Utility-scale PV
28%
Small-scale PV
12%
16,977GW
Flexible
capacity
9%
Half a decade for the next wind and solar TW

9 June 11, 2019
Source: BloombergNEF
Global investment in power generation by
region, 2018-2050
Asia Pacific investment in power generation by
region, 2018-2050
$0.5
$1.6
$1.9
$1.9
$5.6
ROW
META
AMER
Europe
APAC
Cumulative investment ($tn, 2017 real)
$0.1
$0.2
$0.3
$0.5
$1.6
$2.7
Australia
South Korea
Japan
Southeast Asia
India
China
Cumulative investment ($tn, 2017 real)
Coal Gas Oil Nuclear Hydro Wind Solar Other
Asia needs ~1/2 of global power generation investment

10 June 11, 2019
Source: Bloomberg NEF. Notes: Data for 2008-22 from 3Q 2018 Global Wind Market Outlook; 2023-40 data from New Energy Outlook 2018.
0
20
40
60
80
100
120
140
160
2010 2015 2020 2025 2030 2035 2040
Gigawatts
Commissioning year
Historic
Global onshore wind forecast

11 June 11, 2019
0
20
40
60
80
100
120
140
160
2010 2015 2020 2025 2030 2035 2040
Gigawatts
Commissioning year
HistoricShortterm
189GW
Global onshore wind forecast
Source: Bloomberg NEF. Notes: Data for 2008-22 from 3Q 2018 Global Wind Market Outlook; 2023-40 data from New Energy Outlook 2018.

12 June 11, 2019
0
20
40
60
80
100
120
140
160
2010 2015 2020 2025 2030 2035 2040
Gigawatts
Commissioning year
HistoricShortterm
Mediumterm
330GW
189GW
Global onshore wind forecast
Source: Bloomberg NEF. Notes: Data for 2008-22 from 3Q 2018 Global Wind Market Outlook; 2023-40 data from New Energy Outlook 2018.

13 June 11, 2019
0
20
40
60
80
100
120
140
160
180
2010 2015 2020 2025 2030 2035 2040
Gigawatts
Commissioning year
HistoricShortterm
Mediumterm
Long term
≈1,800GW
330GW
189GW
Global onshore wind forecast
Source: Bloomberg NEF. Notes: Data for 2008-22 from 3Q 2018 Global Wind Market Outlook; 2023-40 data from New Energy Outlook 2018.

14 June 11, 2019
0
20
40
60
80
100
120
140
160
180
2010 2015 2020 2025 2030 2035 2040
Gigawatts
Commissioning year
HistoricShortterm
Mediumterm
Long term
Feed-in-tariffs
Subsidies
Auctions
Hybrid
Economic build
Subsidy-free?
Wind project revenue drivers
Source: Bloomberg NEF. Notes: Data for 2008-22 from 3Q 2018 Global Wind Market Outlook; 2023-40 data from New Energy Outlook 2018.

15 June 11, 2019
Source: BloombergNEF . Note: Chart is for offsite PPAs only. APAC capacity is estimated. Figures are subject to change and may be updated as more
information is made available.
Corporate PPAs create new routes to market
1.5 3.4 2.4 3.9
9.1
0.8
2.32.0
0
12
24
36
48
60
0
3
6
9
12
15
2009 10 11 12 13 14 15 16 17 18 19YTD
Annual volume (GW)
AMER EMEA APAC Cumulative
Cumulative volume (GW)
0.3 0.1 0.3 0.3 1.02.2
4.6 4.26.2
13.4

16 June 11, 2019
MWhCost of
finance
Source: BloombergNEF
All project inputs have combined to drag down prices…
Capex O&M
≈

17 June 11, 2019
Source: BloombergNEF Note: Data shows levelized average winning date by commissioning date. Bids have been levelized to account for
indexation, exchange rate, tariff duration and expected merchant tail.
Competitive auctions have resulted in cost drops
8th capacity auction
25th energy auction
26th energy auction
27th energy auction 28th energy auction
Vietnam FiT
IV
VII & V
IIIII
I
II III IV V
1st auction
3rd auction
0
10
20
30
40
50
60
70
80
2016 2017 2018 2019 2020 2021 2022 2023 2024 2025
$2017/MWh
Brazil
Vietnam FiT
Germany
India SECI
Mexico

18 June 11, 2019
Source: BloombergNEF
1.501.58
1.831.72
1.481.45
1.24
1.29
1.231.22
1.171.16
1.10
1.20
1.13
1.12
1.03
1.071.02
0.890.89
0.820.78
0.79
0.00.20.40.60.81.01.21.41.61.82.0
1H 2H 1H 2H 1H 2H 1H 2H 1H 2H 1H 2H 1H 2H 1H 2H 1H 2H 1H 2H 1H 2H 1H 2H
2008 2009 2010 2011 2012 2013 2014 2015 2016 2017 2018 2019
$m/MW
Wind turbine prices have declinedGlobal turbine price index by delivery date, 2H 2018

19 June 11, 2019
Source: BloombergNEF Note: Pricing for full-service initial agreements only. This includes routine and unscheduled maintenance, minor and major
component parts and labor.
O&M prices are falling too
39.1
50.6
45.0
51.1
35.4
50.0
28.8
21.3
26.4
20.518.1
0
10
20
30
40
50
60
2008 2009 2010 2011 2012 2013 2014 2015 2016 2017 2018
Thousand $/MW/yr
Full-service initial O&M contract pricing

20 June 11, 2019
Source: BloombergNEF
75MW
299MW
0%
10%
20%
30%
40%
50%
60%
70%
1980 1990 2000 2010 2020 2030 2040
Year
Capacity Factor (%)
Global forecast
Operational projects
weightedaverage
Onshore wind capacity factors are rising 1% point year-on-year
Historic and forecast onshore wind gross capacity factors
21 June 11, 2019
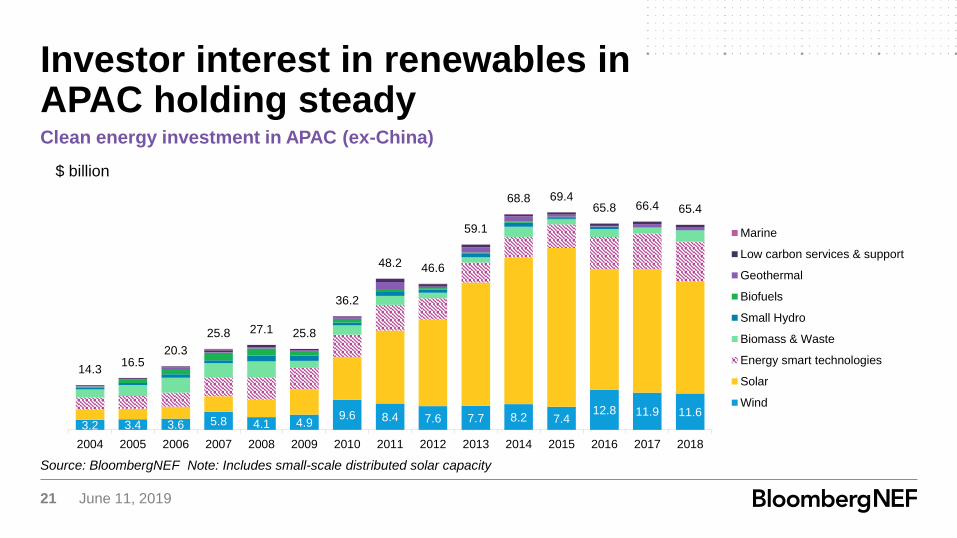
Source: BloombergNEF Note: Includes small-scale distributed solar capacity
Investor interest in renewables in APAC holding steadyClean energy investment in APAC (ex-China)
3.2 3.4 3.6 5.8 4.1 4.99.6 8.4 7.6 7.7 8.2 7.4
12.8 11.9 11.6
14.316.5
20.3
25.8 27.1 25.8
36.2
48.2 46.6
59.1
68.8 69.465.8 66.4 65.4
2004 2005 2006 2007 2008 2009 2010 2011 2012 2013 2014 2015 2016 2017 2018
$ billion
Marine
Low carbon services & support
Geothermal
Biofuels
Small Hydro
Biomass & Waste
Energy smart technologies
Solar
Wind

22 June 11, 2019
Source: Bloomberg Note: Reflective of fixed-for-floating swap rates.
Cheap debt is helping
Swap rates for select tenors and countries

23 June 11, 2019
Source: BloombergNEF Green Bonds Tool
4.214.7
37.3
51.7
103.1
173.6182.1
0
20
40
60
80
100
120
140
160
180
200
2012 2013 2014 2015 2016 2017 2018
$ billionHealth care
Consumer staples
Technology
Materials
Consumer discretionary
Industrial
U.S. municipal
Energy
Utilities
Government
Financial
Green bond issuance growing

24 June 11, 2019
Source: BloombergNEF Note: includes renewable energy and energy efficiency
Clean energy IPOs still too far and few
0
2
4
6
8
10
12
14
16
18
20
'04 '05 '06 '07 '08 '09 '10 '11 '12 '13 '14 '15 '16 '17 '18
$bn
EMEA
APAC
AMER

25 June 11, 2019
Source: BloombergNEF Note: includes renewable energy and energy efficiency
But clean energy M&A rising steadily
0
20
40
60
80
100
120
140
160
180
'04 '05 '06 '07 '08 '09 '10 '11 '12 '13 '14 '15 '16 '17 '18
$bn
APAC
EMEA
AMER

26 June 11, 2019
0.0
10.0
20.0
30.0
40.0
50.0
60.0
0 20 40 60 80 100 120 140 160 180 200
Brazil
India
Canada
Mexico
Spain
Peru
Denmark
Uruguay
Italy
France
Panama
Estonia
Poland
Vietnam
Kenya
South Korea
Indonesia
$0/MWhRange 1H 2018 (mid) Mid
Source: BloombergNEF. Note: LCOE for a project starting construction in 2H 2018.
LCOEs in leading markets at $40-50/MWh
2H 2018 onshore wind LCOE

27 June 11, 2019
Source: BloombergNEF Note: Survey done in 2018.
Risks remain even in high-deployment markets
Financiers Risks IPPs
Financiers that ranked the parameter among the top two risks
IPPs that ranked the parameter among the top two risks
Curtailment - grid or offtake
Regulatory risks
Payment delays
Resource estimation errors
Land acquisition risks
Forex risks
Plant downtime
71% 86%
43% 71%
57% 14%
14% 0%
14% 29%
0% 0%
0% 0%
Perception of risk in Indian renewables projects

28 June 11, 2019
The Bloomberg NEF ("BNEF"), service/information is derived from selected public sources. Bloomberg Finance L.P. and its affil iates, in providing the
service/information, believe that the information it uses comes from reliable sources, but do not guarantee the accuracy or completeness of this information, which is
subject to change without notice, and nothing in this document shall be construed as such a guarantee. The statements in this service/document reflect the current
judgment of the authors of the relevant articles or features, and do not necessarily reflect the opinion of Bloomberg Finance L.P., Bloomberg L.P. or any of their
affiliates (“Bloomberg”). Bloomberg disclaims any liability arising from use of this document, its contents and/or this service. Nothing herein shall constitute or be
construed as an offering of financial instruments or as investment advice or recommendations by Bloomberg of an investment or other strategy (e.g., whether or not
to “buy”, “sell”, or “hold” an investment). The information available through this service is not based on consideration of a subscriber’s individual circumstances and
should not be considered as information sufficient upon which to base an investment decision. You should determine on your own whether you agree with the
content. This service should not be construed as tax or accounting advice or as a service designed to facilitate any subscriber’s compliance with its tax, accounting or
other legal obligations. Employees involved in this service may hold positions in the companies mentioned in the services/information.
The data included in these materials are for illustrative purposes only. The BLOOMBERG TERMINAL service and Bloomberg data products (the “Services”) are
owned and distributed by Bloomberg Finance L.P. (“BFLP”) except that Bloomberg L.P. and its subsidiaries (“BLP”) distribute these products in Argentina, Australia
and certain jurisdictions in the Pacific islands, Bermuda, China, India, Japan, Korea and New Zealand. BLP provides BFLP with global marketing and operational
support. Certain features, functions, products and services are available only to sophisticated investors and only where permitted. BFLP, BLP and their affiliates do
not guarantee the accuracy of prices or other information in the Services. Nothing in the Services shall constitute or be construed as an offering of financial
instruments by BFLP, BLP or their affiliates, or as investment advice or recommendations by BFLP, BLP or their affiliates of an investment strategy or whether or not
to “buy”, “sell” or “hold” an investment. Information available via the Services should not be considered as information suff icient upon which to base an investment
decision. The following are trademarks and service marks of BFLP, a Delaware limited partnership, or its subsidiaries: BLOOMBERG, BLOOMBERG ANYWHERE,
BLOOMBERG MARKETS, BLOOMBERG NEWS, BLOOMBERG PROFESSIONAL, BLOOMBERG TERMINAL and BLOOMBERG.COM. Absence of any trademark
or service mark from this list does not waive Bloomberg's intellectual property rights in that name, mark or logo. All rights reserved. © 2019 Bloomberg.
Copyright and disclaimer

Coverage.
Clean energy
Advanced transport
Commodities
Digital industry
Bloomberg NEF (BNEF) is a leading provider
of primary research on clean energy,
advanced transport, digital industry,
innovative materials, and commodities.
BNEF’s global team leverages the world’s
most sophisticated data sets to create clear
perspectives and in-depth forecasts that
frame the financial, economic and policy
implications of industry-transforming trends
and technologies.
BNEF research and analysis is accessible via
web and mobile platforms, as well as on the
Bloomberg Terminal.
Client enquiries:
Bloomberg Terminal: press <Help> key twice
Email: [email protected]
Learn more:
about.bnef.com | @BloombergNEF

30 June 11, 2019
Appendix

31 June 11, 2019
Source: BloombergNEF
0%
10%
20%
30%
40%
50%
60%
70%
80%
90%
100%
1970 1980 1990 2000 2010 2020 2030 2040 2050
Historical world power
generation mix
NEO2018 power generation
mix
Coal
Gas
Oil
Hydro
Nuclear Wind
Solar
Other
48% solar and wind
64% renewables
29% fossil fuels
50% wind and solar generation by 2050
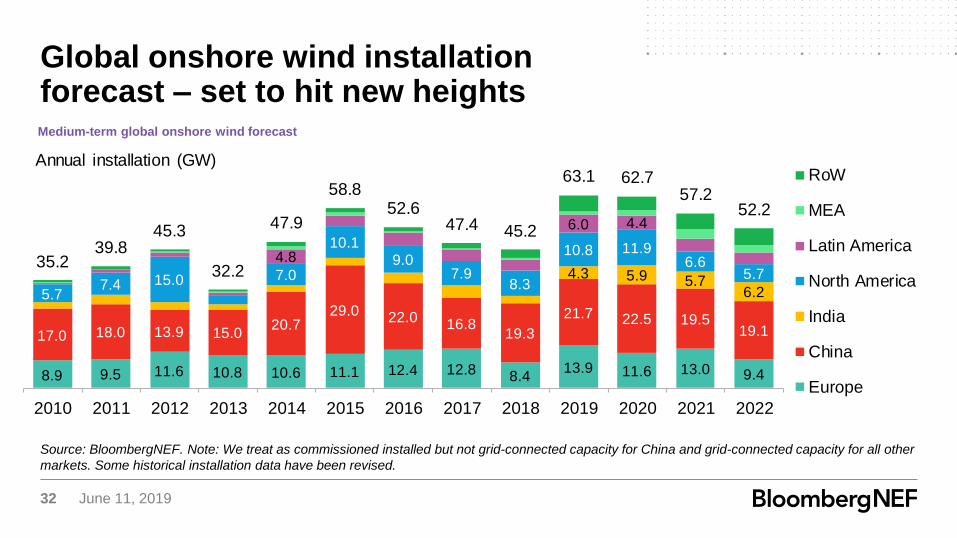
32 June 11, 2019
8.9 9.5 11.6 10.8 10.6 11.1 12.4 12.8 8.413.9 11.6 13.0 9.4
17.0 18.0 13.9 15.020.7
29.0 22.0 16.819.3
21.7 22.5 19.519.1
4.3 5.9 5.76.25.7
7.4 15.0 7.0
10.19.0
7.98.3
10.8 11.96.6
5.74.8
6.0 4.4
35.239.8
45.3
32.2
47.9
58.852.6
47.4 45.2
63.1 62.757.2
52.2
2010 2011 2012 2013 2014 2015 2016 2017 2018 2019 2020 2021 2022
Annual installation (GW)RoW
MEA
Latin America
North America
India
China
Europe
Source: BloombergNEF. Note: We treat as commissioned installed but not grid-connected capacity for China and grid-connected capacity for all other
markets. Some historical installation data have been revised.
Global onshore wind installation forecast – set to hit new heightsMedium-term global onshore wind forecast

33 June 11, 2019
Source: BloombergNEF
Vietnam forecastVietnam installation forecast
30 15
-
89
24 30 39
138
458
300
250 280
-
50
100
150
200
250
300
350
400
450
500
2012 2013 2014 2015 2016 2017 2018 2019 2020 2021 2022 2023
Annual installation (MW)
Estimate
Announced
Permitted
Financing secured
Commissioned

34 June 11, 2019
Source: BloombergNEF
Getting the admin process right is key (and hard!)
CfD Round 1
Round 3
Round 4
2014 auction
2016 auction
2016 auction 2017 tender
IV
VII & V
II III
Round 1
Round 2
Auction 1
Auction 2
Dumat Al Jandal LCOE bid
2018 auction
0
10
20
30
40
50
60
70
80
90
100
2016 2017 2018 2019 2020 2021 2022 2023 2024 2025
$2017/MWh
U.K. South Africa Italy Morocco Turkey
Germany France Greece Saudi Arabia Poland

35 June 11, 2019
Source: BloombergNEF. Note: Only includes onshore wind capacity.
Consolidation has made the turbine market more global
Global onshore turbine manufacturers market share
70%75%
82%
0%
10%
20%
30%
40%
50%
60%
70%
80%
90%
100%
2015 2016 2017 2018
Other
Windey
Guodian UP
Nordex
Ming Yang
Enercon
Envision
Siemens Gamesa
GE
Goldwind
Vestas
Top 10

36 June 11, 2019
Source: BloombergNEF.
Smart auctions design can help markets respond