the global cost of eliminating avoidable blindness
TRANSCRIPT
pwc.com.au
The price of sight
The global cost of eliminating avoidable blindness
Final Report
Consortium led by The Fred Hollows Foundation
February update 2013

The global cost of eliminating avoidable blindness PwC i
Contents
Glossary ii
Preface iii
1 Overview 1
2 Context 8
3 Global cost estimation 12
4 Lessons from the costing exercise 20
Appendix A Project methodology 24
Appendix B Assumptions 29
Appendix C Sensitivity analysis 36
Appendix D Selected data tables 41
Appendix E Bibliography 54
The global cost of eliminating avoidable blindness PwC and Three Rivers Consulting ii
Glossary
FHF The Fred Hollows Foundation
GP General practitioner
IAPB International Agency for the Prevention of Blindness
KPI Key Performance Indicators
NGO Non-government organisation
PwC PricewaterhouseCoopers
USD United States Dollars
WHO World Health Organization
The information, statements, statistics and commentary (together , the ‘Information’) contained in this report have been prepared by PwC from material provided by the consortium of NGOs listed below, and from data provided by sources external to these organisations. PwC may, at its absolute discretion and without any obligation to do so, update, amend or supplement this document.
PwC does not express an opinion as to the accuracy or completeness of the information provided, the assumptions made by the parties that provided the information or any conclusions reached by those parties. PwC disclaims any and all liability arising from actions taken in response to this report. PwC disclaims any and all liability for any investment or strategic decisions made as a consequence of information contained in this report. PwC, its employees, and any persons associated with the preparation of the enclosed documents are in no way responsible for any errors or omissions in the enclosed document resulting from any inaccuracy, misdescription or incompleteness of information provided or from assumptions made or opinions reached by the parties that provided information.
The global cost of eliminating avoidable blindness PwC and Three Rivers Consulting iii
Preface
In 2010 around 32.4 million people in the world were blind. Of these, 90% live in the developing world – so straight away we know that this is not just a medical problem. In addition, 80% of the cases of blindness were avoidable or treatable. The majority of people living with blindness were women. Most blind people need someone to care for them, and this is usually a child, more often than not a little girl, and that child often misses out on the chance of an education because of their responsibilities. A further 190.6 million people were visually impaired to the point that their ability to function, to participate, to learn and to work is negatively impacted.
Organizations which sponsored and participated in this study are among those committed to the global elimination of avoidable blindness. We are all members of the International Agency for the Prevention of Blindness (IAPB) which in 1999 joined in a partnership with the World Health Organization to launch a campaign called VISION 2020: The Right to Sight. The campaign is articulated through a strategy focusing on three main pillars: disease control and prevention of visual impairment, human resource development and the provision of necessary infrastructure and technology. These three pillars are underpinned by efforts in community education, advocacy supporting appropriate resource mobilization and national ownership of eye health plans, and ongoing research.
In early 2011 a number of us spoke with the global firm of PricewaterhouseCoopers (PwC) and the newly formed Three Rivers Consulting, posing the challenge of costing the realisation of the VISION 2020 strategy. Recognizing that sustainably achieving the strategy means addressing the current and anticipated backlog while at the same time embedding sufficient and appropriate eye health resources and practices within national primary and secondary health systems, we did not underestimate the enormity of the challenge.
The report that follows is an important contribution to the global efforts to eliminate avoidable blindness. It establishes a costing methodology which can be debated, refined and complemented. It highlights the increasingly recognised need for better eye health data and data collection methods and systems, a need shared by all areas of national and global health efforts. It draws attention to the vast difference in costs between developed and developing world settings. And finally, recognizing the numerous limitations and generalizations necessary to reach a conclusion, it puts forward an estimate of the global “price of sight”.
In this important piece of research we are presented with an estimate which gives us the basis for planning our global efforts. That estimate shows us that while the total costs are significant, they in fact represent a global increase of around 7% over current eye health expenditure. And of that 7%, over two thirds of the increased expenditure is required in the developed world rather than in the poorer countries where most of us focus our efforts.
On behalf of each of the organizations sponsoring this important study, the Secretariat of the International Agency for the Prevention of Blindness, Sightsavers International, CBM, Operation Eyesight Universal, Light for the World and The Fred Hollows Foundation, I express our thanks to those who participated and to PricewaterhouseCoopers and Three Rivers Consulting for this important contribution to our global efforts.
Brian Doolan CEO The Fred Hollows Foundation August 2011
PricewaterhouseCoopers, ABN 52 780 433 757 Darling Park Tower 2, 201 Sussex Street, GPO BOX 2650, SYDNEY NSW 1171 DX 77 Sydney, Australia T +61 2 8266 0000, F +61 2 8266 9999, www.pwc.com.au Liability limited by a scheme approved under Professional Standards Legislation.
Mr Brian Doolan Chief Executive Officer The Fred Hollows Foundation Level 2, 61 Dunning Avenue Rosebery NSW 2018
August 2011
Dear Brian Subject: The global cost of eliminating avoidable blindness We are pleased to provide our report analysing the cost to eliminate avoidable blindness by 2020. These estimates focus on the direct investment required globally to implement VISION 2020.
Our approach in developing the cost estimates included consultations with key informants as well as a data collection process. The resulting cost estimates use both publicly available data as well as data sourced from the sponsoring organisations. We developed the cost estimates using a health systems framework that adds the recurrent cost of the present state of eye health to the additional investment required to reach the recurrent cost of ideal eye health care.
We would like to thank The Fred Hollows Foundation, the International Agency for the Prevention of Blindness (IAPB), Sightsavers International, CBM, Operation Eyesight Universal, and Light for the World for their support throughout this study, and we trust that this report makes a valuable contribution to the understanding of the cost of eliminating avoidable blindness.
Yours sincerely
Jeremy Thorpe Partner Economics and Policy
The global cost of eliminating avoidable blindness PwC and Three Rivers Consulting 1
1 Overview
The Fred Hollows Foundation (FHF) as the lead representative of a consortium of non-government organisations (NGOs) — the International Agency for the Prevention of Blindness (IAPB), Sightsavers International, CBM, Operation Eyesight Universal, and Light for the World — engaged PwC, with the assistance of Three Rivers Consulting, to estimate the global costs of eliminating avoidable blindness.
This work follows the initial 2008 IAPB estimate which focussed only on developing countries and the cost of providing treatment services (not including primary health care or preventative health services) but used a broader scope.
Global avoidable blindness
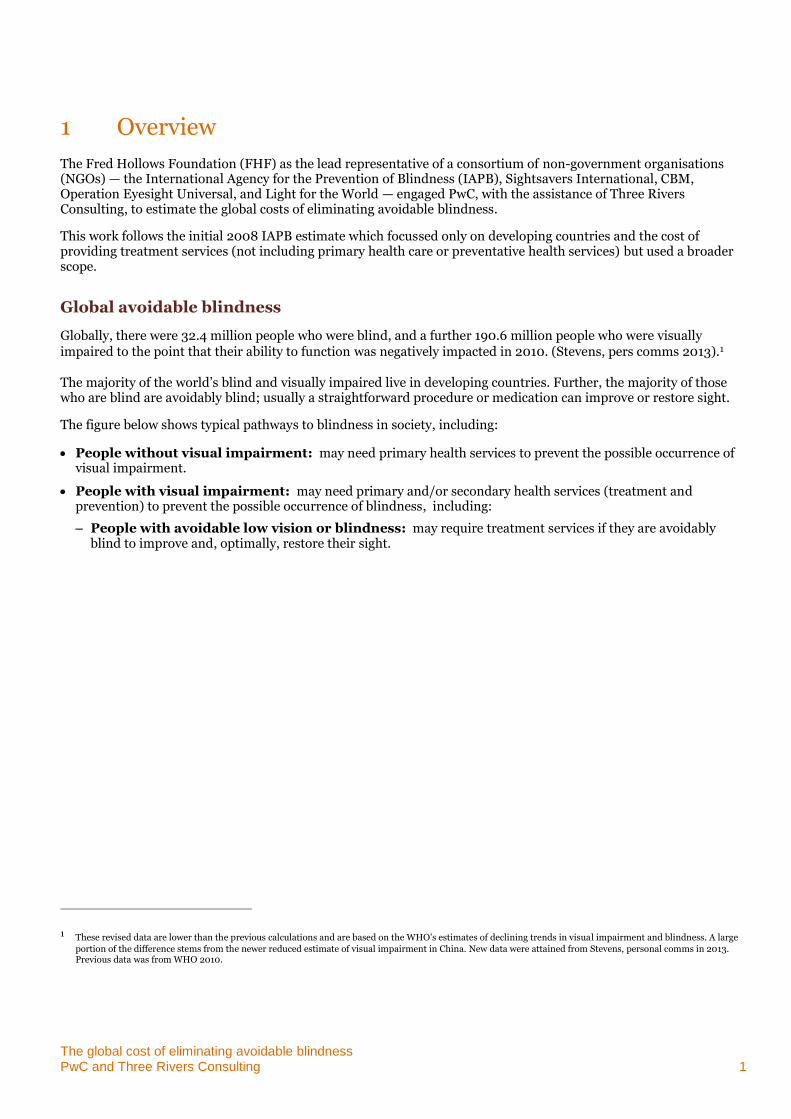
Globally, there were 32.4 million people who were blind, and a further 190.6 million people who were visually impaired to the point that their ability to function was negatively impacted in 2010. (Stevens, pers comms 2013).1
The majority of the world’s blind and visually impaired live in developing countries. Further, the majority of those who are blind are avoidably blind; usually a straightforward procedure or medication can improve or restore sight.
The figure below shows typical pathways to blindness in society, including:
People without visual impairment: may need primary health services to prevent the possible occurrence of visual impairment.
People with visual impairment: may need primary and/or secondary health services (treatment and prevention) to prevent the possible occurrence of blindness, including:
– People with avoidable low vision or blindness: may require treatment services if they are avoidably blind to improve and, optimally, restore their sight.
1 These revised data are lower than the previous calculations and are based on the WHO’s estimates of declining trends in visual impairment and blindness. A large
portion of the difference stems from the newer reduced estimate of visual impairment in China. New data were attained from Stevens, personal comms in 2013. Previous data was from WHO 2010.
Overview
The global cost of eliminating avoidable blindness PwC and Three Rivers Consulting 2
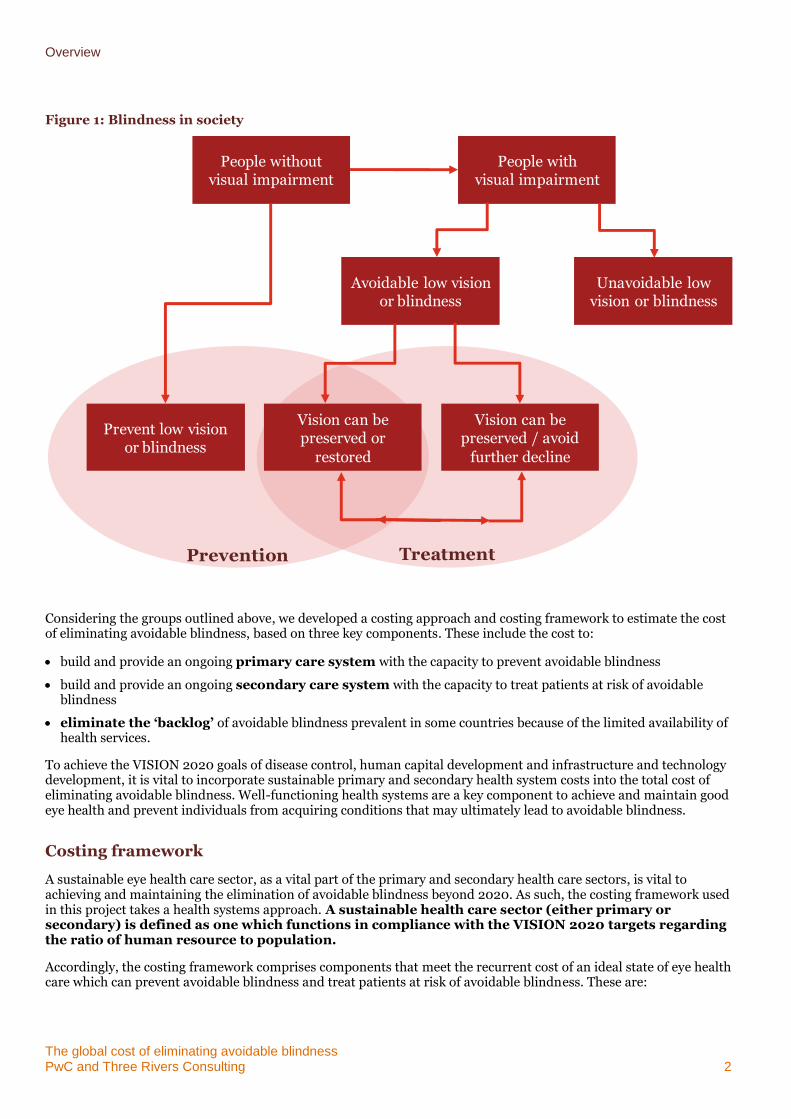
Figure 1: Blindness in society
Considering the groups outlined above, we developed a costing approach and costing framework to estimate the cost of eliminating avoidable blindness, based on three key components. These include the cost to:
build and provide an ongoing primary care system with the capacity to prevent avoidable blindness
build and provide an ongoing secondary care system with the capacity to treat patients at risk of avoidable blindness
eliminate the ‘backlog’ of avoidable blindness prevalent in some countries because of the limited availability of health services.
To achieve the VISION 2020 goals of disease control, human capital development and infrastructure and technology development, it is vital to incorporate sustainable primary and secondary health system costs into the total cost of eliminating avoidable blindness. Well-functioning health systems are a key component to achieve and maintain good eye health and prevent individuals from acquiring conditions that may ultimately lead to avoidable blindness.
Costing framework
A sustainable eye health care sector, as a vital part of the primary and secondary health care sectors, is vital to achieving and maintaining the elimination of avoidable blindness beyond 2020. As such, the costing framework used in this project takes a health systems approach. A sustainable health care sector (either primary or secondary) is defined as one which functions in compliance with the VISION 2020 targets regarding the ratio of human resource to population.
Accordingly, the costing framework comprises components that meet the recurrent cost of an ideal state of eye health care which can prevent avoidable blindness and treat patients at risk of avoidable blindness. These are:
People without visual impairment
People withvisual impairment
Avoidable low vision or blindness
Unavoidable low vision or blindness
Prevent low vision or blindness
Vision can be preserved or
restored
Vision can be preserved / avoid
further decline
Prevention Treatment
Overview
The global cost of eliminating avoidable blindness PwC and Three Rivers Consulting 3
the cost of the recurrent cost of the present state of eye health care
the cost of the expansion required to achieve the ideal workforce level between status quo scenario and the VISION 2020 human resource to population ratio targets.
The ideal state is to be achieved by the year 2020. Accordingly, investment required to achieve the necessary expansion to reach the ideal state has been spread across each year to 2020. Beyond 2020, it is expected that only recurrent costs of maintaining the ideal health system (costs pertaining to primary and secondary services, workforce training relating to turnover and capital depreciation) will continue.
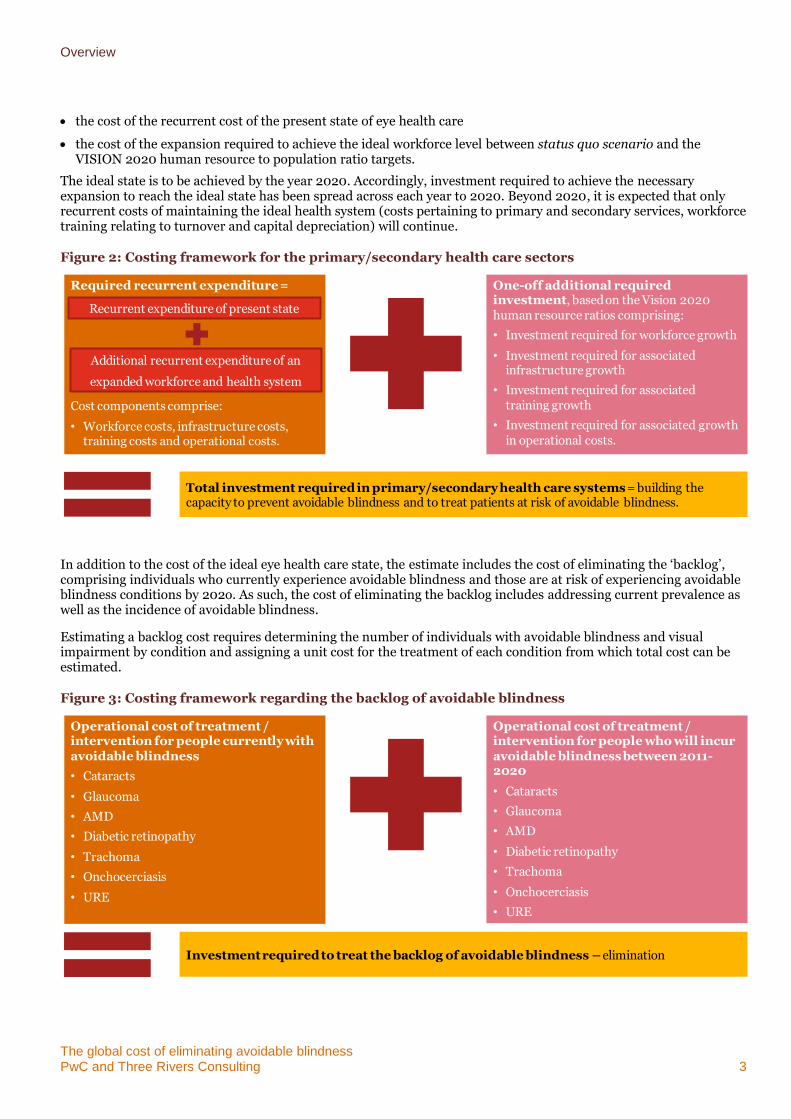
Figure 2: Costing framework for the primary/secondary health care sectors
In addition to the cost of the ideal eye health care state, the estimate includes the cost of eliminating the ‘backlog’, comprising individuals who currently experience avoidable blindness and those are at risk of experiencing avoidable blindness conditions by 202o. As such, the cost of eliminating the backlog includes addressing current prevalence as well as the incidence of avoidable blindness.
Estimating a backlog cost requires determining the number of individuals with avoidable blindness and visual impairment by condition and assigning a unit cost for the treatment of each condition from which total cost can be estimated.
Figure 3: Costing framework regarding the backlog of avoidable blindness
Required recurrent expenditure =
Cost components comprise:
• Workforce costs, infrastructure costs, training costs and operational costs.
One-off additional required investment, based on the Vision 2020 human resource ratios comprising:
• Investment required for workforce growth
• Investment required for associated infrastructure growth
• Investment required for associated training growth
• Investment required for associated growth in operational costs.
Total investment required in primary/secondary health care systems = building the capacity to prevent avoidable blindness and to treat patients at risk of avoidable blindness.
Recurrent expenditure of present state
Additional recurrent expenditure of an
expanded workforce and health system
Operational cost of treatment / intervention for people currently with avoidable blindness
• Cataracts
• Glaucoma
• AMD
• Diabetic retinopathy
• Trachoma
• Onchocerciasis
• URE
Operational cost of treatment / intervention for people who will incur avoidable blindness between 2011-2020
• Cataracts
• Glaucoma
• AMD
• Diabetic retinopathy
• Trachoma
• Onchocerciasis
• URE
Investment required to treat the backlog of avoidable blindness – elimination
Overview
The global cost of eliminating avoidable blindness PwC and Three Rivers Consulting 4
The estimated global cost of eliminating avoidable blindness
Based on this approach and the costing framework, the cost of eliminating avoidable blindness was estimated. Key results include:
The direct health cost/investment required to treat the backlog of avoidable blindness over ten years (2011 to 2020) is estimated to be $23.1 billion.2
The estimated additional investment required to eliminate avoidable blindness (in addition to costs already incurred) is $394.2 billion over the ten year period from 2011 to 20203. These results are shown in Table 1.
– The estimated additional investment required in the primary health care sector is the largest component, at $308.4 billion, followed by the secondary health care sector at $62.7 billion over the ten year period.
– Expressed another way, the additional investment required to eliminate global avoidable blindness is an average of $5.70 per person per year over this ten year period. This is an investment of $2.20 per person per year in developing countries.
– Excluding high income countries, the additional investment required to eliminate avoidable blindness is estimated to be $128.2 billion.
Drawing on these estimates, the total global direct health cost of avoidable blindness including recurrent primary and secondary eye care service costs is estimated to be $6.3 trillion (USD 2009) over the ten year period, 2011 to 2020. This estimate includes both the direct health costs already incurred and the additional investment required.
2 The cost of treating the backlog of macular degeneration cases has not been included because it is considered to be prohibitively high and evidence to support the
impact of treatment on ceasing blindness is continuing to evolve.
3 Costs are expressed in USD nominal terms, using a 2009 3 year average GDP inflator to determine indexation.
Overview
The global cost of eliminating avoidable blindness PwC and Three Rivers Consulting 5
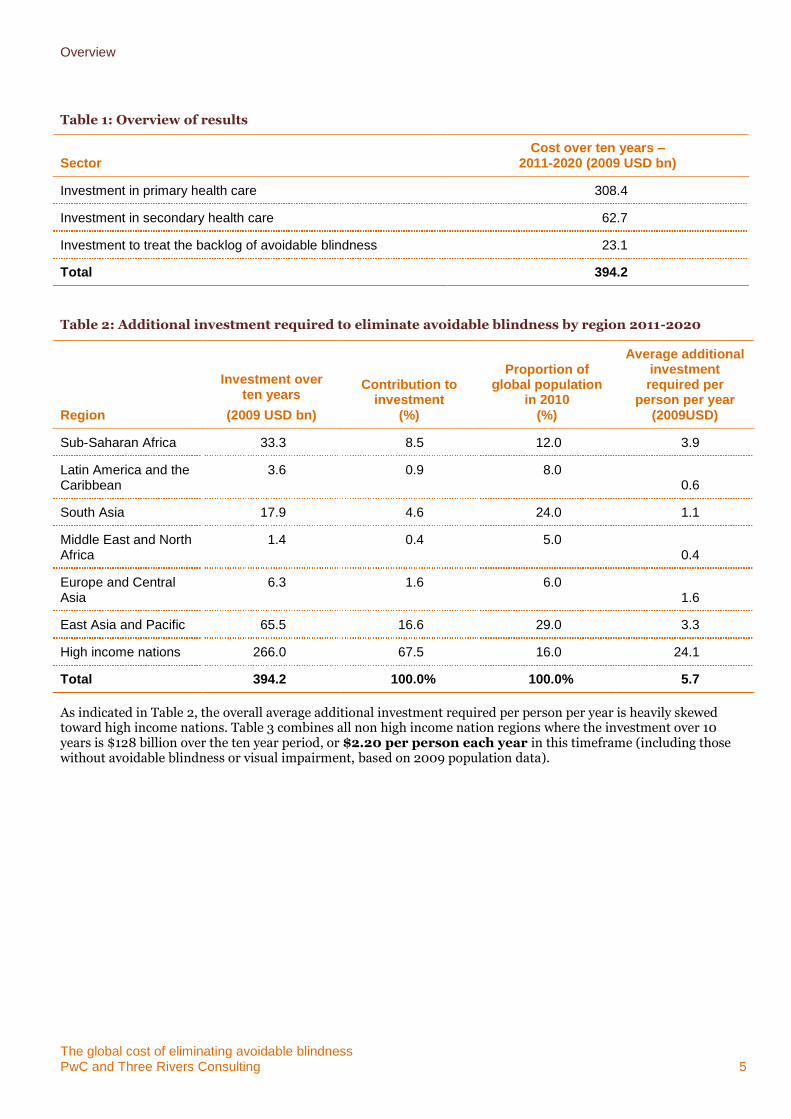
Table 1: Overview of results
Sector Cost over ten years –
2011-2020 (2009 USD bn)
Investment in primary health care 308.4
Investment in secondary health care 62.7
Investment to treat the backlog of avoidable blindness 23.1
Total 394.2
Table 2: Additional investment required to eliminate avoidable blindness by region 2011-2020
Region
Investment over ten years
(2009 USD bn)
Contribution to investment
(%)
Proportion of global population
in 2010 (%)
Average additional investment required per
person per year (2009USD)
Sub-Saharan Africa 33.3 8.5 12.0 3.9
Latin America and the Caribbean
3.6 0.9 8.0 0.6
South Asia 17.9 4.6 24.0 1.1
Middle East and North Africa
1.4 0.4 5.0 0.4
Europe and Central Asia
6.3 1.6 6.0 1.6
East Asia and Pacific 65.5 16.6 29.0 3.3
High income nations 266.0 67.5 16.0 24.1
Total 394.2 100.0% 100.0% 5.7
As indicated in Table 2, the overall average additional investment required per person per year is heavily skewed toward high income nations. Table 3 combines all non high income nation regions where the investment over 10 years is $128 billion over the ten year period, or $2.20 per person each year in this timeframe (including those without avoidable blindness or visual impairment, based on 2009 population data).
Overview
The global cost of eliminating avoidable blindness PwC and Three Rivers Consulting 6
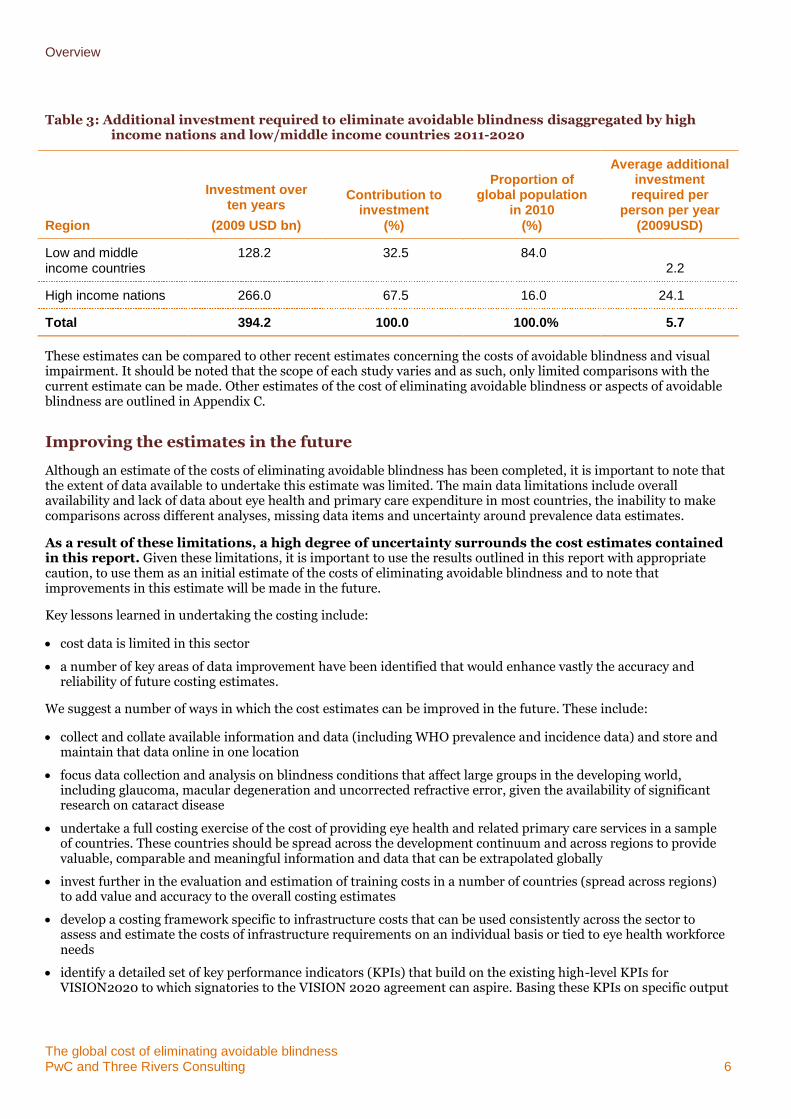
Table 3: Additional investment required to eliminate avoidable blindness disaggregated by high income nations and low/middle income countries 2011-2020
Region
Investment over ten years
(2009 USD bn)
Contribution to investment
(%)
Proportion of global population
in 2010 (%)
Average additional investment required per
person per year (2009USD)
Low and middle income countries
128.2 32.5 84.0 2.2
High income nations 266.0 67.5 16.0 24.1
Total 394.2 100.0 100.0% 5.7
These estimates can be compared to other recent estimates concerning the costs of avoidable blindness and visual impairment. It should be noted that the scope of each study varies and as such, only limited comparisons with the current estimate can be made. Other estimates of the cost of eliminating avoidable blindness or aspects of avoidable blindness are outlined in Appendix C.
Improving the estimates in the future
Although an estimate of the costs of eliminating avoidable blindness has been completed, it is important to note that the extent of data available to undertake this estimate was limited. The main data limitations include overall availability and lack of data about eye health and primary care expenditure in most countries, the inability to make comparisons across different analyses, missing data items and uncertainty around prevalence data estimates.
As a result of these limitations, a high degree of uncertainty surrounds the cost estimates contained in this report. Given these limitations, it is important to use the results outlined in this report with appropriate caution, to use them as an initial estimate of the costs of eliminating avoidable blindness and to note that improvements in this estimate will be made in the future.
Key lessons learned in undertaking the costing include:
cost data is limited in this sector
a number of key areas of data improvement have been identified that would enhance vastly the accuracy and reliability of future costing estimates.
We suggest a number of ways in which the cost estimates can be improved in the future. These include:
collect and collate available information and data (including WHO prevalence and incidence data) and store and maintain that data online in one location
focus data collection and analysis on blindness conditions that affect large groups in the developing world, including glaucoma, macular degeneration and uncorrected refractive error, given the availability of significant research on cataract disease
undertake a full costing exercise of the cost of providing eye health and related primary care services in a sample of countries. These countries should be spread across the development continuum and across regions to provide valuable, comparable and meaningful information and data that can be extrapolated globally
invest further in the evaluation and estimation of training costs in a number of countries (spread across regions) to add value and accuracy to the overall costing estimates
develop a costing framework specific to infrastructure costs that can be used consistently across the sector to assess and estimate the costs of infrastructure requirements on an individual basis or tied to eye health workforce needs
identify a detailed set of key performance indicators (KPIs) that build on the existing high-level KPIs for VISION2020 to which signatories to the VISION 2020 agreement can aspire. Basing these KPIs on specific output

Overview
The global cost of eliminating avoidable blindness PwC and Three Rivers Consulting 7
and outcome measures will encourage consistent data collection that can be used in future studies. Such an approach will become more critical in the future as development agencies and health service investors seek to enhance their understanding of the impact of their investment. It will also inform the decisions of NGOs about cost-effective interventions.
Improving these cost estimates in the future will lead to greater accuracy and transparency in the estimates of eliminating avoidable blindness. Such improvements will enable more advanced cost assessments, including cost-effectiveness analysis that can provide governments, NGOs and other stakeholders in the sector with a meaningful assessment of the true impact of investment in eye health and in eliminating avoidable blindness.
Structure of this report
The structure of the remainder of this report is as follows.
Report
Chapter 2: Context – Provides an overview of global blindness including the role of the non-government sector in providing care as well as a more detailed outline of the project brief
Chapter 3: Global cost estimate – Provides key tables detailing the global cost estimates to eliminate global blindness by health care sector and region
Chapter 4: Lessons from the costing exercise –Discusses the main challenges to undertaking this costing analysis in addition to suggestions for improving data availability in the future
Appendices
Appendix A: Project methodology – Outlines the costing frameworks used and project methodology
Appendix B: Assumptions – Details the key assumptions used to derive the cost estimates
Appendix C: Sensitivity analysis– High-level sensitivity analysis varying key assumptions within a reasonable range
Appendix D: Selected data tables– Student engagement strategies are spread across the spectrum of initiatives to improve student attendance and participation in opportunities both to extend the curriculum and provide advanced learning for students
Appendix E: Bibliography
The global cost of eliminating avoidable blindness PwC and Three Rivers Consulting 8
2 Context
2.1 Global prevalence of avoidable blindness
Avoidable blindness is classified as the subset of blindness conditions that are preventable. The World Health Organization (WHO) notes that ‘moderate visual impairment combined with severe visual impairment are grouped under the term low vision. Low vision taken together with blindness represents all visual impairment.’4
Across the globe in 2010, approximately 223 million people were visually impaired. The majority of the world’s visually impaired live in developing countries and most people with visual impairment are older. The definition of ‘visual impairment’ includes both low vision and blindness. Of those who are visually impaired 190.6 million have low vision (63% over 50 years of age) and 32.4 million are estimated to be blind (82% over 50 years of age) (Stevens, 2013).5
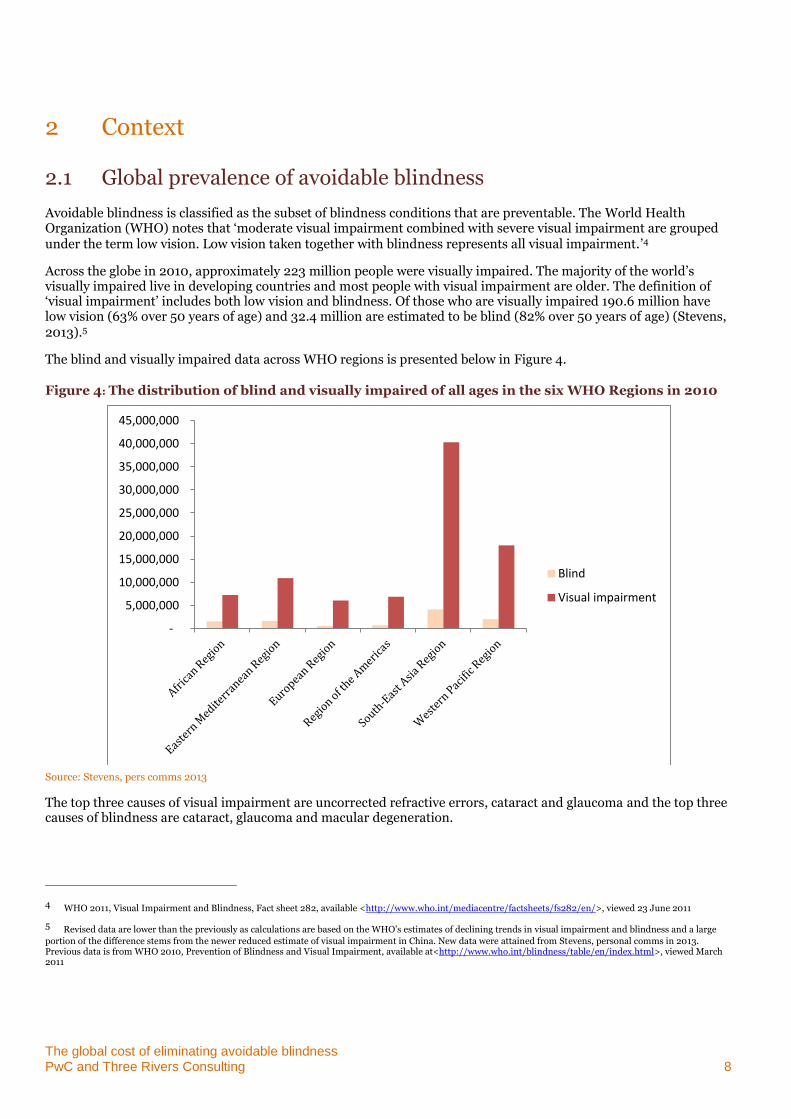
The blind and visually impaired data across WHO regions is presented below in Figure 4.
Figure 4: The distribution of blind and visually impaired of all ages in the six WHO Regions in 2010
Source: Stevens, pers comms 2013
The top three causes of visual impairment are uncorrected refractive errors, cataract and glaucoma and the top three causes of blindness are cataract, glaucoma and macular degeneration.
4 WHO 2011, Visual Impairment and Blindness, Fact sheet 282, available <http://www.who.int/mediacentre/factsheets/fs282/en/>, viewed 23 June 2011
5 Revised data are lower than the previously as calculations are based on the WHO’s estimates of declining trends in visual impairment and blindness and a large
portion of the difference stems from the newer reduced estimate of visual impairment in China. New data were attained from Stevens, personal comms in 2013. Previous data is from WHO 2010, Prevention of Blindness and Visual Impairment, available at<http://www.who.int/blindness/table/en/index.html>, viewed March 2011
-
5,000,000
10,000,000
15,000,000
20,000,000
25,000,000
30,000,000
35,000,000
40,000,000
45,000,000
Blind
Visual impairment
Context
The global cost of eliminating avoidable blindness PwC and Three Rivers Consulting 9
A global and regional reduction in visual impairment and blindness has occurred since the previous WHO estimates, largely attributable to socioeconomic development in many countries and also to the investment and work of governments and international partners in improving quality and quantity of eye care services and in developing national eye health systems. However, an increasing number of people will be at risk of visual impairment because of population growth, increased life expectancy and the ageing of the population. Additionally, as the prevalence of chronic diseases that affect the eyes (e.g. diabetes mellitus) continues to increase, more and more people will be susceptible to potentially blinding conditions.
In this project, avoidable blindness refers to specified conditions that are potentially preventable through the modification of known risk factors or for which effective treatments exist to restore sight or prevent further vision loss.6 To have the greatest possible impact on vision impairment worldwide, the subset of avoidable blindness causes that VISION 2020 addresses are:
cataract disease
glaucoma
other causes (including uncorrected refractive errors, trachoma, diabetic retinopathy, macular degeneration and onchocerciasis).
2.2 The role of the non-government sector
Historically, non-government organisations (NGOs) have played an integral part in the delivery of eye health services across many developing countries where avoidable blindness poses a significant challenge to the healthcare system.
NGOs work with local communities to improve eye care to prevent and eradicate preventable blindness through the use of proven techniques in training and surgical practice. In the past this work has focused particularly on the delivery of cataract surgery, known to be one of the most cost-effective treatments that can be offered in developing countries.7
However there are many challenges to eliminating avoidable blindness. Two major challenges are: inconsistent investment in quality of care across global eye health systems and shortage of healthcare workers.
Moving from treatment to sustainable health systems
Historically, investment from NGOs has been directed towards blindness treatment more so than developing sustainable health systems to prevent vision impairment and blindness. Increased energy and direction now exists amongst NGOs in moving towards structured programs that help to strengthen health system capacity. NGOs are training and building up the local eye health care workforce as well as building the health care systems and infrastructure that can provide sustainable quality care over the long term. The approach to invest in health system strengthening is increasingly seen as fundamental to eye health. NGOs are working in-country with health ministries to embed eye health services in the broader health system, thereby assisting in the provision of long term effective and sustainable outcomes.8
This movement has been led by the global initiative known as ‘VISION 2020: the Right to Sight’. VISION 2020 is an established partnership between the World Health Organization and the International Agency for the Prevention of Blindness (IAPB). It was launched in 1999 with the twin aims of eliminating avoidable blindness by the year 2020 and preventing the projected doubling of avoidable visual impairment between 1990 and 2020. The ultimate goal of the initiative is to integrate a sustainable, comprehensive, high-quality, equitable eye care system into strengthened national health care systems.
6 VISION 2020: The Right to Sight. Accessed March 2011 at: http://www.vision2020.org/main.cfm?type=WHATISBLINDNESS
7 Marseille E, ‘Cost Effectiveness of Cataract Surgery in a Public Health Eye Care Program in Nepal,’ Bulletin of the World Health Organization, 74 (1996), 319-324.
8 World Health Organization 2007. Everybody’s Business : Strengthening Health Systems to Improve Health Outcomes : WHO’s Framework for Action
Context
The global cost of eliminating avoidable blindness PwC and Three Rivers Consulting 10
VISION 2020’s three core approaches to the prevention of blindness and visual impairment are: disease control, human resource development and infrastructure and technology development. NGOs are working within the internationally-agreed VISION 2020 strategic framework and openly report on efforts against internationally-agreed performance indicators. NGOs are now investing in training and education, building facilities and providing equipment; they seek to work in partnership to strengthen and sustain local health systems.
2.3 This project
This report presents the estimate by PwC, with the assistance of Three Rivers Consulting, of the global costs of eliminating avoidable blindness.
Our estimate follows IAPB calculations that utilised 2008 population statistics to estimate the costs involved in delivering VISION 2020. However, these costs focussed on:
analysing developing countries only (excluding the 50 most developed countries)
estimating the cost of providing treatment services, and therefore did not include costs of primary health care and preventative health services
using costing exercises that had taken place in India and Gambia as proxies for the cost of providing services in developing countries.
This IAPB research estimated that the cost of eliminating avoidable blindness is equal to an investment of $8 billion over a ten year period.
As a result of this research, IAPB and FHF recognised that a full, comprehensive costing exercise was limited by the paucity of available information. However, they sought to improve their cost estimates: first, by considering different approaches to measuring the necessary costs; second, by highlighting areas where improved information could have a significant impact for their estimates.
Given our task, we agreed with the consortium of NGOs on key factors to be considered for this project, including:
building on the existing information base by considering the available data on preventable blindness
costing the elimination of preventable blindness on the basis of both:
– the investment required across global health sectors to provide sustainable eye health services, including the primary care services required to prevent and treat eye conditions before they cause blindness
– the cost of eliminating the avoidable blindness ‘backlog’ through fulfilling the VISION 2020 strategy
understanding regional and country-specific differences, in terms of:
– latest estimates of the prevalence of blindness in each region
– the state of the current vis-à-vis an ideal health system in terms of treating preventable blindness
– the cost of living
– regionality (the differences apparent between World Bank regions)
– access to health services throughout regional and remote areas of a country and the quality and reach of transportation infrastructure
recognising that treatment costs are different according to the type of blindness condition, including:
– cataract
– glaucoma
– other preventable blindness diseases (outlined above).
Our approach to this costing exercise, the assumptions we have made and the results of our global cost estimation are based on these key factors.
For the purposes of this project we have considered the following definitions:
Context
The global cost of eliminating avoidable blindness PwC and Three Rivers Consulting 11
Primary health care – refers to the first level of contact people have with the health system and constitutes those parts of the health system that are devoted to protecting and promoting the health of people and communities and the prevention of ill health. Ideally, the primary health care system is where eye health problems are identified and treated early, before the onset of avoidable blindness. Eye health occupations within the primary health sector include: general practitioners, optometrists and allied health professionals (including ophthalmic nurses and orthoptists)
Secondary health care – comprises health services that take place in the hospital setting, treating eye health problems that are beyond the capacity of the primary health care sector. Examples of secondary health care services include: cataract surgery and glaucoma surgical intervention. Eye health occupations within the secondary health sector include ophthalmologists and ophthalmic nurses.
The global cost of eliminating avoidable blindness PwC and Three Rivers Consulting 12
3 Global cost estimation
3.1 Overview
The global cost estimate of avoidable blindness has been calculated by conceptualising blindness in three categories:
people with avoidable blindness (including conditions such as cataracts and glaucoma as well as other types of avoidable blindness)
people who have low vision but are not avoidably blind
people who have no visual impairment but may be at risk of low vision or becoming avoidably blind.
It is understood that there is a component of blindness that is unavoidable. Treatment for this group of people has not been included in this cost estimate analysis.
Framing avoidable blindness broadly in this manner generates a costing framework, comprised by three components, as the basis for calculating a cost estimate for eliminating avoidable blindness by 2020. These components drive our estimates of the cost to:
build and provide an ongoing primary care system with the capacity to treat and refer avoidable blindness
build and provide an ongoing secondary care system with the capacity to treat patients at risk of avoidable blindness
eliminate the ‘backlog’ of avoidable blindness prevalent in some countries because of the limited availability of health services.
To achieve the VISION 2020 goals, it is vital to incorporate sustainable primary and secondary health system costs into the total cost of eliminating avoidable blindness. Well-functioning health systems are a key component to maintain good eye health and prevent individuals from accumulating conditions that may ultimately lead to avoidable blindness.
This chapter presents the global cost estimations at an aggregate level and then presents the cost detail by region and separates the costs into recurrent cost and investment components by health sector.
3.1.1 Global direct health cost and investment estimates
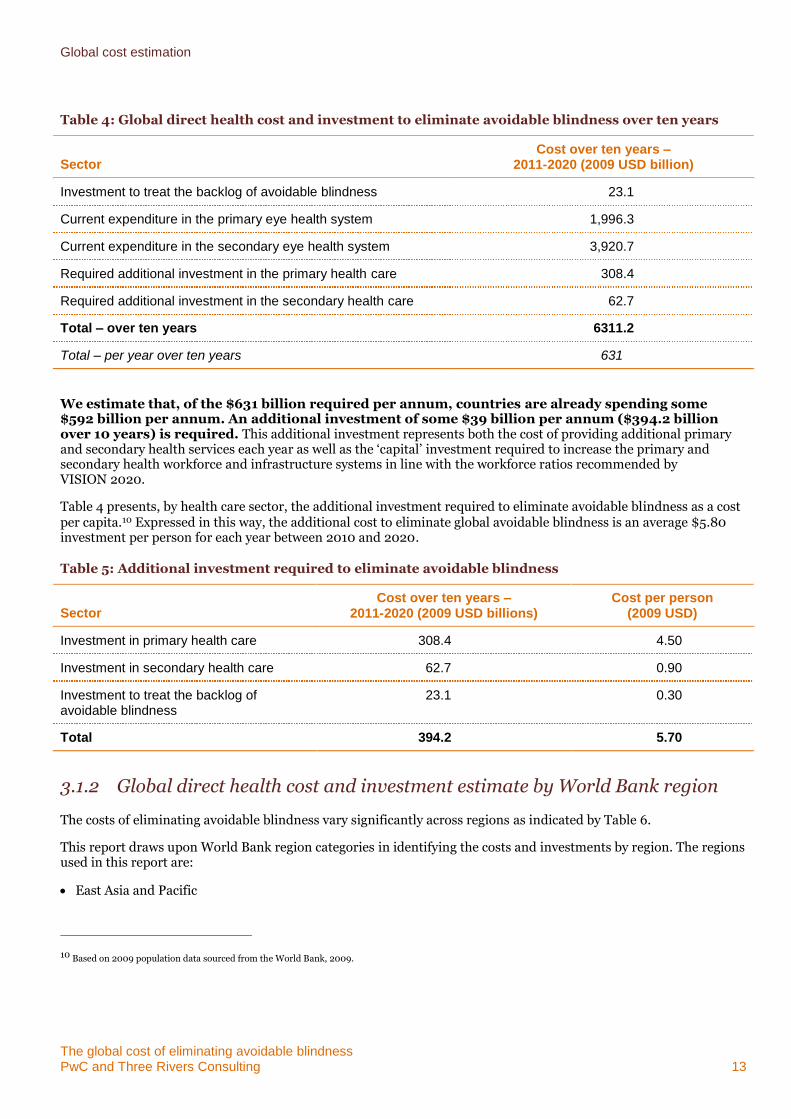
The global direct health cost and investment to eliminate avoidable blindness over a ten year period from 2011 to 20209 is estimated to be $631 billion per year over a ten year period. This estimate is comprised of the following components:
required investment to eliminate the backlog
current expenditure in the primary health care
current expenditure in the secondary health care
required additional investment in the primary health care
required additional investment in the secondary health care.
Table 3 shows this figure categorised by the cost of each component.
9 Costs are expressed in USD nominal terms, using a 2009 3 year average GDP inflator to determine indexation.
Global cost estimation
The global cost of eliminating avoidable blindness PwC and Three Rivers Consulting 13
Table 4: Global direct health cost and investment to eliminate avoidable blindness over ten years
Sector Cost over ten years –
2011-2020 (2009 USD billion)
Investment to treat the backlog of avoidable blindness 23.1
Current expenditure in the primary eye health system 1,996.3
Current expenditure in the secondary eye health system 3,920.7
Required additional investment in the primary health care 308.4
Required additional investment in the secondary health care 62.7
Total – over ten years 6311.2
Total – per year over ten years 631
We estimate that, of the $631 billion required per annum, countries are already spending some $592 billion per annum. An additional investment of some $39 billion per annum ($394.2 billion over 10 years) is required. This additional investment represents both the cost of providing additional primary and secondary health services each year as well as the ‘capital’ investment required to increase the primary and secondary health workforce and infrastructure systems in line with the workforce ratios recommended by VISION 2020.
Table 4 presents, by health care sector, the additional investment required to eliminate avoidable blindness as a cost per capita.10 Expressed in this way, the additional cost to eliminate global avoidable blindness is an average $5.80 investment per person for each year between 2010 and 2020.
Table 5: Additional investment required to eliminate avoidable blindness
Sector Cost over ten years –
2011-2020 (2009 USD billions) Cost per person
(2009 USD)
Investment in primary health care 308.4 4.50
Investment in secondary health care 62.7 0.90
Investment to treat the backlog of avoidable blindness
23.1 0.30
Total 394.2 5.70
3.1.2 Global direct health cost and investment estimate by World Bank region
The costs of eliminating avoidable blindness vary significantly across regions as indicated by Table 6.
This report draws upon World Bank region categories in identifying the costs and investments by region. The regions used in this report are:
East Asia and Pacific
10 Based on 2009 population data sourced from the World Bank, 2009.
Global cost estimation
The global cost of eliminating avoidable blindness PwC and Three Rivers Consulting 14
Europe and Central Asia
Latin America and the Caribbean
Middle East and North Africa
South Asia
Sub-Saharan Africa
High-income economies.
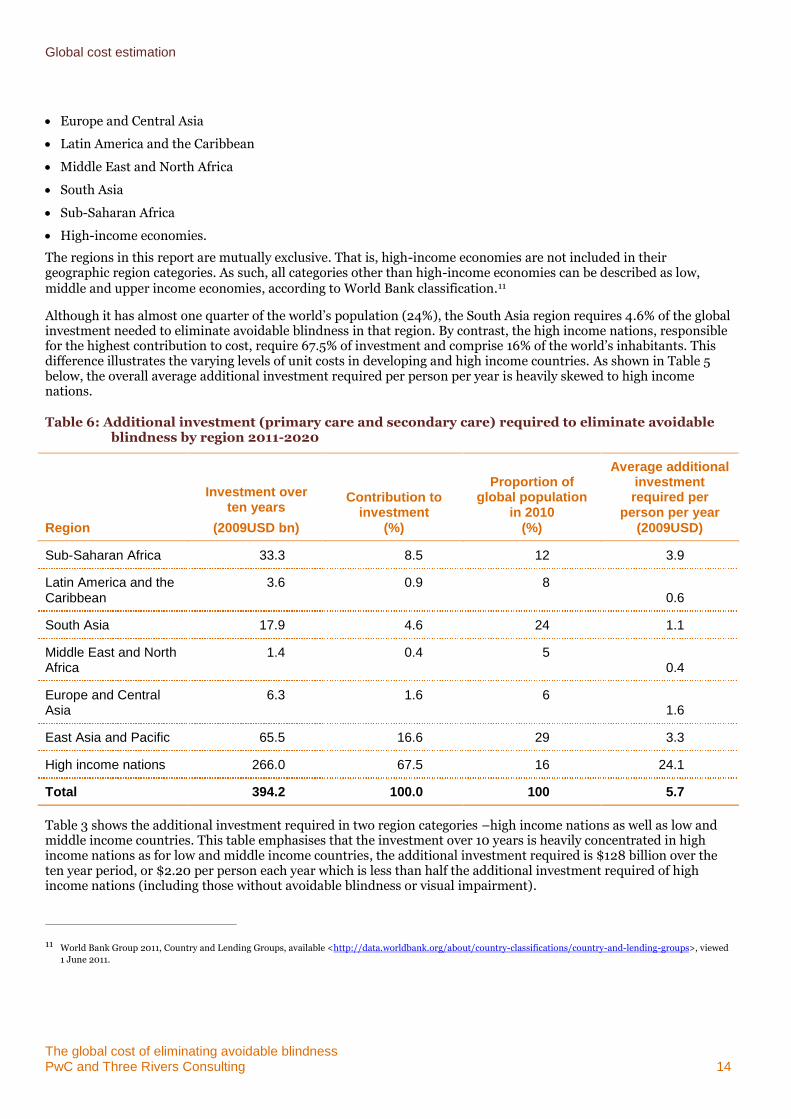
The regions in this report are mutually exclusive. That is, high-income economies are not included in their geographic region categories. As such, all categories other than high-income economies can be described as low, middle and upper income economies, according to World Bank classification.11
Although it has almost one quarter of the world’s population (24%), the South Asia region requires 4.6% of the global investment needed to eliminate avoidable blindness in that region. By contrast, the high income nations, responsible for the highest contribution to cost, require 67.5% of investment and comprise 16% of the world’s inhabitants. This difference illustrates the varying levels of unit costs in developing and high income countries. As shown in Table 5 below, the overall average additional investment required per person per year is heavily skewed to high income nations.
Table 6: Additional investment (primary care and secondary care) required to eliminate avoidable blindness by region 2011-2020
Region
Investment over ten years
(2009USD bn)
Contribution to investment
(%)
Proportion of global population
in 2010 (%)
Average additional investment required per
person per year (2009USD)
Sub-Saharan Africa 33.3 8.5 12 3.9
Latin America and the Caribbean
3.6 0.9 8 0.6
South Asia 17.9 4.6 24 1.1
Middle East and North Africa
1.4 0.4 5 0.4
Europe and Central Asia
6.3 1.6 6 1.6
East Asia and Pacific 65.5 16.6 29 3.3
High income nations 266.0 67.5 16 24.1
Total 394.2 100.0 100 5.7
Table 3 shows the additional investment required in two region categories –high income nations as well as low and middle income countries. This table emphasises that the investment over 10 years is heavily concentrated in high income nations as for low and middle income countries, the additional investment required is $128 billion over the ten year period, or $2.20 per person each year which is less than half the additional investment required of high income nations (including those without avoidable blindness or visual impairment).
11 World Bank Group 2011, Country and Lending Groups, available <http://data.worldbank.org/about/country-classifications/country-and-lending-groups>, viewed
1 June 2011.
Global cost estimation
The global cost of eliminating avoidable blindness PwC and Three Rivers Consulting 15
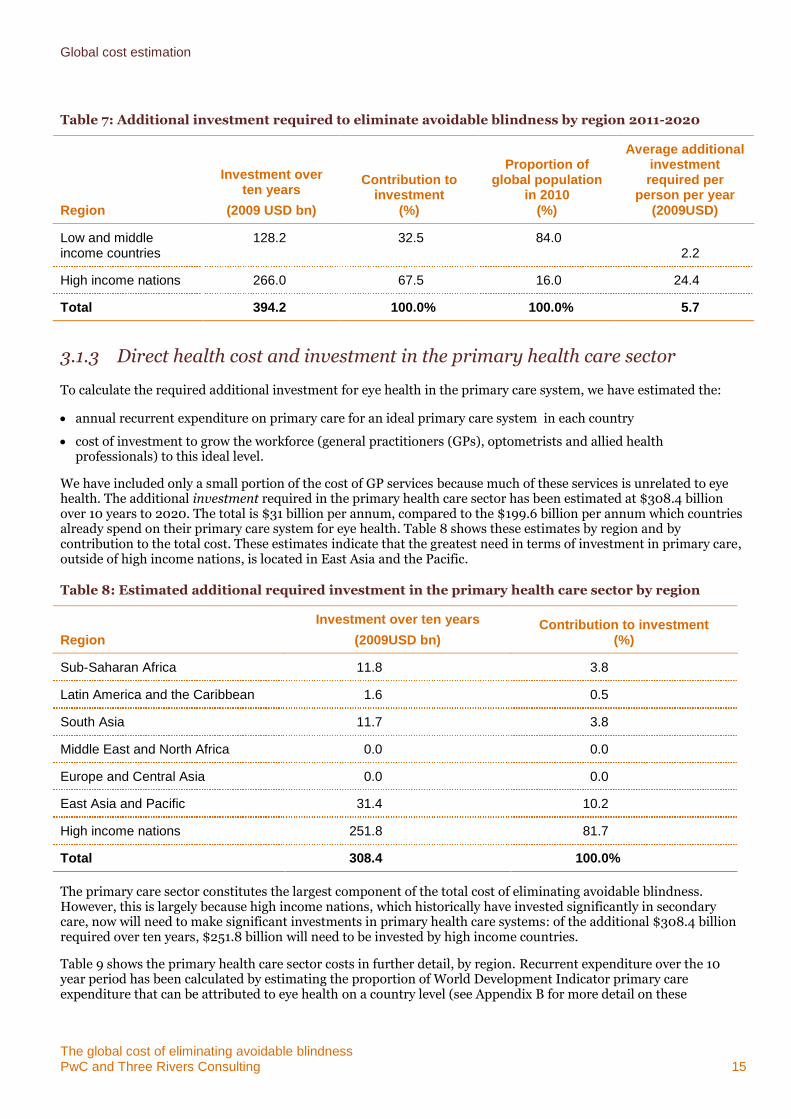
Table 7: Additional investment required to eliminate avoidable blindness by region 2011-2020
Region
Investment over ten years
(2009 USD bn)
Contribution to investment
(%)
Proportion of global population
in 2010 (%)
Average additional investment required per
person per year (2009USD)
Low and middle income countries
128.2 32.5 84.0 2.2
High income nations 266.0 67.5 16.0 24.4
Total 394.2 100.0% 100.0% 5.7
3.1.3 Direct health cost and investment in the primary health care sector
To calculate the required additional investment for eye health in the primary care system, we have estimated the:
annual recurrent expenditure on primary care for an ideal primary care system in each country
cost of investment to grow the workforce (general practitioners (GPs), optometrists and allied health professionals) to this ideal level.
We have included only a small portion of the cost of GP services because much of these services is unrelated to eye health. The additional investment required in the primary health care sector has been estimated at $308.4 billion over 10 years to 2020. The total is $31 billion per annum, compared to the $199.6 billion per annum which countries already spend on their primary care system for eye health. Table 8 shows these estimates by region and by contribution to the total cost. These estimates indicate that the greatest need in terms of investment in primary care, outside of high income nations, is located in East Asia and the Pacific.
Table 8: Estimated additional required investment in the primary health care sector by region
Region
Investment over ten years
(2009USD bn) Contribution to investment
(%)
Sub-Saharan Africa 11.8 3.8
Latin America and the Caribbean 1.6 0.5
South Asia 11.7 3.8
Middle East and North Africa 0.0 0.0
Europe and Central Asia 0.0 0.0
East Asia and Pacific 31.4 10.2
High income nations 251.8 81.7
Total 308.4 100.0%
The primary care sector constitutes the largest component of the total cost of eliminating avoidable blindness. However, this is largely because high income nations, which historically have invested significantly in secondary care, now will need to make significant investments in primary health care systems: of the additional $308.4 billion required over ten years, $251.8 billion will need to be invested by high income countries.
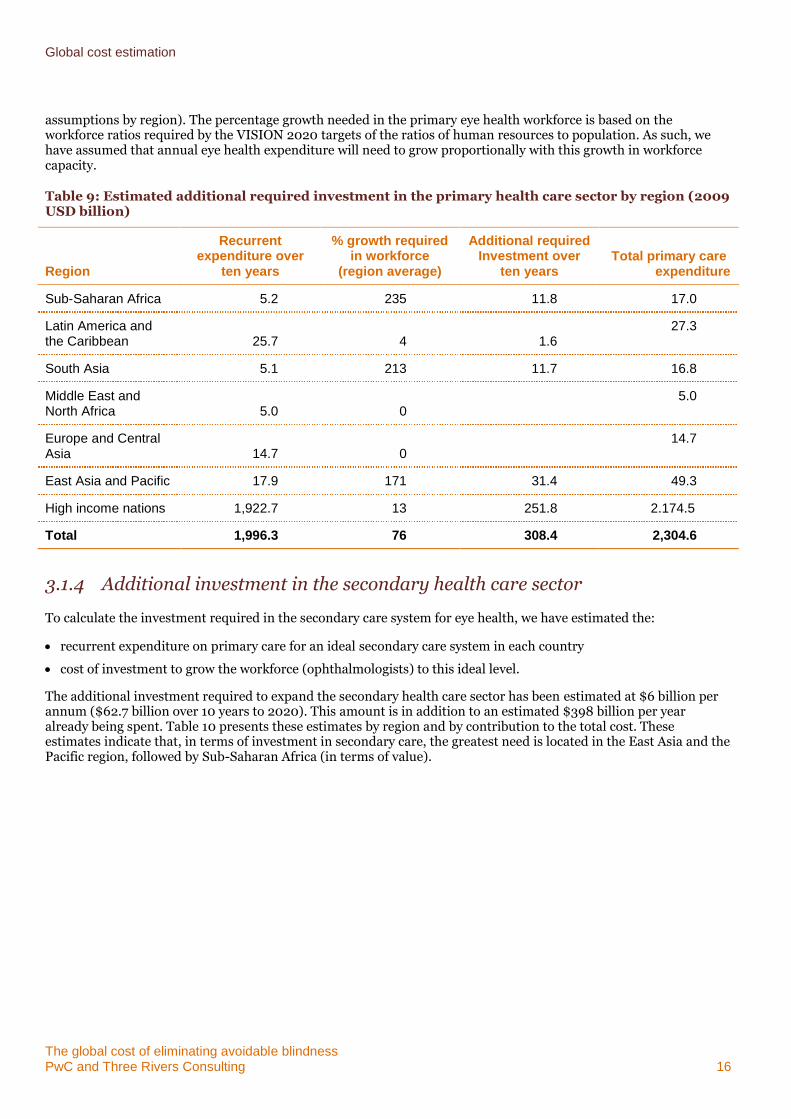
Table 9 shows the primary health care sector costs in further detail, by region. Recurrent expenditure over the 10 year period has been calculated by estimating the proportion of World Development Indicator primary care expenditure that can be attributed to eye health on a country level (see Appendix B for more detail on these
Global cost estimation
The global cost of eliminating avoidable blindness PwC and Three Rivers Consulting 16
assumptions by region). The percentage growth needed in the primary eye health workforce is based on the workforce ratios required by the VISION 2020 targets of the ratios of human resources to population. As such, we have assumed that annual eye health expenditure will need to grow proportionally with this growth in workforce capacity.
Table 9: Estimated additional required investment in the primary health care sector by region (2009 USD billion)
Region
Recurrent expenditure over
ten years
% growth required in workforce
(region average)
Additional required Investment over
ten years Total primary care
expenditure
Sub-Saharan Africa 5.2 235 11.8 17.0
Latin America and the Caribbean 25.7 4 1.6
27.3
South Asia 5.1 213 11.7 16.8
Middle East and North Africa 5.0 0
5.0
Europe and Central Asia 14.7 0
14.7
East Asia and Pacific 17.9 171 31.4 49.3
High income nations 1,922.7 13 251.8 2.174.5
Total 1,996.3 76 308.4 2,304.6
3.1.4 Additional investment in the secondary health care sector
To calculate the investment required in the secondary care system for eye health, we have estimated the:
recurrent expenditure on primary care for an ideal secondary care system in each country
cost of investment to grow the workforce (ophthalmologists) to this ideal level.
The additional investment required to expand the secondary health care sector has been estimated at $6 billion per annum ($62.7 billion over 10 years to 2020). This amount is in addition to an estimated $398 billion per year already being spent. Table 10 presents these estimates by region and by contribution to the total cost. These estimates indicate that, in terms of investment in secondary care, the greatest need is located in the East Asia and the Pacific region, followed by Sub-Saharan Africa (in terms of value).
Global cost estimation
The global cost of eliminating avoidable blindness PwC and Three Rivers Consulting 17
Table 10: Estimated additional required investment in the secondary health care sector by region
Region
Cost over ten years – 2011-2020
(2009USD bn) Contribution to investment
(%)
Sub-Saharan Africa 20.9 33.0
Latin America and the Caribbean 1.5 2.0
South Asia 3.6 6.0
Middle East and North Africa 0.9 2.0
Europe and Central Asia 0.1 0.0
East Asia and Pacific 31.0 50.0
High income nations 4.7 7.0
Total 62.7 100.0%
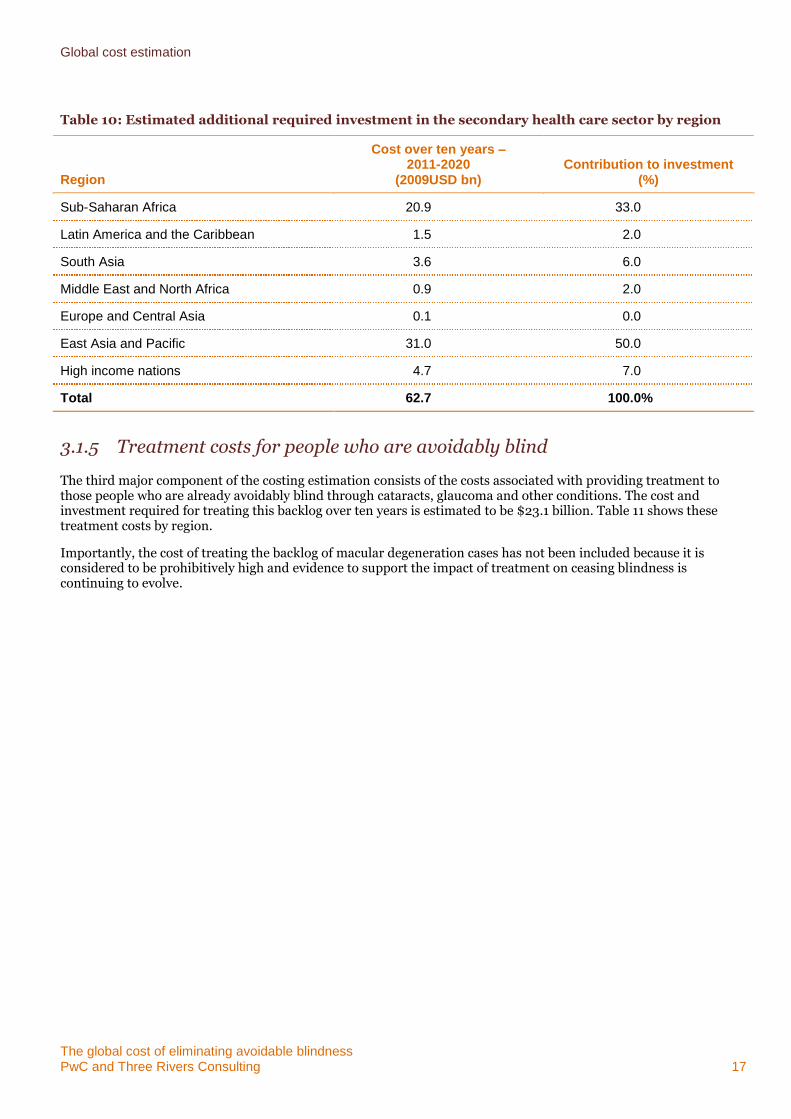
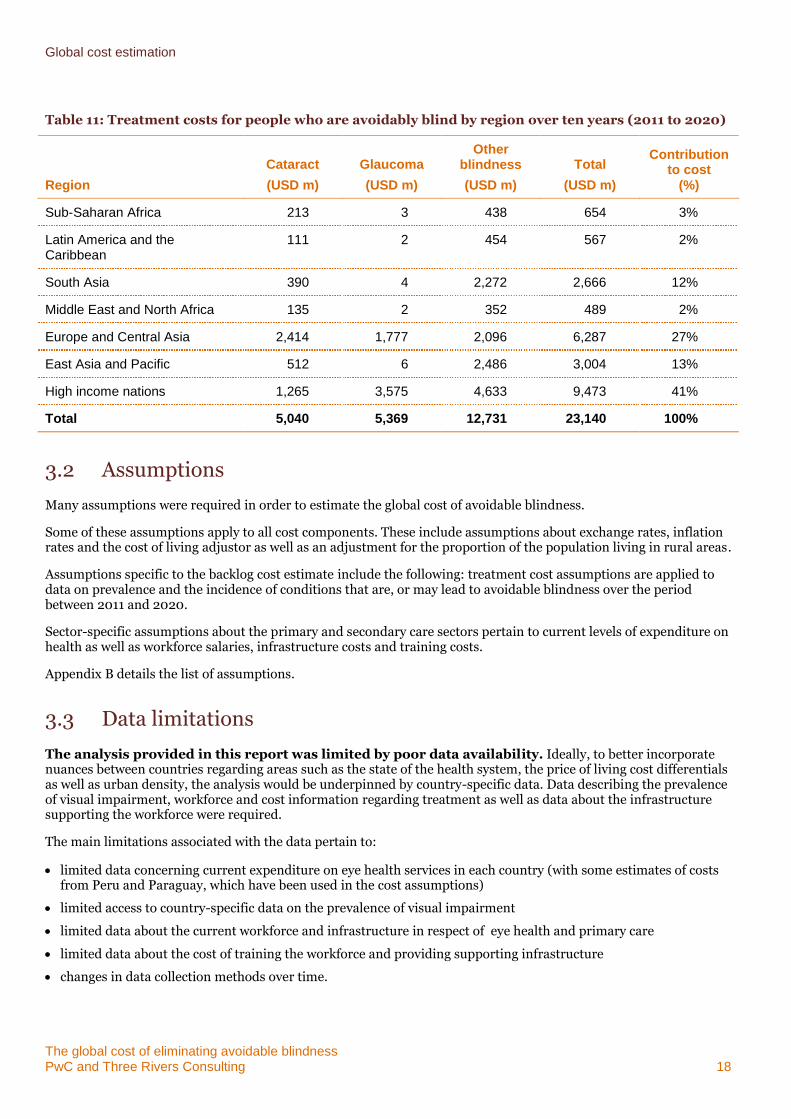
3.1.5 Treatment costs for people who are avoidably blind
The third major component of the costing estimation consists of the costs associated with providing treatment to those people who are already avoidably blind through cataracts, glaucoma and other conditions. The cost and investment required for treating this backlog over ten years is estimated to be $23.1 billion. Table 11 shows these treatment costs by region.
Importantly, the cost of treating the backlog of macular degeneration cases has not been included because it is considered to be prohibitively high and evidence to support the impact of treatment on ceasing blindness is continuing to evolve.
Global cost estimation
The global cost of eliminating avoidable blindness PwC and Three Rivers Consulting 18
Table 11: Treatment costs for people who are avoidably blind by region over ten years (2011 to 2020)
Region
Cataract
(USD m)
Glaucoma
(USD m)
Other blindness
(USD m)
Total
(USD m)
Contribution to cost
(%)
Sub-Saharan Africa 213 3 438 654 3%
Latin America and the Caribbean
111 2 454 567 2%
South Asia 390 4 2,272 2,666 12%
Middle East and North Africa 135 2 352 489 2%
Europe and Central Asia 2,414 1,777 2,096 6,287 27%
East Asia and Pacific 512 6 2,486 3,004 13%
High income nations 1,265 3,575 4,633 9,473 41%
Total 5,040 5,369 12,731 23,140 100%
3.2 Assumptions
Many assumptions were required in order to estimate the global cost of avoidable blindness.
Some of these assumptions apply to all cost components. These include assumptions about exchange rates, inflation rates and the cost of living adjustor as well as an adjustment for the proportion of the population living in rural areas.
Assumptions specific to the backlog cost estimate include the following: treatment cost assumptions are applied to data on prevalence and the incidence of conditions that are, or may lead to avoidable blindness over the period between 2011 and 2020.
Sector-specific assumptions about the primary and secondary care sectors pertain to current levels of expenditure on health as well as workforce salaries, infrastructure costs and training costs.
Appendix B details the list of assumptions.
3.3 Data limitations
The analysis provided in this report was limited by poor data availability. Ideally, to better incorporate nuances between countries regarding areas such as the state of the health system, the price of living cost differentials as well as urban density, the analysis would be underpinned by country-specific data. Data describing the prevalence of visual impairment, workforce and cost information regarding treatment as well as data about the infrastructure supporting the workforce were required.
The main limitations associated with the data pertain to:
limited data concerning current expenditure on eye health services in each country (with some estimates of costs from Peru and Paraguay, which have been used in the cost assumptions)
limited access to country-specific data on the prevalence of visual impairment
limited data about the current workforce and infrastructure in respect of eye health and primary care
limited data about the cost of training the workforce and providing supporting infrastructure
changes in data collection methods over time.
Global cost estimation
The global cost of eliminating avoidable blindness PwC and Three Rivers Consulting 19
As a result of these limitations, a high degree of uncertainty surrounds the cost estimates contained in this report. To deal with these limitations, a number of assumptions were made. These include:
costs of primary and secondary care services were based on a country- specific cost of primary and secondary health care services, and the eye health care component was based on the 2009 Access Economics analysis of data which included Australia, the United Kingdom, Canada, the United States of America and Japan for high income nations and data for Peru, Paraguay and Nepal, sourced from sponsor organisations, to indicate the proportion of health expenditure spent on eye health care in other regions
costs of training workforce and providing supporting infrastructure were drawn from public domain research, sponsor organisation data in respect of selected programs in selected countries and PwC assumptions about Australian data
prevalence of avoidable blindness in each country was assumed to be consistent with the relevant regional average, using World Bank regions.
Globally, 32.4 million people were blind and a further 190.6 had a visual impairment condition in 201012. Comparisons with earlier estimates of prevalence are not possible because of differences in methodology. Accordingly, comparisons with previous estimates of the cost of eliminating avoidable blindness are not possible.
More recent WHO estimates on the prevalence of blindness and visual impairment estimate that 223 million people are blind or otherwise visually impaired. Cost estimates are based on these most recent unpublished data on the prevalence of those impacted by blindness and visual impairment (severe and moderate). However, there remains considerable uncertainty around the exact number of people that are blind or otherwise visually impaired. This report relies on the central estimate of 223 million; though there is a 95% likelihood that the true estimate lies somewhere between 206 million and 261 million (Stevens, pers comms, 2013). This confidence interval suggests that estimates from this analysis should be treated as indicative and with caution. Future analyses into the cost-effectiveness of eliminating avoidable blindness would therefore benefit greatly from research that increases the precision of these data.
Given these limitations, it is important to use the results outlined in this report with appropriate caution. In the next section, we make seven recommendations for improved data collection which will significantly improve the quality of future cost estimates.
We have also undertaken a sensitivity analysis. The results of this analysis are detailed in Appendix C. When a cost estimate is built on a range of data sources and assumptions, a sensitivity analysis is important: it examines the elements of uncertainty within an estimate and their effect on the overall result. In the context of the cost of global blindness, the identified data limitations indicate the importance of a sensitivity analysis to understand the level of validity and robustness of the cost estimates.
12 Revised data are lower than the previously as calculations are based on the WHO’s estimates of declining trends in visual impairment and blindness and a large
portion of the difference stems from the newer reduced estimate of visual impairment in China. New data were attained from Stevens, personal comms in 2013. Previous data is from WHO 2010, Prevention of Blindness and Visual Impairment, available at<http://www.who.int/blindness/table/en/index.html>, viewed March 2011
The global cost of eliminating avoidable blindness PwC and Three Rivers Consulting 20
4 Lessons from the costing exercise
A number of lessons have been learned concerning the type, availability and accessibility of eye health, visual impairment and blindness-related data. In general, we learned that:
cost data is limited in this sector
key areas of data improvement would enhance vastly the accuracy and reliability of future costing estimates
future information needs within the sector are likely to change, requiring a change to the specificity and type of data currently collected in the sector.
Each of these key learnings is discussed in greater detail below with recommendations about how improvement could be made in the short term.
4.1 Cost data is limited
Previous costing exercises about eye health services have been limited by the data available in the sector. A number of NGOs and academics had previously considered or completed costing exercises or Rapid Assessments in specific countries, but generally found that the lack of data limited the accuracy of results.
A good example is the recent costing work completed by the IAPB which drew on 2008 population statistics to estimate the costs involved in eliminating avoidable blindness. However, these costs relied on data from estimates in India and Gambia as proxies for the cost of providing services in developing countries. This research was based on the best information available at the time, but the IAPB acknowledged that further work was needed to improve the accuracy of the estimates.
Further, although good data are collected by WHO on the prevalence of blindness and incidence by blindness condition, a number of sources provide estimates of the prevalence of blindness which appear to be inconsistent with WHO estimates. One improvement in this area would be to have greater access to WHO estimates at a country level. (At the moment only high level data for each WHO region is available publicly.)
Anecdotal evidence is strong but dispersed across the sector
As part of this project, targeted consultation was conducted with key eye health experts, IAPB chairs and representatives from the six sponsoring NGO organisations. Lessons from these discussions indicated that anecdotal evidence relevant to the costing exercise is available in some countries and, in some cases, across a number of countries. However, this information is dispersed across the sector and across the globe. For example, a number of Rapid Assessments have been conducted in Africa, Asia and Latin America, but this information is not readily available in one place.
We recommend that information be collected and collated (including WHO prevalence and incidence data), and stored and maintained online in one location. This online information clearinghouse would be managed by one representative organisation on behalf of the sector and could focus on open, transparent and easy access to eye health research, evaluation and data.
4.2 Key areas for data improvement
Key areas for data and information improvement were considered across the three key areas of the VISION 2020 strategy: cost-effective disease control interventions, human resource development and infrastructure development.
Cost-effective disease control
In terms of the available data and information on disease control, there are varying levels of data availability. For example, regarding cataract disease:
Lessons from the costing exercise
The global cost of eliminating avoidable blindness PwC and Three Rivers Consulting 21
significant data are available in respect of cataract surgical rates (most recently estimated in 2006)
estimates (as mentioned above) are available about the prevalence and incidence of cataract disease globally
a number of NGOs have estimated the costs of treating cataract disease in developing countries.
Together, this data can be used to develop an accurate estimate of providing cataract services and the cost of eliminating blindness as a result of cataracts.
However, for other forms of blindness, data about surgical or treatment rates and the cost of treatment have not been considered in as much depth. We recommend focusing new research on those blindness conditions that affect large groups of the population in the developing world, including:
glaucoma
macular degeneration
uncorrected refractive error.
Further, we note that in the absence of an estimate of current expenditure on primary and secondary healthcare, it is difficult to predict confidently the requirements of future health expenditure. In many circumstances, we have drawn on assumptions about Australia and other countries to estimate the cost. We recommend that a full costing exercise be undertaken of the current cost of providing eye health and related primary care services in a sample of countries. These countries should be spread across the development continuum and across regions in order to provide valuable, comparable and meaningful information and data that can be extrapolated globally.
Human resource development
Training and human resource development for eye health professionals also constitutes a major contributing factor to building a sustainable health system in developing countries. In particular, understanding the training needs and costs of primary and secondary sector training are critical to calculating accurate estimates, including:
Primary health care sector – general practitioners, optometrists and allied health professionals (such orthoptists)
Secondary health care sector – ophthalmologists, cataract surgeons and ophthalmic nurses.
Information about the costs of providing training services to the eye health workforce was limited for this project, which relied on information about training costs in Australia and a small number of other counties in each World Bank region, including Egypt, Botswana, Romania, India, China and Russia. It is important to note that although some information was available across these countries, it was difficult to determine if both the public and student contribution were included in the cost or if the data referred to the student contribution only.
Although a number of NGOs had attempted previously to collect information about the costs of training eye health professionals with limited success, their estimations reflected the full cost (including the NGO contribution) of workforce training and were not as useful for our calculations.
Given the importance of the training and development of the workforce to achieve overall health sector sustainability, we recommend further investment in the evaluation and estimation of training costs in a number of countries (spread across World Bank regions) to add value and accuracy to overall costing estimates in the future.
Infrastructure development
The final key area of the VISION 2020 strategy is investment in the development of health system infrastructure (including facilities, technology and consumables). For this particular costing exercise, the infrastructure costs are tied to the needs of the eye health workforce. For example, the facilities necessary for the secondary health care sector are determined by the number of additional ophthalmologists needed in a given country (based on VISION 2020 targets), the operating theatre time required by this additional cohort of ophthalmologists and the cost of building operating theatres based on the time taken to build them. This costing method assumed that the existing resources within the health system are either at or close to their capacity.
We have used this method to estimate infrastructure cost across the secondary and primary health care sectors (the cost of GP clinics) and to estimate workforce training (the cost of accessing university or school facilities). This method is used because data about specific infrastructure costs have not been comprehensively monitored in recent
Lessons from the costing exercise
The global cost of eliminating avoidable blindness PwC and Three Rivers Consulting 22
years. Additionally, because data sourced from NGOs are not consistent in estimating current investment in infrastructure development, these estimates have not been used as a reliable proxy.
We recommend developing a costing framework specific to infrastructure costs that can be used consistently across the sector to assess and estimate the costs of infrastructure requirements individually or as tied to eye health workforce needs.
4.3 Future information needs within the sector
The areas of data improvement highlighted above are vital to the international eye health sector because of a recent change in the way the health sector evaluates and assesses its success.
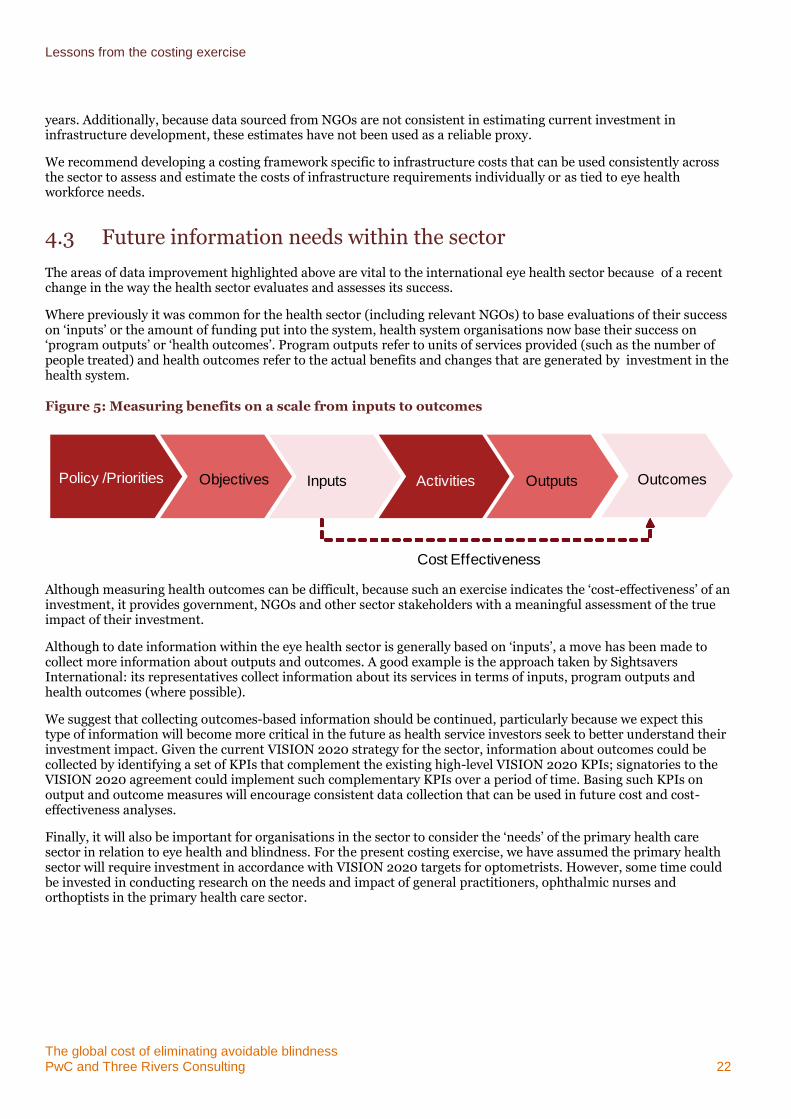
Where previously it was common for the health sector (including relevant NGOs) to base evaluations of their success on ‘inputs’ or the amount of funding put into the system, health system organisations now base their success on ‘program outputs’ or ‘health outcomes’. Program outputs refer to units of services provided (such as the number of people treated) and health outcomes refer to the actual benefits and changes that are generated by investment in the health system.
Figure 5: Measuring benefits on a scale from inputs to outcomes
Although measuring health outcomes can be difficult, because such an exercise indicates the ‘cost-effectiveness’ of an investment, it provides government, NGOs and other sector stakeholders with a meaningful assessment of the true impact of their investment.
Although to date information within the eye health sector is generally based on ‘inputs’, a move has been made to collect more information about outputs and outcomes. A good example is the approach taken by Sightsavers International: its representatives collect information about its services in terms of inputs, program outputs and health outcomes (where possible).
We suggest that collecting outcomes-based information should be continued, particularly because we expect this type of information will become more critical in the future as health service investors seek to better understand their investment impact. Given the current VISION 2020 strategy for the sector, information about outcomes could be collected by identifying a set of KPIs that complement the existing high-level VISION 2020 KPIs; signatories to the VISION 2020 agreement could implement such complementary KPIs over a period of time. Basing such KPIs on output and outcome measures will encourage consistent data collection that can be used in future cost and cost-effectiveness analyses.
Finally, it will also be important for organisations in the sector to consider the ‘needs’ of the primary health care sector in relation to eye health and blindness. For the present costing exercise, we have assumed the primary health sector will require investment in accordance with VISION 2020 targets for optometrists. However, some time could be invested in conducting research on the needs and impact of general practitioners, ophthalmic nurses and orthoptists in the primary health care sector.
Cost Effectiveness
Policy /Priorities Objectives Inputs Activities Outputs impactsOutcomes
The global cost of eliminating avoidable blindness PwC 23
Appendices
Appendix A Project methodology 24
Appendix B Assumptions 29
Appendix C Sensitivity analysis 36
Appendix D Selected data tables 41
Appendix E Bibliography 54
The global cost of eliminating avoidable blindness PwC and Three Rivers Consulting 24
Appendix A Project methodology
Our methodology for undertaking this project included six stages:
Inception
Data collection and collation
Targeted consultation
Costing framework development and global cost estimation
Testing estimates
Reporting
The approach taken to the key stages of this project are described below.
Data collection and consultation
We completed a comprehensive data and information collection exercise, through a number of sources:
publicly available relevant information and data sources (such as WHO and VISION 2020)
information provided by key experts in the sector including cost-related data that may not have been published or released publicly
information provided by IAPB chairs and their referred contacts about the costs of services in particular countries; for these stakeholders we sought additional information from an expert in one country per World Bank region about the cost of providing eye health services
information and data collected from the NGO sponsor organisations about the costs of providing eye care and blindness treatment programs internationally.
We collected this information through a targeted consultation process. The stakeholders included in this process are listed in Table 12. In the consultation process stakeholders were:
provided with a discussion guide giving them an overview of the project and the information sought (this differed by stakeholder group)
asked about the costing method and framework used to seek feedback, input and agreement
asked about the types of costing information and exercises that their organisation may have completed
asked to provided available information and data or to provide contact details of an alternate stakeholder as a source of relevant data.
As a result of the consultation process, we received some information about the costs of providing eye health services in Nepal, Peru and Paraguay. We also received data from Vietnam concerning prevalence and service usage. All data contributed to the construction of assumptions and the costing methodology.
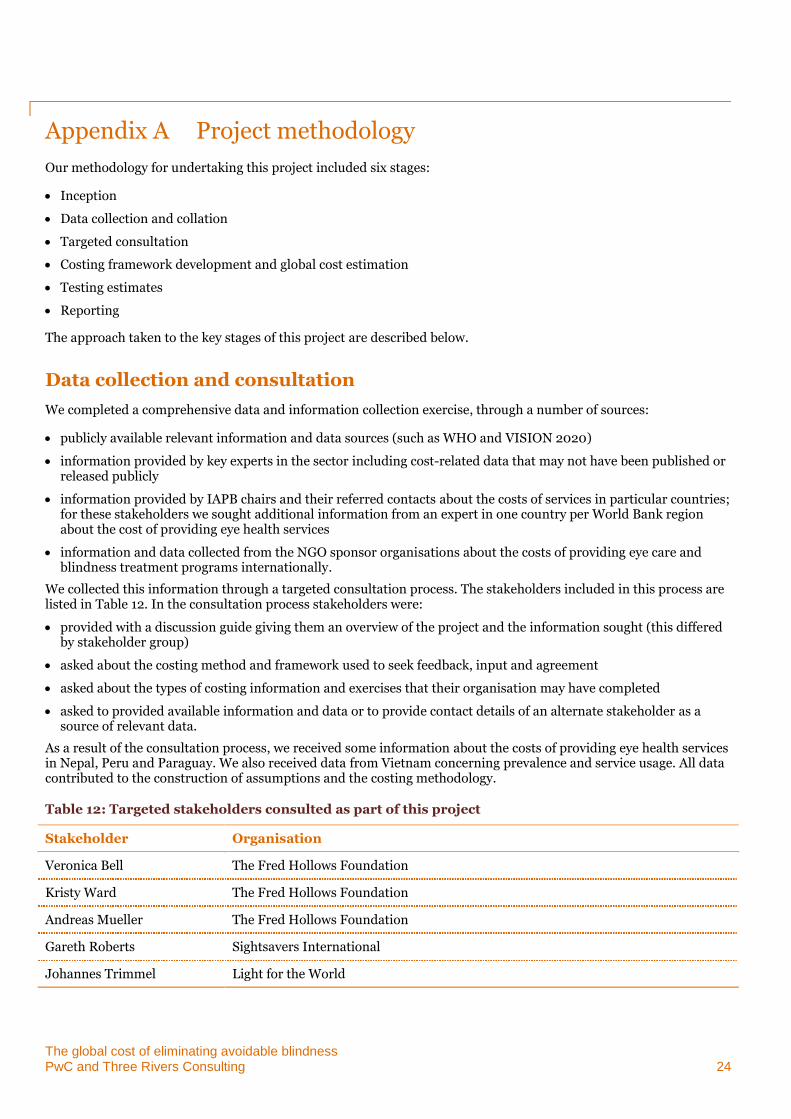
Table 12: Targeted stakeholders consulted as part of this project
Stakeholder Organisation
Veronica Bell The Fred Hollows Foundation
Kristy Ward The Fred Hollows Foundation
Andreas Mueller The Fred Hollows Foundation
Gareth Roberts Sightsavers International
Johannes Trimmel Light for the World
Project methodology
The global cost of eliminating avoidable blindness PwC and Three Rivers Consulting 25
Stakeholder Organisation
Dr Christiane Noe CBM
Pat Fergurson Operation Eyesight Universal (IAPB chair North America)
Peter Ackland IAPB (Chief Executive Officer)
Professor Kovin Naidoo IAPB chair Africa
Dr Rainald Duerksen IAPB chair Latin America
Dr Mansur Rabiu Technical advisor to IAPB chair Emirates
Professor Volker Klauss IAPB chair Europe
Dr Raibiul Husain IAPB chair South East Asia
Dr Rickard Le Mesurier IAPB chair West Pacific
Dr Van Lansingh VISION 2020, Latin America
Professor Kevin Frick John Hopkins Bloomberg School of Public Health
Dr Serge Resnikoff Non-communicable disease expert
Ulla Kou Griffiths London School of Hygiene and Tropical Medicine
Costing framework and global cost estimation
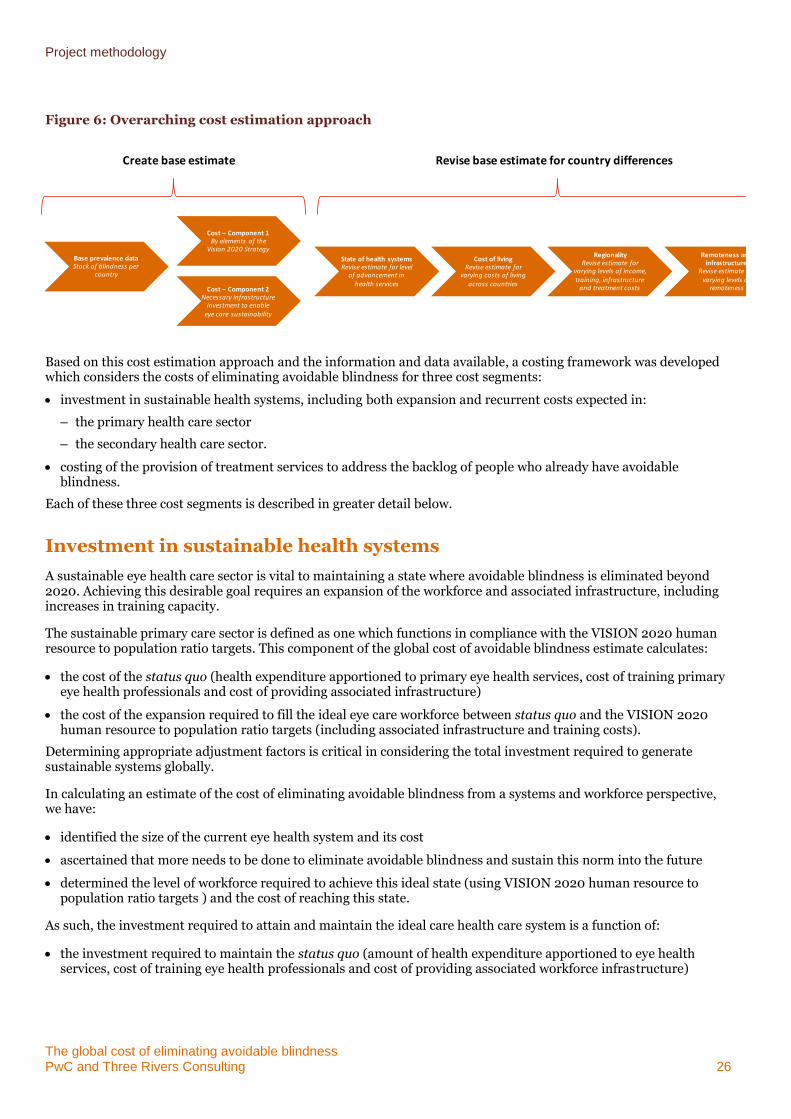
Drawing on the information and data collected, the global cost estimation was conducted in three steps. The first step used available data about the prevalence of avoidable blindness and the known costs of providing services to develop a base cost estimate, bearing in mind a number of factors including:
key types of avoidable blindness in a maximum of three categories (cataract, glaucoma and other avoidable blindness diseases)
costs of adequately implementing key components of the VISION2020 strategy, including technology, infrastructure, human resources and disease control.
The second step estimated the investment required to reduce ongoing preventable blindness to a sustainable level across global health sectors. The exact level of sustainability was based on workforce ratios outlined by VISION 2020. The first and second steps provide a base cost estimate. The third step revised the base cost estimate using information and data about four key factors to address differences in the cost of providing services across countries:
the state of the health system relevant to the treatment of preventable blindness
the cost of living
regionality (the differences apparent from one World Bank region to another)
access to health services across regional and remote areas of a country and the quality and reach of transportation infrastructure.
These steps are illustrated in Figure 6.
It is important to note that given the limited relevant information available, a number of assumptions have been made to facilitate the estimation exercise.
Project methodology
The global cost of eliminating avoidable blindness PwC and Three Rivers Consulting 26
Figure 6: Overarching cost estimation approach
Based on this cost estimation approach and the information and data available, a costing framework was developed which considers the costs of eliminating avoidable blindness for three cost segments:
investment in sustainable health systems, including both expansion and recurrent costs expected in:
– the primary health care sector
– the secondary health care sector.
costing of the provision of treatment services to address the backlog of people who already have avoidable blindness.
Each of these three cost segments is described in greater detail below.
Investment in sustainable health systems
A sustainable eye health care sector is vital to maintaining a state where avoidable blindness is eliminated beyond 2020. Achieving this desirable goal requires an expansion of the workforce and associated infrastructure, including increases in training capacity.
The sustainable primary care sector is defined as one which functions in compliance with the VISION 2020 human resource to population ratio targets. This component of the global cost of avoidable blindness estimate calculates:
the cost of the status quo (health expenditure apportioned to primary eye health services, cost of training primary eye health professionals and cost of providing associated infrastructure)
the cost of the expansion required to fill the ideal eye care workforce between status quo and the VISION 2020 human resource to population ratio targets (including associated infrastructure and training costs).
Determining appropriate adjustment factors is critical in considering the total investment required to generate sustainable systems globally.
In calculating an estimate of the cost of eliminating avoidable blindness from a systems and workforce perspective, we have:
identified the size of the current eye health system and its cost
ascertained that more needs to be done to eliminate avoidable blindness and sustain this norm into the future
determined the level of workforce required to achieve this ideal state (using VISION 2020 human resource to population ratio targets ) and the cost of reaching this state.
As such, the investment required to attain and maintain the ideal care health care system is a function of:
the investment required to maintain the status quo (amount of health expenditure apportioned to eye health services, cost of training eye health professionals and cost of providing associated workforce infrastructure)
Base prevalence dataStock of blindness per
country
Cost – Component 1By elements of the
Vision 2020 Strategy
Cost – Component 2Necessary infrastructure
investment to enable eye care sustainability
State of health systemsRevise estimate for level
of advancement in health services
Cost of livingRevise estimate for
varying costs of living across countries
RegionalityRevise estimate for
varying levels of income, training, infrastructure
and treatment costs
Remoteness and infrastructure
Revise estimate for varying levels of
remoteness
Create base estimate Revise base estimate for country differences
Project methodology
The global cost of eliminating avoidable blindness PwC and Three Rivers Consulting 27
the increased investment required to fill the ideal eye care workforce between the status quo and the VISION 2020 human resource to population ratio targets (sum of required infrastructure and training investment)
other costs, including the investment required for research as well as other types of care associated with avoidable blindness.
To determine the required investment to finance an ideal primary and secondary eye health system capable of achieving the objective of eliminating avoidable blindness, health expenditure per capita (based on World Development Indicator data) was multiplied by the percentage of health care that is spent on primary/secondary eye health care. Data for eye health care expenditure was based on selected countries: data from the United Kingdom, the United States of America, Canada, Japan and Australia was used to determine the proportion of health care spend on primary/secondary eye health care for high income nations (sourced from the 2009 Access Economics analysis); for other regions, the data determining the proportion of health care spend on primary/secondary eye health care was sourced from sponsor organisations for Peru, Paraguay and Nepal.
The ideal state is to be achieved by the year 2020. Accordingly, the investment required to achieve the necessary expansion has been spread across each year to 2020. Beyond 2020, it is expected that only recurrent costs of maintaining the ideal health system (costs pertaining to primary and secondary services, workforce training occasioned by turnover and capital depreciation) will continue.
Within an ideal eye health care sector, the primary care sector caters for individuals who have no visual impairment currently but may be susceptible to these conditions in future. The role of this sector is to conduct screening and other preventative and early intervention measures to prevent avoidable blindness.
A sustainable secondary care sector is necessary to continue to treat people who may acquire conditions that lead to avoidable blindness, or who become avoidably blind. A sustainable secondary care sector can manage these cohorts and prevent the build up of a ‘backlog’ of avoidable blindness after 2020. The role of the secondary care sector is to conduct surgery and other medical procedures to provide early intervention concerning conditions that may cause avoidable blindness and to prevent future deterioration.
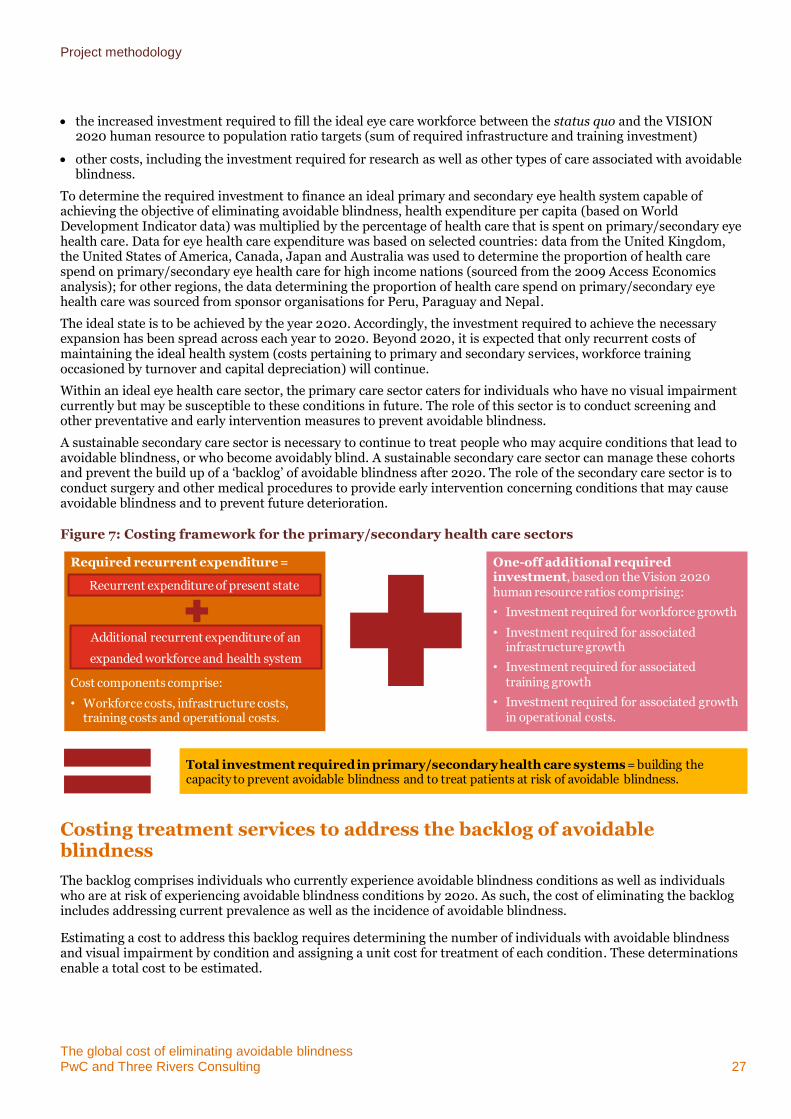
Figure 7: Costing framework for the primary/secondary health care sectors
Costing treatment services to address the backlog of avoidable blindness
The backlog comprises individuals who currently experience avoidable blindness conditions as well as individuals who are at risk of experiencing avoidable blindness conditions by 202o. As such, the cost of eliminating the backlog includes addressing current prevalence as well as the incidence of avoidable blindness.
Estimating a cost to address this backlog requires determining the number of individuals with avoidable blindness and visual impairment by condition and assigning a unit cost for treatment of each condition. These determinations enable a total cost to be estimated.
Required recurrent expenditure =
Cost components comprise:
• Workforce costs, infrastructure costs, training costs and operational costs.
One-off additional required investment, based on the Vision 2020 human resource ratios comprising:
• Investment required for workforce growth
• Investment required for associated infrastructure growth
• Investment required for associated training growth
• Investment required for associated growth in operational costs.
Total investment required in primary/secondary health care systems = building the capacity to prevent avoidable blindness and to treat patients at risk of avoidable blindness.
Recurrent expenditure of present state
Additional recurrent expenditure of an
expanded workforce and health system
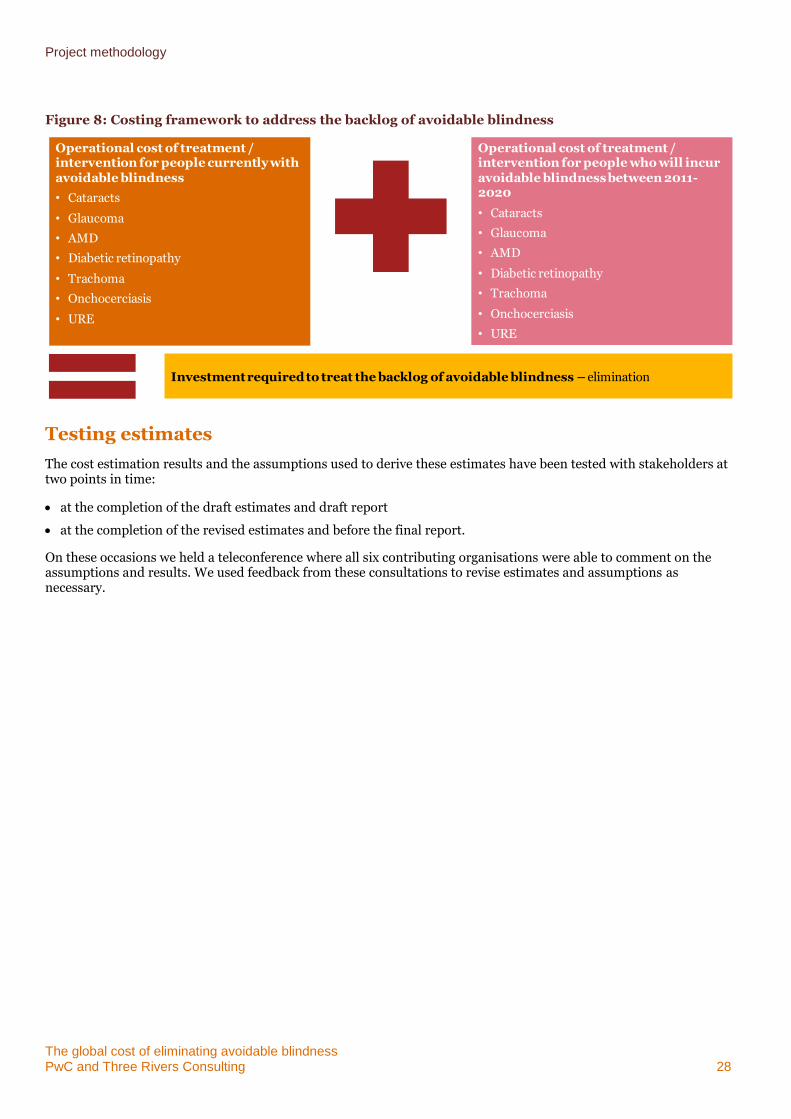
Project methodology
The global cost of eliminating avoidable blindness PwC and Three Rivers Consulting 28
Figure 8: Costing framework to address the backlog of avoidable blindness
Testing estimates
The cost estimation results and the assumptions used to derive these estimates have been tested with stakeholders at two points in time:
at the completion of the draft estimates and draft report
at the completion of the revised estimates and before the final report.
On these occasions we held a teleconference where all six contributing organisations were able to comment on the assumptions and results. We used feedback from these consultations to revise estimates and assumptions as necessary.
Operational cost of treatment / intervention for people currently with avoidable blindness
• Cataracts
• Glaucoma
• AMD
• Diabetic retinopathy
• Trachoma
• Onchocerciasis
• URE
Operational cost of treatment / intervention for people who will incur avoidable blindness between 2011-2020
• Cataracts
• Glaucoma
• AMD
• Diabetic retinopathy
• Trachoma
• Onchocerciasis
• URE
Investment required to treat the backlog of avoidable blindness – elimination
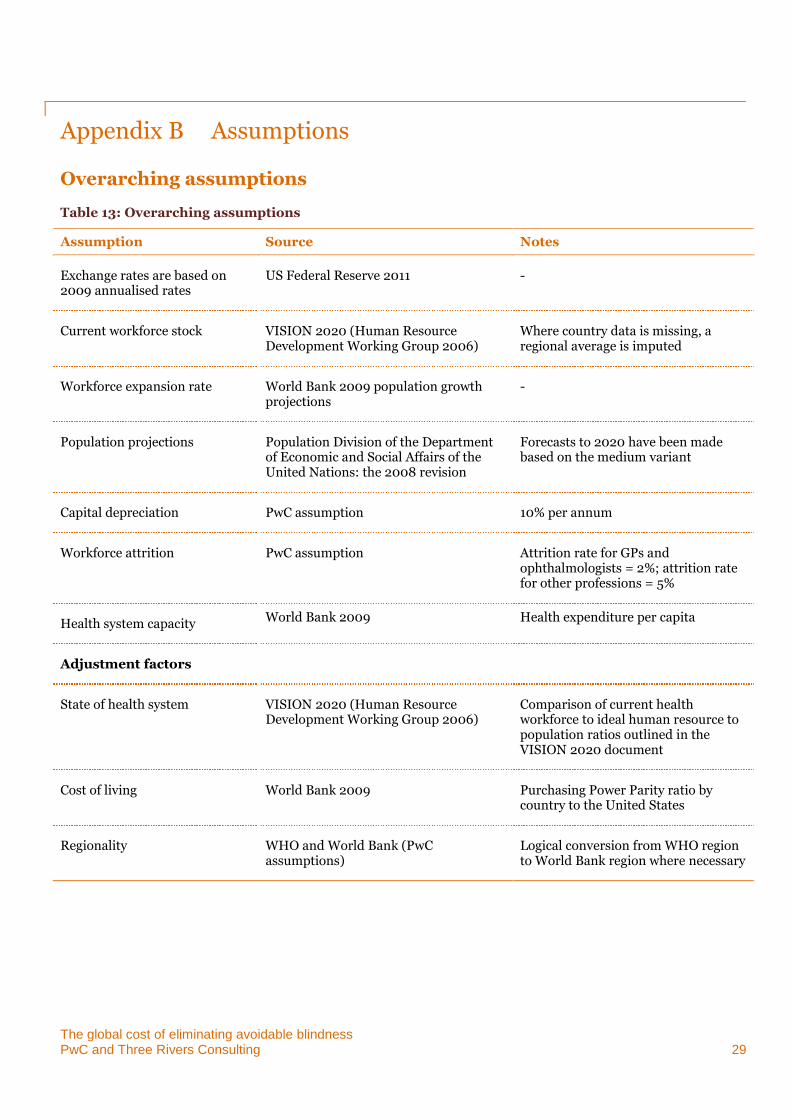
The global cost of eliminating avoidable blindness PwC and Three Rivers Consulting 29
Appendix B Assumptions
Overarching assumptions
Table 13: Overarching assumptions
Assumption Source Notes
Exchange rates are based on 2009 annualised rates
US Federal Reserve 2011 -
Current workforce stock VISION 2020 (Human Resource Development Working Group 2006)
Where country data is missing, a regional average is imputed
Workforce expansion rate World Bank 2009 population growth projections
-
Population projections Population Division of the Department of Economic and Social Affairs of the United Nations: the 2008 revision
Forecasts to 2020 have been made based on the medium variant
Capital depreciation PwC assumption 10% per annum
Workforce attrition PwC assumption Attrition rate for GPs and ophthalmologists = 2%; attrition rate for other professions = 5%
Health system capacity World Bank 2009 Health expenditure per capita
Adjustment factors
State of health system VISION 2020 (Human Resource Development Working Group 2006)
Comparison of current health workforce to ideal human resource to population ratios outlined in the VISION 2020 document
Cost of living World Bank 2009 Purchasing Power Parity ratio by country to the United States
Regionality WHO and World Bank (PwC assumptions)
Logical conversion from WHO region to World Bank region where necessary
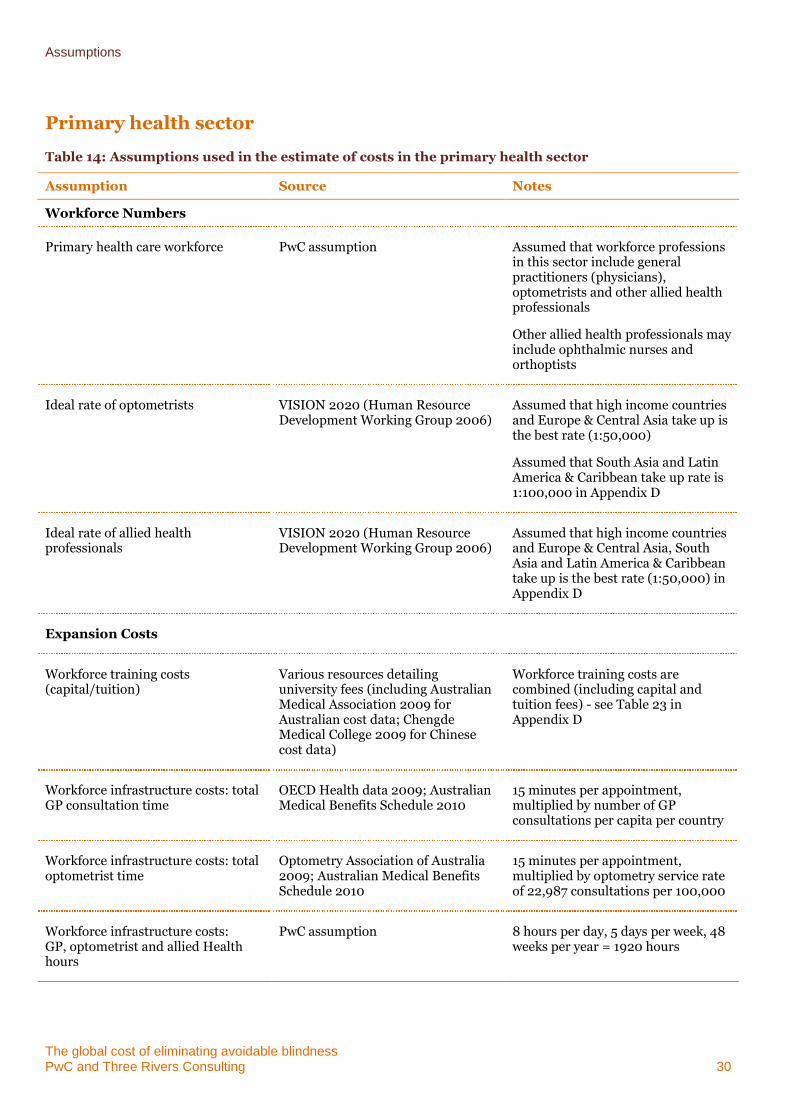
Assumptions
The global cost of eliminating avoidable blindness PwC and Three Rivers Consulting 30
Primary health sector
Table 14: Assumptions used in the estimate of costs in the primary health sector
Assumption Source Notes
Workforce Numbers
Primary health care workforce PwC assumption Assumed that workforce professions in this sector include general practitioners (physicians), optometrists and other allied health professionals
Other allied health professionals may include ophthalmic nurses and orthoptists
Ideal rate of optometrists VISION 2020 (Human Resource Development Working Group 2006)
Assumed that high income countries and Europe & Central Asia take up is the best rate (1:50,000)
Assumed that South Asia and Latin America & Caribbean take up rate is 1:100,000 in Appendix D
Ideal rate of allied health professionals
VISION 2020 (Human Resource Development Working Group 2006)
Assumed that high income countries and Europe & Central Asia, South Asia and Latin America & Caribbean take up is the best rate (1:50,000) in Appendix D
Expansion Costs
Workforce training costs (capital/tuition)
Various resources detailing university fees (including Australian Medical Association 2009 for Australian cost data; Chengde Medical College 2009 for Chinese cost data)
Workforce training costs are combined (including capital and tuition fees) - see Table 23 in Appendix D
Workforce infrastructure costs: total GP consultation time
OECD Health data 2009; Australian Medical Benefits Schedule 2010
15 minutes per appointment, multiplied by number of GP consultations per capita per country
Workforce infrastructure costs: total optometrist time
Optometry Association of Australia 2009; Australian Medical Benefits Schedule 2010
15 minutes per appointment, multiplied by optometry service rate of 22,987 consultations per 100,000
Workforce infrastructure costs: GP, optometrist and allied Health hours
PwC assumption 8 hours per day, 5 days per week, 48 weeks per year = 1920 hours
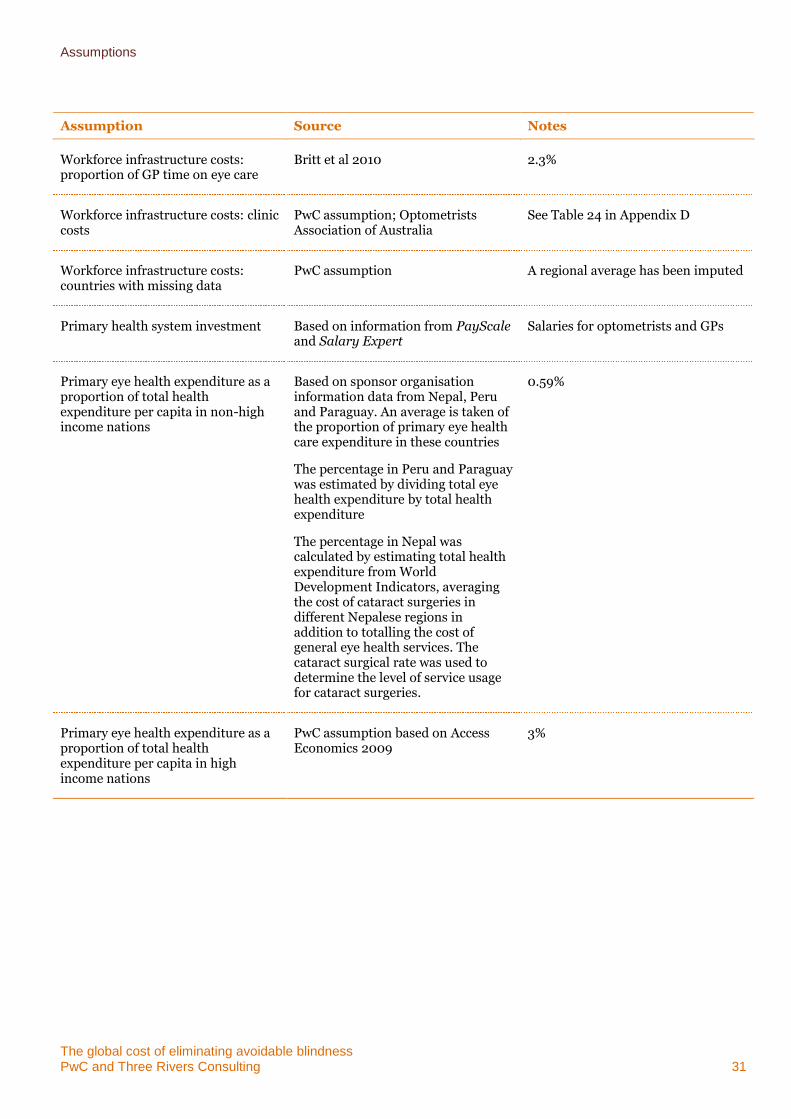
Assumptions
The global cost of eliminating avoidable blindness PwC and Three Rivers Consulting 31
Assumption Source Notes
Workforce infrastructure costs: proportion of GP time on eye care
Britt et al 2010 2.3%
Workforce infrastructure costs: clinic costs
PwC assumption; Optometrists Association of Australia
See Table 24 in Appendix D
Workforce infrastructure costs: countries with missing data
PwC assumption A regional average has been imputed
Primary health system investment Based on information from PayScale and Salary Expert
Salaries for optometrists and GPs
Primary eye health expenditure as a proportion of total health expenditure per capita in non-high income nations
Based on sponsor organisation information data from Nepal, Peru and Paraguay. An average is taken of the proportion of primary eye health care expenditure in these countries
The percentage in Peru and Paraguay was estimated by dividing total eye health expenditure by total health expenditure
The percentage in Nepal was calculated by estimating total health expenditure from World Development Indicators, averaging the cost of cataract surgeries in different Nepalese regions in addition to totalling the cost of general eye health services. The cataract surgical rate was used to determine the level of service usage for cataract surgeries.
0.59%
Primary eye health expenditure as a proportion of total health expenditure per capita in high income nations
PwC assumption based on Access Economics 2009
3%
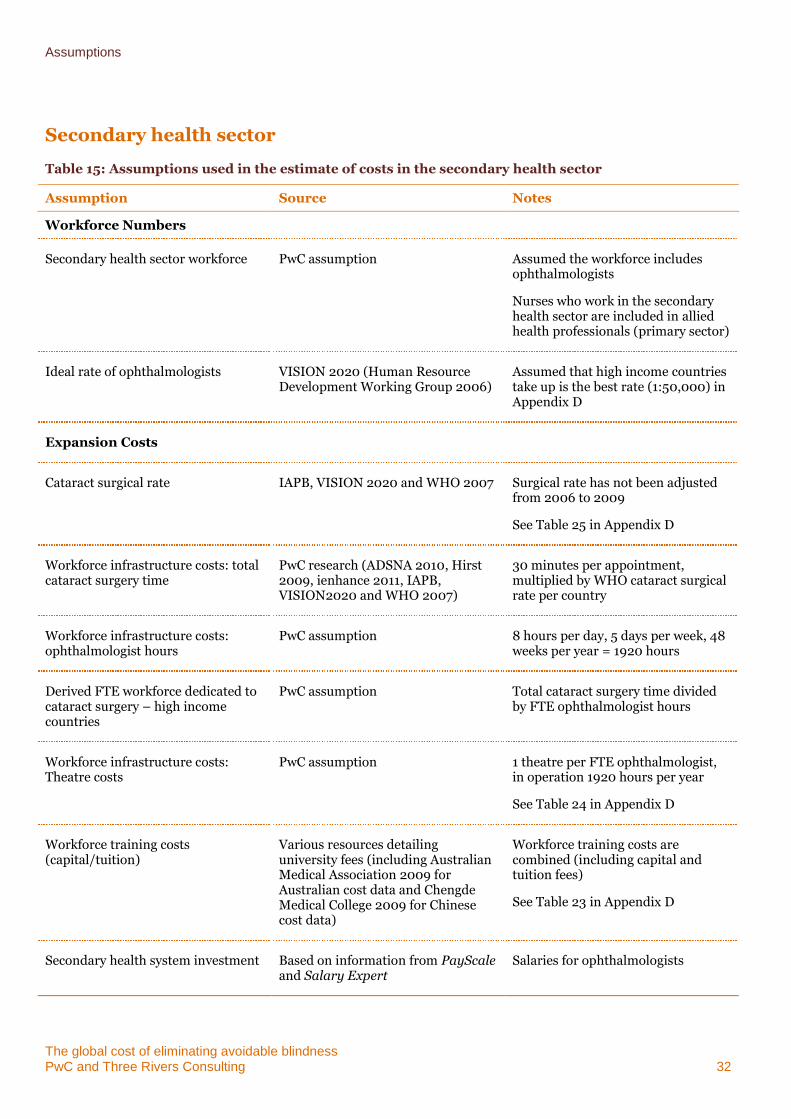
Assumptions
The global cost of eliminating avoidable blindness PwC and Three Rivers Consulting 32
Secondary health sector
Table 15: Assumptions used in the estimate of costs in the secondary health sector
Assumption Source Notes
Workforce Numbers
Secondary health sector workforce PwC assumption Assumed the workforce includes ophthalmologists
Nurses who work in the secondary health sector are included in allied health professionals (primary sector)
Ideal rate of ophthalmologists VISION 2020 (Human Resource Development Working Group 2006)
Assumed that high income countries take up is the best rate (1:50,000) in Appendix D
Expansion Costs
Cataract surgical rate IAPB, VISION 2020 and WHO 2007 Surgical rate has not been adjusted from 2006 to 2009
See Table 25 in Appendix D
Workforce infrastructure costs: total cataract surgery time
PwC research (ADSNA 2010, Hirst 2009, ienhance 2011, IAPB, VISION2020 and WHO 2007)
30 minutes per appointment, multiplied by WHO cataract surgical rate per country
Workforce infrastructure costs: ophthalmologist hours
PwC assumption 8 hours per day, 5 days per week, 48 weeks per year = 1920 hours
Derived FTE workforce dedicated to cataract surgery – high income countries
PwC assumption Total cataract surgery time divided by FTE ophthalmologist hours
Workforce infrastructure costs: Theatre costs
PwC assumption 1 theatre per FTE ophthalmologist, in operation 1920 hours per year
See Table 24 in Appendix D
Workforce training costs (capital/tuition)
Various resources detailing university fees (including Australian Medical Association 2009 for Australian cost data and Chengde Medical College 2009 for Chinese cost data)
Workforce training costs are combined (including capital and tuition fees)
See Table 23 in Appendix D
Secondary health system investment Based on information from PayScale and Salary Expert
Salaries for ophthalmologists
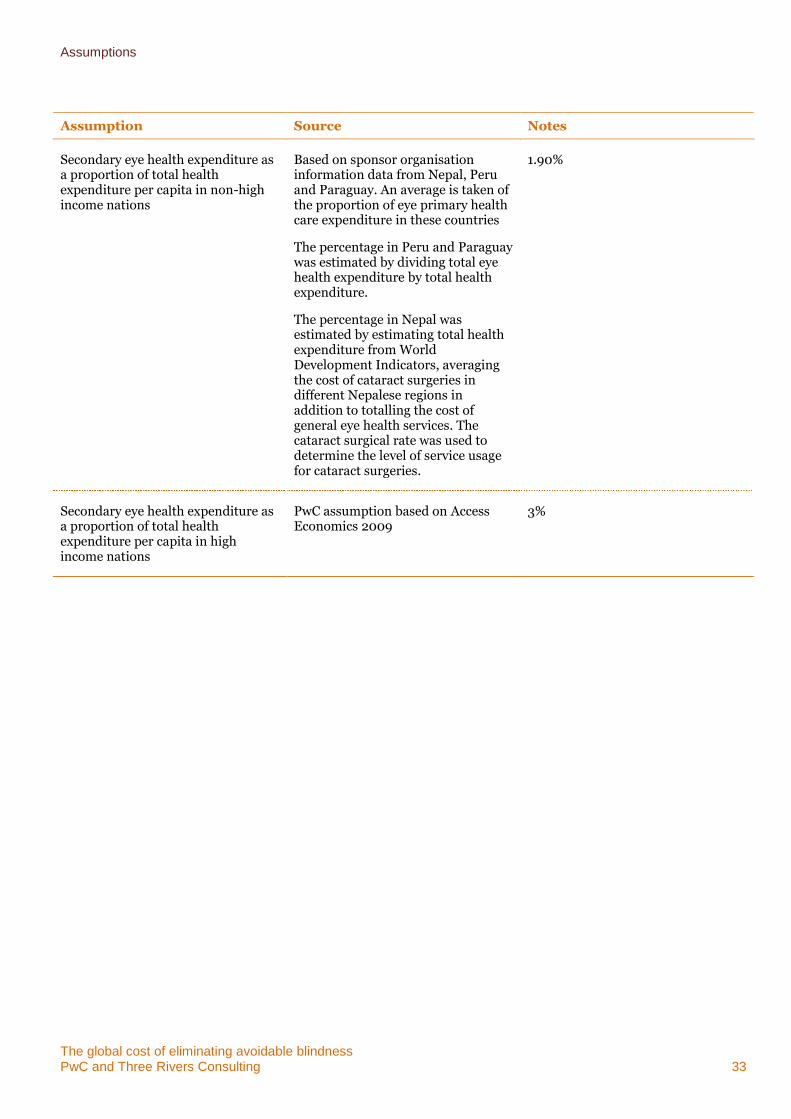
Assumptions
The global cost of eliminating avoidable blindness PwC and Three Rivers Consulting 33
Assumption Source Notes
Secondary eye health expenditure as a proportion of total health expenditure per capita in non-high income nations
Based on sponsor organisation information data from Nepal, Peru and Paraguay. An average is taken of the proportion of eye primary health care expenditure in these countries
The percentage in Peru and Paraguay was estimated by dividing total eye health expenditure by total health expenditure.
The percentage in Nepal was estimated by estimating total health expenditure from World Development Indicators, averaging the cost of cataract surgeries in different Nepalese regions in addition to totalling the cost of general eye health services. The cataract surgical rate was used to determine the level of service usage for cataract surgeries.
1.90%
Secondary eye health expenditure as a proportion of total health expenditure per capita in high income nations
PwC assumption based on Access Economics 2009
3%
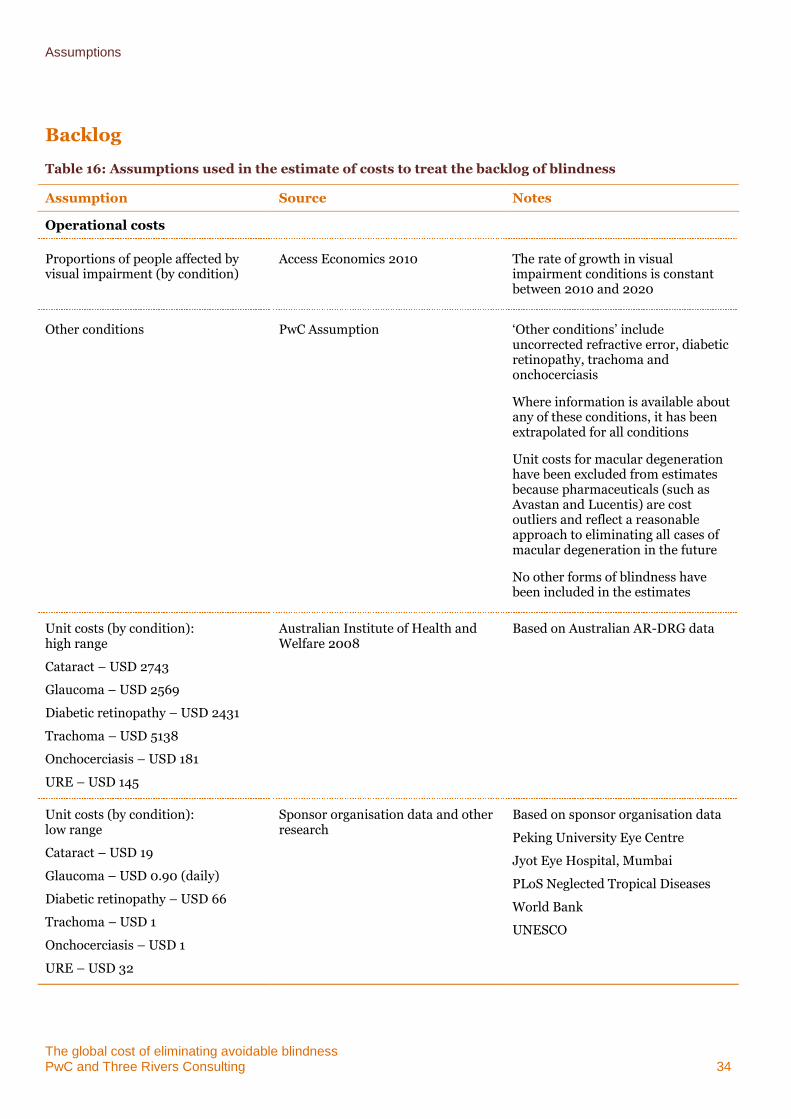
Assumptions
The global cost of eliminating avoidable blindness PwC and Three Rivers Consulting 34
Backlog
Table 16: Assumptions used in the estimate of costs to treat the backlog of blindness
Assumption Source Notes
Operational costs
Proportions of people affected by visual impairment (by condition)
Access Economics 2010 The rate of growth in visual impairment conditions is constant between 2010 and 2020
Other conditions PwC Assumption ‘Other conditions’ include uncorrected refractive error, diabetic retinopathy, trachoma and onchocerciasis
Where information is available about any of these conditions, it has been extrapolated for all conditions
Unit costs for macular degeneration have been excluded from estimates because pharmaceuticals (such as Avastan and Lucentis) are cost outliers and reflect a reasonable approach to eliminating all cases of macular degeneration in the future
No other forms of blindness have been included in the estimates
Unit costs (by condition): high range
Cataract – USD 2743
Glaucoma – USD 2569
Diabetic retinopathy – USD 2431
Trachoma – USD 5138
Onchocerciasis – USD 181
URE – USD 145
Australian Institute of Health and Welfare 2008
Based on Australian AR-DRG data
Unit costs (by condition): low range
Cataract – USD 19
Glaucoma – USD 0.90 (daily)
Diabetic retinopathy – USD 66
Trachoma – USD 1
Onchocerciasis – USD 1
URE – USD 32
Sponsor organisation data and other research
Based on sponsor organisation data
Peking University Eye Centre
Jyot Eye Hospital, Mumbai
PLoS Neglected Tropical Diseases
World Bank
UNESCO
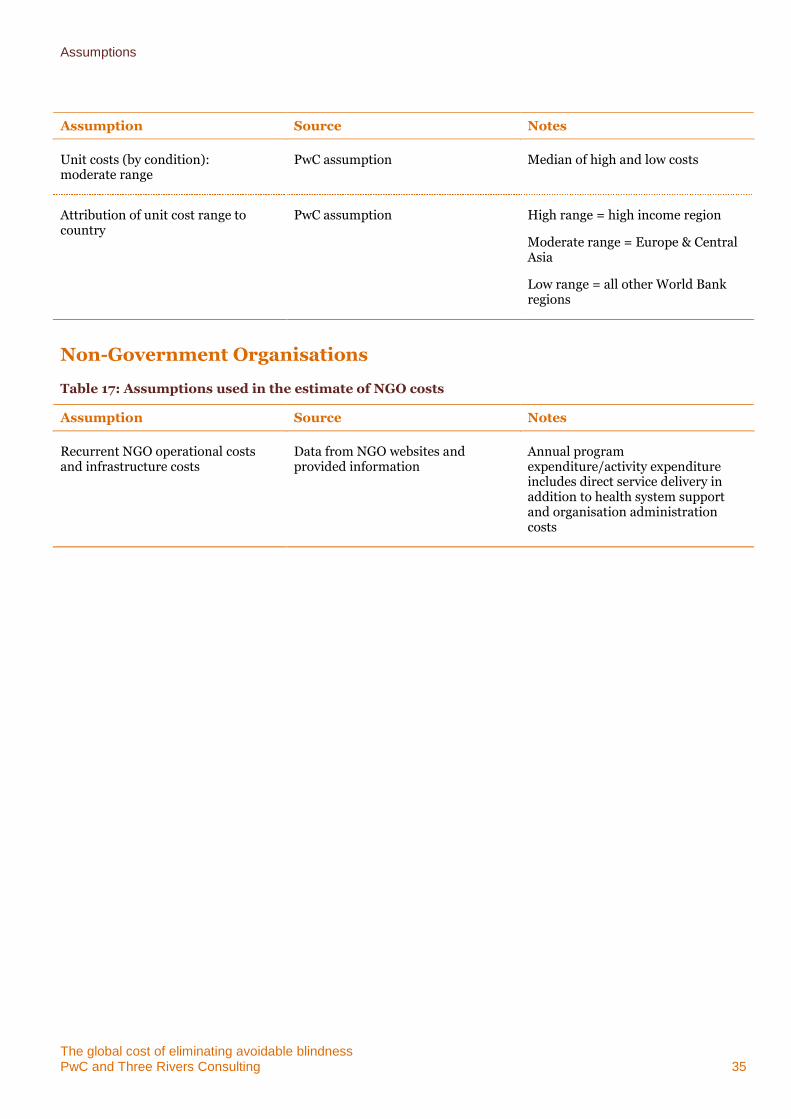
Assumptions
The global cost of eliminating avoidable blindness PwC and Three Rivers Consulting 35
Assumption Source Notes
Unit costs (by condition): moderate range
PwC assumption Median of high and low costs
Attribution of unit cost range to country
PwC assumption High range = high income region
Moderate range = Europe & Central Asia
Low range = all other World Bank regions
Non-Government Organisations
Table 17: Assumptions used in the estimate of NGO costs
Assumption Source Notes
Recurrent NGO operational costs and infrastructure costs
Data from NGO websites and provided information
Annual program expenditure/activity expenditure includes direct service delivery in addition to health system support and organisation administration costs
The global cost of eliminating avoidable blindness PwC and Three Rivers Consulting 36
Appendix C Sensitivity analysis
It is important to undertake a sensitivity analysis regarding any given cost estimate that had been constructed from a range of data sources and assumptions in order to examine elements of uncertainty within an estimate and their effect on the overall result.
Because this is the first cost estimate regarding the elimination of avoidable blindness, it is also useful to compare the cost estimate generated by this approach with other global and regional cost estimates of a similar order.
Comparison to other relevant published research
The estimated cost of eliminating avoidable blindness globally can be examined in relation to recent high-level estimates made concerning costs of avoidable blindness and visual impairment. It should be noted that the scope of each study varies and as such, only limited comparisons with the current estimate can be made.
The IAPB completed estimates about the cost of delivering VISION 2020 which amounted to USD$8 billion in 2008/09. However, these estimates focus on only on developing countries where the cost of eliminating avoidable blindness is typically lower. These estimates also do not consider in depth the costs required to increase the eye health and primary care workforce to assist in establishing sustainable health systems; these costs are included in our cost estimation approach. If we take the estimated direct health cost of treating the backlog of avoidable blindness over ten years to be $26.7 billion, and exclude the total direct cost to developed countries of $12.9 billion (to aid comparability) , the IAPB estimates and our estimates lie within a similar range in nominal terms.
Access Economics completed estimates about the cost of visual impairment in 2009/10 which amounted to direct health care expenditure of USD$2.3 trillion in 2010 and USD$2.8 trillion in 2020. Although our estimates include the investment required in the primary and secondary health sectors, we have based the prevalence of avoidable blindness on the latest WHO estimates, which are significantly lower than those used in the Access Economics calculations.
WHO estimated in 2004 that $30 billion annually would be required for capacity development to enable the poorest countries to deliver essential services. This estimate is somewhat lower than our estimate. However, it is important to understand that the WHO estimate considers only the poorest countries and only the ‘capacity development’ cost associated with delivery of ‘essential services’; this approach differs conceptually from our approach which focuses on building a sustainable ‘primary’ and ‘secondary’ health care system.
In 2009, Nakakeeto and Kumaranayake estimated the cost of eliminating HIV infection in infants and young children in seven countries over the 9 year period from 2007 to 2015 at USD $588 million. The methodology applied to generate this estimate involved modelling the costs and human resources required to expand relevant interventions in order to achieve the desired outcome. The costs were calculated on the basis of a provider perspective, including cost components for commodities, human resources, capital and family planning. Assumptions were made concerning drug use, access to services and unit costs for treatment, salaries, capital, service delivery and the future population.
In 2011, an estimate of the cost of eliminating the public health impact of trachoma by 2020 using the surgery – antibiotics – facial cleanliness – environmental improvements (SAFE) strategy was undertaken by INsight 2020. The Insight report estimates that the total cost of implementing the SAFE strategy in all known countries with trachoma to be between $420 million and $720 million, depending on future data availability. This estimate costs out the components of data gathering, surgery, drug distribution, encouraging face washing and contribution to environmental improvement efforts. The cost estimate to eliminate the prevalence and incidence of the trachoma backlog amounted to $451 million, which is within the lower limit of the INSight estimate.
The Fred Hollows Foundation estimated that the eradication of avoidable blindness in South East Asia (assuming a total population of some 451 million, including 5.5 million people who are blind) will cost AUD$580 million over ten years. This approach uses the model developed by Dr Nag Rao of the LV Prasad Eye Institute and the IAPB. The model frames the ideal eye care system within a four-level pyramid featuring facilities that range from a vision centre to a centre of excellence. This estimate uses a different population base as well as a different methodology: it builds an ideal health system on the basis of the cost of different types of facilities. Our approach builds an ideal health system on the basis of the VISION 2020 human resource to population ratios. The following clarifies the differences in population base used in the two cost estimates:
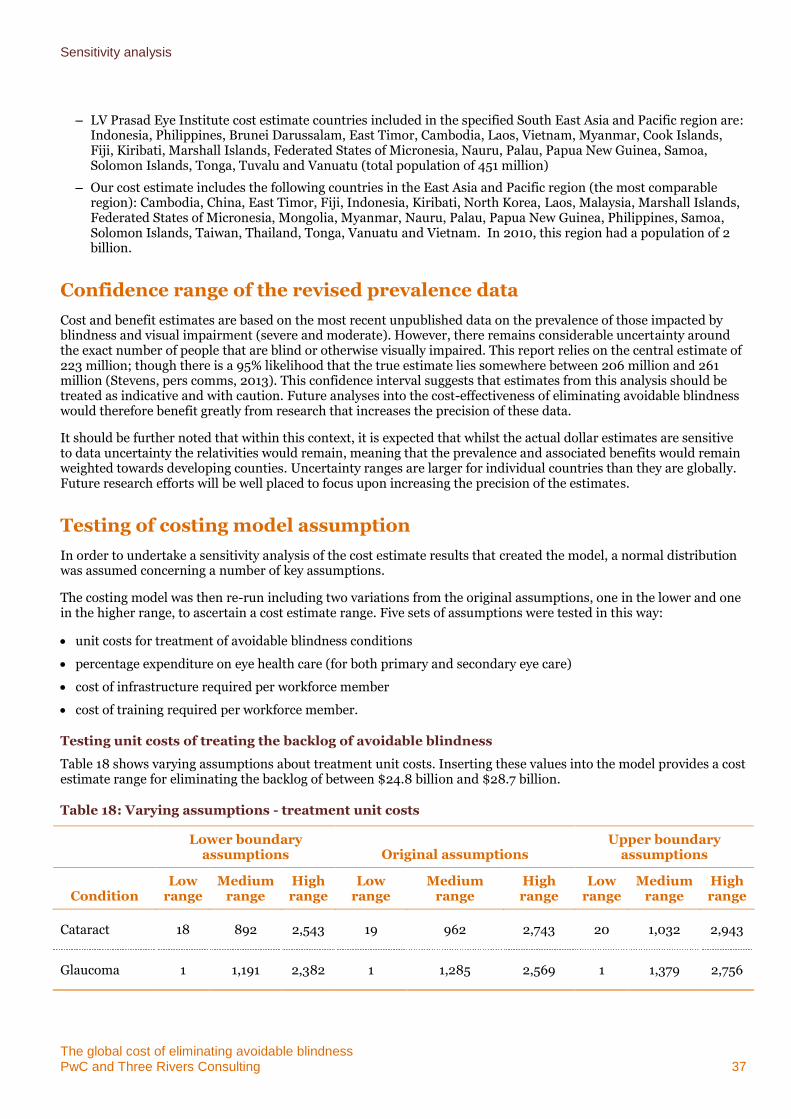
Sensitivity analysis
The global cost of eliminating avoidable blindness PwC and Three Rivers Consulting 37
– LV Prasad Eye Institute cost estimate countries included in the specified South East Asia and Pacific region are: Indonesia, Philippines, Brunei Darussalam, East Timor, Cambodia, Laos, Vietnam, Myanmar, Cook Islands, Fiji, Kiribati, Marshall Islands, Federated States of Micronesia, Nauru, Palau, Papua New Guinea, Samoa, Solomon Islands, Tonga, Tuvalu and Vanuatu (total population of 451 million)
– Our cost estimate includes the following countries in the East Asia and Pacific region (the most comparable region): Cambodia, China, East Timor, Fiji, Indonesia, Kiribati, North Korea, Laos, Malaysia, Marshall Islands, Federated States of Micronesia, Mongolia, Myanmar, Nauru, Palau, Papua New Guinea, Philippines, Samoa, Solomon Islands, Taiwan, Thailand, Tonga, Vanuatu and Vietnam. In 2010, this region had a population of 2 billion.
Confidence range of the revised prevalence data
Cost and benefit estimates are based on the most recent unpublished data on the prevalence of those impacted by blindness and visual impairment (severe and moderate). However, there remains considerable uncertainty around the exact number of people that are blind or otherwise visually impaired. This report relies on the central estimate of 223 million; though there is a 95% likelihood that the true estimate lies somewhere between 206 million and 261 million (Stevens, pers comms, 2013). This confidence interval suggests that estimates from this analysis should be treated as indicative and with caution. Future analyses into the cost-effectiveness of eliminating avoidable blindness would therefore benefit greatly from research that increases the precision of these data.
It should be further noted that within this context, it is expected that whilst the actual dollar estimates are sensitive to data uncertainty the relativities would remain, meaning that the prevalence and associated benefits would remain weighted towards developing counties. Uncertainty ranges are larger for individual countries than they are globally. Future research efforts will be well placed to focus upon increasing the precision of the estimates.
Testing of costing model assumption
In order to undertake a sensitivity analysis of the cost estimate results that created the model, a normal distribution was assumed concerning a number of key assumptions.
The costing model was then re-run including two variations from the original assumptions, one in the lower and one in the higher range, to ascertain a cost estimate range. Five sets of assumptions were tested in this way:
unit costs for treatment of avoidable blindness conditions
percentage expenditure on eye health care (for both primary and secondary eye care)
cost of infrastructure required per workforce member
cost of training required per workforce member.
Testing unit costs of treating the backlog of avoidable blindness
Table 18 shows varying assumptions about treatment unit costs. Inserting these values into the model provides a cost estimate range for eliminating the backlog of between $24.8 billion and $28.7 billion.
Table 18: Varying assumptions - treatment unit costs
Lower boundary
assumptions Original assumptions Upper boundary
assumptions
Condition Low
range Medium
range High range
Low range
Medium range
High range
Low range
Medium range
High range
Cataract 18 892 2,543 19 962 2,743 20 1,032 2,943
Glaucoma 1 1,191 2,382 1 1,285 2,569 1 1,379 2,756
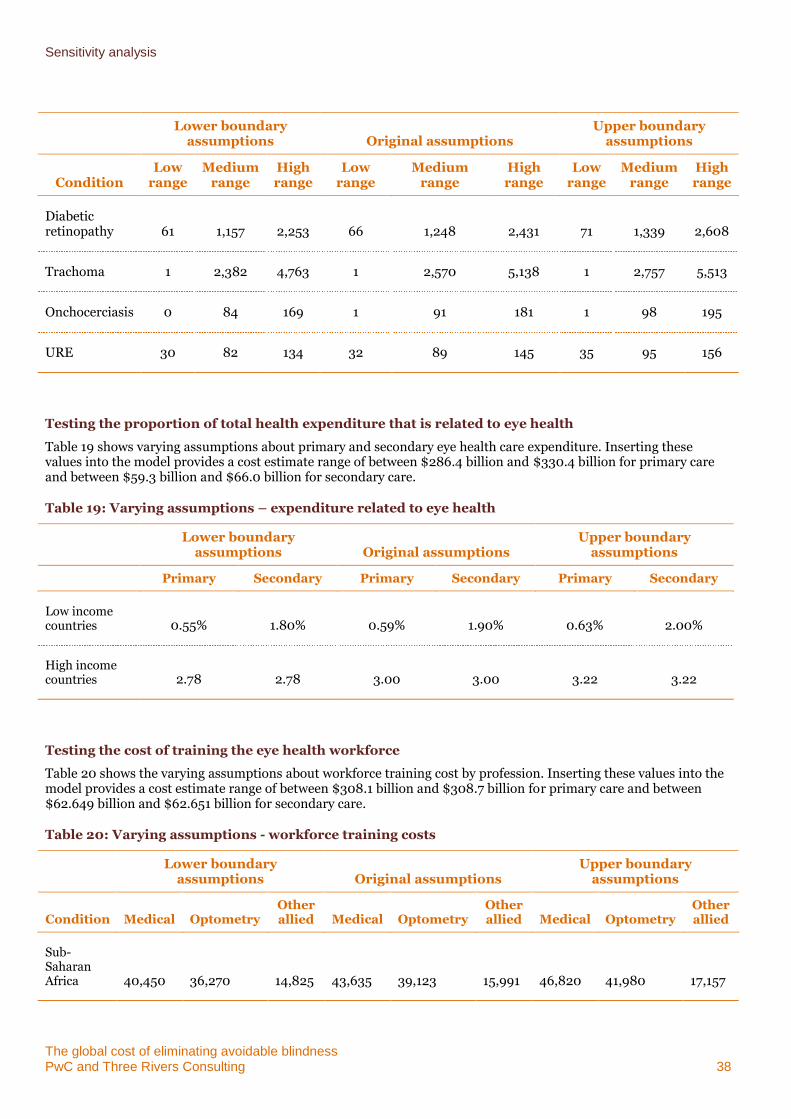
Sensitivity analysis
The global cost of eliminating avoidable blindness PwC and Three Rivers Consulting 38
Lower boundary
assumptions Original assumptions Upper boundary
assumptions
Condition Low
range Medium
range High range
Low range
Medium range
High range
Low range
Medium range
High range
Diabetic retinopathy 61 1,157 2,253 66 1,248 2,431 71 1,339 2,608
Trachoma 1 2,382 4,763 1 2,570 5,138 1 2,757 5,513
Onchocerciasis 0 84 169 1 91 181 1 98 195
URE 30 82 134 32 89 145 35 95 156
Testing the proportion of total health expenditure that is related to eye health
Table 19 shows varying assumptions about primary and secondary eye health care expenditure. Inserting these values into the model provides a cost estimate range of between $286.4 billion and $330.4 billion for primary care and between $59.3 billion and $66.0 billion for secondary care.
Table 19: Varying assumptions – expenditure related to eye health
Lower boundary
assumptions Original assumptions Upper boundary
assumptions
Primary Secondary Primary Secondary Primary Secondary
Low income countries 0.55% 1.80% 0.59% 1.90% 0.63% 2.00%
High income countries 2.78 2.78 3.00 3.00 3.22 3.22
Testing the cost of training the eye health workforce
Table 20 shows the varying assumptions about workforce training cost by profession. Inserting these values into the model provides a cost estimate range of between $308.1 billion and $308.7 billion for primary care and between $62.649 billion and $62.651 billion for secondary care.
Table 20: Varying assumptions - workforce training costs
Lower boundary
assumptions Original assumptions Upper boundary
assumptions
Condition Medical Optometry Other allied Medical Optometry
Other allied Medical Optometry
Other allied
Sub-Saharan Africa 40,450 36,270 14,825 43,635 39,123 15,991 46,820 41,980 17,157
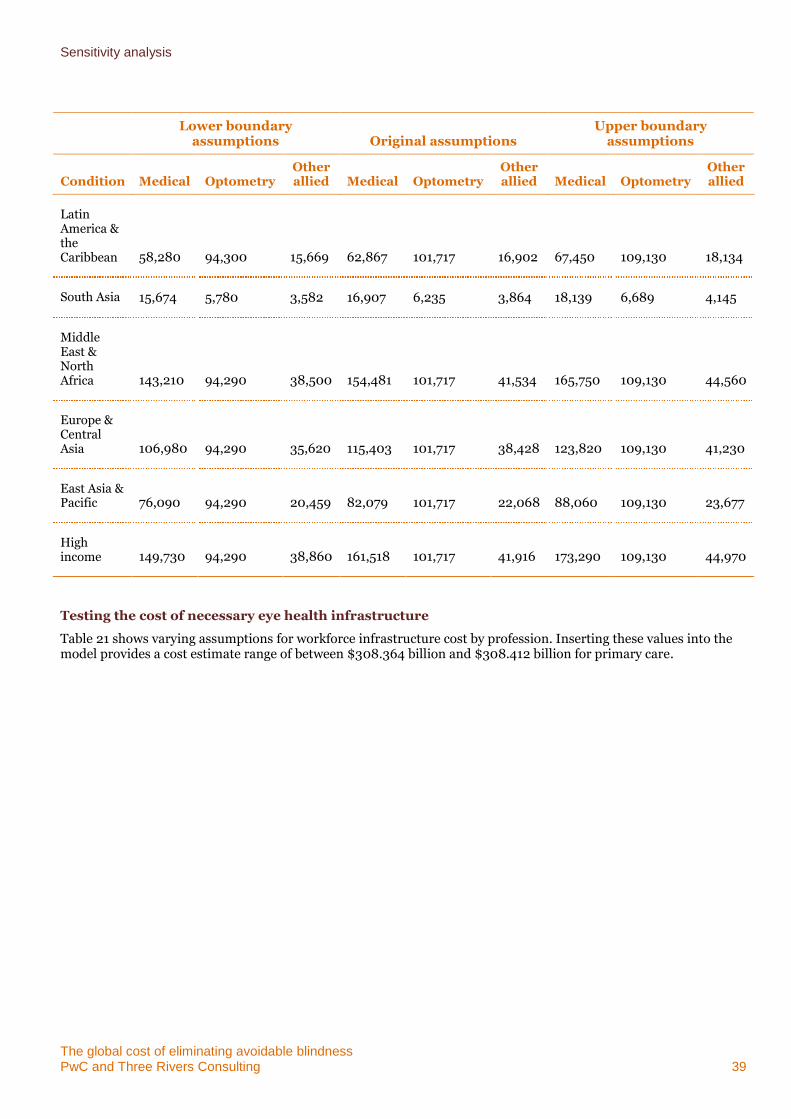
Sensitivity analysis
The global cost of eliminating avoidable blindness PwC and Three Rivers Consulting 39
Lower boundary
assumptions Original assumptions Upper boundary
assumptions
Condition Medical Optometry Other allied Medical Optometry
Other allied Medical Optometry
Other allied
Latin America & the Caribbean 58,280 94,300 15,669 62,867 101,717 16,902 67,450 109,130 18,134
South Asia 15,674 5,780 3,582 16,907 6,235 3,864 18,139 6,689 4,145
Middle East & North Africa 143,210 94,290 38,500 154,481 101,717 41,534 165,750 109,130 44,560
Europe & Central Asia 106,980 94,290 35,620 115,403 101,717 38,428 123,820 109,130 41,230
East Asia & Pacific 76,090 94,290 20,459 82,079 101,717 22,068 88,060 109,130 23,677
High income 149,730 94,290 38,860 161,518 101,717 41,916 173,290 109,130 44,970
Testing the cost of necessary eye health infrastructure
Table 21 shows varying assumptions for workforce infrastructure cost by profession. Inserting these values into the model provides a cost estimate range of between $308.364 billion and $308.412 billion for primary care.
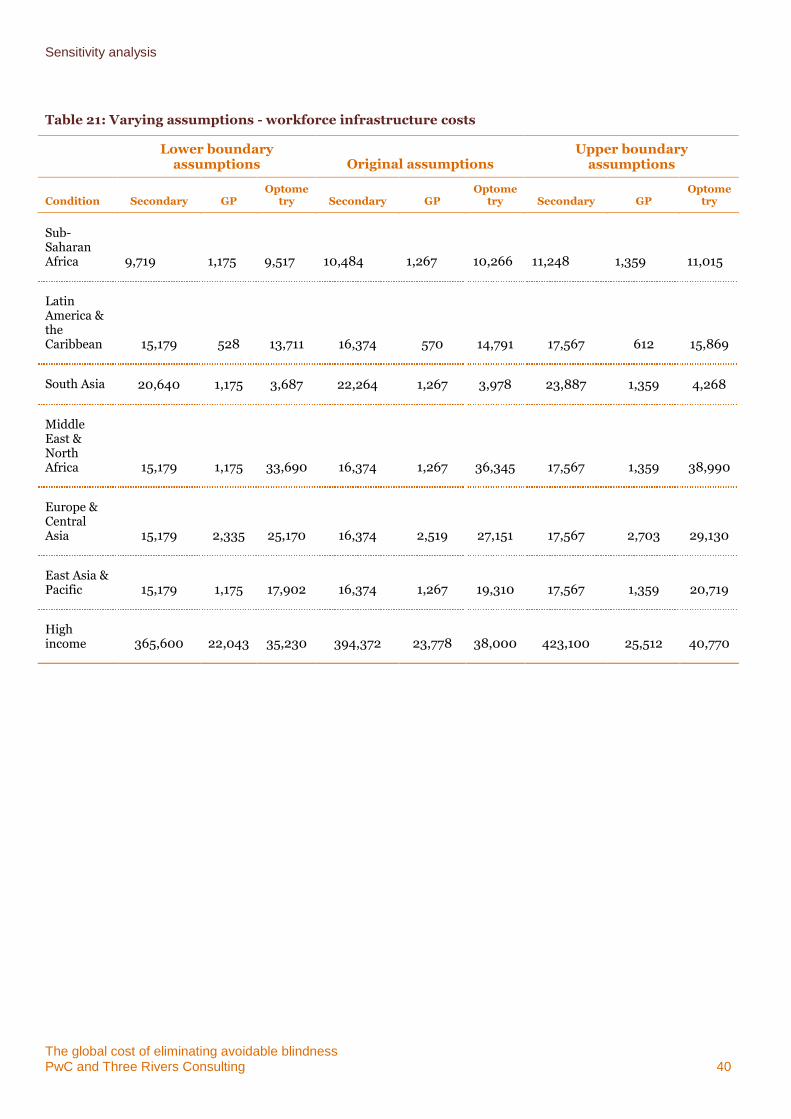
Sensitivity analysis
The global cost of eliminating avoidable blindness PwC and Three Rivers Consulting 40
Table 21: Varying assumptions - workforce infrastructure costs
Lower boundary
assumptions Original assumptions Upper boundary
assumptions
Condition Secondary GP Optome
try Secondary GP Optome
try Secondary GP Optome
try
Sub-Saharan Africa 9,719 1,175 9,517 10,484 1,267 10,266 11,248 1,359 11,015
Latin America & the Caribbean 15,179 528 13,711 16,374 570 14,791 17,567 612 15,869
South Asia 20,640 1,175 3,687 22,264 1,267 3,978 23,887 1,359 4,268
Middle East & North Africa 15,179 1,175 33,690 16,374 1,267 36,345 17,567 1,359 38,990
Europe & Central Asia 15,179 2,335 25,170 16,374 2,519 27,151 17,567 2,703 29,130
East Asia & Pacific 15,179 1,175 17,902 16,374 1,267 19,310 17,567 1,359 20,719
High income 365,600 22,043 35,230 394,372 23,778 38,000 423,100 25,512 40,770
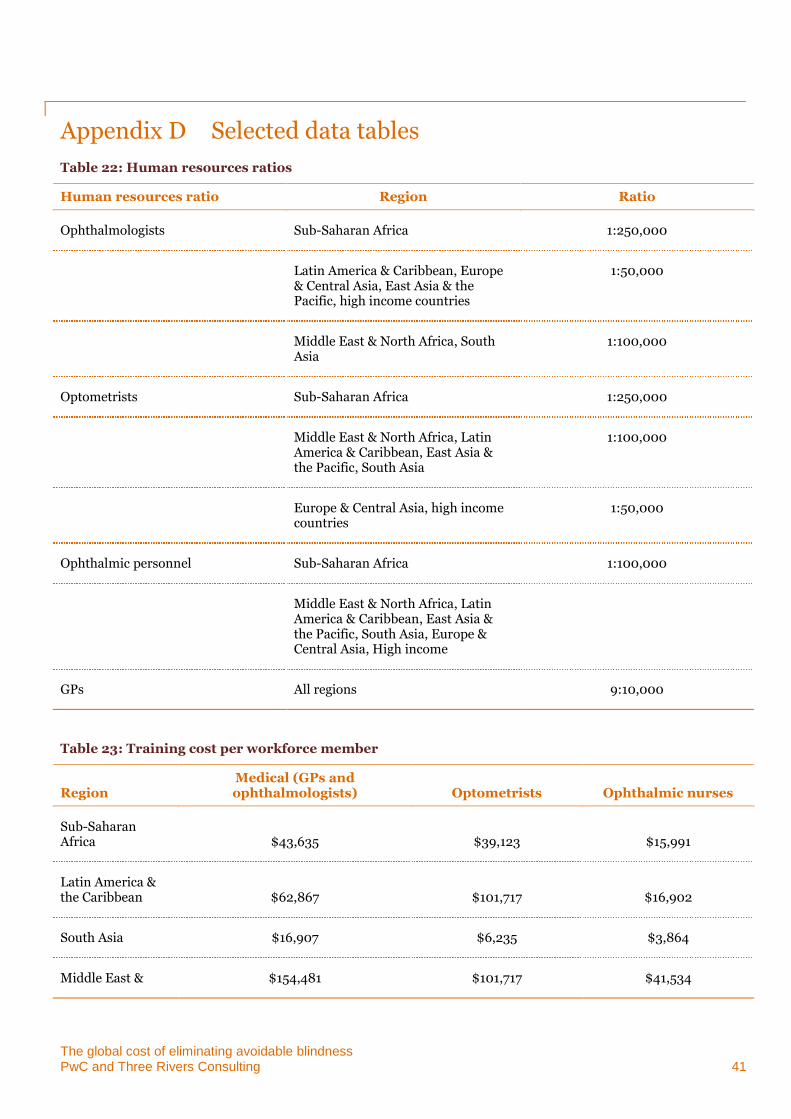
The global cost of eliminating avoidable blindness PwC and Three Rivers Consulting 41
Appendix D Selected data tables
Table 22: Human resources ratios
Human resources ratio Region Ratio
Ophthalmologists Sub-Saharan Africa 1:250,000
Latin America & Caribbean, Europe & Central Asia, East Asia & the Pacific, high income countries
1:50,000
Middle East & North Africa, South Asia
1:100,000
Optometrists Sub-Saharan Africa 1:250,000
Middle East & North Africa, Latin America & Caribbean, East Asia & the Pacific, South Asia
1:100,000
Europe & Central Asia, high income countries
1:50,000
Ophthalmic personnel Sub-Saharan Africa 1:100,000
Middle East & North Africa, Latin America & Caribbean, East Asia & the Pacific, South Asia, Europe & Central Asia, High income
GPs All regions 9:10,000
Table 23: Training cost per workforce member
Region Medical (GPs and ophthalmologists) Optometrists Ophthalmic nurses
Sub-Saharan Africa $43,635 $39,123 $15,991
Latin America & the Caribbean $62,867 $101,717 $16,902
South Asia $16,907 $6,235 $3,864
Middle East & $154,481 $101,717 $41,534
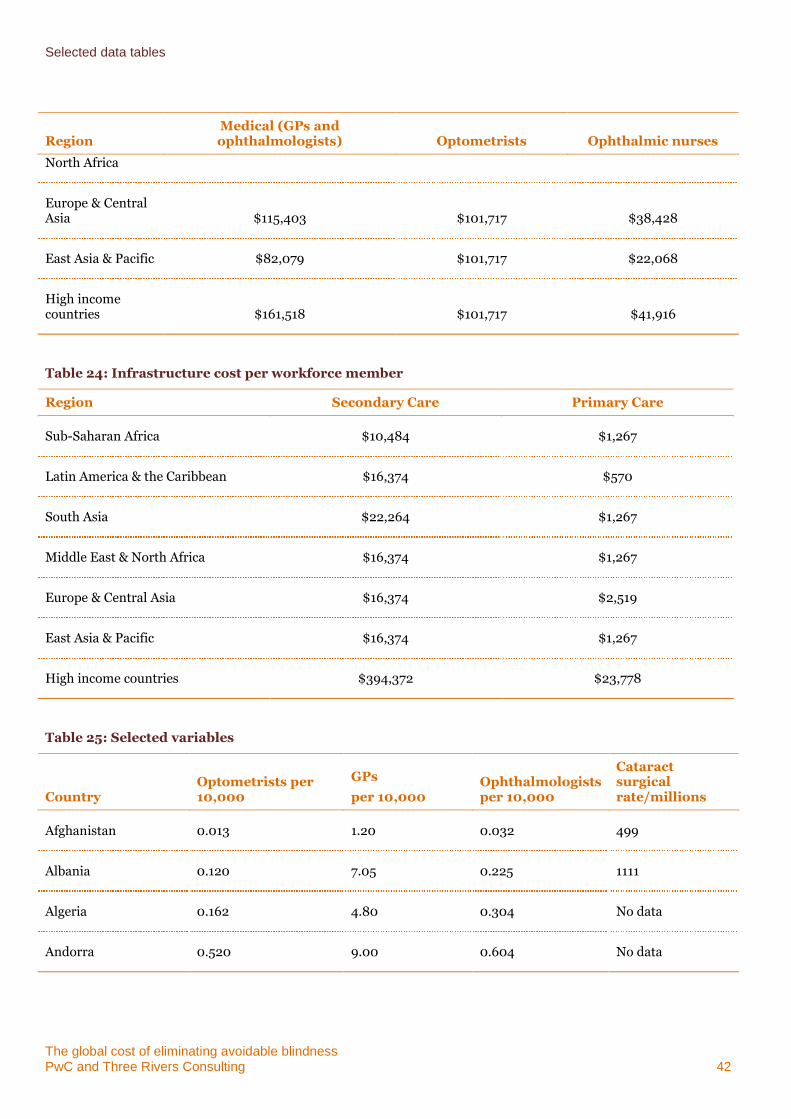
Selected data tables
The global cost of eliminating avoidable blindness PwC and Three Rivers Consulting 42
Region Medical (GPs and ophthalmologists) Optometrists Ophthalmic nurses
North Africa
Europe & Central Asia $115,403 $101,717 $38,428
East Asia & Pacific $82,079 $101,717 $22,068
High income countries $161,518 $101,717 $41,916
Table 24: Infrastructure cost per workforce member
Region Secondary Care Primary Care
Sub-Saharan Africa $10,484 $1,267
Latin America & the Caribbean $16,374 $570
South Asia $22,264 $1,267
Middle East & North Africa $16,374 $1,267
Europe & Central Asia $16,374 $2,519
East Asia & Pacific $16,374 $1,267
High income countries $394,372 $23,778
Table 25: Selected variables
Country Optometrists per 10,000
GPs
per 10,000 Ophthalmologists per 10,000
Cataract surgical rate/millions
Afghanistan 0.013 1.20 0.032 499
Albania 0.120 7.05 0.225 1111
Algeria 0.162 4.80 0.304 No data
Andorra 0.520 9.00 0.604 No data
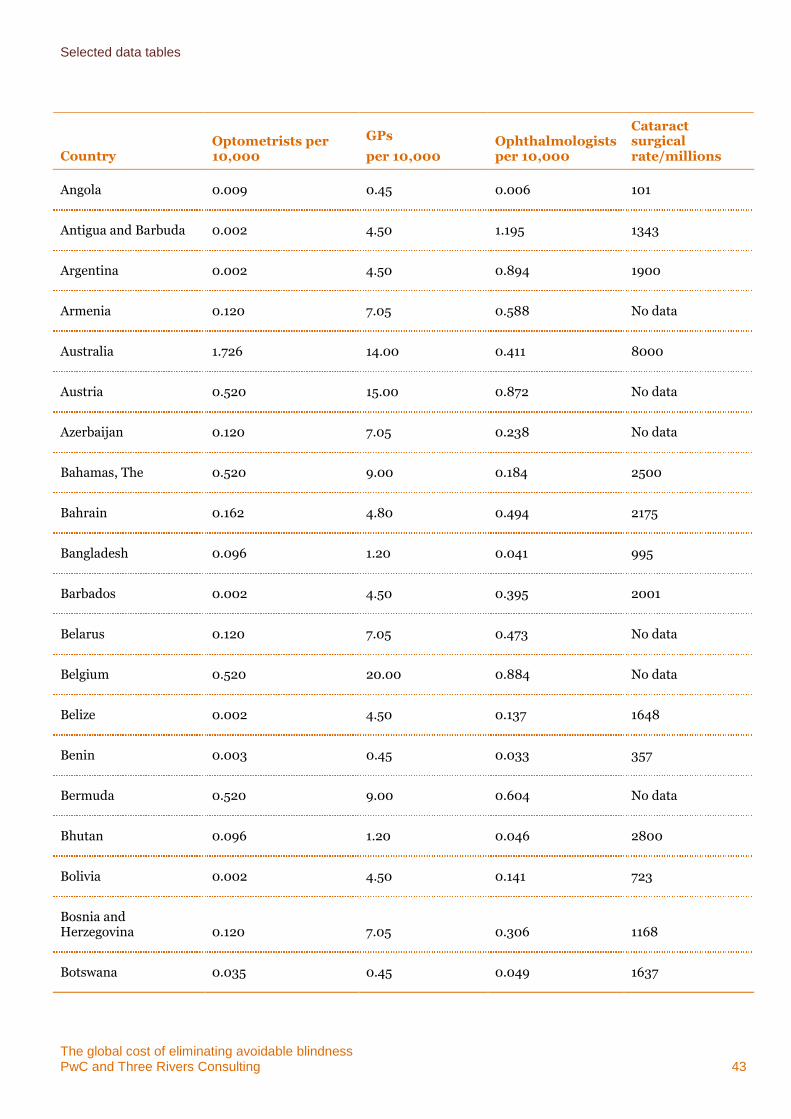
Selected data tables
The global cost of eliminating avoidable blindness PwC and Three Rivers Consulting 43
Country Optometrists per 10,000
GPs
per 10,000 Ophthalmologists per 10,000
Cataract surgical rate/millions
Angola 0.009 0.45 0.006 101
Antigua and Barbuda 0.002 4.50 1.195 1343
Argentina 0.002 4.50 0.894 1900
Armenia 0.120 7.05 0.588 No data
Australia 1.726 14.00 0.411 8000
Austria 0.520 15.00 0.872 No data
Azerbaijan 0.120 7.05 0.238 No data
Bahamas, The 0.520 9.00 0.184 2500
Bahrain 0.162 4.80 0.494 2175
Bangladesh 0.096 1.20 0.041 995
Barbados 0.002 4.50 0.395 2001
Belarus 0.120 7.05 0.473 No data
Belgium 0.520 20.00 0.884 No data
Belize 0.002 4.50 0.137 1648
Benin 0.003 0.45 0.033 357
Bermuda 0.520 9.00 0.604 No data
Bhutan 0.096 1.20 0.046 2800
Bolivia 0.002 4.50 0.141 723
Bosnia and Herzegovina 0.120 7.05 0.306 1168
Botswana 0.035 0.45 0.049 1637
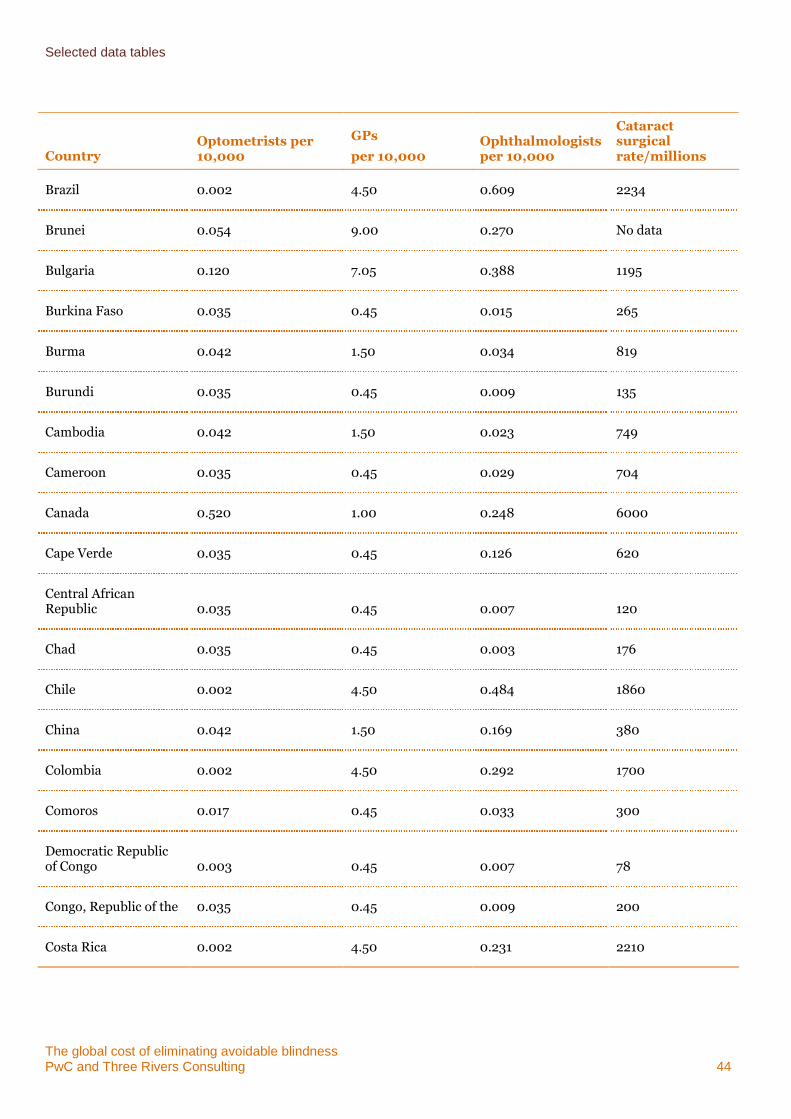
Selected data tables
The global cost of eliminating avoidable blindness PwC and Three Rivers Consulting 44
Country Optometrists per 10,000
GPs
per 10,000 Ophthalmologists per 10,000
Cataract surgical rate/millions
Brazil 0.002 4.50 0.609 2234
Brunei 0.054 9.00 0.270 No data
Bulgaria 0.120 7.05 0.388 1195
Burkina Faso 0.035 0.45 0.015 265
Burma 0.042 1.50 0.034 819
Burundi 0.035 0.45 0.009 135
Cambodia 0.042 1.50 0.023 749
Cameroon 0.035 0.45 0.029 704
Canada 0.520 1.00 0.248 6000
Cape Verde 0.035 0.45 0.126 620
Central African Republic 0.035 0.45 0.007 120
Chad 0.035 0.45 0.003 176
Chile 0.002 4.50 0.484 1860
China 0.042 1.50 0.169 380
Colombia 0.002 4.50 0.292 1700
Comoros 0.017 0.45 0.033 300
Democratic Republic of Congo 0.003 0.45 0.007 78
Congo, Republic of the 0.035 0.45 0.009 200
Costa Rica 0.002 4.50 0.231 2210
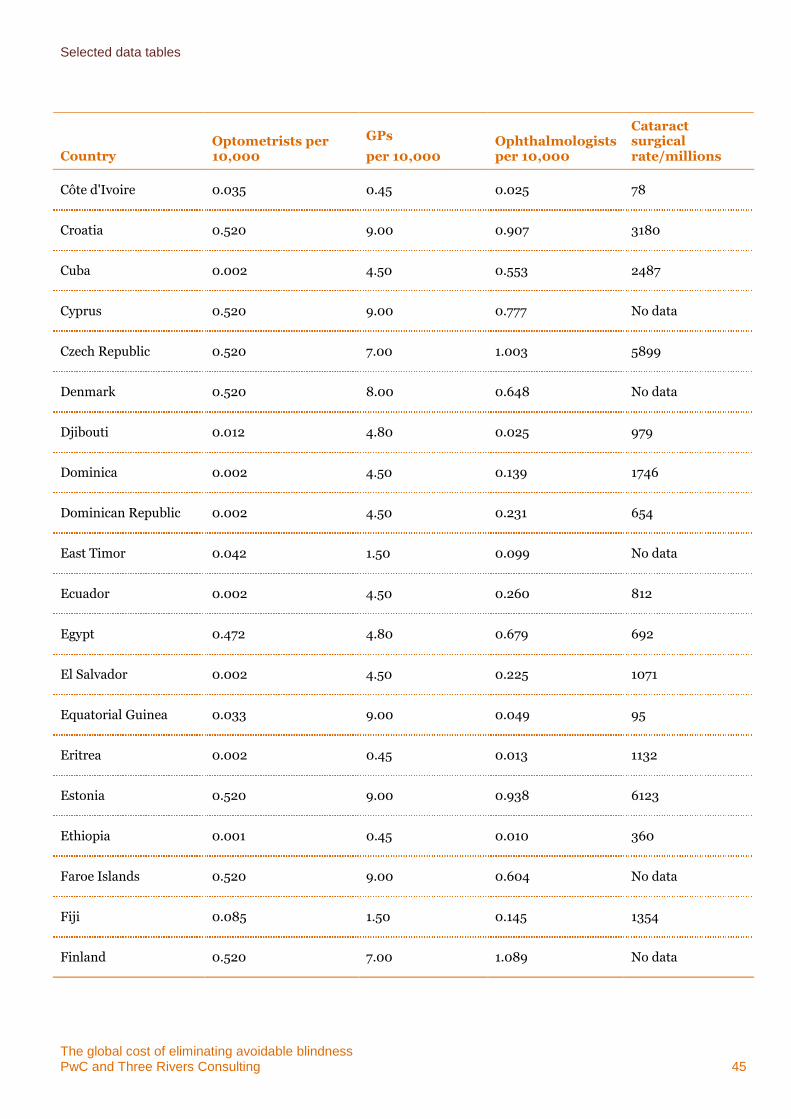
Selected data tables
The global cost of eliminating avoidable blindness PwC and Three Rivers Consulting 45
Country Optometrists per 10,000
GPs
per 10,000 Ophthalmologists per 10,000
Cataract surgical rate/millions
Côte d'Ivoire 0.035 0.45 0.025 78
Croatia 0.520 9.00 0.907 3180
Cuba 0.002 4.50 0.553 2487
Cyprus 0.520 9.00 0.777 No data
Czech Republic 0.520 7.00 1.003 5899
Denmark 0.520 8.00 0.648 No data
Djibouti 0.012 4.80 0.025 979
Dominica 0.002 4.50 0.139 1746
Dominican Republic 0.002 4.50 0.231 654
East Timor 0.042 1.50 0.099 No data
Ecuador 0.002 4.50 0.260 812
Egypt 0.472 4.80 0.679 692
El Salvador 0.002 4.50 0.225 1071
Equatorial Guinea 0.033 9.00 0.049 95
Eritrea 0.002 0.45 0.013 1132
Estonia 0.520 9.00 0.938 6123
Ethiopia 0.001 0.45 0.010 360
Faroe Islands 0.520 9.00 0.604 No data
Fiji 0.085 1.50 0.145 1354
Finland 0.520 7.00 1.089 No data
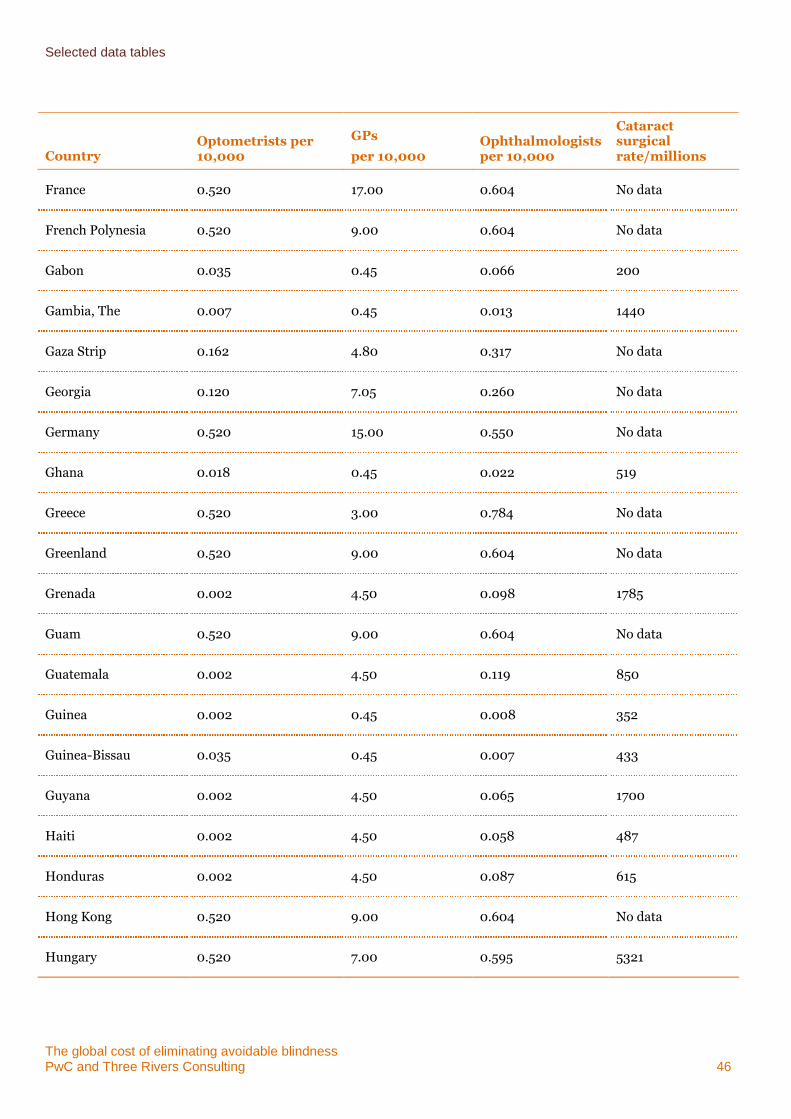
Selected data tables
The global cost of eliminating avoidable blindness PwC and Three Rivers Consulting 46
Country Optometrists per 10,000
GPs
per 10,000 Ophthalmologists per 10,000
Cataract surgical rate/millions
France 0.520 17.00 0.604 No data
French Polynesia 0.520 9.00 0.604 No data
Gabon 0.035 0.45 0.066 200
Gambia, The 0.007 0.45 0.013 1440
Gaza Strip 0.162 4.80 0.317 No data
Georgia 0.120 7.05 0.260 No data
Germany 0.520 15.00 0.550 No data
Ghana 0.018 0.45 0.022 519
Greece 0.520 3.00 0.784 No data
Greenland 0.520 9.00 0.604 No data
Grenada 0.002 4.50 0.098 1785
Guam 0.520 9.00 0.604 No data
Guatemala 0.002 4.50 0.119 850
Guinea 0.002 0.45 0.008 352
Guinea-Bissau 0.035 0.45 0.007 433
Guyana 0.002 4.50 0.065 1700
Haiti 0.002 4.50 0.058 487
Honduras 0.002 4.50 0.087 615
Hong Kong 0.520 9.00 0.604 No data
Hungary 0.520 7.00 0.595 5321
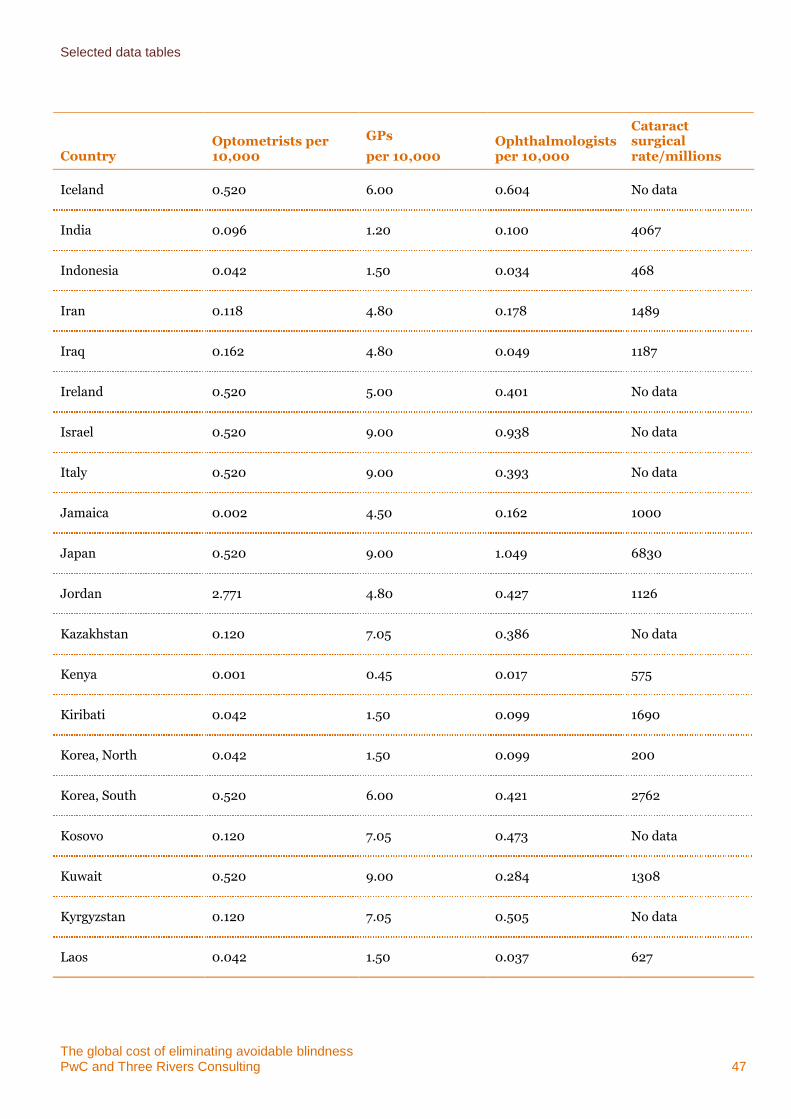
Selected data tables
The global cost of eliminating avoidable blindness PwC and Three Rivers Consulting 47
Country Optometrists per 10,000
GPs
per 10,000 Ophthalmologists per 10,000
Cataract surgical rate/millions
Iceland 0.520 6.00 0.604 No data
India 0.096 1.20 0.100 4067
Indonesia 0.042 1.50 0.034 468
Iran 0.118 4.80 0.178 1489
Iraq 0.162 4.80 0.049 1187
Ireland 0.520 5.00 0.401 No data
Israel 0.520 9.00 0.938 No data
Italy 0.520 9.00 0.393 No data
Jamaica 0.002 4.50 0.162 1000
Japan 0.520 9.00 1.049 6830
Jordan 2.771 4.80 0.427 1126
Kazakhstan 0.120 7.05 0.386 No data
Kenya 0.001 0.45 0.017 575
Kiribati 0.042 1.50 0.099 1690
Korea, North 0.042 1.50 0.099 200
Korea, South 0.520 6.00 0.421 2762
Kosovo 0.120 7.05 0.473 No data
Kuwait 0.520 9.00 0.284 1308
Kyrgyzstan 0.120 7.05 0.505 No data
Laos 0.042 1.50 0.037 627
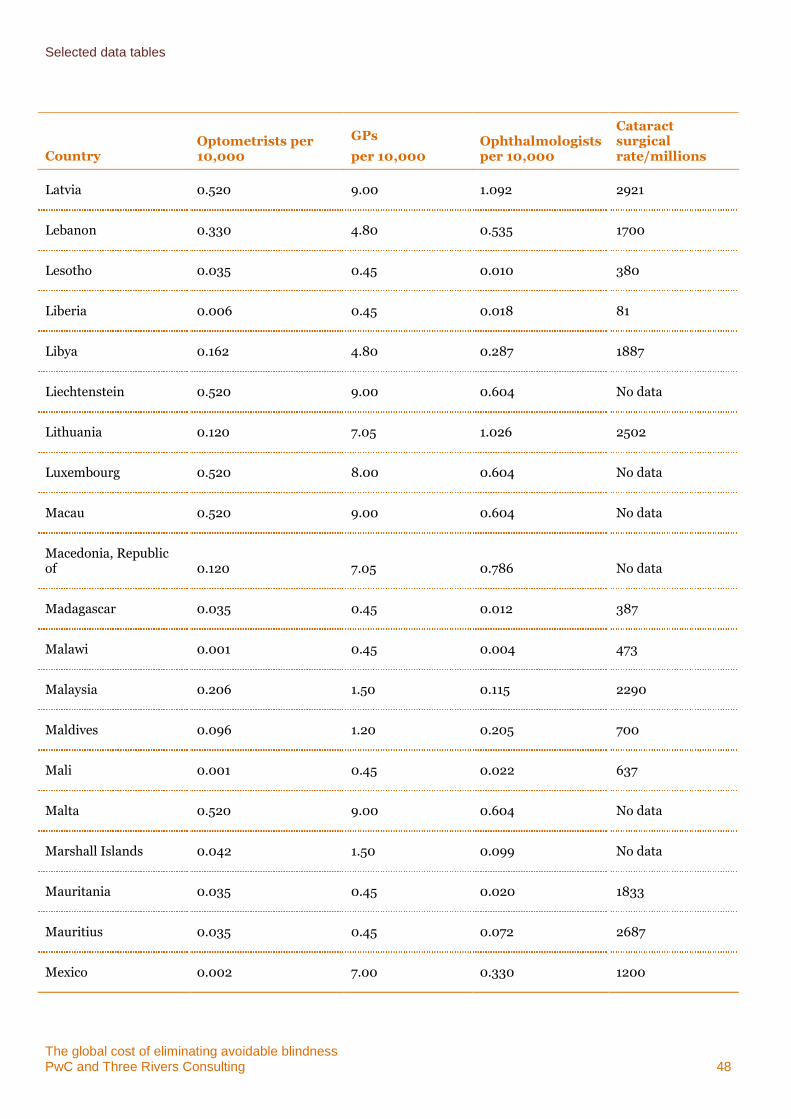
Selected data tables
The global cost of eliminating avoidable blindness PwC and Three Rivers Consulting 48
Country Optometrists per 10,000
GPs
per 10,000 Ophthalmologists per 10,000
Cataract surgical rate/millions
Latvia 0.520 9.00 1.092 2921
Lebanon 0.330 4.80 0.535 1700
Lesotho 0.035 0.45 0.010 380
Liberia 0.006 0.45 0.018 81
Libya 0.162 4.80 0.287 1887
Liechtenstein 0.520 9.00 0.604 No data
Lithuania 0.120 7.05 1.026 2502
Luxembourg 0.520 8.00 0.604 No data
Macau 0.520 9.00 0.604 No data
Macedonia, Republic of 0.120 7.05 0.786 No data
Madagascar 0.035 0.45 0.012 387
Malawi 0.001 0.45 0.004 473
Malaysia 0.206 1.50 0.115 2290
Maldives 0.096 1.20 0.205 700
Mali 0.001 0.45 0.022 637
Malta 0.520 9.00 0.604 No data
Marshall Islands 0.042 1.50 0.099 No data
Mauritania 0.035 0.45 0.020 1833
Mauritius 0.035 0.45 0.072 2687
Mexico 0.002 7.00 0.330 1200
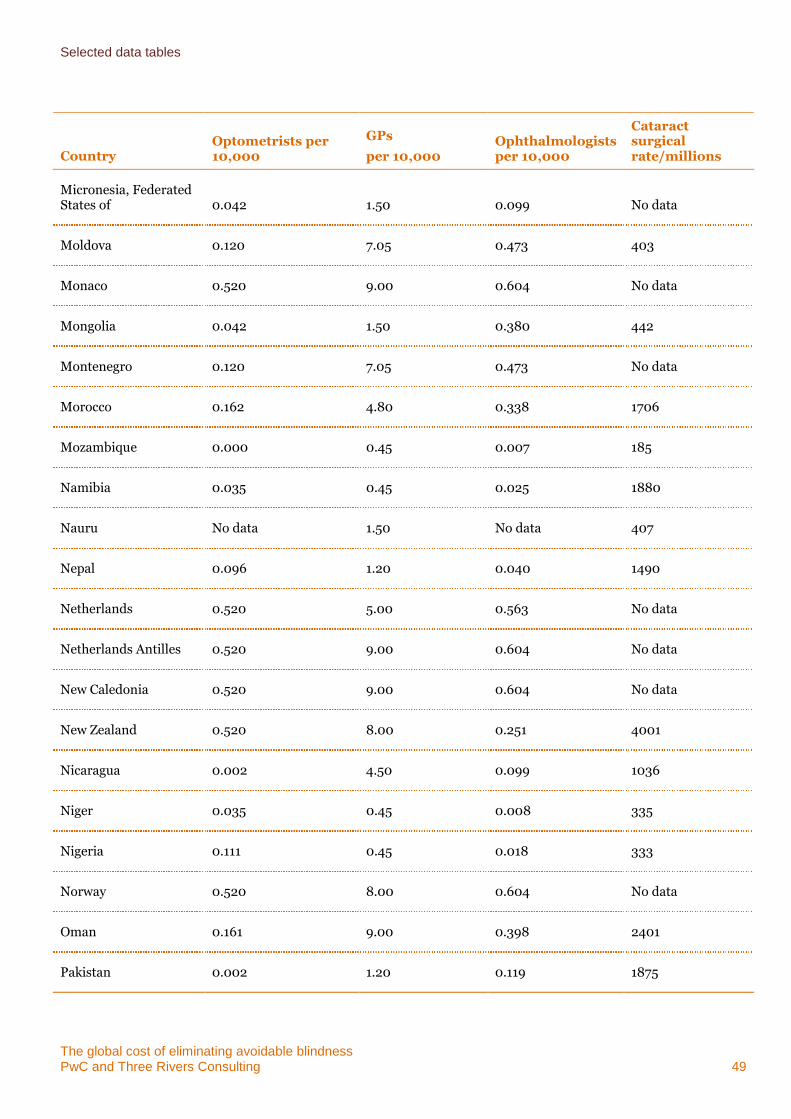
Selected data tables
The global cost of eliminating avoidable blindness PwC and Three Rivers Consulting 49
Country Optometrists per 10,000
GPs
per 10,000 Ophthalmologists per 10,000
Cataract surgical rate/millions
Micronesia, Federated States of 0.042 1.50 0.099 No data
Moldova 0.120 7.05 0.473 403
Monaco 0.520 9.00 0.604 No data
Mongolia 0.042 1.50 0.380 442
Montenegro 0.120 7.05 0.473 No data
Morocco 0.162 4.80 0.338 1706
Mozambique 0.000 0.45 0.007 185
Namibia 0.035 0.45 0.025 1880
Nauru No data 1.50 No data 407
Nepal 0.096 1.20 0.040 1490
Netherlands 0.520 5.00 0.563 No data
Netherlands Antilles 0.520 9.00 0.604 No data
New Caledonia 0.520 9.00 0.604 No data
New Zealand 0.520 8.00 0.251 4001
Nicaragua 0.002 4.50 0.099 1036
Niger 0.035 0.45 0.008 335
Nigeria 0.111 0.45 0.018 333
Norway 0.520 8.00 0.604 No data
Oman 0.161 9.00 0.398 2401
Pakistan 0.002 1.20 0.119 1875
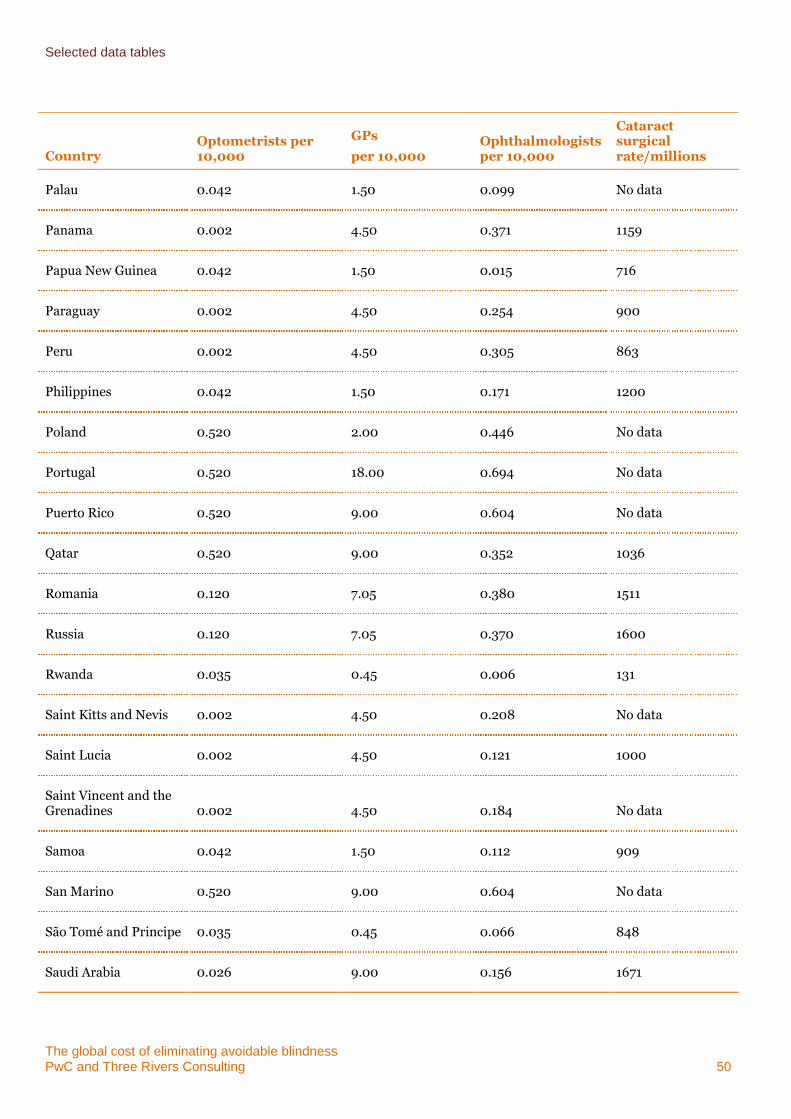
Selected data tables
The global cost of eliminating avoidable blindness PwC and Three Rivers Consulting 50
Country Optometrists per 10,000
GPs
per 10,000 Ophthalmologists per 10,000
Cataract surgical rate/millions
Palau 0.042 1.50 0.099 No data
Panama 0.002 4.50 0.371 1159
Papua New Guinea 0.042 1.50 0.015 716
Paraguay 0.002 4.50 0.254 900
Peru 0.002 4.50 0.305 863
Philippines 0.042 1.50 0.171 1200
Poland 0.520 2.00 0.446 No data
Portugal 0.520 18.00 0.694 No data
Puerto Rico 0.520 9.00 0.604 No data
Qatar 0.520 9.00 0.352 1036
Romania 0.120 7.05 0.380 1511
Russia 0.120 7.05 0.370 1600
Rwanda 0.035 0.45 0.006 131
Saint Kitts and Nevis 0.002 4.50 0.208 No data
Saint Lucia 0.002 4.50 0.121 1000
Saint Vincent and the Grenadines 0.002 4.50 0.184 No data
Samoa 0.042 1.50 0.112 909
San Marino 0.520 9.00 0.604 No data
São Tomé and Principe 0.035 0.45 0.066 848
Saudi Arabia 0.026 9.00 0.156 1671
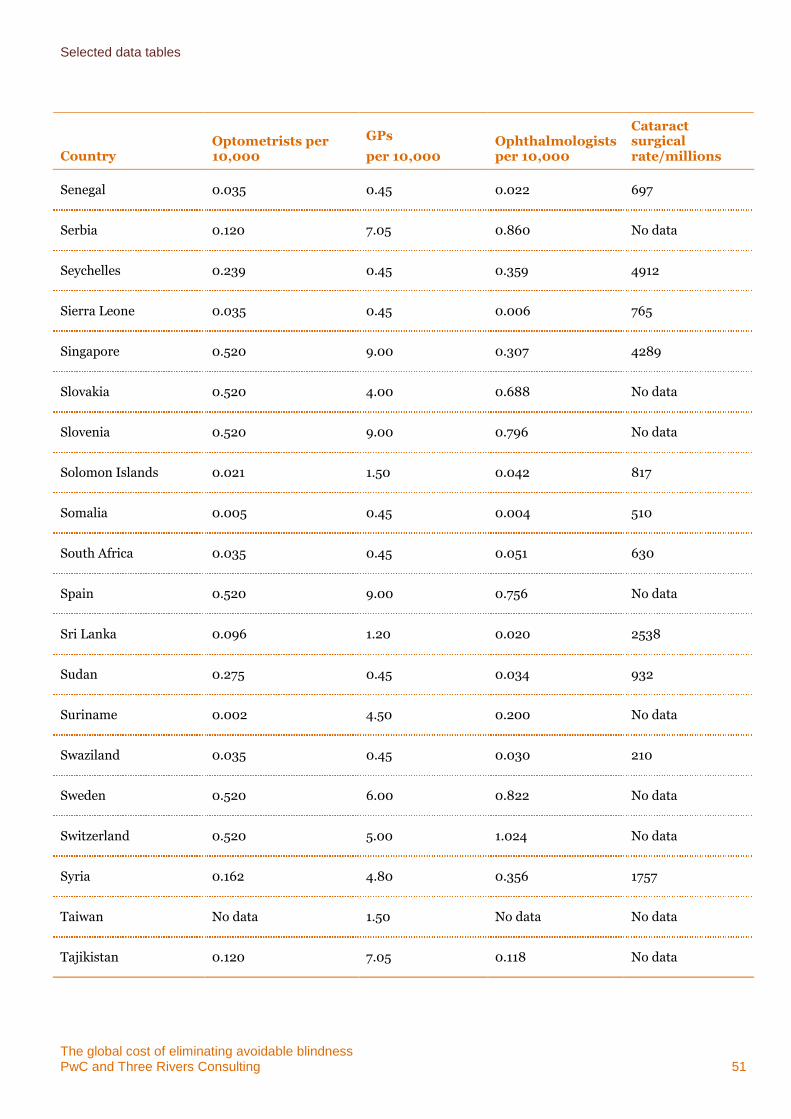
Selected data tables
The global cost of eliminating avoidable blindness PwC and Three Rivers Consulting 51
Country Optometrists per 10,000
GPs
per 10,000 Ophthalmologists per 10,000
Cataract surgical rate/millions
Senegal 0.035 0.45 0.022 697
Serbia 0.120 7.05 0.860 No data
Seychelles 0.239 0.45 0.359 4912
Sierra Leone 0.035 0.45 0.006 765
Singapore 0.520 9.00 0.307 4289
Slovakia 0.520 4.00 0.688 No data
Slovenia 0.520 9.00 0.796 No data
Solomon Islands 0.021 1.50 0.042 817
Somalia 0.005 0.45 0.004 510
South Africa 0.035 0.45 0.051 630
Spain 0.520 9.00 0.756 No data
Sri Lanka 0.096 1.20 0.020 2538
Sudan 0.275 0.45 0.034 932
Suriname 0.002 4.50 0.200 No data
Swaziland 0.035 0.45 0.030 210
Sweden 0.520 6.00 0.822 No data
Switzerland 0.520 5.00 1.024 No data
Syria 0.162 4.80 0.356 1757
Taiwan No data 1.50 No data No data
Tajikistan 0.120 7.05 0.118 No data
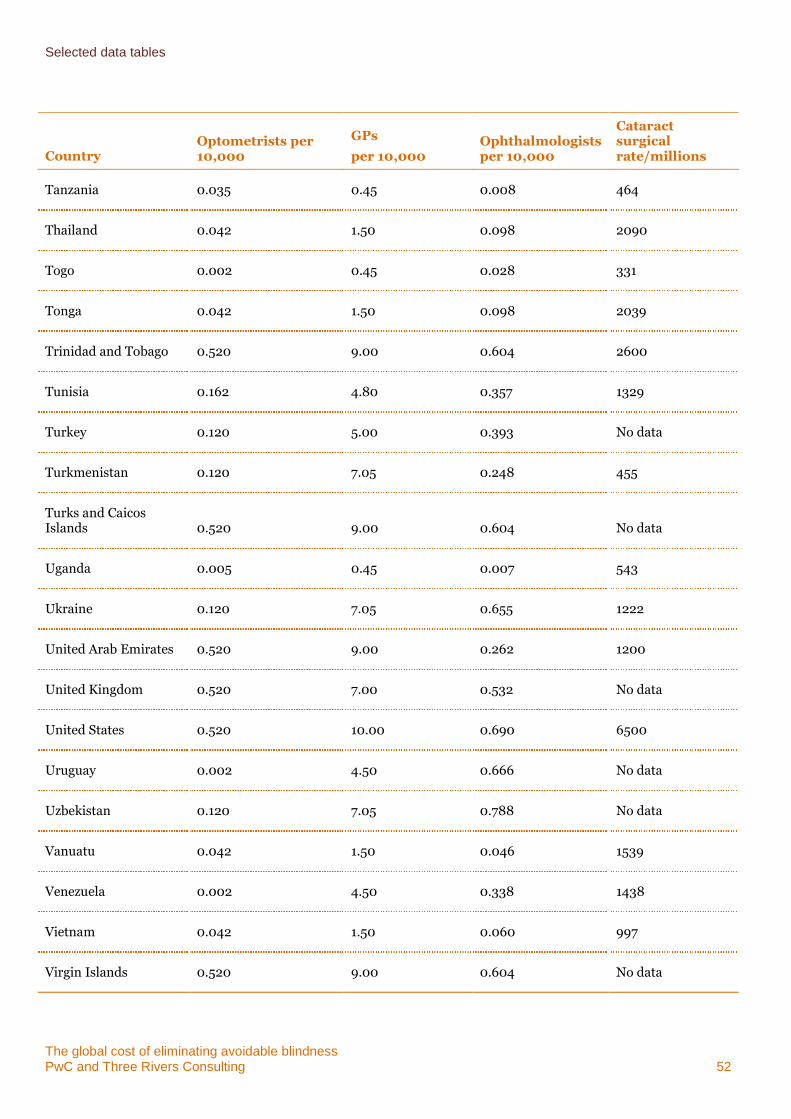
Selected data tables
The global cost of eliminating avoidable blindness PwC and Three Rivers Consulting 52
Country Optometrists per 10,000
GPs
per 10,000 Ophthalmologists per 10,000
Cataract surgical rate/millions
Tanzania 0.035 0.45 0.008 464
Thailand 0.042 1.50 0.098 2090
Togo 0.002 0.45 0.028 331
Tonga 0.042 1.50 0.098 2039
Trinidad and Tobago 0.520 9.00 0.604 2600
Tunisia 0.162 4.80 0.357 1329
Turkey 0.120 5.00 0.393 No data
Turkmenistan 0.120 7.05 0.248 455
Turks and Caicos Islands 0.520 9.00 0.604 No data
Uganda 0.005 0.45 0.007 543
Ukraine 0.120 7.05 0.655 1222
United Arab Emirates 0.520 9.00 0.262 1200
United Kingdom 0.520 7.00 0.532 No data
United States 0.520 10.00 0.690 6500
Uruguay 0.002 4.50 0.666 No data
Uzbekistan 0.120 7.05 0.788 No data
Vanuatu 0.042 1.50 0.046 1539
Venezuela 0.002 4.50 0.338 1438
Vietnam 0.042 1.50 0.060 997
Virgin Islands 0.520 9.00 0.604 No data
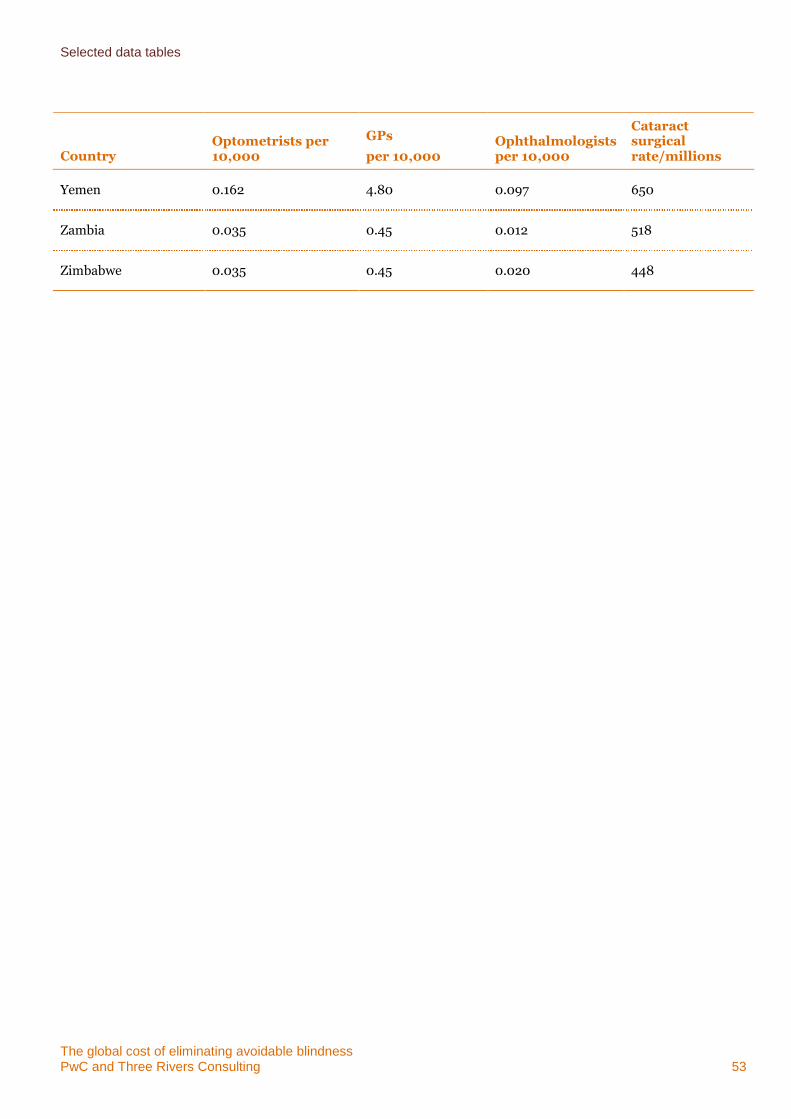
Selected data tables
The global cost of eliminating avoidable blindness PwC and Three Rivers Consulting 53
Country Optometrists per 10,000
GPs
per 10,000 Ophthalmologists per 10,000
Cataract surgical rate/millions
Yemen 0.162 4.80 0.097 650
Zambia 0.035 0.45 0.012 518
Zimbabwe 0.035 0.45 0.020 448
The global cost of eliminating avoidable blindness PwC and Three Rivers Consulting 54
Appendix E Bibliography
2020 INSight 2011, Alliance for the Global Elimination of Blinding Trachoma by the Year 2020, 2020 INSight.
Access Economics 2010, The Global Economic Cost of Visual Impairment, Access Economics, Canberra.
Access Economics 2009, Future Sight Loss UK (1): The Economic Impact of Partial Sight and Blindness in the UK Adult Population, RNIB, London, UK.
Access Economics 2004, The Economic Impact and Cost of Vision Loss in Australia, Access Economics, Canberra.
Australian Department of Families, Housing Community Services and Indigenous Affairs (FaHCSIA) 2001, Rural and Remote Disability Employment Assistance Study, available <http://www.fahcsia.gov.au/sa/disability/pubs/policy/services-rural_study/Pages/default.aspx>, viewed 9 March 2011.
Australian Department of Health and Ageing, Optometry Medicare Benefits Schedule, available <http://www.health.gov.au/internet/mbsonline/publishing.nsf/Content/B1597A1010C947C3CA257599000203FB/$File/200905-Optometry.pdf>, viewed 9 March 2011.
Australian Institute of Health and Welfare (AIHW) 2008, Eye Health in Australia: A Hospital Perspective, Cat. no. PHE 100, AIHW, Canberra.
Australian Medical Association (AMA) 2009, Becoming A Doctor and Bonded Medical School Places - A Guide for Medical Students, available <http://ama.com.au/node/4130>, viewed March 9 2011.
Britt H, Miller GC, Charles J, Valenti L, Fahridin S, Pan Y, Harrison C, Bayram C, O'Halloran J and Henderson J 2010. General Practice Activity in Australia 2009-10. General Practice Series no. 27. Cat. no. GEP 27. AIHW, Canberra.
Chengde Medical College 2009, Information for Overseas Students, available < http://www.admissions.cn/cdmc/>, viewed 10 March 2011.
Federal Reserve 2011, Foreign Exchange Rates (Annual), available < http://www.federalreserve.gov/releases/g5a/current/>, viewed 10 March 2011. Fred Hollows Foundation 2009a, 2009 General Purpose Financial Statements, available < http://www.hollows.org.au/Assets/Files/FHF_2009_full_financial_report.pdf>, viewed 10 March 2011.
Fred Hollows Foundation 2009b, The Fred Hollows Foundation NZ Report for the 18 months Ended December 2009, available < http://www.hollows.org.nz/Assets/Files/09%20FHF%20FINAL%20Final%20Accounts[1].pdf>, viewed 10 March 20113=.
Fred Hollows Foundation, nd, Big Idea – Eliminating Avoidable Blindness in South East Asia and Pacific Region, Fred Hollows Foundation, Sydney.
Gao Y, Wu L, and Li A 2007, “Daily Cost of Glaucoma Medications in China,” Journal of Glaucoma, Vol 16, Issue 7, pp. 594-597.
Golikeri P 2009, Diabetes is Hot, but Few See Diabetic Blindness, available <http://www.dnaindia.com/money/report_diabetes-is-hot-but-few-see-diabetic-blindness_1293461>, viewed 10 March 2011.
Human Resource Development Working Group 2006, Global Human Resource Development Assessment for Comprehensive Eye Care, Vision 2020, available <http://www.vision2020.org/documents/WHO%20Publications/Global_Human_Resource_Development_Assessment_For_Comprehensive_Eye_Care.pdf>, viewed 10 March 2011.
ienhance 2011, Cataract Surgery, available <http://www.ienhance.com/procedures/cataract-surgery#a4>, viewed 9 March 2011.
Bibliography
The global cost of eliminating avoidable blindness PwC and Three Rivers Consulting 55
International Agency for the Prevention of Blindness (IAPB) 2010, Report of the Trustees for the Year Ended 31 December 2009, available <http://www.vision2020.org/documents/IAPB%20Documents/IAPB%20Financial%20Statement%202009%20final.pdf>, viewed March 10 2011.
International Agency for the Prevention of Blindness, VISION 2020 and WHO 2007, Global Initiative for the Elimination of Avoidable Blindness: Action Plan 2006-2011, available <http://www.vision2020.org/documents/publications/Vision2020_report.pdf>, viewed 17 February 2011.
Jamison DT, Feachem, RG, Makgoba MW et al. 2006, Disease and Mortality in Sub-Saharan Africa 2nd ed, World Bank, Washington, p. 220.
Leasher JL and Pike S 2009, ‘Optometry in the Americas’, Optometric Care within the Public Health Community, Old Post Publishing, Cadyville NY, p. 22.
Marseille E 1996, ‘Cost Effectiveness of Cataract Surgery in a Public Health Eye Care Program in Nepal, Bulletin of the World Health Organization, 74, pp. 319-324
Nakakeeto O and Kumaranayake L 2004, ‘The Global Strategy to Eliminate HIV infection in Infants and Young Children: A Seven-Country Assessment of Costs and Feasibility’, Official Journal of the International AIDS Society, vol. 23, no. 8, pp. 987-995.
New South Wales Department of Premier and Cabinet Better Regulation Office (DPC) 2008, Measuring the Costs of Regulation, available <http://www.betterregulation.nsw.gov.au/__data/assets/pdf_file/0003/23979/02_Measuring_the_Costs_of_Regulation.pdf>, viewed 10 March 2011.
Optometrists Association Australia July 2005, Response to Productivity Commission Issues Paper: The Health Workforce from Optometrists Association Australia, available <http://www.pc.gov.au/__data/assets/pdf_file/0020/10577/sub083.pdf>, viewed 1 April 2011.
Organisation for Economic Co-operation and Development (OECD) 2009, ‘Number of Physician Consultations per Capita’, OECD Health Data 2009, OECD, Paris.
PayScale 2011, Salary Data, available <http://www.payscale.com>, viewed 10 March 2011.
Population Division of the Department of Economic and Social Affairs of the United Nations Secretariat 2008, World Population Prospects: The 2008 Revision, available < http://esa.un.org/unpp>, viewed 2 March 2011.
Ray K J, Lietman T M, Porco T C et al. 2009 ‘When Can Antibiotic Treatments for Trachoma Be Discontinued? Graduating Communities in Three African Countries’, Public Library of Science Neglected Tropical Diseases, Vol 3, Issue 6, p. 9.
Resnikoff S, Pascolini D, Mariotti SP and Pokharel GP 2007, ‘Global Magnitude of Visual Impairment Caused by Uncorrected Refractive Errors in 2004’, Bulletin of the World Health Organization, January 2008, vol. 86 no.1, pp. 63-70.
Resnikoff S, Pascolini D, Etya’ale D, Kocur I, Pararajasegaram R, Pokharel GP, Mariotti SP 2004, ‘Global Data on Visual Impairment in the Year 2002’, Bulletin of the World Health Organization, vol. 82. No. 11, pp. 844-51.
Salary Expert 2011, Salary Data, available < http://www.salaryexpert.com/>, viewed 10 March 2011.
Sponsor organisations’ data files; personal communications.
South Africa Department of Health, National Reference Price List for Services by Optometrists, available <http://www.doh.gov.za/docs/misc/nhrpl/2009/optometrists.pdf>, viewed 9 March 2011.
Stevens, G. Personal communication, on behalf of the Global Burden of Disease Vision Loss Expert Group, 2013.
The Carter Center and The World Health Organization 2002 Conference on the Eradicability of Onchocerciasis, Final Report, available < http://www.cartercenter.org/documents/1047.pdf>, viewed 9 March 2011.
Bibliography
The global cost of eliminating avoidable blindness PwC and Three Rivers Consulting 56
Thuasiraj RD and Sundaram RM 2006, ‘Optical services through Outreach in South India: A Case Study from Aravind Eye Hospitals’, Community Eye Health, June, 19(58), pp. 29-30.
VISION 2020, The Right to Sight, www.vision2020.org/main.cfm?type=WHATISBLINDNESS, viewed March 20111.
Webb J, nd, Cataract and Vitrectomy, available <http://www.adsna.info/memberstates/victoria/attachments/Cataract%20and%20Vitrectomy.pdf>, viewed March 8 2011.
World Bank Group 2011, Country and Leding Groups, available <http://data.worldbank.org/about/country-classifications/country-and-lending-groups>, viewed 1 June 2011.
World Health Organization 2004, ‘Health in the Developing World: Achieving the Millennium Development Goals’, Bulletin of the World Health Organization, vol. 82, no. 12, December 2004, available <http://www.scielosp.org/scielo.php?pid=S0042-96862004001200012&script=sci_arttext>, viewed 8 March 2011.
World Health Organization 2007, Everybody’s Business: Strengthening Health Systems to Improve Health Outcomes: WHO’s Framework for ActionWorld Health Organization 2010, Prevention of Blindness and Visual Impairment, available <http://www.who.int/blindness/table/en/index.html>, viewed March 8 2011.World Health Organization 2011, Visual Impairment and Blindness, Fact Sheet 282, available <http://www.whoint/mediacentre/factsheets/fs282/en/, viewed 23 June 2011.
World Health Organization 2010, Prevention of Blindness and Visual Impairment, available <http://www.who.int/blindness/table/en/index.html>, viewed March 8 2011.
World Health Organization 2011, Visual Impairment and Blindness. Fact Sheet 282, available <http://www.who.int/mediacentre/factsheets/fs282/en/, viewed 23 June 2011.

pwc.com.au
© 2011 PricewaterhouseCoopers. All rights reserved. In this document, "PwC" refers to
PricewaterhouseCoopers a partnership formed in Australia, which is a member firm of PricewaterhouseCoopers International Limited, each member firm of which is a separate legal entity.