the global atm water cycle
TRANSCRIPT
8122019 The Global Atm Water Cycle
httpslidepdfcomreaderfullthe-global-atm-water-cycle 18
IOP PUBLISHING E NVIRONMENTAL R ESEARCH LETTERS
Environ Res Lett 5 (2010) 025001 (8pp) doi1010881748-932652025001
EDITORIAL
The global atmospheric water cycleLennart Bengtsson
ESSC University of ReadingUK
Water vapour plays a key role in the Earthrsquos energy balance Almost 50 of theabsorbed solar radiation at the surface is used to cool the surface throughevaporation and warm the atmosphere through release of latent heat Latent heatis the single largest factor in warming the atmosphere and in transporting heatfrom low to high latitudes Water vapour is also the dominant greenhouse gas andcontributes to a warming of the climate system by some 24C (Kondratev 1972)However water vapour is a passive component in the troposphere as it is uniquelydetermined by temperature and should therefore be seen as a part of the climatefeedback system
In this short overview we will first describe the water on planet Earth and the role
of the hydrological cycle the way water vapour is transported between oceansand continents and the return of water via rivers to the oceans Generally water vapour is well observed and analysed however there are considerable obstaclesto observing precipitation in particular over the oceans The response of thehydrological cycle to global warming is far reaching Because different physical
processes control the change in water vapour and evaporationprecipitation thisleads to a more extreme distribution of precipitation making in general wet areaswetter and dry areas dryer Another consequence is a transition towards moreintense precipitation It is to be expected that the changes in the hydrologicalcycle as a consequence of climate warming may be more severe that thetemperature changes
Water on planet EarthThe total amount of available water on the Earth amounts to some 15times 109 km3The dominant part of this 14times 109 km3 resides in the oceans About 29times 106
km3 are locked up in land ice and glaciers and some 15 times 106 km3 are estimatedto exist as groundwater If all land ice and glaciers were to melt the sea levelwould rise some 80 m (Baumgartner and Reichel 1975)
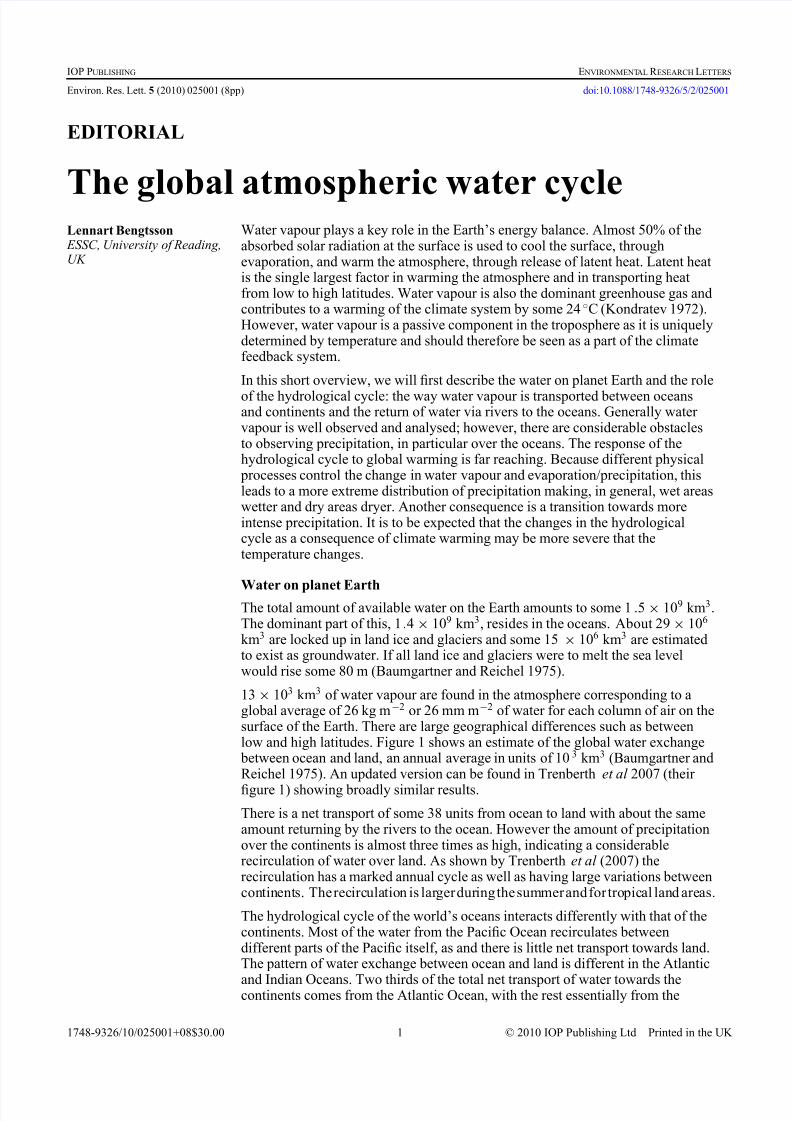
13times 103 km3 of water vapour are found in the atmosphere corresponding to aglobal average of 26 kg mminus2 or 26 mm mminus2 of water for each column of air on thesurface of the Earth There are large geographical differences such as betweenlow and high latitudes Figure 1 shows an estimate of the global water exchange
between ocean and land an annual average in units of 103 km3 (Baumgartner andReichel 1975) An updated version can be found in Trenberth et al 2007 (their
figure 1) showing broadly similar results
There is a net transport of some 38 units from ocean to land with about the sameamount returning by the rivers to the ocean However the amount of precipitationover the continents is almost three times as high indicating a considerablerecirculation of water over land As shown by Trenberth et al (2007) therecirculation has a marked annual cycle as well as having large variations betweencontinents The recirculation is larger during the summer and for tropical land areas
The hydrological cycle of the worldrsquos oceans interacts differently with that of thecontinents Most of the water from the Pacific Ocean recirculates betweendifferent parts of the Pacific itself as and there is little net transport towards landThe pattern of water exchange between ocean and land is different in the Atlantic
and Indian Oceans Two thirds of the total net transport of water towards thecontinents comes from the Atlantic Ocean with the rest essentially from the
1748-932610025001+08$3000 1 copy 2010 IOP Publishing Ltd Printed in the UK
8122019 The Global Atm Water Cycle
httpslidepdfcomreaderfullthe-global-atm-water-cycle 28
Environ Res Lett 5 (2010) 025001 Editorial
Figure 1 The global water cycle following Baumgartner and Reichel (1975) Annual values are in
units of 103 km3 year minus1
Indian Ocean Most of the continental water for North and South AmericaEurope and Africa emanates from the Atlantic and is also returned to the Atlantic
by the riversThere is widespread evaporation (maximum some 2 m year minus1) on each side of
the inter-tropical convergence zone (ITCZ) transporting water vapour into theITCZ and into the storm tracks of high latitudes Conversely in regions of netevaporation ocean salinity is increasing leading to increased ocean verticalmixing In the ITCZ and in the extra-tropical storm tracks ocean salinity is
decreasing due to high precipitation thus reducing ocean vertical mixing Thismeans that moisture convergence in the atmosphere is compensated for bymoisture divergence (salinity convergence) and vice versa in the oceans whichcan be seen as a counterpart to the atmospheric circulation (Webster 1994)
Atmospheric water vapour is measured both from space and from in situobservations and analysed in detail both by the operational weather services andthrough different re-analysis programs (eg Uppala et al 2005 Onogi et al 2007)However while data for atmospheric water vapour are generally well observed weare much less comfortable with observations of precipitation Precipitation has alarge variance on small time and space scales and current observing systemscannot sample this sufficiently This is especially the case over ocean areas wheremeasurements from ships are notoriously poor as the collection of precipitation is
strongly influenced by wind including the local wind effect caused by themovements of the ship itself Different proxy methods have been developed usingspace and rain gauge data and combining these with model data The mostcommonly used are the NOAA Climate Prediction Centre Merged Analysis of Precipitation (CMAP Xie and Arkin 1997) and the Global PrecipitationClimatology Project (GPCP Adler et al 2003) GPCP consists of combinedsatellite and in situ precipitation measurements and provides global coverage of monthly averages As with most climate data sets great caution should beexercised in trying to identify trends in precipitation (eg Allan and Soden 2007)In addition to the severe sampling problems we also have to identify the effectcaused by ongoing changes in the global observing systems
Hagemann et al (2006) has undertaken a study using the ECHAM5 model(Roeckner et al 2003 2006) where they compared the hydrological cycle over 20
years using 11 different model versions having resolutions from T21L19 (spectral
2
8122019 The Global Atm Water Cycle
httpslidepdfcomreaderfullthe-global-atm-water-cycle 38
Environ Res Lett 5 (2010) 025001 Editorial
transform model until wave number 21 and with 19 vertical levels) to T156L31There is a minor increase in global precipitation with resolution by some7 (between T21L19 and T156L31) with a systematic increase of large-scale
precipitation and reduced convective precipitation with resolution There isgenerally good agreement between model results and CMAP and GPCP over land
but the modelled precipitation is larger over the oceans by some 70times 103
km3
year minus1 on average Whether this implies that the model overestimates precipitationover oceans cannot be concluded as it might equally well imply that the CMAPand GPCP underestimate Another way of evaluating the hydrological cycle isto measure the river outflow and compare this with the net water flux of the river catchments A detailed study has been conducted for the different sub-regions of the Baltic Sea covering some 10 years with excellent agreement between observedriver outflow and calculations of the atmospheric water cycle from a limitedarea model (figure 2 D Jacob 2001 private communication) This suggeststhat when reliable river outflow data exist this is an alternative way to validatethe model-generated atmospheric hydrological cycle for a larger scale area
Figure 2 Model simulation of the water balance of the Baltic Sea (1979ndash1988) Units in km3
year minus1 (Courtesy D Jacob (2001) Max-Planck-Institute for Meteorology Hamburg) The estimated
total river run off agrees broadly with measured data (Raschke et al (2001) The net outflow from
the Baltic Sea is close to various estimates (eg Omstedt and Rutgersson 2000) Net water vapour inflow into the region is calculated under the assumption of long-term water balance
3
8122019 The Global Atm Water Cycle
httpslidepdfcomreaderfullthe-global-atm-water-cycle 48
Environ Res Lett 5 (2010) 025001 Editorial
Water vapour as a greenhouse gas
Water vapour is the dominant greenhouse gas and accounts for around 75 of thetotal greenhouse effect on Earth (Kondratev 1972) Water vapour in theatmosphere is strongly controlled by the atmospheric circulation If for example
we follow a trajectory of water vapour in the atmosphere it shows that itundergoes a complex series of vertical and horizontal motions that can includeseveral events of condensation At any given time the saturation mixing ratio isdetermined by the temperature of the latest event of condensation For this reasonit follows that the mixing ratio will increase with temperature broadly followingthe ClausiusndashClapeyron relation (Pierrehumbert et al 2007)
The residence time of water vapour in the atmosphere is about a week ascompared with the very long residence time of the greenhouse gases in particular CO2 which includes multi-centennial time scales Water vapour is of coursecontinuously replenished by evaporation from the oceans and the land surfaces
but is nevertheless regulated by temperature In that sense water vapour should be seen as a part of the response of the
climate system to external forcing Such a change in climate forcing can be due tochanges in the concentration of the more persistent greenhouse gases such asCO2 Alternatively it can be due to changes in solar radiation or to aerosols fromvolcanic eruptions or due to anthropogenic emissions
The absorption bands in the water vapour spectra are close to saturationsimilar to those of CO2 with the absorption mainly occurring in the wings of thespectral bands The total effect on the radiation balance can be approximated by alogarithmic function of the mixing ratio This is how the effect of atmosphericwater vapour is included in the code for the calculation of long-wave radiation inweather and climate models
In contrast to the well-mixed greenhouse gases water vapour varies stronglyin the atmosphere and this on a small scale in both time and space The reason isstrong vertical motion of different signs that implies sharp gradients in the
moisture field Climate models that have coarse resolution have difficulties inrepresenting sharp gradients and generally underestimate the strong outgoinglong-wave radiation (OLR) in dry air Because of the logarithmic function of themixing ratio this implies an underestimation of OLR Hagemann et al (2006)noted a decrease of OLR in clear sky by 7 W mminus2 by reducing the horizontalspectral resolution from T159 to T21 Furthermore a correct vertical distributionof water vapour is essential as water vapour in the upper troposphere is
proportionately more importantAll indications are that water vapour constitutes a positive
feedback but the strength of the feedback is debated Observational as well asmodelling studies (Held and Soden 2006 Semenov and Bengtsson 2002) suggestthat the relative humidity is broadly maintained and water vapour closely followsthe ClausiusndashClapeyron relation The feedback effect cannot be determined fromobservational studies but can be estimated from models through bypassing the
part of the long-wave radiation code that calculates the effect of increasing water vapour (Hall and Manabe 1999) They showed that water vapour increases theeffect of a doubling of the CO2 concentration from 105C to 338C suggestinga clear positive feedback from water vapour However a more recent analysis bySoden and Held (2006) give an amplification factor of 19 to 32 by water vapour alone yet much of this spread is due to different changes in lapse rate when water vapour and lapse rate are considered together the amplification of warming bythese feedbacks is around 13 to 16 (Randell et al 2007 figure 814 and footnote)
How will precipitation change in a warmer climate
Observational studies as well as numerical models show that water vapour in the
atmosphere closely follows temperature in agreement with theClausiusndashClapeyron relation That means that an increase in temperature by 1C
4
8122019 The Global Atm Water Cycle
httpslidepdfcomreaderfullthe-global-atm-water-cycle 58
Environ Res Lett 5 (2010) 025001 Editorial
in the lower troposphere implies an increase in the vertical profile of water vapour by 6ndash7 However the increase in the hydrological cycle (global mean precipitation and evaporation) as obtained from model integration is limited tosome 1ndash2 (Held and Soden 2006) This is because atmospheric water vapour isdetermined from atmospheric circulation in a warmer climate while global
precipitation is constrained by evaporation from the surface This in turn is aconsequence of the radiation imbalance at the surface as well as being influenced
by surface winds stability of the boundary layer and the absorption of short-waveradiation in the atmosphere
According to Takahashi (2009) the change of the sum of latent heat flux andshort-wave absorption at the surface by temperature is broadly controlled by thelong-wave flux above the boundary layer that is well understood and modelled Itmay therefore be considered unlikely that models can be wrong by factors of several 100 Rather it is more likely that models might even overestimate thelatent heat flux due to an underestimation of the absorption of short-waveradiation in the atmosphere as line-by-line integration suggests a larger absorption
by water vapour than what is used in climate models (Takahashi 2009)The fact that water vapour is increasing faster than precipitation has
far-reaching consequences (Held and Soden 2006) Because the increase in thestrength of the global atmospheric hydrological cycle is constrained by smallchanges in latent heat flux (Richter and Xie 2008) it cannot keep up with therapid increase in atmospheric water vapour This implies that the residence timeof water vapour in the atmosphere is increasing that means that the exchange of mass between the boundary layer must decrease and since much of this exchangeoccurs in moist convection in the Tropics the convective mass flux mustconsequently decrease This result is perhaps counterintuitive to some of the ideasthat flourish in the climate change debate where it is implicitly assumed that theatmosphere will in some sense become more energetic as it warms But in factthe average vertical exchange of mass between the boundary layer and the freeatmosphere must imply a slowing down of the large-scale atmospheric
circulation To what extent this will affect tropical cyclones is not clear but it has been suggested (Bengtsson et al 2007) that this could be the reason for thereduced number of tropical cyclones in a warmer climate
The fact that the increase in water vapour follows the ClausiusndashClapeyronrelation has a number of other important consequences including the polewardtransport of water vapour and the pattern of evaporationndashprecipitation (EndashP) The(EndashP) gradient increases proportionally to the lower tropospheric water vapour (Held and Soden 2006) implying that wet regions get wetter and dry regionsdrier This result is of key importance for understanding how future patterns of
precipitation might change in a warmer climate This includes more precipitationin the ITCZ and in the middle- and high-latitude storm tracks and alternativelyless precipitation in mid-latitudes including the Mediterranean region California
and Texas southern Africa and southern AustraliaChanges in extreme precipitation
The distribution of precipitation as a function of time is mostly represented by agamma function since a comparatively large part of the total precipitation at agiven place occurs during short time intervals (Juras 1994) The reason is that inmost precipitation situations small-scale convective systems develop with largevertical motions that generate intense precipitation As described by Bengtsson(2001 and references therein) convective processes are embedded in practicallyall precipitation systems including warm front conditions at high latitudes duringthe cold season Intense precipitation dominates in particular convectively drivenstorms such as tropical cyclones It is during such events that enormous amountsof precipitation have been measured including cases with some 1000 mm
precipitation or more in less than 12 hours (httpenwikipediaorgwikiList of weather recordsRain) The most severe damages to society are
5
8122019 The Global Atm Water Cycle
httpslidepdfcomreaderfullthe-global-atm-water-cycle 68
Environ Res Lett 5 (2010) 025001 Editorial
related to intense precipitation occurring on time scales from hours to a couple of days A most important question is consequently what may happen to intense
precipitation in a warmer climateModel experiments (Bengtsson et al 2009) for a warmer climate show a
marked increase in extreme precipitation In the storm track region there are
increases in extreme 6 hr precipitation of 40ndash50 (at the 99 percentile or higher)As there is a much smaller increase in the average precipitation this means thatthe whole spectrum of precipitation changes (Semenov and Bengtsson 2002) Asthe climate warming so far has been rather modest and only about some 25compared to the experiment used by Bengtsson et al (2009) we expect it will bedifficult to observe such changes in the time spectrum of precipitation Howeverthere are some signals from natural variability eg Allan and Soden (2008)Furthermore this will require persistent high-quality observations over a verylong period of time Karl and Knight (1998) have examined the precipitation atthe 90th percentile or higher for an area over central USA and noted an increasethat was found to broadly agree with the modelling result by Semenov andBengtsson (2002 their figure 4(a))
The large increase in extreme precipitation suggested from models is likely tohave serious consequences The change in the time distribution of precipitationintensity will radically reduce the probability of the return of extreme eventsUsing the same model experiment as the one by Semenov and Bengtsson it wasfound that the 50-year return flow in the Yangtse river calculated from modelresults representative for the present climate was changed to a 5 year return flowfor a climate that might be expected at the end of this century using the IPCC A1B(moderate) scenario (Voss et al 2002) If such changes occur the consequenceswill be severe requiring urgent enhancements of flood protection systems
Tropical cyclones are driven by organized convection that in turn will becomemore intensive as the amount of available water vapour is increasing in a warmer climate This has been found to occur but will require a high horizontal resolution(Bengtsson et al 2007 Oouchi et al 2006) Bengtsson et al (2007) found when
using a global model at T319 resolution (around 40 km grid distance) that intensestorms of category 3 or higher increased from 12 to 17 year minus1 overall for the
Northern Hemisphere while the total number of tropical cyclones decreasedSimilar results were obtained by Oouchi et al (2006) and Binder et al (2010) in arecent study of Atlantic hurricanes Binder et al used a two-step downscaling of individual storms to better describe the detailed hurricane structure So in general it seems that the large increase in water vapour in a warmer climate might not only change the structure of precipitation events but also the statistical distribution of weather systems driven by release of latent heat in a similar way This is very important as damages are broadly proportional to the third power of the wind speed
Discussion
Water vapour is of fundamental importance for the climate system The transportof water from the surface of the Earth cools the surface and warms the atmospherewith an average of around 80 W mminus2 Water vapour flux is a key mechanism intransporting energy between low and high latitudes The atmospheric water cycleis important for the ocean circulation In areas of net evaporation salinity isincreasing resulting in convection in the upper ocean The opposite occurs inareas of net precipitation Water vapour is the dominant greenhouse gas but it iscontrolled by temperature and in that respect it is part of the climate response or feedback system All indications are that water vapour constitutes a positivefeedback on climate but the strength of the feedback is model sensitive This ismostly due to different patterns of lowhigh-latitude temperature and resultinglapse rate changes since the combined water vapour lapse rate feedback is fairly
robust Water vapour is increasing rapidly in a warmer climate but theory andmodels suggest that global precipitation might be increasing much more slowly
6
8122019 The Global Atm Water Cycle
httpslidepdfcomreaderfullthe-global-atm-water-cycle 78
Environ Res Lett 5 (2010) 025001 Editorial
This has a number of important consequences for the hydrological cycle in awarmer climate namely that areas with high precipitation rates today will haveincreased precipitation rates and areas with low precipitation will have reducedrates making the hydrological cycle more extreme
The increase in water vapour in a warmer climate is expected to lead to more
intense precipitation and this is actually simulated by models In the same waylatent-heat-driven weather systems such as tropical cyclones are likely to be moreintense in a warmer climate This is also simulated by high-resolution climatemodels that at the same time show an overall reduction in the total number of tropical cyclones
References
Adler R F et al 2003 The version 2 Global Precipitation Climatology Project (GPCP) monthly precipitation analysis (1979ndashpresent) J Hydrometeorol 4 1147ndash67
Allan R P and Soden B J 2007 Geophys Res Lett 34 L18705Allan R P and Soden B J 2008 Science 321 1481ndash4Baumgartner A and Reichel E 1975 The World Water Balance (New York Elsevier)
Bengtsson L 2001 Numerical modelling of the energy and water cycle of the Baltic Sea Meteorol Atmos Phys 77 9ndash17
Bengtsson L Hodges K I Esch M Keenlyside N Kornblueh L Luo J-J and Yamagata T 2007 Howmay tropical cyclones change in a warmer climate Tellus A 59 539ndash61
Bengtsson L Hodges K I and Keenlyside N 2009 Will extra-tropical storms intensify in a warmer climate J Climate 22 2276ndash301
Binder M A Knutson T R Tuleya R E Sirutis J J Vecchi G A Garner S T and Held I M 2010Science 327 454ndash8
Hagemann S Arpe K and Roeckner E 2006 Evaluation of the hydrological cycle in the ECHAM5model J Climate 19 3810ndash27
Hall A and Manabe S 1999 The role of water vapor feedback in unperturbed climate variability andglobal warming J Climate 12 2327ndash46
Held I M and Soden B J 2006 Robust responses of the hydrological cycle to global warming J Climate 19 5686ndash99
Juras J 1994 Some common features of probability distribution for precipitation Theor Appl
Climatol 49 69ndash76Karl T R and Knight R W 1998 Secular trends of precipitation amount frequency and intensity in
the United States Bull Am Meteorol Soc 79 231ndash41Kondratev K Ya 1972 Radiation Processes in the Atmosphere (Geneva World Meteorological
Organization)Omstedt A and Rutgersson A 2000 Closing the water cycle of the Baltic Sea Meteorol Z 9 57ndash66Onogi K et al 2007 The JRA-25 reanalysis J Meteorol Soc Japan 85 369ndash432Oouchi K et al 2006 Tropical cyclone climatology in a global-warming climate as simulated in a 20
km-mesh global atmospheric model frequency and wind intensity analysis J Meteorol Soc Japan 84 259ndash76
Pierrehumbert R T Brogniez H and Roca R 2007 On the relative humidity of the Earthrsquos atmosphereThe Global Circulation of the Atmosphere ed T Schneider and A H Sobel (Princeton NJPrinceton University Press) pp 143ndash85
Randell D A et al 2007 Climate models and their evaluation Climate Change 2007 The Physical Science Basis ed S Solomon et al (Cambridge Cambridge University Press) pp 591ndash662
Raschke E et al 2001 The Baltic Sea Experiment (BALTEX) a european contribution to theinvestigation of the energy and water cycle over a large drainage basin Bull Am Meteorol Soc82 2389ndash413
Richter I and Xie S 2008 Muted precipitation increase in global warming simulations a surfaceevaporation perspective J Geophys Res 113 D24118
Roeckner E et al 2003 The atmospheric general circulation model ECHAM5 Part I Modeldescription Report 349 Max Planck Institute for Meteorology 127 pp (available from MPI for Meteorology Bundesstr 53 20146 Hamburg Germany)
Roeckner E et al 2006 Sensitivity of simulated climate to horizontal and vertical resolution in theECHAM5 atmosphere model J Climate 19 3771ndash91
Rubel F and Hantel M 2001 BALTEX precipitation analysis results from the BRIDGE preparation phase Phys Chem Earth B Hydrol Ocean Atmos 26 397ndash401
Semenov V and Bengtsson L 2002 Secular trends in daily precipitation characteristics greenhousegas simulation with a coupled AOGCM Clim Dyn 19 123ndash40
Soden B and Held I 2006 An assessment of climate feedbacks in coupled oceanndashatmosphere models
J Climate 19 3354ndash60
7
8122019 The Global Atm Water Cycle
httpslidepdfcomreaderfullthe-global-atm-water-cycle 88
Environ Res Lett 5 (2010) 025001 Editorial
Takahashi K 2009 Radiative constraints on the hydrological cycle in an idealizedradiativendashconvective equilibrium model J Atmos Sci 66 77ndash91
Trenberth K E et al 2007 Estimate of the global water budget and its annual cycle usingobservational and model data J Hydrometeorol 8 758ndash69
Uppala S M et al 2005 The ERA-40 reanalysis Q J R Meteorol Soc 131 2961ndash3012
Voss R May W and Roeckner E 2002 Enhanced resolution modelling study on anthropogenicclimate change changes in extremes of the hydrological cycle Int J Climatol 22 755ndash77Webster P J 1994 The role of hydrological processes in ocean-atmosphere interactions Rev
Geophys 32 427ndash76Xie P and Arkin P A 1997 Global precipitation a 17-year monthly analysis based on gauge
observations satellite estimates and numerical model outputs Bull Am Meteorol Soc 782539ndash58
8

8122019 The Global Atm Water Cycle
httpslidepdfcomreaderfullthe-global-atm-water-cycle 58
Environ Res Lett 5 (2010) 025001 Editorial
in the lower troposphere implies an increase in the vertical profile of water vapour by 6ndash7 However the increase in the hydrological cycle (global mean precipitation and evaporation) as obtained from model integration is limited tosome 1ndash2 (Held and Soden 2006) This is because atmospheric water vapour isdetermined from atmospheric circulation in a warmer climate while global
precipitation is constrained by evaporation from the surface This in turn is aconsequence of the radiation imbalance at the surface as well as being influenced
by surface winds stability of the boundary layer and the absorption of short-waveradiation in the atmosphere
According to Takahashi (2009) the change of the sum of latent heat flux andshort-wave absorption at the surface by temperature is broadly controlled by thelong-wave flux above the boundary layer that is well understood and modelled Itmay therefore be considered unlikely that models can be wrong by factors of several 100 Rather it is more likely that models might even overestimate thelatent heat flux due to an underestimation of the absorption of short-waveradiation in the atmosphere as line-by-line integration suggests a larger absorption
by water vapour than what is used in climate models (Takahashi 2009)The fact that water vapour is increasing faster than precipitation has
far-reaching consequences (Held and Soden 2006) Because the increase in thestrength of the global atmospheric hydrological cycle is constrained by smallchanges in latent heat flux (Richter and Xie 2008) it cannot keep up with therapid increase in atmospheric water vapour This implies that the residence timeof water vapour in the atmosphere is increasing that means that the exchange of mass between the boundary layer must decrease and since much of this exchangeoccurs in moist convection in the Tropics the convective mass flux mustconsequently decrease This result is perhaps counterintuitive to some of the ideasthat flourish in the climate change debate where it is implicitly assumed that theatmosphere will in some sense become more energetic as it warms But in factthe average vertical exchange of mass between the boundary layer and the freeatmosphere must imply a slowing down of the large-scale atmospheric
circulation To what extent this will affect tropical cyclones is not clear but it has been suggested (Bengtsson et al 2007) that this could be the reason for thereduced number of tropical cyclones in a warmer climate
The fact that the increase in water vapour follows the ClausiusndashClapeyronrelation has a number of other important consequences including the polewardtransport of water vapour and the pattern of evaporationndashprecipitation (EndashP) The(EndashP) gradient increases proportionally to the lower tropospheric water vapour (Held and Soden 2006) implying that wet regions get wetter and dry regionsdrier This result is of key importance for understanding how future patterns of
precipitation might change in a warmer climate This includes more precipitationin the ITCZ and in the middle- and high-latitude storm tracks and alternativelyless precipitation in mid-latitudes including the Mediterranean region California
and Texas southern Africa and southern AustraliaChanges in extreme precipitation
The distribution of precipitation as a function of time is mostly represented by agamma function since a comparatively large part of the total precipitation at agiven place occurs during short time intervals (Juras 1994) The reason is that inmost precipitation situations small-scale convective systems develop with largevertical motions that generate intense precipitation As described by Bengtsson(2001 and references therein) convective processes are embedded in practicallyall precipitation systems including warm front conditions at high latitudes duringthe cold season Intense precipitation dominates in particular convectively drivenstorms such as tropical cyclones It is during such events that enormous amountsof precipitation have been measured including cases with some 1000 mm
precipitation or more in less than 12 hours (httpenwikipediaorgwikiList of weather recordsRain) The most severe damages to society are
5
8122019 The Global Atm Water Cycle
httpslidepdfcomreaderfullthe-global-atm-water-cycle 68
Environ Res Lett 5 (2010) 025001 Editorial
related to intense precipitation occurring on time scales from hours to a couple of days A most important question is consequently what may happen to intense
precipitation in a warmer climateModel experiments (Bengtsson et al 2009) for a warmer climate show a
marked increase in extreme precipitation In the storm track region there are
increases in extreme 6 hr precipitation of 40ndash50 (at the 99 percentile or higher)As there is a much smaller increase in the average precipitation this means thatthe whole spectrum of precipitation changes (Semenov and Bengtsson 2002) Asthe climate warming so far has been rather modest and only about some 25compared to the experiment used by Bengtsson et al (2009) we expect it will bedifficult to observe such changes in the time spectrum of precipitation Howeverthere are some signals from natural variability eg Allan and Soden (2008)Furthermore this will require persistent high-quality observations over a verylong period of time Karl and Knight (1998) have examined the precipitation atthe 90th percentile or higher for an area over central USA and noted an increasethat was found to broadly agree with the modelling result by Semenov andBengtsson (2002 their figure 4(a))
The large increase in extreme precipitation suggested from models is likely tohave serious consequences The change in the time distribution of precipitationintensity will radically reduce the probability of the return of extreme eventsUsing the same model experiment as the one by Semenov and Bengtsson it wasfound that the 50-year return flow in the Yangtse river calculated from modelresults representative for the present climate was changed to a 5 year return flowfor a climate that might be expected at the end of this century using the IPCC A1B(moderate) scenario (Voss et al 2002) If such changes occur the consequenceswill be severe requiring urgent enhancements of flood protection systems
Tropical cyclones are driven by organized convection that in turn will becomemore intensive as the amount of available water vapour is increasing in a warmer climate This has been found to occur but will require a high horizontal resolution(Bengtsson et al 2007 Oouchi et al 2006) Bengtsson et al (2007) found when
using a global model at T319 resolution (around 40 km grid distance) that intensestorms of category 3 or higher increased from 12 to 17 year minus1 overall for the
Northern Hemisphere while the total number of tropical cyclones decreasedSimilar results were obtained by Oouchi et al (2006) and Binder et al (2010) in arecent study of Atlantic hurricanes Binder et al used a two-step downscaling of individual storms to better describe the detailed hurricane structure So in general it seems that the large increase in water vapour in a warmer climate might not only change the structure of precipitation events but also the statistical distribution of weather systems driven by release of latent heat in a similar way This is very important as damages are broadly proportional to the third power of the wind speed
Discussion
Water vapour is of fundamental importance for the climate system The transportof water from the surface of the Earth cools the surface and warms the atmospherewith an average of around 80 W mminus2 Water vapour flux is a key mechanism intransporting energy between low and high latitudes The atmospheric water cycleis important for the ocean circulation In areas of net evaporation salinity isincreasing resulting in convection in the upper ocean The opposite occurs inareas of net precipitation Water vapour is the dominant greenhouse gas but it iscontrolled by temperature and in that respect it is part of the climate response or feedback system All indications are that water vapour constitutes a positivefeedback on climate but the strength of the feedback is model sensitive This ismostly due to different patterns of lowhigh-latitude temperature and resultinglapse rate changes since the combined water vapour lapse rate feedback is fairly
robust Water vapour is increasing rapidly in a warmer climate but theory andmodels suggest that global precipitation might be increasing much more slowly
6
8122019 The Global Atm Water Cycle
httpslidepdfcomreaderfullthe-global-atm-water-cycle 78
Environ Res Lett 5 (2010) 025001 Editorial
This has a number of important consequences for the hydrological cycle in awarmer climate namely that areas with high precipitation rates today will haveincreased precipitation rates and areas with low precipitation will have reducedrates making the hydrological cycle more extreme
The increase in water vapour in a warmer climate is expected to lead to more
intense precipitation and this is actually simulated by models In the same waylatent-heat-driven weather systems such as tropical cyclones are likely to be moreintense in a warmer climate This is also simulated by high-resolution climatemodels that at the same time show an overall reduction in the total number of tropical cyclones
References
Adler R F et al 2003 The version 2 Global Precipitation Climatology Project (GPCP) monthly precipitation analysis (1979ndashpresent) J Hydrometeorol 4 1147ndash67
Allan R P and Soden B J 2007 Geophys Res Lett 34 L18705Allan R P and Soden B J 2008 Science 321 1481ndash4Baumgartner A and Reichel E 1975 The World Water Balance (New York Elsevier)
Bengtsson L 2001 Numerical modelling of the energy and water cycle of the Baltic Sea Meteorol Atmos Phys 77 9ndash17
Bengtsson L Hodges K I Esch M Keenlyside N Kornblueh L Luo J-J and Yamagata T 2007 Howmay tropical cyclones change in a warmer climate Tellus A 59 539ndash61
Bengtsson L Hodges K I and Keenlyside N 2009 Will extra-tropical storms intensify in a warmer climate J Climate 22 2276ndash301
Binder M A Knutson T R Tuleya R E Sirutis J J Vecchi G A Garner S T and Held I M 2010Science 327 454ndash8
Hagemann S Arpe K and Roeckner E 2006 Evaluation of the hydrological cycle in the ECHAM5model J Climate 19 3810ndash27
Hall A and Manabe S 1999 The role of water vapor feedback in unperturbed climate variability andglobal warming J Climate 12 2327ndash46
Held I M and Soden B J 2006 Robust responses of the hydrological cycle to global warming J Climate 19 5686ndash99
Juras J 1994 Some common features of probability distribution for precipitation Theor Appl
Climatol 49 69ndash76Karl T R and Knight R W 1998 Secular trends of precipitation amount frequency and intensity in
the United States Bull Am Meteorol Soc 79 231ndash41Kondratev K Ya 1972 Radiation Processes in the Atmosphere (Geneva World Meteorological
Organization)Omstedt A and Rutgersson A 2000 Closing the water cycle of the Baltic Sea Meteorol Z 9 57ndash66Onogi K et al 2007 The JRA-25 reanalysis J Meteorol Soc Japan 85 369ndash432Oouchi K et al 2006 Tropical cyclone climatology in a global-warming climate as simulated in a 20
km-mesh global atmospheric model frequency and wind intensity analysis J Meteorol Soc Japan 84 259ndash76
Pierrehumbert R T Brogniez H and Roca R 2007 On the relative humidity of the Earthrsquos atmosphereThe Global Circulation of the Atmosphere ed T Schneider and A H Sobel (Princeton NJPrinceton University Press) pp 143ndash85
Randell D A et al 2007 Climate models and their evaluation Climate Change 2007 The Physical Science Basis ed S Solomon et al (Cambridge Cambridge University Press) pp 591ndash662
Raschke E et al 2001 The Baltic Sea Experiment (BALTEX) a european contribution to theinvestigation of the energy and water cycle over a large drainage basin Bull Am Meteorol Soc82 2389ndash413
Richter I and Xie S 2008 Muted precipitation increase in global warming simulations a surfaceevaporation perspective J Geophys Res 113 D24118
Roeckner E et al 2003 The atmospheric general circulation model ECHAM5 Part I Modeldescription Report 349 Max Planck Institute for Meteorology 127 pp (available from MPI for Meteorology Bundesstr 53 20146 Hamburg Germany)
Roeckner E et al 2006 Sensitivity of simulated climate to horizontal and vertical resolution in theECHAM5 atmosphere model J Climate 19 3771ndash91
Rubel F and Hantel M 2001 BALTEX precipitation analysis results from the BRIDGE preparation phase Phys Chem Earth B Hydrol Ocean Atmos 26 397ndash401
Semenov V and Bengtsson L 2002 Secular trends in daily precipitation characteristics greenhousegas simulation with a coupled AOGCM Clim Dyn 19 123ndash40
Soden B and Held I 2006 An assessment of climate feedbacks in coupled oceanndashatmosphere models
J Climate 19 3354ndash60
7
8122019 The Global Atm Water Cycle
httpslidepdfcomreaderfullthe-global-atm-water-cycle 88
Environ Res Lett 5 (2010) 025001 Editorial
Takahashi K 2009 Radiative constraints on the hydrological cycle in an idealizedradiativendashconvective equilibrium model J Atmos Sci 66 77ndash91
Trenberth K E et al 2007 Estimate of the global water budget and its annual cycle usingobservational and model data J Hydrometeorol 8 758ndash69
Uppala S M et al 2005 The ERA-40 reanalysis Q J R Meteorol Soc 131 2961ndash3012
Voss R May W and Roeckner E 2002 Enhanced resolution modelling study on anthropogenicclimate change changes in extremes of the hydrological cycle Int J Climatol 22 755ndash77Webster P J 1994 The role of hydrological processes in ocean-atmosphere interactions Rev
Geophys 32 427ndash76Xie P and Arkin P A 1997 Global precipitation a 17-year monthly analysis based on gauge
observations satellite estimates and numerical model outputs Bull Am Meteorol Soc 782539ndash58
8
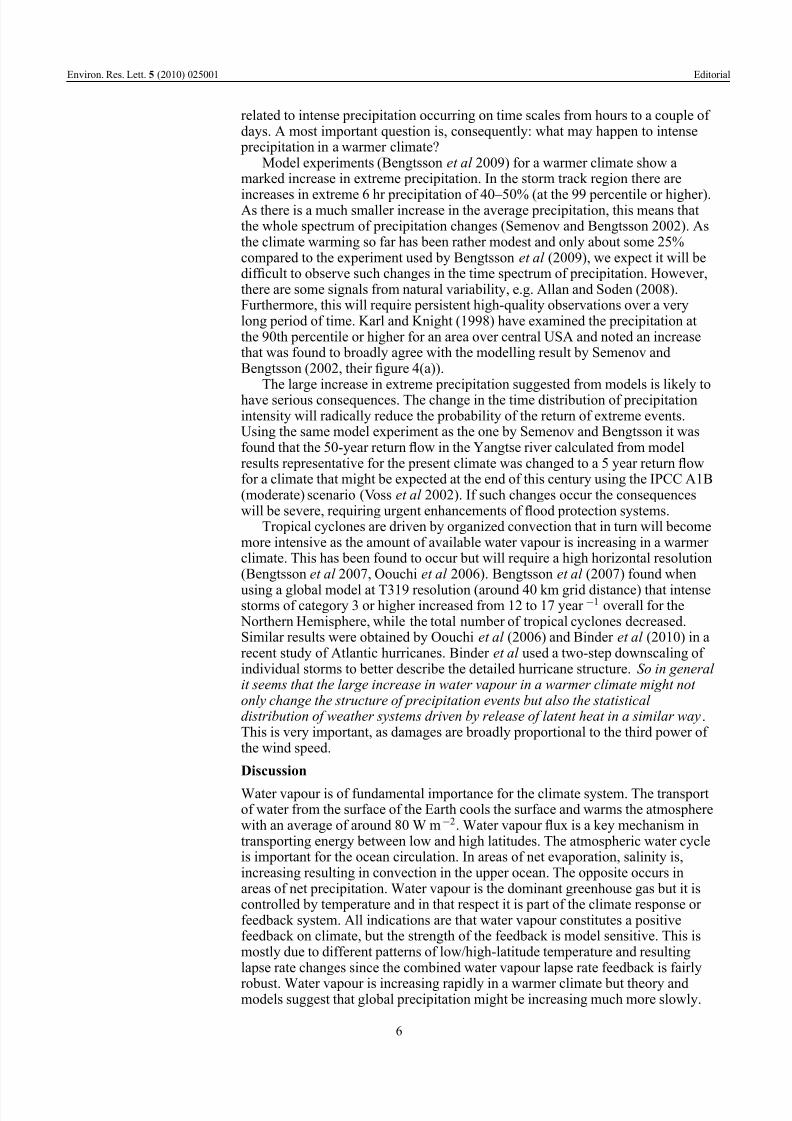
8122019 The Global Atm Water Cycle
httpslidepdfcomreaderfullthe-global-atm-water-cycle 88
Environ Res Lett 5 (2010) 025001 Editorial
Takahashi K 2009 Radiative constraints on the hydrological cycle in an idealizedradiativendashconvective equilibrium model J Atmos Sci 66 77ndash91
Trenberth K E et al 2007 Estimate of the global water budget and its annual cycle usingobservational and model data J Hydrometeorol 8 758ndash69
Uppala S M et al 2005 The ERA-40 reanalysis Q J R Meteorol Soc 131 2961ndash3012
Voss R May W and Roeckner E 2002 Enhanced resolution modelling study on anthropogenicclimate change changes in extremes of the hydrological cycle Int J Climatol 22 755ndash77Webster P J 1994 The role of hydrological processes in ocean-atmosphere interactions Rev
Geophys 32 427ndash76Xie P and Arkin P A 1997 Global precipitation a 17-year monthly analysis based on gauge
observations satellite estimates and numerical model outputs Bull Am Meteorol Soc 782539ndash58
8