the gift of the dying: the tragedy of aids and the welfare of future african generations
DESCRIPTION
THE GIFT OF THE DYING: THE TRAGEDY OF AIDS AND THE WELFARE OF FUTURE AFRICAN GENERATIONS. By Alwyn Young Presenters: Marisha Tardif Levan Bzhalava. World Situation About HIV/AIDS. Adults and children living with HIV/AIDS Estimated at end of 2001. - PowerPoint PPT PresentationTRANSCRIPT

THE GIFT OF THE DYING:THE TRAGEDY OF AIDS AND THE
WELFAREOF FUTURE AFRICAN GENERATIONS
By Alwyn Young
Presenters: Marisha TardifLevan Bzhalava
World Situation About HIV/AIDS

Adults and children living with HIV/AIDSEstimated at end of 2001

Estimated number of adults and children newly infected with HIV during 2001

Estimated adult and child deaths from HIV/AIDS during 2001
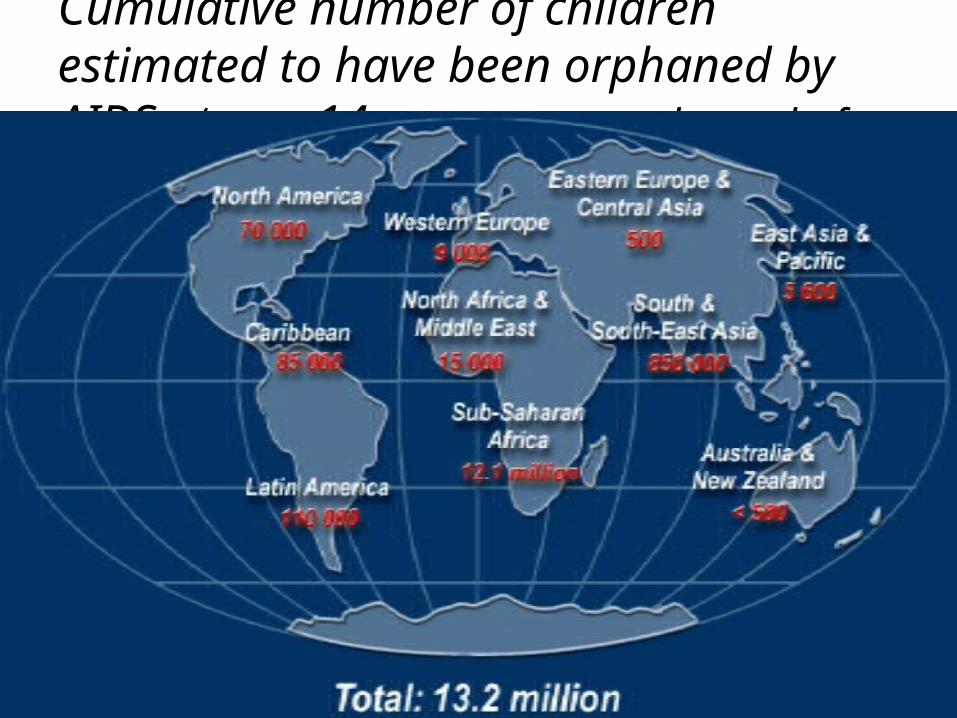
Cumulative number of children estimated to have been orphaned by AIDS at age 14 or younger at the end of 1999
South Africa

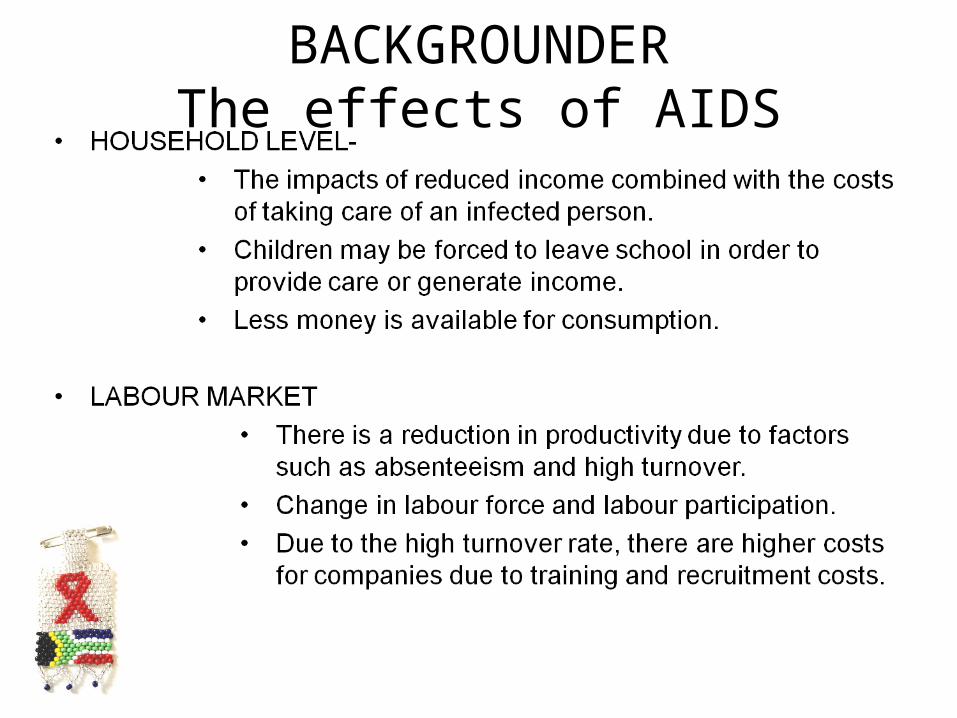
BACKGROUNDERThe effects of AIDS
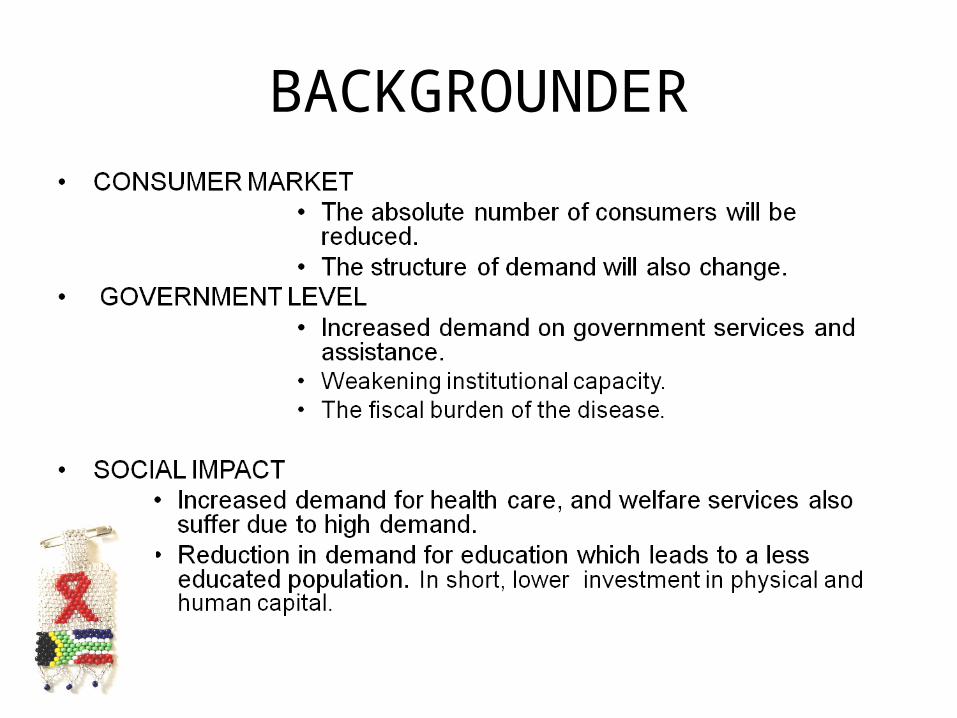
BACKGROUNDER

Model: Becker and Solow
Household behavior in the Beckerian tradition
n - quantity of childrenq - the "quality" of children (measured by their human capital)lm, lf - Individual leisure
Cm – material consumption

Model: Becker and Solow
Household utility function
LM - Male Labor SupplyLF - Female Labor Supply
Household utility is given simply by total consumption expenditures minus the disutility of labor

Model: Becker and Solow
If labor supply is of the isoelastic form per capita utility is then given by:
y - output per capita;s - savings rate;Ѳi - share of each factor in total income.
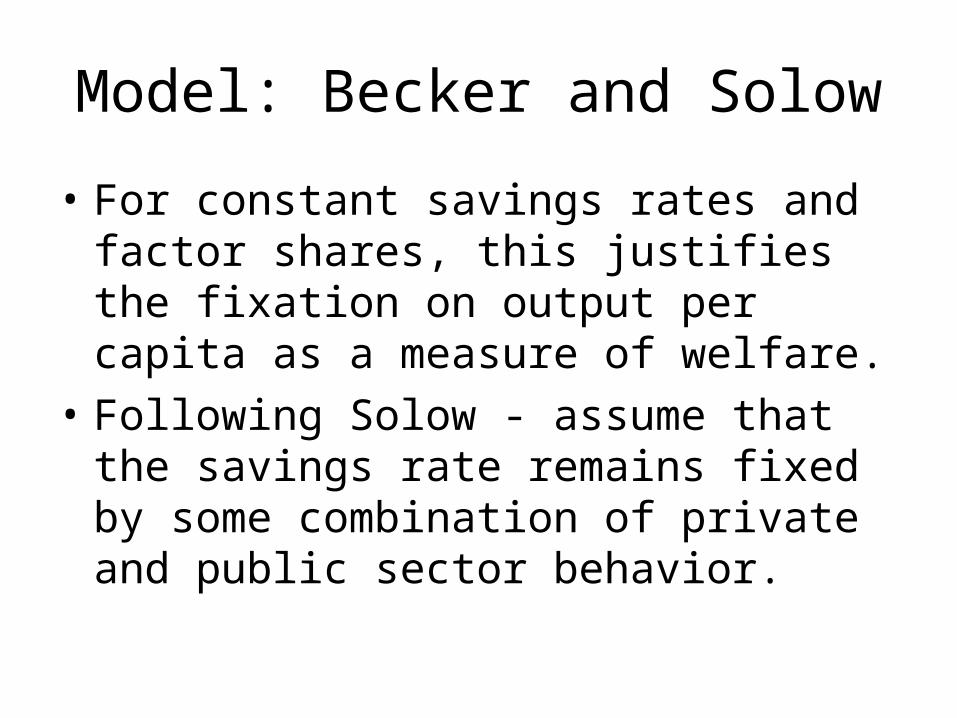
Model: Becker and Solow
• For constant savings rates and factor shares, this justifies the fixation on output per capita as a measure of welfare.
• Following Solow - assume that the savings rate remains fixed by some combination of private and public sector behavior.
Data
• 1995 - South African October Household Survey (OHS)
• 1998 - Demographic and Health Survey (DHS)
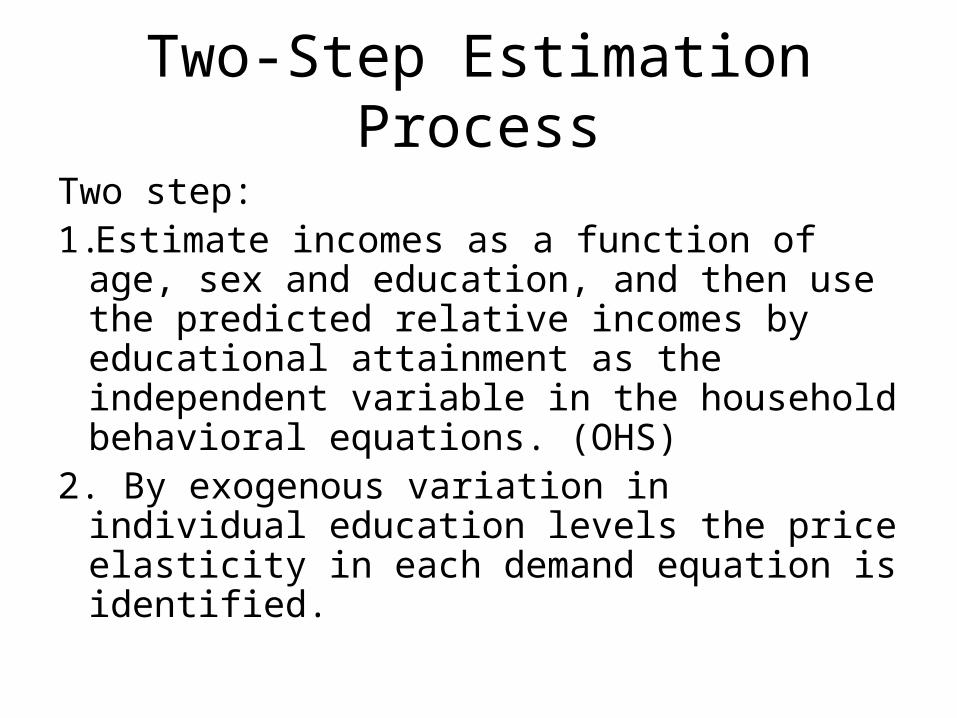
Two-Step Estimation Process
Two step:1.Estimate incomes as a function of age, sex and
education, and then use the predicted relative incomes by educational attainment as the independent variable in the household behavioral equations. (OHS)
2. By exogenous variation in individual education levels the price elasticity in each demand equation is identified.
Regression
1. Interval regression 2. Poison model3. Ordered probit
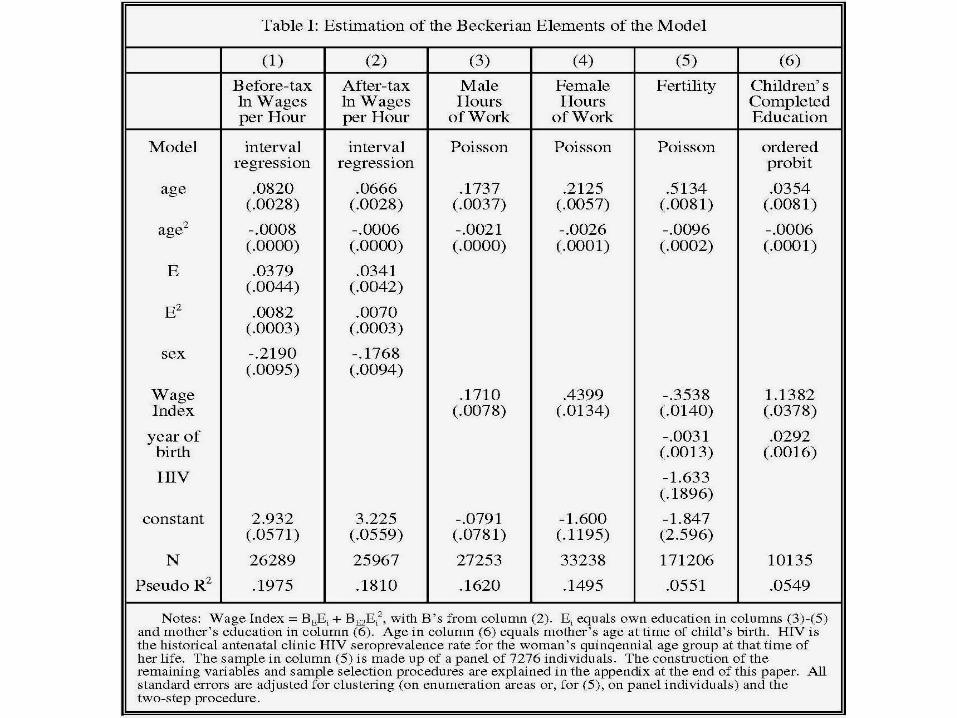

Female labor supply is more elastic than men’s:
Every 1% increase in wages, male labor supply rises .17% and female labor supply rises .44%.

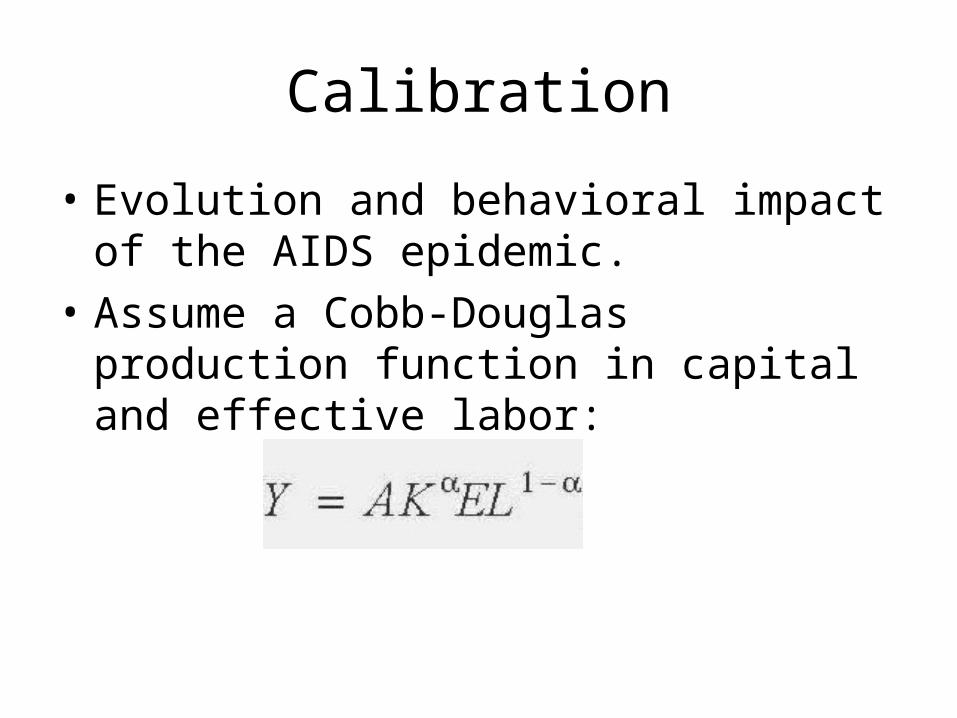
Calibration
• Evolution and behavioral impact of the AIDS epidemic.
• Assume a Cobb-Douglas production function in capital and effective labor:
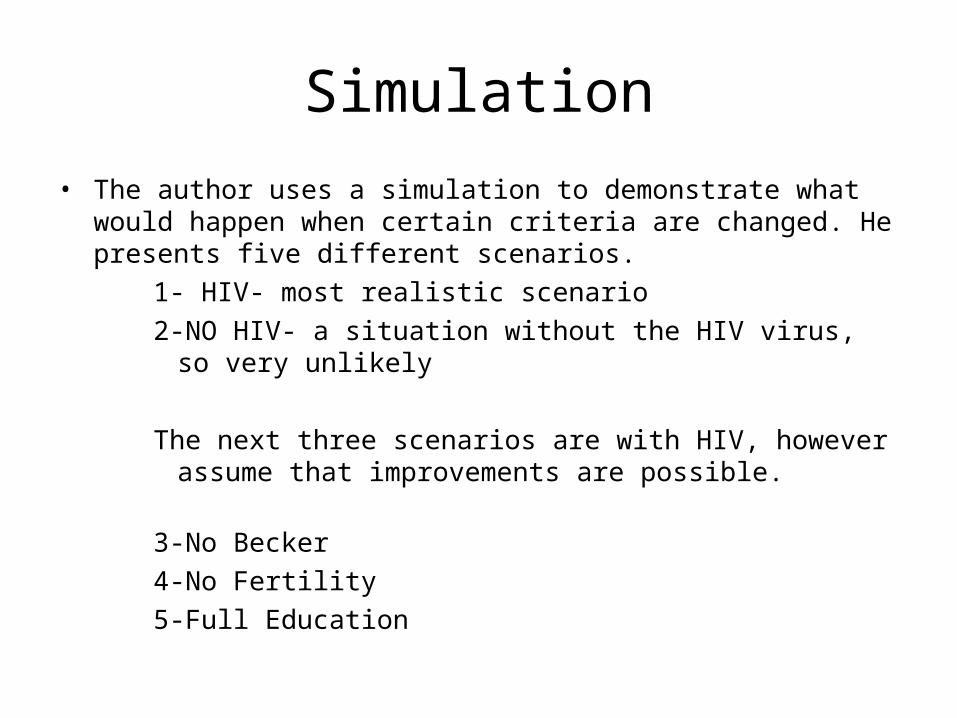
Simulation
• The author uses a simulation to demonstrate what would happen when certain criteria are changed. He presents five different scenarios.
1- HIV- most realistic scenario
2-NO HIV- a situation without the HIV virus, so very unlikely
The next three scenarios are with HIV, however assume that improvements are possible.
3-No Becker
4-No Fertility
5-Full Education
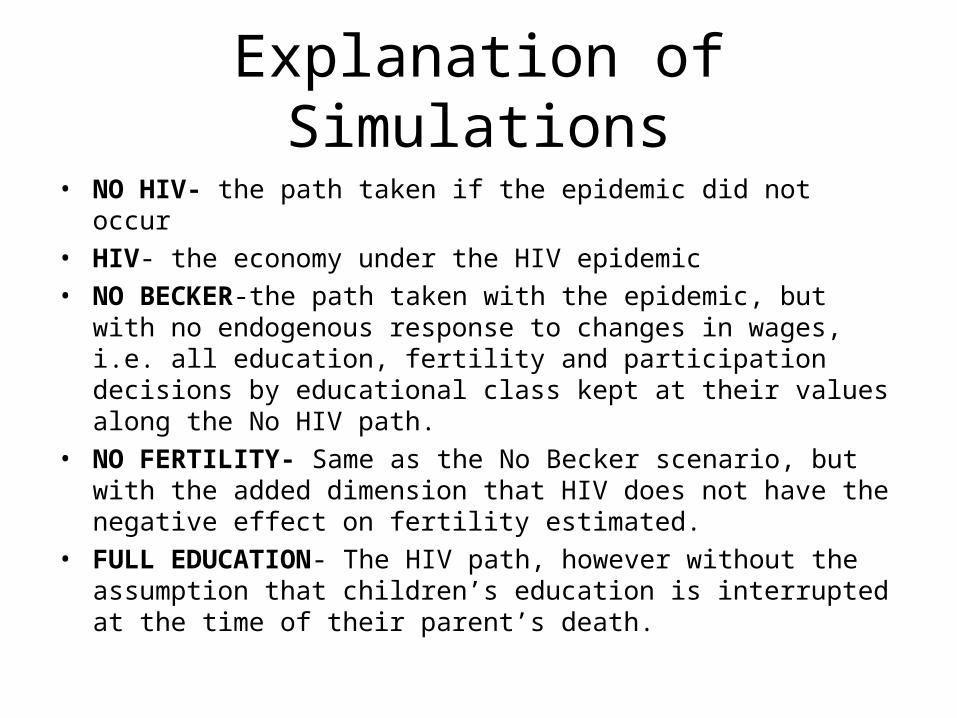
Explanation of Simulations• NO HIV- the path taken if the epidemic did not occur• HIV- the economy under the HIV epidemic• NO BECKER-the path taken with the epidemic, but with no
endogenous response to changes in wages, i.e. all education, fertility and participation decisions by educational class kept at their values along the No HIV path.
• NO FERTILITY- Same as the No Becker scenario, but with the added dimension that HIV does not have the negative effect on fertility estimated.
• FULL EDUCATION- The HIV path, however without the assumption that children’s education is interrupted at the time of their parent’s death.
Explanation• NO HIV- the wage initially declines, as better educated young age groups pressure
the ratio of capital to effective workers. Eventually it begins to climb, due to higher levels of education which in turn lead to lower fertility and consequently lower population growth. A rise in GDP per capita. Accumulation of labour and not of capital. Increases in educational attainment, especially for younger cohorts. This in turn leads to an increase of effective labour per capita. Lower fertility.
• HIV- The pattern seen under the No HIV scenario is reversed. High mortality in the first decades of the 21st century cause the wage to go up, but it does not remain so- it comes back down as the epidemic subsides, and the labour force is allowed to regenerate itself. It takes 60 years for the wage to return to the path dictated by the No HIV scenario.

Explanation• NO BECKER- Fertility does not respond to the temporarily higher wages. This
results in a steep decline in wages, which fall below the NO HIV path. Same happens with No Fertility, in which wages decline even lower. Neither participation, fertility or children’s education responds to the temporarily high wages. This means that output per capita rises by less during the wage boom and then falls well below the NO HIV path. This is caused by large portions of the population which remain uneducated.
• NO FERT- Bleaker scenario. Reduced fertility and higher adult mortality cause the economy to suffer, even despite the wage boom. High fertility in an uneducated population.
• FULL EDUCATION- The high wages which the epidemic managed to bring about sustain themselves on their own. These high wages, in turn, lead to lower fertility and better educated children. High wages and low fertility create higher output per capita
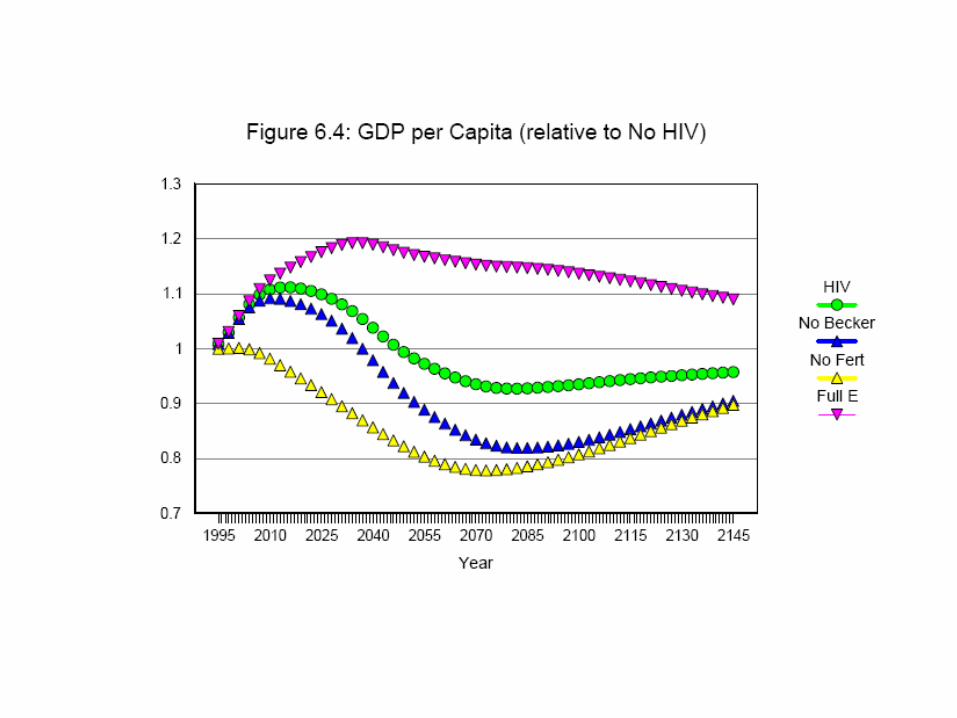

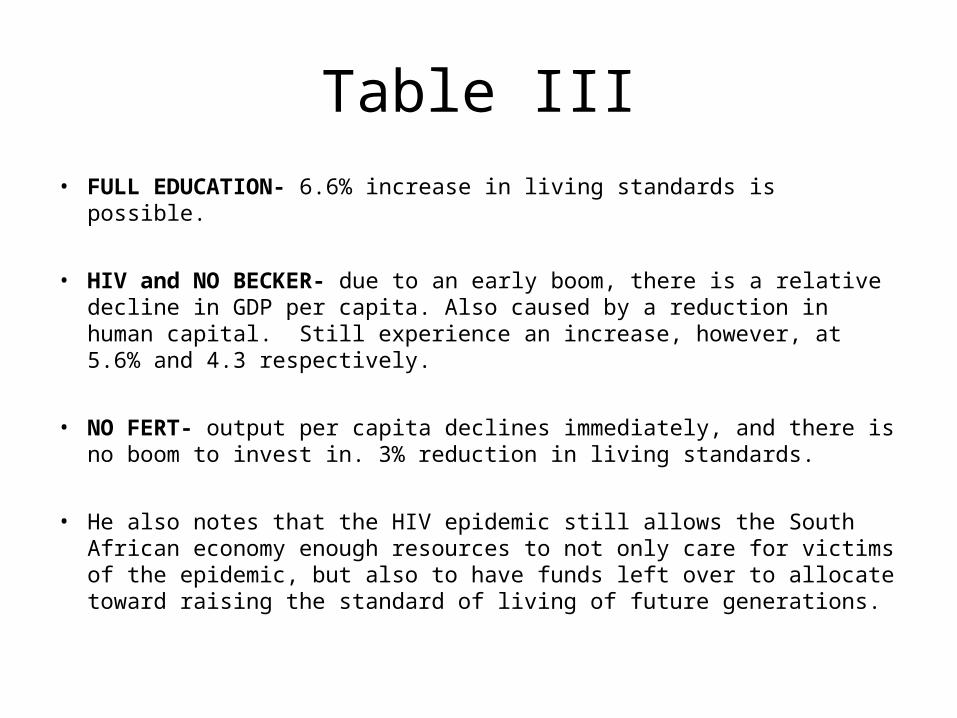
Table III• FULL EDUCATION- 6.6% increase in living standards is possible.
• HIV and NO BECKER- due to an early boom, there is a relative decline in GDP per capita. Also caused by a reduction in human capital. Still experience an increase, however, at 5.6% and 4.3 respectively.
• NO FERT- output per capita declines immediately, and there is no boom to invest in. 3% reduction in living standards.
• He also notes that the HIV epidemic still allows the South African economy enough resources to not only care for victims of the epidemic, but also to have funds left over to allocate toward raising the standard of living of future generations.

• The result of the simulation support the fifth scenario, or full education, with the highest percentage of lives, at 6.6%, and the cost of each patient at $11,000. This is accompanied by higher living standards for patients.
• The point of this simulation is to demonstrate through the introduction of certain variables, that AIDS is in fact a positive phenomenon for the African economy, based on a production-centered economy.
“The inescapable conclusion is that the HIV epidemic has produced an abrupt reduction in fertility, endowing future generations with
greater material resources per capita. “p.35

Recent empirical trends in the South African economy
• During the 1990s as the epidemic spread and entered the public consciousness, aggregate savings and capital formation have remained remarkably steady.
• Rising parental mortality.• School enrollment rates for the youngest age groups have not fallen,
while those of older teenagers have declined by only 5%


AIDS has a profound impact on workers and their families,
enterprises and national economies.

Critique of the article• The author’s simulation does not seem to take into consideration the factor
of political changes and cultural and the evolution of social norms. The latter two are impossible to predict. These factors are difficult to simulate and quantify.
• The paper makes use of many statistical assumptions, and some of the statistical flaws of African nations makes it difficult to trust some equations in the paper. There is a strong need for reliable data. A bigger reliance of quantitative data rather than qualitative.
• Population without AIDs 110 million versus Population with AIDS 50 million. The cost to the economy of loosing 60 million people is enormous. Also production costs may increase, which will have a negative impact on competitiveness and deter investment.
• We must also know the effect on the total demography; how are the age groups distributed?
Supplementary sources• Badcock-Walters, Peter and Franklin, Lucinda. “Socio-Economic Impact of HIV/AIDS on KwaZulu
Natal: The Management Challenge.” Health and Economics and HIV AIDS Research Division, University of Natal.
• International Finance Corporation, World Bank Group. “IFC Against AIDS: Protecting People and Profitability.” http://www.ifc.org/ifcagainstaids
• George, Gavin. “Macroeconomics & HIV/AIDS in the South African Context.” Health and Economics and HIV AIDS Research Division.
• The DAIMLERCHRYSLER HIV/AIDS Program in South Africa. Dr Clifford Panter, Dr Andrea Knigge, Mr Mike Folan, DaimlerChrysler SA (Pty) Ltd, GTZ GmbH - Disease Control Health Promotion, The case study that refers to this document is available at: www.weforum.org/globalhealth/cases