the geography of logistics firm location: the role of ... - holl_mariotti.pdf · (maggi and...
TRANSCRIPT
Working papers SIET 2016 – ISSN 1973-3208
1
The geography of logistics firm location: the role of
accessibility
Adelheid Holl 1, Ilaria Mariotti2
1 CSIC - Institute of Public Goods and Policies
2DAStU - Politecnico di Milano
Sommario
The organization of modern economies is built upon an efficient transport system and an increasing role
is played by the logistics sector in overcoming the constraints of time and distance in modern supply chains.
While a large body of literature is dedicated to the spatial distribution of firms and firm location choice in
general, surprisingly little is still known about the location patterns of logistics firms, and more specifically
about the role of accessibility in their location decisions. We use geo-referenced firm level data along with
detailed information on transport infrastructure in order to investigate the geography of logistics firms in
Spain. We place specific attention to the relationship between logistics firm location, accessibility, and
urban structure. Our results show that these firms are located closer to highways and other transport
infrastructure compared to other sectors and that the logistics sector is highly urbanized. Yet, they are also
locating increasingly in suburban locations and to some extent in extra-urban locations with good
accessibility while central cities of urban areas have experienced a declining share of logistics firms.
Parole chiave: logistics, location, accessibility, urban structure, Spain
1. Introduction
With the increasing need to transport quickly and efficiently, transport and logistics
play a key role in overcoming the constraints of time and distance in modern supply
chains. This is even more true in a context where firms are facing competition that is ever
more global. Firms are now concentrating more on specific consumers’ requests, on
delivering goods with greater speed, seeking ways to reduce costs, and improving quality
(Bonacich and Wilson 2008). To achieve these ends, firms formulate intelligent
strategies, including the use of international logistics techniques to gain competitive
advantage in the management of supply chains (Wood et al. 2002). Indeed, logistics is
becoming increasingly popular as a competitive device for companies to reduce delivery
times, increase reliability and flexibility in deliveries, heighten customer responsiveness,
and facilitate the successful implementation of Just-In-Time (JIT) manufacturing and
distribution systems (Lai and Cheng 2009; Brouwer et al., 2011). Since the 1950s, indeed,
Corresponding author: Ilaria Mariotti ([email protected])
Working papers SIET 2016 – ISSN 1973-3208
2
the logistics industry has experience the so-called “logistics revolution” that can be
explained with five interrelated phenomena: (i) the consumer-oriented economy
demanding a level of service customization and delivery speed which is only possible if
more frequent shipments of goods are made ; (ii) Internet-based information systems; (iii)
the substantial reductions of trade barriers, tariffs and transportation costs; (iv) the
European Traffic Policy; and (v) the processes of vertical disintegration and value-chain
decomposition in most industries associated with the ongoing globalization of the
economy that has increased the amount of goods flows to be moved around the globe
(Maggi and Mariotti, 2012; Mariotti, 2015).
The consumer-oriented economy, which is geared to mass consumption, mass
production, and the mass distribution of consumer goods (Strasser, 1998), has heightened
the complexity of logistics processes in production and trade. The management of such
complexity has been made feasible by the Internet-based information systems developed
in the 1990s. These systems have made the exchange of information drastically simpler
and cheaper, while Internet-based mail order businesses have boosted parcel services.
Moreover, a key role has been played by various technology innovations in freight
moving and handling: for instance, the rapid growth in roll-on, roll-off trucking
technology, gains in containerization technology and capacity, rapid-turnaround shipping
and the increased speed and efficiency of air transport technologies (McCann, 2008).
All of these technological developments have contributed to a huge reduction in
transport costs (Hummels, 1999; van Veen-Groot and Nijkamp, 1999; Glaeser and
Kohlhase, 2004; Levinson, 2006; Notteboom, 2007; McCann, 2008; Notteboom and
Rodrigue, 2009; Coto-Millàn et al., 2015). In particular, during the twentieth century the
costs of moving goods declined by over 90% in real terms, and this reduction is
continuing. Indeed, the average cost of transporting a ton a mile decreased from 18.5 cents
in 1890 (in 2001 dollars) to 2.3 cents in 2004 (Glaeser and Kohlhase, 2004). At the same
time, the EU Traffic Policy intended to favour the liberalization of truck traffic has greatly
increased the truck fleet and traffic flows in the Europe. In around only ten years, from
1990 to 1999, road traffic within European member states increased by 76%
(Vahrenkamp, 2010).
Moreover, the globalization of the economy has strongly affected transport and
logistics. Vertical disintegration is linked to the post-Fordist paradigm, which promoted
the switch from the mass production of standardized goods to the market-oriented
production favouring so-called flexible specialization. Finally, in an increasingly
globalized environment, logistics has also become one of the main engines of
competitiveness and economic development (see also Xiushan et al., 2015). If a country
is to become competitive in the global scenario, it should improve the quality of logistics
services, develop and enhance the logistics infrastructure, promote the cooperation and
coordination among logistics services providers, invest into IT, reduce logistics costs, and
increase training on all aspects of supply chain management. As stressed by the literature,
there is a bidirectional link between economic development and logistics performance
(see Arvis et al. 2007; Ferrari et al., 2011).
These trends have significantly changed the geography of freight distribution and
logistics and the way goods move through the economy. Yet, although transport and
logistics are factors in a country’s competitiveness, and logistics activities have
experienced enormous, largely unnoticed, growth in recent years (Bowen, 2008), research
into this topic is generally underrepresented in regional science and economic geography
(Hesse and Rodrigue, 2004). Besides, while the literature on manufacturing firm location
Working papers SIET 2016 – ISSN 1973-3208
3
is extensive, highlighting the role of accessibility as one of the key variables in firm
location decisions (see, for example, Reggiani, 1998; Head and Mayer, 2004; Holl, 2004;
Rietveld and Bruinsma, 2012), surprisingly little is still known about the location patterns
of logistics firms and how accessibility considerations shape this pattern.
Nevertheless, it cannot be denied that understanding the location decisions of transport
and logistics firms is important for the society because the demand for “logistics floor
space” is expected to grow substantially in advanced economies, while the demand for
“industrial floor space” is expected to decline (McKinnon, 2009). The expected growth
in logistics floor space is correlated with the predicted growth of freight transport
volumes, which is estimated in the EU to reach about 82% in 2050 (European
Commission, 2011). It is, therefore, crucial to investigate the location decisions of
transport and logistics firms for policy makers since it has a huge impact on the demand
for freight transport, and the choice of freight transport modes (Bowen, 2008). Besides,
the location of logistics activities enters the policy debate since it raises land consumption
and contributes to urban sprawl (Van Den Heuvel et al., 2013).
The scant literature on the location choice of transport and logistics concerns mainly
logistics sprawl, with a focus on warehousing location at regional/metropolitan level, and
the location choice of transport and logistics foreign direct investments (FDIs) at national
level. Only the work by Bowen (2008) and Verhetsel et al. (2015) analyze explicitly the
role played by accessibility measures related to several kinds of transport networks in
fostering warehousing location in US in 1998-2005 and in influencing location choice of
logistics companies in Flanders (Belgium) respectively.
Our paper contributes to fill the gap in the literature by investigating the geography of
logistics firms in Spain in the period 2002-2007, and specifically the relationship between
logistics firm location, accessibility, and urban structure at a spatially disaggregated level.
To reach this goal, we use geo-coded firm level data from the SABI database (Sistema de
Análisis de Balances Ibéricos), generated by INFORMA and Bureau Van Dyck, along
with detailed information on transport infrastructure, accessibility measures, and
municipality characteristics. By combining our geo-coded data for the whole of mainland
Spain with Geographic Information System (GIS) techniques, this paper is the first to
provide a comprehensive spatially detailed quantitative analysis of the geography of
logistics firm.
We organize our empirical analysis in two parts. First, we carry out a spatial analysis
to explore the geography of logistics firms compared to other sectors (manufacturing,
business services, and transportation) regarding access to transportation infrastructure and
urban structure. Second, we study the location behaviour of new logistics firms born in
2002-2007 and the role played by accessibility using an econometric analysis.
Specifically, we apply a Poisson model and examine the robustness of our results to the
use of a negative binomial model as well as a zero-inflated negative binomial model.
We provide evidence that logistics firms are located closer to highways and other
transport infrastructure compared to other firms (manufacturing, business services, and
even transport operators). Besides, they are strongly attracted to urban areas (mainly
Madrid and Barcelona) for their market size and market potential, but also increasingly
to suburban locations and, to some extent, extra-urban locations that have good
accessibility. In contrast, central cities of urban areas have experienced a declining share
of logistics firms. Recent research for the US (Bowen, 2008; Dablanc et al. 2014) has
highlighted this phenomenon of sprawl in relation to warehousing. We provide empirical
evidence based on the logistics sector and in a European context. The results of the
Working papers SIET 2016 – ISSN 1973-3208
4
econometric analysis confirm that logistics firms are strongly attracted by access to
transportation infrastructure (especially highways) and large markets.
The paper is structured into five sections. The introduction is followed by the literature
review on the location patterns of logistics firms. Section three is dedicated to data
description while the empirical analysis and its results are described and discussed in
section four. Section five presents conclusions and policy recommendations.
2. Literature Review
The location determinants of the transport and logistics industry are closely bound up
with the features of the services that it furnishes. First, logistics activities are intermediate
inputs, so that the demand for logistics services derives from the demand for final goods
or services. Moreover, customers’ preferences significantly affect the behaviour of
logistics providers. Second, logistics services are business services. They are typically
non-traded or furnished at much higher costs from a distance (Daniels, 1985; Markusen
et al., 2005). Consequently, the use of logistics services provided from another region
implies distance related coordination costs. Third, business services are normally
produced with internal economies of scale (Groot, 2001) due to high set-up costs. Finally,
logistics services are largely customized because customers normally have particular
requirements and need differentiated logistics services.
The few studies on the location patterns of the transport and logistics industry belong
mainly to two strands of literature: one referring to logistics sprawl that has largely
focused on the location of warehousing activities at regional/metropolitan level; the other
investigating the location determinants of transport and logistics FDIs at national level.
The studies of the first group refer to the USA (Bowen, 2008; Dablanc and Ross, 2012;
Dablanc et al., 2014), the Netherlands (Van Den Heuvel, 2013), Belgium (Vanhetsel et
al., 2015), the UK (Allen and Browne, 2010), and Germany (Hesse, 2004). The studies
of the second group refer to China (Oum and Park, 2004; Hong and Chin, 2007; Hong,
2007; 2010), and Italy (Boscacci et al., 2009; Mariotti et al., 2012; Mariotti, 2015).
The most closely related study to ours are Vanhetsel et al. (2015) and Bowen (2008).
Vanhetsel et al. (2015) study the role of accessibility and land rents in the location choices
of logistics firms in the Flanders region in Belgium by means of a stated preference
analysis among 100 respondents. Based on data for the 200 largest logistics companies,
they furthermore present information on actual location patterns in relation to access to
transportation infrastructure. This shows that the logistics firms analyzed are located at
very short distances of transportation infrastructure. The stated preference analysis
revealed land rents as the most important location factor followed by access to sea ports
and access to motorways while rail terminal access showed no significant role.
Bowen (2008) studies the relationship between the location of warehouses and
accessibility measures of several kinds of transport networks in the US between 1998 and
2005 at the county level. He finds that highway accessibility matters more than rail and
especially more than sea accessibility, and concludes that the significant speed advantages
air and road transport have over maritime and rail transport are important. This implies
that those communities with good accessibility in air and highway networks stand to
benefit most from the new emphasis on supply chain management, but they will also of
course bear the costs of increased inbound and outbound goods traffic.
Dablanc et al. (2014) is another study looking at warehousing sprawl. They analyze the
sprawl of warehouses in 1998-2009 in Los Angeles and Seattle Metropolitan Areas. It
Working papers SIET 2016 – ISSN 1973-3208
5
results that while warehousing in Los Angeles considerably sprawled, with an average
distance increase of over 6 miles, in Seattle the region remained relatively stable, showing
a slight decrease in average distance from the geographic centre. These different location
patterns may be related to the specificities of the two metropolitan areas: Los Angeles is
a very large metropolitan area while Seattle is a smaller one, and as known, logistics
sprawl is typical of large metropolitan areas that serve both as trade nodes to the entire
region/country as well as enormous consumer markets. Another aspect concerns land
availability, and its cost (Sivitadinou, 1996): in Seattle, at the end of the 1990s, large land
parcels, close to ports, airports and freeways, were available for logistics, while in Los
Angeles cheap land in suburban and extra-urban areas fostered logistics sprawl. Finally,
government policies may have played a role in the accommodation of new logistics
functions in the two areas. Specifically, in Los Angeles logistics sprawl has been fostered,
on one side by tailored actions undertaken by suburban communities to encourage growth,
and on the other side by the lack of legislature to discourage growth.
Van der Heuvel et al. (2013) investigate the role of spatial clustering in location
decisions in the south Dutch province of North Brabant in 1996-2009. It results that
logistics employment is spatially concentrated in the so-called Absolute and Relative
Employment Concentration Areas (AREC areas). These areas are also more likely to host
large logistics establishments than smaller ones because the latter may be deterred by
agglomeration diseconomies (i.e. high land/lease prices). Besides, the logistics
establishments that relocated within the province choose relatively often AREC areas,
while transportation establishments locate relatively often in areas that became AREC
areas in the future, in order to avoid possible disadvantages of logistics co-location, like
congestion and higher land prices. It is shown that logistics employment grows faster in
areas with at least one intermodal container terminal than in areas without one.
Allen and Browne (2010) find that warehousing tend to move away from urban areas
to suburban areas in the UK and elsewhere in Europe, mainly because of land prices.
Besides, the authors find that in England warehousing districts are often strategically
clustered along motorways but just outside large cities. The location of warehousing is,
indeed, partly due to accessibility to the road network and partly a result of planning
policy.
Finally, Hesse (2004) analyses two case studies in Berlin-Brandenburg Germany – a
publicly developed integrated freight centre and a dispersed logistics site – and finds that
rising locational competition contributes to accelerated land consumption and further
dispersal. Logistics activities tend to favour distant locations for many reasons, some of
which are specific to this industry, while others apply to many economic sectors:
overcoming congestion, planning requirements, or even the influence of unions.
The studies concerning the cases of China and Italy refer to the decisions by
multinational enterprises (henceforth MNEs) about where to locate their affiliates (i.e.
FDIs) in the transport and logistics industry. China hosts a logistics market still in its
infancy, which creates increasing opportunities for investors, while Italy presents a poor
supply of integrated logistics, and a related increasing demand for high value added
logistics services. The analyses focusing on China can be classified into two groups: those
investigating location determinants per se (Oum and Park, 2004; Hong and Chin, 2007),
and those analyzing the impact of firm-specific effects (i.e. firm type – branch firm or
independent firm –;country of origin; age) on location decisions (Hong, 2007; Hong,
2010).
Working papers SIET 2016 – ISSN 1973-3208
6
Transport and logistics FDIs tend to be responsive to market size and market demand;
they, therefore, prefer areas with strong industrial bases and tend to locate where the
customers are willing to outsource logistics services to external providers (for a review
see, Mariotti, 2015). The availability of skilled labour is an important location
determinant, especially when inward FDIs are in the more value added activities
(multimodal transport operators and freight forwarders), as in the Italian case. Also high
labour costs deter inward FDIs in China, reflecting foreign investors’ efforts to reduce
operational costs (Hong, 2010). The number of existing logistics service providers may
influence the location choice of foreign logistics firms, thus confirming the existence of
agglomeration economies in logistics. Foreign investors, indeed, suffer from adverse
asymmetry in information costs compared with insiders (Radner, 1992; Casson, 1994;
Mariotti and Piscitello, 1995). Therefore, the opportunity to reduce information costs as
well as to share spillovers from foreign agglomeration will be greater in areas affected by
FDI penetration for a longer period (Guimarães et al., 2003; Hong, 2007; Mariotti et al.,
2012). Besides, even cultural and geographical proximity (Hofstede, 1980) plays a key
role: MNEs from Hong Kong, Macao and Taiwan are more likely to locate in Southern
China.
Transportation infrastructures are important factors since they drive the
internationalization of many service companies, especially in activities that require close
relationships between customers and suppliers, and/or their geographical proximity (Oum
and Park, 2004; Hong and Chin, 2007; Hong, 2007, 2010; Bowen, 2008; O’Connor, 2010;
Mariotti et al., 2012). Government policy can be successful in attracting FDIs (Van Den
Heuvel et al., 2013) by fostering, for ex-ample, the development of Special Economic
Zones and Open Costal Cities, as in the case of China (Head and Ries, 1996; Hong and
Chin, 2007).
Some distinctive characteristics of the logistics industry should be noted, such as the
importance of good transport networks, an efficient bureaucracy as regards administrative
and customs procedures, and a high degree of government regulation. This last, in fact,
in the case of China, made roadway infrastructure an unimportant consideration before
the mid-1990s. However, when the Chinese government reduced the restrictions about
the provision of roadway transport services by foreign firms, transport conditions became
a key consideration for inward FDIs (Hong, 2010).
3. Data
Firm level data: Our firm level data comes from the SABI data base, which corresponds
to the Iberian section of the Amadeus database. The database contains annual accounts of
more than 1 million Spanish firms and includes their geographic co-ordinates, the year
the firm was created and its industry among other firm-level characteristics.
To identify logistics firms we use the four-digit level of the 2009 National Classification
of Economic Activities (CNAE 2009). SABI included 8,959 firms in Spain that belonged
to the logistics sector (CNAE 5210-5229) in the year 2007.1 Of this, about 14% were
warehousing and storage firms, 31% logistics firms providing services related to land
transportation, 12% related to water transportation, 3% related to air transportation, 6%
of logistics firms were engaged in cargo handling, and 34% in other transportation support
1 According to the Directorio Central de Empresas (DIRCE), there were 14,484 logistics firms in 2007.
Working papers SIET 2016 – ISSN 1973-3208
7
activities. Note, we focus specifically on logistics firms. This group does not include
transport operators.
Using the geographic coordinates, we have geo-coded all firms in ArcGIS.2 This allows
us to relate our firm level data to geo-referenced digital vector maps of the Spanish
transportation networks. Specifically we relate firms to the highway network (for more
detail, see, Holl, 2016), airports and seaports. Note, we do not include the rail network in
our analysis because it is generally not found significant for firm location, and it is not of
great relevance for freight movements in Spain. Only approximately 4% of all
merchandise movements in Spain are by rail, a percentage that is considerably below the
EU average.
Having geo-coded data means, the exact distance from each firm to the transportation
network can be calculated and the firm-level data can be integrated with other spatial data
on a fine-grained spatial scale.
Accessibility variables: Our first measure of accessibility is closely related to the concept
of market potential (Harris, 1954) where accessibility is determined by the distance to
and the size of markets in alternative locations. Market potential in location j is the sum
of the market size in all other locations Mk (proxied here by municipality population)
divided by their distance djk to k. Distance here is measured by the travel time along the
road network.
k jk
kj
d
MMA
(1)
The measure reflects the volume of economic activity a given location has access to after
taking into account the cost of overcoming distance.
With the current changes in industrial organisation towards increasingly interconnected
production, transport and communication processes, location near specific transportation
infrastructure such as highways, airports or seaports can provide additional advantages in
terms of access to customers, production and value chains. Using our geo-coded firm
level data together with the geo-coded transportation infrastructure, we have calculated
the distance from each firm to its nearest highway, its nearest airport and its nearest
seaport. 3
Municipality characteristics: Spain is divided into nearly 8.000 municipalities. We add
controls regarding socio-economic and physical geography characteristics of
municipalities that might influence the location of logistics firms. We also include data
on the urban characteristics of municipalities. Here, we use the definition of Spanish
urban areas from the AUDES methodology (Ruiz, 2010), which combines land use
continuity and commuting criteria at the municipal level to establish central city (CBD)
municipalities plus their surrounding built-up areas (suburban areas). With this
information, we create three categories of municipalities: rural areas, suburban and CBD
2 Note, we have used only firms in mainland Spain. 3 All airports with more than 1 million passengers in 2007 have been included. Alternatively, we have also tested for cargo airports but main results are very similar. All seaports of general interest to the state as
outlined in the Ministry of Public Work’s Annual Yearbooks have been included.
Working papers SIET 2016 – ISSN 1973-3208
8
municipalities. We furthermore calculate different distances to urban areas. Variable
definitions and data sources are summarized in Appendix 1.
4. Empirical analysis
Our empirical analysis is organized in two parts. First, we carry out an exploratory spatial
analysis where we investigate the geography of logistics firms and compare their spatial
pattern to the location patterns of other firms, namely, manufacturing firms, business
firms and transport operators in the year 2007. Second, we estimate count data models to
investigate the location determinants of new logistics firms that have been created in
2002-2007 (both years inclusive), and focus on the specific role of accessibility.
4.1. Exploratory analysis of the location patterns of logistics firms
Starting with our exploratory spatial analysis, Table 1 shows the distribution of logistics
firms by municipalities. Logistics firms concentrate in a fairly small number of
municipalities. More than 85% of Spanish municipalities have no logistics firms at all
and about 10% of municipalities have less than 5 logistics firms. The remaining 1.7% of
municipalities shows more than 10 logistics firms with 11 municipalities that have over
100 logistics firms. These 1.7% of municipalities concentrate three quarters of all Spanish
logistics firms. Two municipalities stand out: Madrid and Barcelona each one house about
1,000 logistics establishments. Taking into account also their suburbs, the two urban areas
house about a third of all logistics establishments. This numbers confirm the strong spatial
concentration of logistics firms in specific urban areas (Bowen, 2008; Jing and Cai, 2010;
van den Heuvel et. al., 2013).
Table 1. Number of logistics firms by municipality: 2007
Number of new logistics firms Municipalities
No %
0 6781 85.3
1 to 5 897 11.3
5 to 10 136 1.7
10 to 20 67 0.8
20 to 100 59 0.7
100 and more 11 0.1
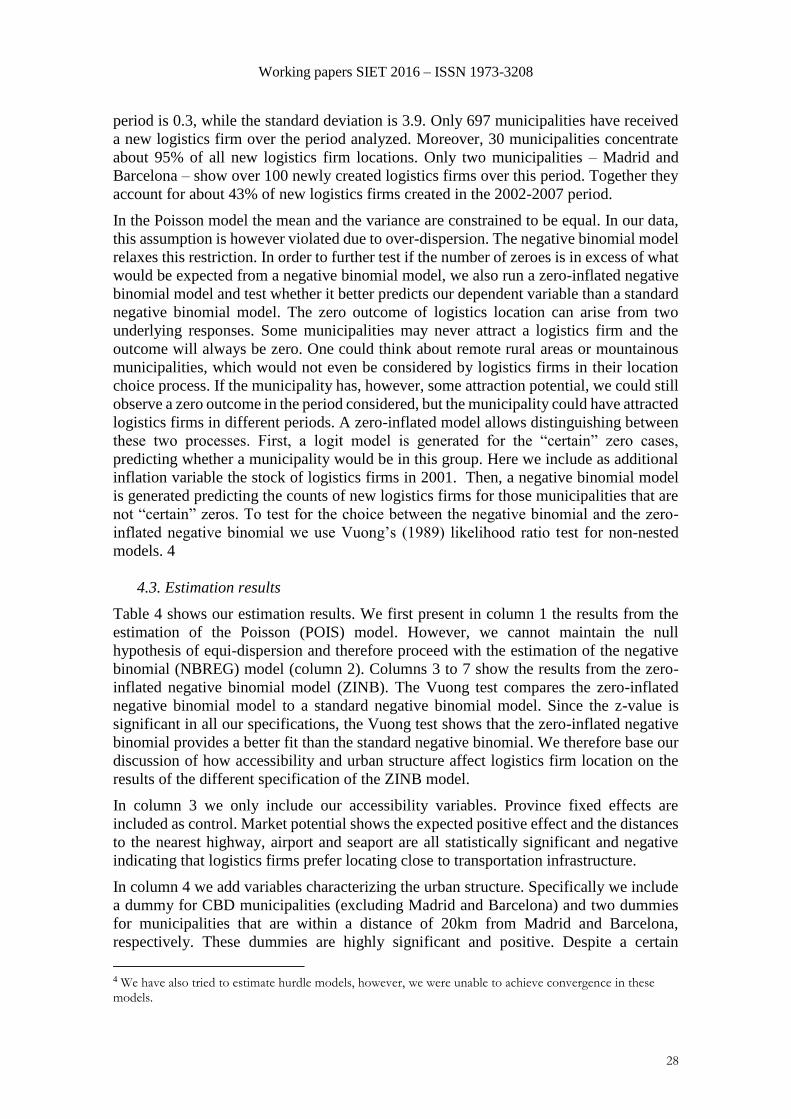
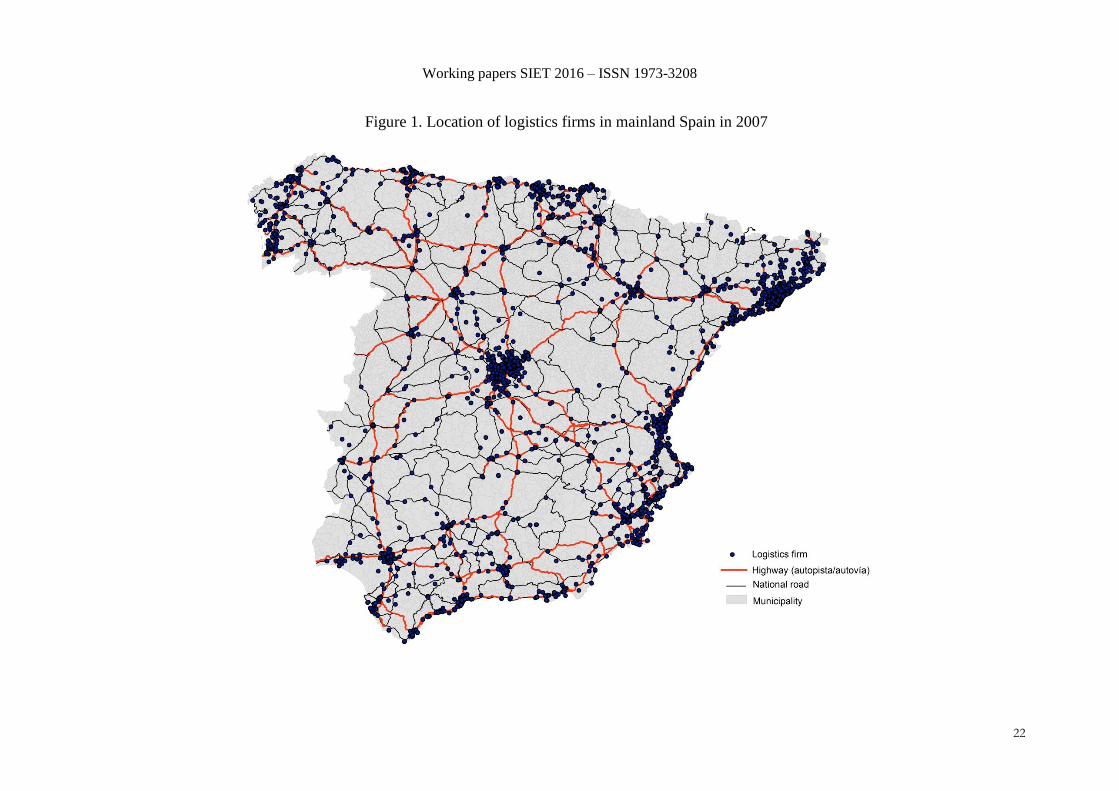
Next, we map our logistics firms (note, these are firms in SABI that were active in 2007)
together with the 2007 road network (Figure 1 in Appendix). In addition to the
concentration in the Madrid and Barcelona area, one can also observe some concentration
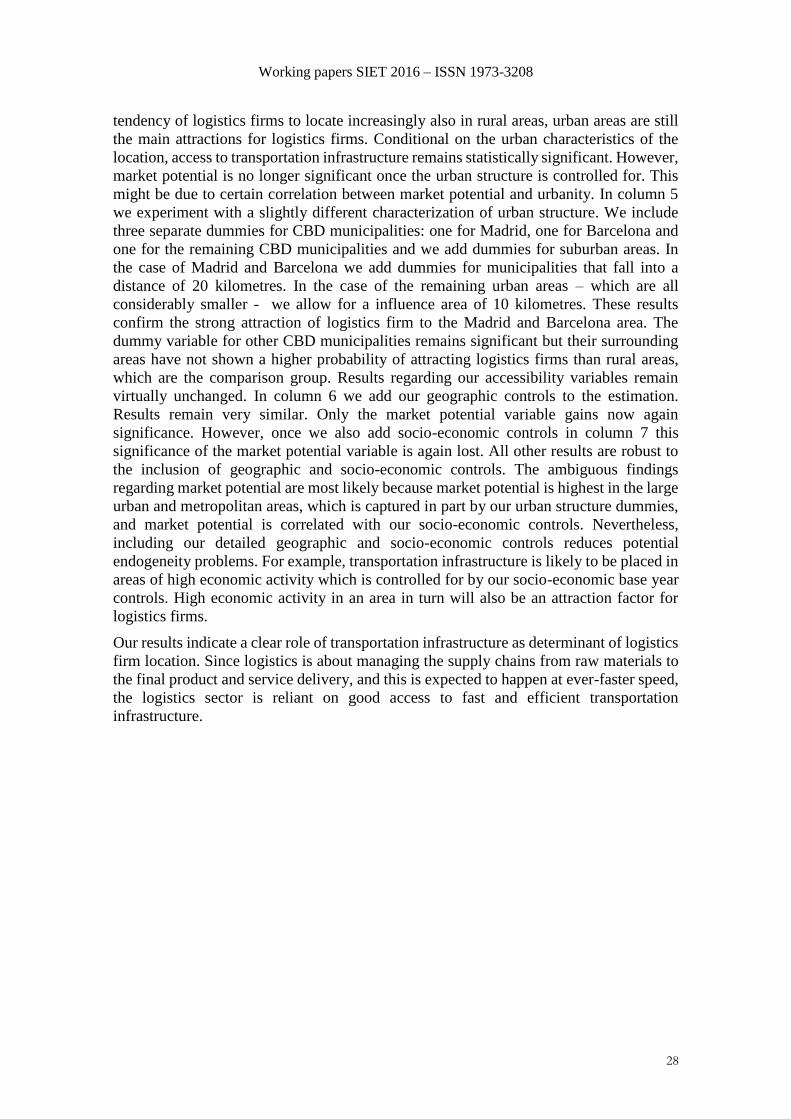
around other major cities, but also along major transportation corridors. Figure 2 in
Appendix provides a zoom-in for the Madrid and Barcelona area. Again, the relevance of
the road network stands out.
Working papers SIET 2016 – ISSN 1973-3208
28
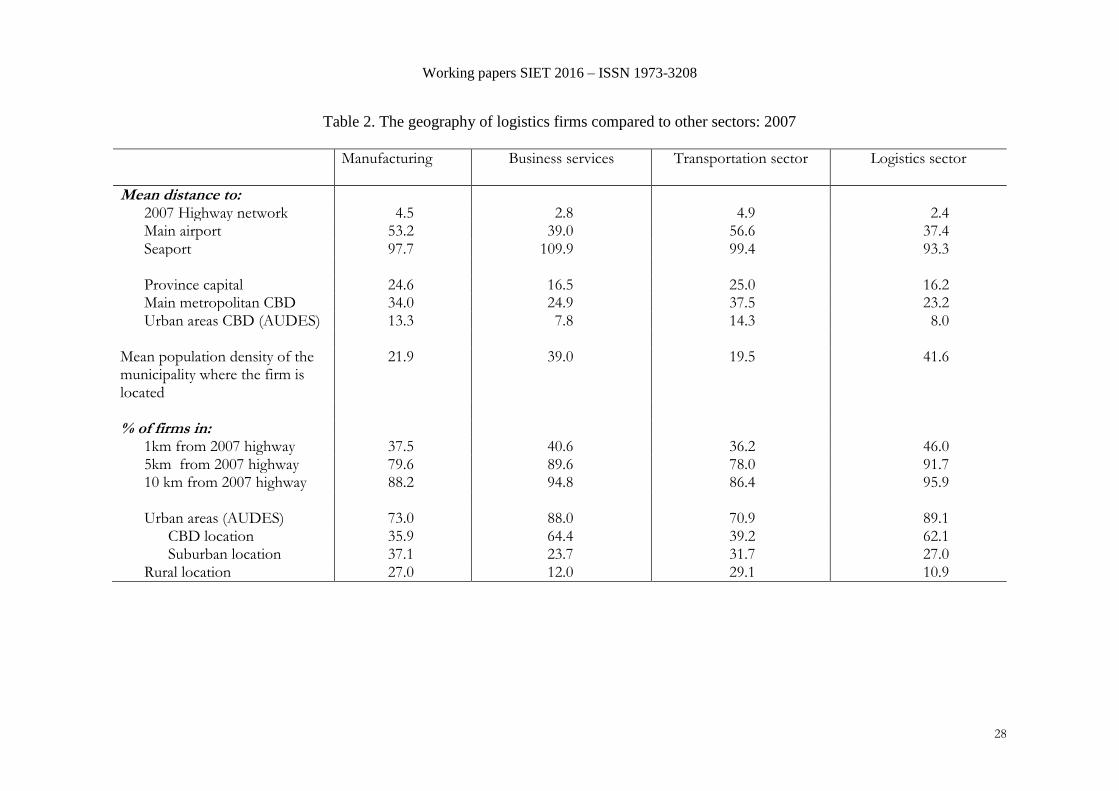
Table 2. The geography of logistics firms compared to other sectors: 2007
Manufacturing Business services Transportation sector
Logistics sector
Mean distance to: 2007 Highway network 4.5 2.8 4.9 2.4 Main airport 53.2 39.0 56.6 37.4 Seaport 97.7 109.9 99.4 93.3 Province capital 24.6 16.5 25.0 16.2 Main metropolitan CBD 34.0 24.9 37.5 23.2 Urban areas CBD (AUDES) 13.3 7.8 14.3 8.0
Mean population density of the municipality where the firm is located
21.9 39.0 19.5 41.6
% of firms in:
1km from 2007 highway 37.5 40.6 36.2 46.0 5km from 2007 highway 79.6 89.6 78.0 91.7 10 km from 2007 highway 88.2 94.8 86.4 95.9 Urban areas (AUDES) 73.0 88.0 70.9 89.1
CBD location 35.9 64.4 39.2 62.1 Suburban location 37.1 23.7 31.7 27.0
Rural location 27.0 12.0 29.1 10.9
Working papers SIET 2016 – ISSN 1973-3208
28
Table 3. Characteristics of rural municipalities with and without new logistics firm location between 2002-2007.
Rural municipalities without logistics firms
Rural municipalities with logistics firms t-test of means
difference sig. Market potential index 13.8 14.8 -5.28 ***
Highway distance 26.7 15.7 7.81 ***
Airport distance 118.4 83.2 9.87 ***
Seaport distance 153.7 102.8 9.18 ***
Population 1206.6 9057.7 -42.15 ***
Population density 28.8 131.3 -14.10 ***
Manufacturing employment 82.4 731.8 -34.45 ***
Distance to urban CBD municipality 41.1 34.3 5.41 ***
Distance to Madrid 26.0 33.0 -9.13 ***
Distance to Barcelona 48.9 52.7 -2.88 ***
Note: *** significant at the 1% level; ** significant at the 5% level; *significant at the 10% level. All characteristics refer to the year 2001.
Working papers SIET 2016 – ISSN 1973-3208
28
In Table 2 we show the location pattern of the logistics sector to those of other sectors.
Namely, we compare the logistics sector to manufacturing firms, business service firms
and transport operators. First, we look at the mean distances of these firms in relation to
the transportation networks. Logistics firms are on average located closer to each of the
transportation infrastructure analyzed. Logistics firms locate closer to highways, airports
and seaports than firms in other sectors. Looking at the percentage of firms that locates
in a distance of 1, 5, and 10 kilometres from a highway, we can also see that logistics
firms are strongly attracted to the highway network. More than 95% of our logistics firms
are located within 10km of a highway and nearly half of our logistics firms are within 1
kilometre of a highway. Other sectors are also attracted to the highway network, but this
attraction is particularly strong for logistics firms.
The logistics sector is also a typical urbanized sector. Looking at the mean population
density of the municipality where the firm is located, one can observe that logistics firms
are on average in municipalities with higher population density; even more than business
service firms. About 89% of logistics firms are located in urban areas and only 11 % in
rural areas. The logistics sector is considerably more urbanized than the manufacturing
sector or the transportation sector in general.
Nevertheless, as shown in Figure 3 (in Appendix), this pattern has changed considerably
over the last decades. Figure 3 plots the share of rural, suburban and CBD logistics firms
according to their year of establishments. Logistics firms that had been established before
1982 showed a much stronger tendency to locate in CBD municipalities. 80% of them
located in CBD municipalities, about 17% in suburban areas, and only 3% in rural areas.
Over time, the percentage of CBD location has been falling to about 50%, while the
percentage of logistics firms that located in suburban and rural municipalities has been
increasing to 30 and 14.5% respectively. We also observe that since the 1980’s, the
average distance of new logistics establishments to the CBD of their closest urban area
more than doubled with an increase from 4.8 kilometres to 10.4 kilometres. This shows
that new logistics firms have located increasingly in suburban and extra-urban locations.
Even though the percentage of logistics firms locating in extra-urban locations is still
relatively low, it is interesting to ask which type of logistics firms has located in rural
areas and which type of rural municipalities has been able to attract logistics firms.
Comparing the mean age of logistics firms in rural versus urban areas we observe that the
mean age is considerably lower with 8.5 years compared to 12 years for urban logistics
firms. This difference is much more pronounced than in other sectors. For example, in
manufacturing, the difference is only 0.7 years, in the business service sector and in the
transportation sector; in general the difference is about 1 year. We also observe that it is
mainly logistics firms in warehousing and storage, related to land transportation, cargo
handling and other transportation support activities that have located in rural areas. In
contrast, logistics firms related to air and water transportation show a lower probability
to locate in rural areas. Table 3 compares the characteristics of rural municipalities that
have not received any new logistics firm in the period 2002-2007 to those rural
municipalities that have received new logistics firms. First, we start with our accessibility
variables. Rural municipalities that have received logistics firms have higher market
potential and are significantly closer to highways, airports and seaports. They are also
considerably larger in terms of population and manufacturing employment and have a
much higher population density. In this sense, they are the least “rural” ones. They are
Working papers SIET 2016 – ISSN 1973-3208
28
furthermore closer to urban areas than rural municipalities that have not received any new
logistics firms. However, they are at further distance from the two big metropolitan areas
Madrid and Barcelona. This could indicate a certain shadow effect of these metropolitan
areas.
4.2. Modelling the location determinants of logistics firms
Next, we investigate the location determinants of new logistics firms with a focus on
accessibility and access to transportation infrastructure and urban structure. Here we
analyze the location behaviour of new logistics firms that have been created between
2002-2007 (both years inclusive). Firm location is not a random process, but the result of
profit maximizing location decisions, where the location decision is based on the future
profits that a firm expects to earn in that location.
This profit-maximizing framework leads to McFadden’s (1974) random profit
maximization-based conditional logit model. However, the implementation of the
conditional logit model faces several problems in cases like ours where we have a very
large set of spatial alternatives. Alternatively, one can adopt a count data modelling
approach. In this case, the dependent variable is the count of new logistics firms that have
been established in a municipality. Count data can be approximated by a Poisson
distribution. More specifically, under certain condition a Poisson model will yield
identical results as the conditional logit model (Guimarães et al., 2003; Schmidheiny and
Brülhart, 2011).
We follow the count data approach and our estimating equation can be expressed as
follows:
jji xfn 200120072002 (2)
where nj2002-2007 is the count of new logistics firms located in municipality j in our
study period. xj2001 is a vector of municipality characteristics referring to the year before
the start of our analysis. j is a random error term. The independent variables include in
xj2001 are municipality characteristics that can be expected to affect the profits of
logistics firms. Our focus lies on the role of our accessibility variables describe before.
Furthermore, we include a number of variables to characterize the urban structure of
municipalities. In addition, we include a set of control variables that can be classified in
two groups: socio-economic controls and physical geography controls. Socio-economic
controls reflect business conditions in the municipality and include base year municipality
population and manufacturing employment together with the percentage of occupied
population to indicate the size of the local market. We also account for education by
including the percentage of graduates in the base year as a proxy of the qualification of
the workforce and we include previous population growth. As for physical geography
controls, we include in our analysis the municipality latitude and longitude, land area and
altitude and the distance from the each municipality to the nearest coast.
One of the key characteristics of our data is that it is strongly over dispersed as already
indicated in Table 1. Table 3 shows that the distribution of new logistics firms created in
the period 2002-2007 is even more spatially concentrated in a relatively small number of
locations. Indeed, the mean number of new logistics firms per municipality in our study
Working papers SIET 2016 – ISSN 1973-3208
28
period is 0.3, while the standard deviation is 3.9. Only 697 municipalities have received
a new logistics firm over the period analyzed. Moreover, 30 municipalities concentrate
about 95% of all new logistics firm locations. Only two municipalities – Madrid and
Barcelona – show over 100 newly created logistics firms over this period. Together they
account for about 43% of new logistics firms created in the 2002-2007 period.
In the Poisson model the mean and the variance are constrained to be equal. In our data,
this assumption is however violated due to over-dispersion. The negative binomial model
relaxes this restriction. In order to further test if the number of zeroes is in excess of what
would be expected from a negative binomial model, we also run a zero-inflated negative
binomial model and test whether it better predicts our dependent variable than a standard
negative binomial model. The zero outcome of logistics location can arise from two
underlying responses. Some municipalities may never attract a logistics firm and the
outcome will always be zero. One could think about remote rural areas or mountainous
municipalities, which would not even be considered by logistics firms in their location
choice process. If the municipality has, however, some attraction potential, we could still
observe a zero outcome in the period considered, but the municipality could have attracted
logistics firms in different periods. A zero-inflated model allows distinguishing between
these two processes. First, a logit model is generated for the “certain” zero cases,
predicting whether a municipality would be in this group. Here we include as additional
inflation variable the stock of logistics firms in 2001. Then, a negative binomial model
is generated predicting the counts of new logistics firms for those municipalities that are
not “certain” zeros. To test for the choice between the negative binomial and the zero-
inflated negative binomial we use Vuong’s (1989) likelihood ratio test for non-nested
models. 4
4.3. Estimation results
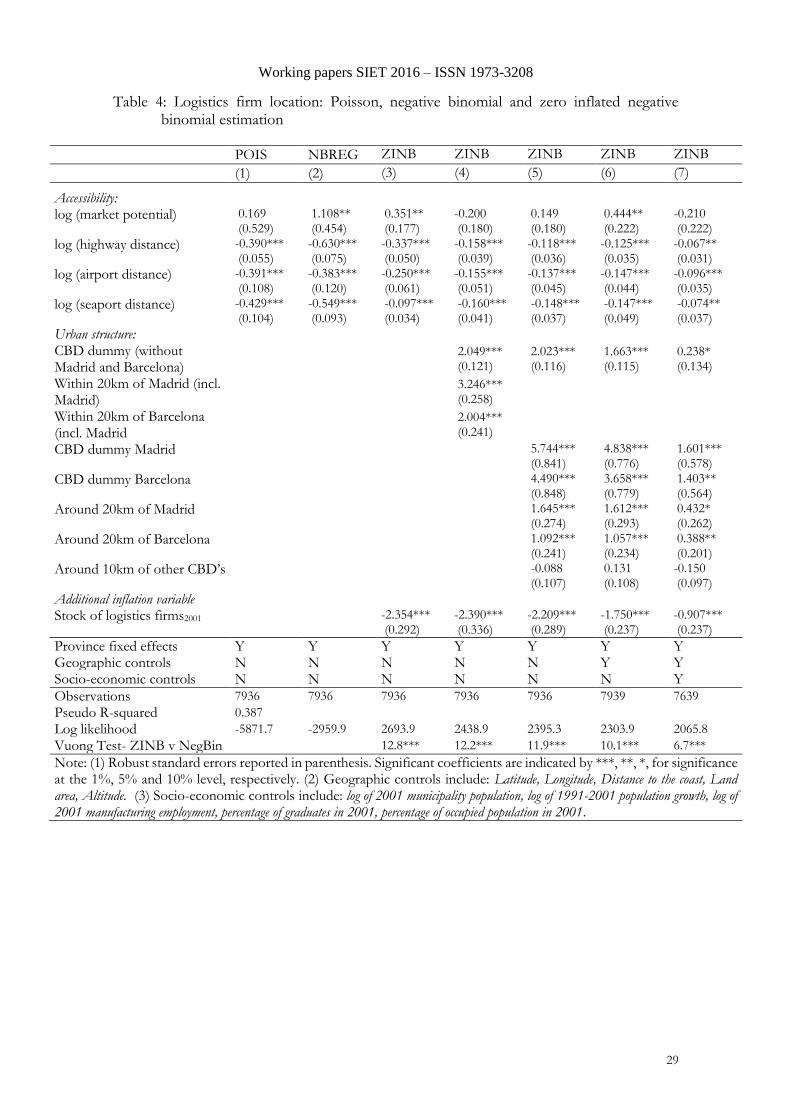
Table 4 shows our estimation results. We first present in column 1 the results from the
estimation of the Poisson (POIS) model. However, we cannot maintain the null
hypothesis of equi-dispersion and therefore proceed with the estimation of the negative
binomial (NBREG) model (column 2). Columns 3 to 7 show the results from the zero-
inflated negative binomial model (ZINB). The Vuong test compares the zero-inflated
negative binomial model to a standard negative binomial model. Since the z-value is
significant in all our specifications, the Vuong test shows that the zero-inflated negative
binomial provides a better fit than the standard negative binomial. We therefore base our
discussion of how accessibility and urban structure affect logistics firm location on the
results of the different specification of the ZINB model.
In column 3 we only include our accessibility variables. Province fixed effects are
included as control. Market potential shows the expected positive effect and the distances
to the nearest highway, airport and seaport are all statistically significant and negative
indicating that logistics firms prefer locating close to transportation infrastructure.
In column 4 we add variables characterizing the urban structure. Specifically we include
a dummy for CBD municipalities (excluding Madrid and Barcelona) and two dummies
for municipalities that are within a distance of 20km from Madrid and Barcelona,
respectively. These dummies are highly significant and positive. Despite a certain
4 We have also tried to estimate hurdle models, however, we were unable to achieve convergence in these models.
Working papers SIET 2016 – ISSN 1973-3208
28
tendency of logistics firms to locate increasingly also in rural areas, urban areas are still
the main attractions for logistics firms. Conditional on the urban characteristics of the
location, access to transportation infrastructure remains statistically significant. However,
market potential is no longer significant once the urban structure is controlled for. This
might be due to certain correlation between market potential and urbanity. In column 5
we experiment with a slightly different characterization of urban structure. We include
three separate dummies for CBD municipalities: one for Madrid, one for Barcelona and
one for the remaining CBD municipalities and we add dummies for suburban areas. In
the case of Madrid and Barcelona we add dummies for municipalities that fall into a
distance of 20 kilometres. In the case of the remaining urban areas – which are all
considerably smaller - we allow for a influence area of 10 kilometres. These results
confirm the strong attraction of logistics firm to the Madrid and Barcelona area. The
dummy variable for other CBD municipalities remains significant but their surrounding
areas have not shown a higher probability of attracting logistics firms than rural areas,
which are the comparison group. Results regarding our accessibility variables remain
virtually unchanged. In column 6 we add our geographic controls to the estimation.
Results remain very similar. Only the market potential variable gains now again
significance. However, once we also add socio-economic controls in column 7 this
significance of the market potential variable is again lost. All other results are robust to
the inclusion of geographic and socio-economic controls. The ambiguous findings
regarding market potential are most likely because market potential is highest in the large
urban and metropolitan areas, which is captured in part by our urban structure dummies,
and market potential is correlated with our socio-economic controls. Nevertheless,
including our detailed geographic and socio-economic controls reduces potential
endogeneity problems. For example, transportation infrastructure is likely to be placed in
areas of high economic activity which is controlled for by our socio-economic base year
controls. High economic activity in an area in turn will also be an attraction factor for
logistics firms.
Our results indicate a clear role of transportation infrastructure as determinant of logistics
firm location. Since logistics is about managing the supply chains from raw materials to
the final product and service delivery, and this is expected to happen at ever-faster speed,
the logistics sector is reliant on good access to fast and efficient transportation
infrastructure.
Working papers SIET 2016 – ISSN 1973-3208
29
Table 4: Logistics firm location: Poisson, negative binomial and zero inflated negative binomial estimation
POIS NBREG ZINB ZINB ZINB ZINB ZINB
(1) (2) (3) (4) (5) (6) (7)
Accessibility:
log (market potential) 0.169 (0.529)
1.108** (0.454)
0.351** (0.177)
-0.200 (0.180)
0.149 (0.180)
0.444** (0.222)
-0.210 (0.222)
log (highway distance) -0.390*** (0.055)
-0.630*** (0.075)
-0.337*** (0.050)
-0.158*** (0.039)
-0.118*** (0.036)
-0.125*** (0.035)
-0.067** (0.031)
log (airport distance) -0.391*** (0.108)
-0.383*** (0.120)
-0.250*** (0.061)
-0.155*** (0.051)
-0.137*** (0.045)
-0.147*** (0.044)
-0.096*** (0.035)
log (seaport distance) -0.429*** (0.104)
-0.549*** (0.093)
-0.097*** (0.034)
-0.160*** (0.041)
-0.148*** (0.037)
-0.147*** (0.049)
-0.074** (0.037)
Urban structure:
CBD dummy (without Madrid and Barcelona)
2.049*** (0.121)
2.023*** (0.116)
1.663*** (0.115)
0.238* (0.134)
Within 20km of Madrid (incl. Madrid)
3.246*** (0.258)
Within 20km of Barcelona (incl. Madrid
2.004*** (0.241)
CBD dummy Madrid
5.744*** (0.841)
4.838*** (0.776)
1.601*** (0.578)
CBD dummy Barcelona
4.490*** (0.848)
3.658*** (0.779)
1.403** (0.564)
Around 20km of Madrid
1.645*** (0.274)
1.612*** (0.293)
0.432* (0.262)
Around 20km of Barcelona
1.092*** (0.241)
1.057*** (0.234)
0.388** (0.201)
Around 10km of other CBD’s
-0.088 (0.107)
0.131 (0.108)
-0.150 (0.097)
Additional inflation variable
Stock of logistics firms2001 -2.354*** (0.292)
-2.390*** (0.336)
-2.209*** (0.289)
-1.750*** (0.237)
-0.907*** (0.237)
Province fixed effects Y Y Y Y Y Y Y Geographic controls N N N N N Y Y Socio-economic controls N N N N N N Y Observations 7936 7936 7936 7936 7936 7939 7639
Pseudo R-squared 0.387
Log likelihood -5871.7 -2959.9 2693.9 2438.9 2395.3 2303.9 2065.8
Vuong Test- ZINB v NegBin 12.8*** 12.2*** 11.9*** 10.1*** 6.7***
Note: (1) Robust standard errors reported in parenthesis. Significant coefficients are indicated by ***, **, *, for significance at the 1%, 5% and 10% level, respectively. (2) Geographic controls include: Latitude, Longitude, Distance to the coast, Land area, Altitude. (3) Socio-economic controls include: log of 2001 municipality population, log of 1991-2001 population growth, log of 2001 manufacturing employment, percentage of graduates in 2001, percentage of occupied population in 2001.
Working papers SIET 2016 – ISSN 1973-3208
29
5. Conclusion
The literature on firm location has mainly concerned the manufacturing industry, and
recently the service sector, while little evidence has yet been provided on the logistics
sector. The few studies on the topic refer mainly to logistics sprawl of warehousing
activities at the regional/metropolitan level and to the location determinants of transport
and logistics FDIs in China and Italy.
However, in the globalized world, where the demand for “logistics floor space” is
expected to grow substantially, understanding the location decisions of logistics firms is
important for society. Besides, it cannot be denied the positive contribution of logistics to
global economic growth as well as of ICT and logistics to the global production
efficiency.
Within this context, the present paper contributes to the literature empirically by
investigating the geography of logistics firms and the role played by accessibility using
geo-referenced firm level data along with detailed information on transport infrastructure
for the whole of Spain. To reach this goal, a spatial analysis together with a count data
modelling approach has been adopted. The spatial analysis refereed to the year 2007 and
confirmed a strong concentration of logistics firms in the main urban areas – with Madrid
and Barcelona hosting one third of the establishments –, in major cities and along major
transportation corridors, with a preference for the highway network. Besides, if compared
to the manufacturing, business and transport sectors, logistics firms are more urbanized.
However, this trend started decreasing since the 1980s in favour of suburban and extra-
urban locations. Specifically, rural areas with good accessibility, higher market potential,
and higher proximity to urban areas began to attract warehousing, storage, cargo handling
operations, and other transport support activities.
The results of the spatial analysis are corroborated by the count data modelling approach
focusing on the new logistics firms that have been created in the period 2002-2007.
Access to transportation infrastructure and proximity to urban areas (especially Madrid
and Barcelona) are important location determinants for logistics firms, thus confirming
the attitude of this sector, which is market oriented, to be located in or close to urban
areas. Our results confirm that transportation accessibility is crucial for the emergence of
logistics clusters.
Nevertheless, as suggested by the literature, logistics sprawl is occurring too: these firms
are increasingly privileging suburban locations and, to some extent, rural locations with
good accessibility to the detriment of central cities, likely due to their lower factor prices
and land availability. These results are meaningful for policymakers: the location of
logistics activities raises land consumption, contributes to urban sprawl, and is a generator
of negative external costs for the community. Besides, it shapes the demand for freight
transport and deeply influences the feasibility of a shift of freight transport towards more
sustainable modes of transport (European Commission, 2011).
Further research might investigate whether government policies might have played a role
in accommodating new logistics firms in Spain, and how and to what extent tailored
planning policies might reduce land consumption sprawl as well as the collective costs.
Besides, an analysis of the new established firms in other sectors (i.e. manufacturing,
retail, business) in the period of analysis (2002-2007) might help improving further our
Working papers SIET 2016 – ISSN 1973-3208
29
understanding of whether and how the logistics’ location behaviour differs from the other
sectors’ location behaviour. Investigating the relationship between location dynamics and
logistics firms’ heterogeneity (domestic vs. foreign owned firms) might also provide
useful information to government policy makers in predicting future location patterns. In
the case of FDIs, for instance, appropriate public policies might be designed to influence
their future location decisions.
A final note of caution must be added. We cannot be completely sure that the relationships
that we have observed in our analysis between logistics firm location and our accessibility
measures are causal. More research still needs to be done in this field to address remaining
concerns regarding the endogeneity in infrastructure placement and thus the potential for
reverse causality between accessibility and logistics location.
References
Allen, J., and Browne, M. (2010) Considering the relationship between freight transport
and urban form. Green Logistics Report:
http://www.greenlogistics.org/themesandoutputs/wm9/downloads/Freight%20transpor
t%20and%20urban%20form%20Final%20September%202010.pdf.
Arndt, S.W., and Kierzhowsky, H. (2001) Fragmentation. New Production Patterns in the
World Economy. Oxford: Oxford University Press.
Arnold, J., Arvis, J. F., and Mustra, M.A. (2010) Trade and Transport Facilitation
Assessment: A Practical Toolkit to Improve the Trade Logistics and Competitiveness
of Countries, Herndon, VA, USA: World Bank Publications.
Arvis, J. F. Mustra M.A., Panzer J., Ojala L., Naula T. (2007) Connecting to compete:
trade logistics in the global economy, Washington: The World Bank. International
Trade Department, Washington DC.
Bonacich, E. and Wilson, J.B. (2008) Getting the Goods: Ports, Labor, and the Logistics
Revolution, Ithaca, NY, USA: Cornell University Press. p 241.
Boscacci F., Maggi E., Mariotti I. (2009) Le determinanti localizzative delle imprese
logistiche a capitale estero presenti in Italia. In Marletto G., Musso E. (a cura di),
Trasporti, ambiente e Territorio. La ricerca di un nuovo equilibrio, Franco Angeli,
Milano, pp. 267-275.
Bowen J.T. (2008) Moving places: the geography of warehousing in the US, Journal of
Transport Geography 16: 379-387.
Brouwer A., Holl A., Mariotti I. (2013) What drives logistics employment growth? An
empirical investigation in the EU. In Bergantino A.S., Carlucci F., Cirà A., Marcucci
E., Musso E. (a cura di), I sistemi di trasporto nell’area del Mediterraneo: infrastrutture
e competitività, Franco Angeli, Milan, pp. 138-148.
Casson M. (1994) Why are firms hierarchical?, Journal of the Economics of Business, 1,
1: 47-76.
Coto-Millàn P., Fernandez X.L., Pesquera M.A., Agueros M. (2015) Impact of logistics
on technical efficiency of world production (2007-2012), Netw Spat Econ , DOI
10.1007/s11067-015-9306-6, pp.1.15
Working papers SIET 2016 – ISSN 1973-3208
29
Dablanc, L. S. Ogilvie, A. Goodchild (2014) Logistics Sprawl: Differential Warehousing
Development Patterns in Los Angeles and Seattle, Transportation Research Board,
2410: 105–112.
Dablanc L., Ross C. (2012) Atlanta: A Mega Logistics Center in the Piedmont Atlantic
Megaregion (PAM). Journal of Transport Geography, 24, pp.432–442.
Daniels, P.W. (1985). Service Industries: A Geographical Appraisal. Methuen & Co, New
York.
European Commission (2011) Roadmap to a single European transport area – Towards a
competitive and resource efficient transport system. White Paper, including the Impact
Assessment, Brussells.
Ferrari C., Parola F., Tei A. (2011) Northern Africa and International Trade Networks:
Port Investments and Market Opportunities. In: T. NOTTEBOOM. Current Issues in
Shipping, Ports and Logistics. University Press Antwerp, ANTWERP: pp. 203-220.
Glaeser, E.L. and Kohlhase, J.E. (2004) Cities, regions and the decline of transport costs.
Papers in Regional Science 83: 197–228.
Groot H.L.F. (2001) Macroeconomic consequences of outsourcing: an analysis of growth,
welfare and product variety, De Economist, 149 (1): 53-79.
Guimarães, P., Figueiredo, O., Woodward, D.P. (2003) A Tractable Approach to the Firm
Location Decision Problem, Review of Economics and Statistics 85 (1): 201-204.
Harris, C.D. (1954) The market as a factor in the localization of industry in the United
States, Annals of the Association of American Geographers 44(4), 315-348.
Head K., Mayer T. (2004) Market Potential and the Location of Japanese Investment in
the European Union, The Review of Economics and Statistics, MIT Press, vol. 86(4):
959-972.
Head K. and Ries J. (1996) Inter-city competition for foreign investment: static and
dynamic effects of China’s incentive areas, Journal of Urban Economics 40: 38–60.
Helg, R. and Tajoli, L. (2005) Patterns of international fragmentation of production and
the relative demand for labor, North American Journal of Economics and Finance 16:
233-254.
Hesse M. (2004) Land for logistics: locational dynamics, real estate markets and political
regulation of regional distribution complexes, Tijdschrift voor Economische en Sociale
Geographie 95(2): 162-173.
Hesse M., Rodrigue J.P. (2004) The transport geography of logistics and freight
distribution, Journal of Transport Geography 12: 171-184.
Hofstede G. (1980), Culture's Consequences: International Differences in Work-Related
Values, Beverly Hills CA: Sage Publications.
Holl, A. (2004) Manufacturing location and impacts of road transport infrastructure:
Empirical evidence from Spain, Regional Science and Urban Economics 34 (3): 341-
363.
Holl, A. (2016) Highways and productivity in manufacturing firms, Journal of Urban
Economics 93: 131-151.
Hong J. (2007) Transport and location of foreign logistics firms: the Chinese experience,
Transportation Research Part A, 41: 597-609.
Hong J. (2010), Firm-specific effects on location decisions of foreign direct investments
in China’s logistics industry, Regional Studies, 41.5: 673-683.
Hong J.J. & Chin A. (2007) Modeling the location choices of foreign investments in
Chinese logistics industry, China Economic Review, 18: 425-437.
Working papers SIET 2016 – ISSN 1973-3208
29
Hummels D., (1999) Have International Transportation Costs Declined? Department of
Economics Working Paper, Purdue University, (USA).
Lai, Kee-hung and Cheng, T.C.E. (2009) ‘Just-in-Time Logistics’, Abingdon, Oxon,
GBR: Ashgate Publishing Group.
Levinson M. (2006) The Box: How the Shipping Container Made the World Smaller and
the World Economy Bigger. Princeton University Press.
Jing, N., Cai, W. (2010) Analysis on the spatial distribution of logistics industry in the
Maggi E. and Mariotti I. (2012) Globalisation and the rise of logistics FDI: the case of
Italy, in DeSare T., Caprioglio D., eds., Foreign Investment: Types, Methods and
Impacts, Nova Science Publishers, pp.29-60.
Mariotti S. and Piscitello L. (1995) Information Costs and Location of FDIs within the
Host Country: empirical evidence from Italy, Journal of International Business Studies,
fourth quarter, 815-841.
Mariotti I. (2015) Transport and logistics in a globalizing world. A focus on Italy,
Springer, Heidelberg-New York.
Mariotti I., Maltese I., Boscacci F. (2012) Location choice of inward logistics FDI in
Italy, in Campagna M., De Montis A., Isola F., Lai S., Pira C., Zoppi C. (eds.) (2012),
Planning Support Tools: Policy Analysis, Implementation and Evaluation,
FrancoAngeli, Milano, pp. 1695-1708.
Markusen, J.R., Rutherford, T., and Tarr, D.G. (2005) Trade and Direct Investment in
Producer Services and the Domestic Market for Expertise. Canadian Journal of
Economics, 38(3):758-777.
McCann P. (2008), Globalisation and economic geography: the world is curved, not flat,
Cambridge Journal of Regions, Economy and society, 1: 351-370.
McFadden, D. (1974) Conditional logit analysis of qualitative choice behaviour. In:
Zarembka, P. (Ed.), Frontiers in econometrics. Academic Press, New York.
McKinnon, A. (1988) Physical Distribution. In: Marshall, J.N. (Ed.), Services and
Uneven Development. Oxford University Press, Oxford, pp. 133–159.
McKinnon A. (2009) Logistics and land: the changing land use requirements of logistical
activity. Paper presented at the 14th Annual Logistics Research Network Conference,
9th-11th September, Cardiff, UK.
Mori T., Nishikimi K. (2002) Economies of transport density and industrial
agglomeration, Regional Science and Urban Economics 32: 167-200.
Notteboom, T. (2007) Strategic challenges to container ports in a changing market
environment. Devolution, Port Governance and Port Performance Research in
Transportation Economics 17: 29–52.
Notteboom T., Rodrigue J.P. (2009) The Geography of Containerization: Half a Century
of Revolution, Adaptation and Diffusion, Geojournal, vol. 74 (1): 1-5.
O’Connor K. (2010), Global city regions and the location of logistics activity, Journal of
Transport Geography, 18 (3): 354-362.
Oum T.H. and Park J.H. (2004) Multinational firms’ location preference for regional
distribution centers: focus on the North-east Asian region, Transportation Research Part
E, 40: 101-121.
Radner R.( 1992) Hierarchy: The economics of managing, Journal of Economic
Literature, 30 (3): 1382-1415.
Reggiani A. (1998) Accessibility, trade and location behaviour: an introduction. In
Reggiani A. (ed) Accessibility, trade and location behaviour. Ashagate, Aldershot, pp
1-16
Working papers SIET 2016 – ISSN 1973-3208
29
Rietveld,P. and F. Bruinsma (1998) Is transport infrastructure effective?: transport
infrastructure and accessibility: impacts on the space economy. Advances in Spatial
Science, Springer, Berlin.
Ruiz, F. (2010) Áreas Urbanas de España. Proyecto AUDES. Universidad de Castilla-La
Mancha. http://alarcos.esi.uclm.es/per/fruiz/audes/.
Schmidheiny, K. and Brulhart, M. (2011) On the equivalence of location choice models:
Conditional logit, nested logit and Poisson, Journal of Urban Economics 69(2): 214-
222.
Sivitadinou, R. (1996) Warehouse and distribution facilities and community attributes:
an empirical study. Environment and Planning A, 28: 1261-1278.
Vahrenkamp R. (2010). Driving globalization: the rise of logistics in Europe 1950-2000.
European Transport, n.45: 1-14.
Van Den Heuvel F.P., De Langen P.W., Van Donselaar K.H., Fransoo J.C. (2013) Spatial
concentration and location dynamics in logistics: the case of a Dutch province, Journal
of Transportation Geography 28: 39-48.
Van Veen-Groot D.B. and Nijkamp P. (1999) Globalisation, transport and the
environment: new perspectives for ecological economics. Ecological Economics 31:
331-346.
Verhetsel, A., R. Kessels, P. Goos, T. Zijlstra, N. Blomme, J. Cant (2015) Location of
logistics companies: a stated preference study to disentangle the impact of accessibility,
Journal of Transport Geography 42: 110-121.
Vuong, Q. H. (1989) Likelihood ratio tests for model selection and non-nested
hypotheses, Econometrica 57: 307-333.
Wood, D. F., Barone, A., and Murphy, P. (2002) ‘International Logistics’, Saranac Lake,
NY, USA: AMACOM Books. p 412.
Xiushan J, Lei Z, Chenfeng X, Ruijun W (2015) Transportation and regional economic
development: analysis of spatial spillovers in China provincial regions. Netw Spat
Econ. Doi: 10.1007/s11067-015-9298-2
Acknowledgements
This research has benefitted from financial support from the Fundación BBVA (I
Convocatoria de Ayudas Fundación BBVA a Investigadores, Innovadores y Creadores
Culturales). An earlier version of this study was presented at the ERSA 2015 congress in
Lisbon, at the URSI seminar at the University of Groningen in 2015, and at the SIET 2016
conference in Genoa. We thank these audiences.
Working papers SIET 2016 – ISSN 1973-3208
29
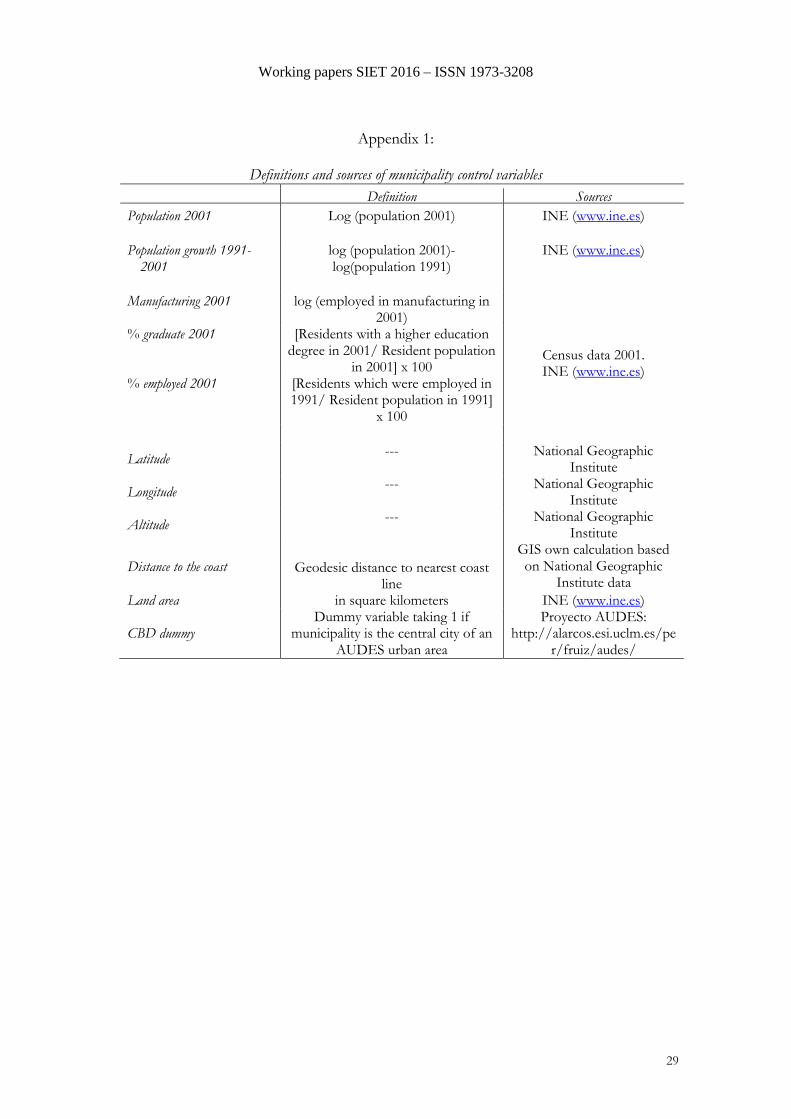
Appendix 1:
Definitions and sources of municipality control variables
Definition Sources Population 2001
Log (population 2001) INE (www.ine.es)
Population growth 1991-2001
log (population 2001)-log(population 1991)
INE (www.ine.es)
Manufacturing 2001 log (employed in manufacturing in 2001)
Census data 2001. INE (www.ine.es)
% graduate 2001
[Residents with a higher education degree in 2001/ Resident population
in 2001] x 100 % employed 2001
[Residents which were employed in 1991/ Resident population in 1991]
x 100
Latitude --- National Geographic
Institute
Longitude --- National Geographic
Institute
Altitude --- National Geographic
Institute
Distance to the coast
Geodesic distance to nearest coast line
GIS own calculation based on National Geographic
Institute data Land area in square kilometers INE (www.ine.es)
CBD dummy Dummy variable taking 1 if
municipality is the central city of an AUDES urban area
Proyecto AUDES: http://alarcos.esi.uclm.es/pe
r/fruiz/audes/
Working papers SIET 2016 – ISSN 1973-3208
22
Figure 1. Location of logistics firms in mainland Spain in 2007

Working papers SIET 2016 – ISSN 1973-3208
23
Figure 2. Location of logistics firms in Madrid and Barcelona in 2007
Madrid: Barcelona: