the geographic variation in the cost of the opioid crisis · the opioid crisis. all three...
TRANSCRIPT
The Geographic Variation in the Cost of the
Opioid Crisis
The Geographic Variation in the Cost of the Opioid Crisis
Alex Brill and Scott Ganz1
March 20, 2018
Abstract
As the opioid epidemic worsens in the United States, the toll it imposes on the US economy has risen to staggering heights. The White House Council of Economic Advisers recently estimated the economic burden, inclusive of the value of statistical lives lost, to be $504 billion in 2015. More narrowly constructed estimates find cost burdens as high as $95 billion in 2016.
We estimate per-capita state-level and county-level non-mortality and total economic burdens of the opioid crisis in 2015 by distributing national estimates based on variation in local wages, health care costs, and criminal justice costs along with variation in opioid-related death and addiction rates, and average age-adjusted value of statistical lives lost. Our findings indicate that among the lower 48 states in 2015, per-capita non-mortality costs were highest in the District of Columbia ($493) and New Hampshire ($360). Median per-capita non-mortality costs were $205 in Kentucky and Pennsylvania. Per-capita total costs (including mortality costs) were highest in West Virginia ($4,378) and the District of Columbia ($3,657). Median per-capita total costs were $1,672 in Nevada.
1 Alex Brill ([email protected]) is a resident fellow at AEI. Scott Ganz ([email protected]) is an assistant professor of public policy at the Georgia Institute of Technology and an adjunct scholar at AEI. The authors thank Benedic Ippolito, Sally Satel, and Alan Viard for helpful comments and suggestions.
1
I. Introduction
Opioid abuse is an epidemic in the United States, claiming more than 42,000 lives in 2016 alone (CDC 2017c). In addition to its devastating impact on families and communities, the opioid epidemic is costing the US economy tens of billions, if not hundreds of billions, of dollars annually. The types of costs attributable to opioid abuse – health care costs, criminal justice costs, and lost productivity, for example – are fairly well understood, as is the economic impact of the crisis at the national level. However, the economic burden of the opioid epidemic is unevenly distributed across the country, with many communities especially hard hit. As federal, state, and local policymakers and stakeholders seek to curb the epidemic, it is vitally important that they know how these costs are distributed.
In this paper, we estimate the spatial distribution of the economic burden of the opioid crisis in the United States. After discussing the scope of the problem and reviewing the existing literature on the costs of the opioid crisis, we present results from an original model that distributes these costs at the state and county levels.
II. Background
The Scope of the Opioid Epidemic
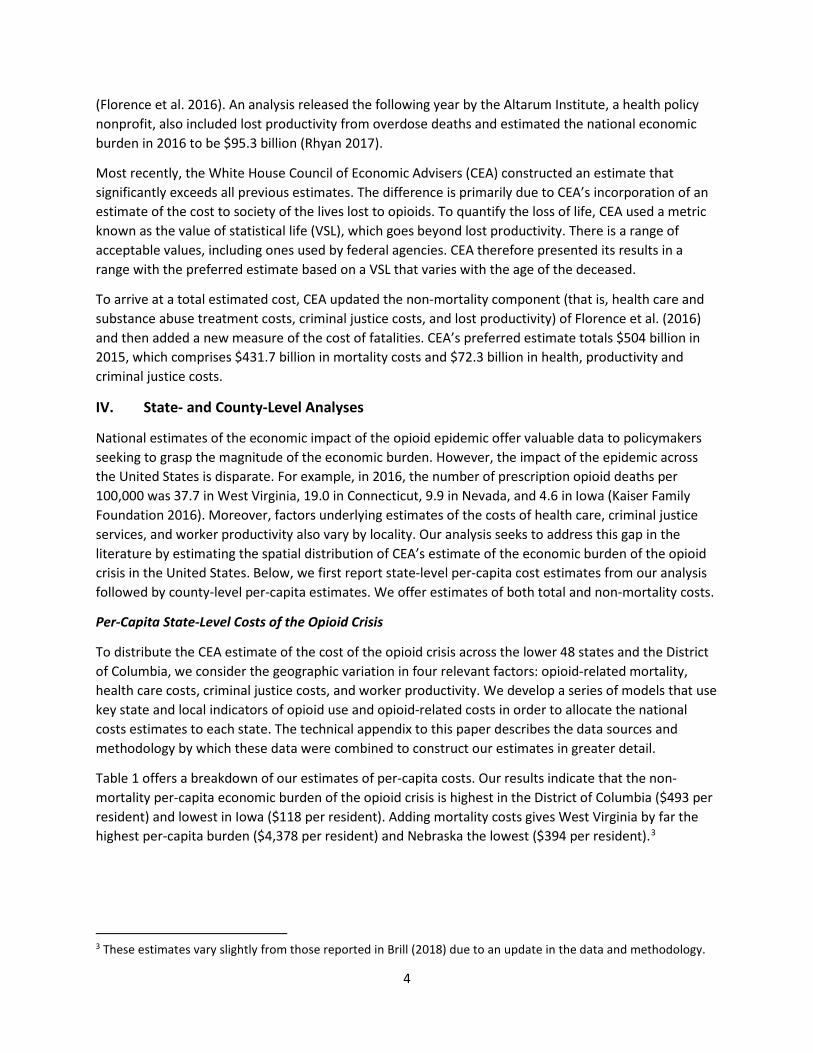
Opioids are claiming an alarming and increasing number of lives in the United States, and the epidemic has worsened drastically in recent years. The number of deaths in the United States attributable to opioids increased more than fivefold from 8,048 in 1999 to 42,249 in 2016, as illustrated in Chart 1. The National Institute on Drug Abuse (NIDA) now estimates that 115 Americans die daily from prescription opioid analgesics, heroin, and fentanyl (2018).
According to NIDA, roughly 21–29 percent of patients prescribed opioids for chronic pain misuse them (2018). Among people who misuse prescription opioids, 8–12 percent develop an opioid use disorder, and an estimated 4–6 percent who misuse prescription opioids transition to heroin (NIDA 2018). Opioid
0
15,000
30,000
45,000
1999 2000 2001 2002 2003 2004 2005 2006 2007 2008 2009 2010 2011 2012 2013 2014 2015 2016
Chart 1. US Opioid Deaths, 1999–2016
Female MaleSource: CDC WONDER and CEA. Note: 2016 gender split estimated by authors.

2
abuse imposes great hardship and pain on those suffering from addiction, their families, and their communities. The Centers for Disease Control (CDC) reports that there are more than 1,000 emergency room visits every day for patients being treated for the misuse of prescription opioids (CDC 2017a) and that emergency room overdose visits jumped 30 percent from July 2016 to September 2017 in a sample of 52 jurisdictions across 45 states (CDC 2018). On top of this is the impact on productivity, family and social interactions, and quality of life.
Some measures point to a slight slowing of the supply of prescription opioids after a period of growth. The number of prescriptions per capita increased from 2006 to 2012 but then declined through 2016 to 66.5 prescriptions per 100 persons (CDC 2017b). However, the CDC also reports that “the rapid increase in heroin deaths that began in 2011 continued through 2015.” Moreover, an increasing share of individuals who suffer from opioid addiction are initiating use with heroin. That share increased from 8.7 percent in 2005 to 33.3 percent in 2015 (Cicero et al. 2017).
Policymaker Interest in Addressing the Crisis
The opioid epidemic is beginning to get the national attention it deserves, as federal, state, and local governments and nongovernmental organizations seek solutions. For example, President Trump’s Commission on Drug Addiction and the Opioid Crisis issued its final report in November 2017 with an extensive list of policy recommendations, including additional federal funding, changes to prescribing guidelines and provider education, enhanced enforcement and increased efforts aimed at drug takebacks, improved treatment and recovery efforts, and additional resources for research and development.
Members of Congress have been investigating the causes and consequences of the opioid epidemic and exploring potential policy reforms. Earlier this year, Congress agreed to provide $6 billion over the next two year in federal funds targeted at addressing the epidemic. These funds are in addition to an opioid-related grant program to states that was established as part of the 21st Century Cures Act at the end of 2016.
At the local level, taskforces have been established from New Hampshire to Miami-Dade County to Alaska to understand the local impact and identify strategies for tackling the epidemic. Outside of government, the American Medical Association, various medical specialty groups, and researchers at universities around the country are working to evaluate and develop policy interventions, treatment options, and medical alternatives.
III. The Economic Consequences of the Opioid Crisis
While policymakers look for ways to stem the opioid epidemic, economists have been offering valuable insights on the impact of the crisis on the macroeconomy. For example, Princeton economist Alan Krueger (2017) examines the relationship between opioid prescription rates per county and the decline in labor force participation, estimating that the opioid epidemic could be responsible for 20 percent of the decline in men’s labor force participation. Goldman Sachs economists similarly concluded that the opioid epidemic is likely contributing to the decline in prime-age labor market participation (Mericle 2017). Alex Hollingsworth and Kosali Simon from the University of Indiana and Christopher Ruhm from the University of Virginia find that higher unemployment rates at the county level are associated with higher opioid death rates and increased emergency room visits (Hollingsworth, Ruhm, and Simon 2017).

3
The Federal Reserve is also examining opioid addiction’s potential impact on the availability of labor in some markets and its burden on society. These questions have been the subject of testimony by former Fed Board Chair Janet Yellen2 and the topic of discussion and investigation at the Cleveland, Boston, Richmond, and Minneapolis Federal Reserve Banks.
Estimates of the Aggregate Cost of the Opioid Crisis
Many experts have estimated the direct and indirect costs that the opioid epidemic imposes on our society. Some researchers have focused on a segment of the population or a particular type of expenditure induced by opioid abuse while others have taken a more comprehensive approach.
In 1998–2002, as widespread problems with opioid addiction were taking hold in the United States, the average difference in health care spending on a patient who abused opioids and a patient who did not abuse opioids was estimated to be $14,054 (White et al. 2005). In 2002–2003, Medicaid beneficiaries with opioid abuse or dependence were estimated to have costs $5,874 higher than those without opioid abuse or dependence; controlling for baseline characteristics increased this difference to $15,120 (McAdam-Marx et al. 2010). In 2003–2007, excess costs among those who abuse opioids compared to those who do not averaged $15,183 in Medicaid and $20,546 in private insurance (White et al. 2011). A more recent study arrived at a slightly lower estimate in the commercially insured population, finding that average annual health care spending on a person who abused opioids in 2012–2015 was $14,810 more than spending on someone who did not abuse opioids (Kirson et al. 2017).
The cost of opioid abuse is not confined to health care. Several studies have provided more comprehensive estimates that also include the workplace and criminal justice burdens attributable to the opioid crisis. All three categories of costs were estimated by health economists Howard Birnbaum and Alan White to total $8.6 billion in 2001 (Birnbaum et al. 2006). Since then, costs have continued to climb. An early 2011 analysis yielded an estimate of $53.4 billion in health care, workplace, and criminal justice costs associated with opioid abuse in 2006 (Hansen et al. 2011). Later in 2011, Birnbaum and White returned to the subject of their 2006 study and estimated that opioid costs in 2007 were $55.7 billion (Birnbaum et al. 2011). Elaborating on the increase in costs between 2001 and 2007, Birnbaum and coauthors explained:
Although differences in data and methods preclude exact comparison with previous societal estimates, it is clear that the costs of opioid abuse have increased substantially due to changes in the prevalence of opioid abuse and associated costs. Key changes include, for example, increases from 2001 to 2007 . . . in the prevalence of opioid abuse (approximately 13%), the excess cost per opioid abuse patient (47% after adjusting for inflation), the cost of substance abuse treatment (up to 48%), the proportion of substance abuse admissions attributable to opioids (138%), and total police and legal expenditures (16% and 10%, respectively). (Birnbaum et al. 2011, 662–663.)
In 2016, CDC researchers incorporated the cost of lost productivity from premature deaths due to opioid overdoses, estimating the total economic impact of the opioid epidemic to be $78.5 billion in 2013
2 See, e.g., Jeanna Smialek, “Yellen Says Opioid Use Is Tied to Declining Labor Participation,” Bloomberg, July 13, 2017, available at www.bloomberg.com/news/articles/2017-07-13/yellen-says-opioid-use-is-tied-to-declining-labor-participation.
4
(Florence et al. 2016). An analysis released the following year by the Altarum Institute, a health policy nonprofit, also included lost productivity from overdose deaths and estimated the national economic burden in 2016 to be $95.3 billion (Rhyan 2017).
Most recently, the White House Council of Economic Advisers (CEA) constructed an estimate that significantly exceeds all previous estimates. The difference is primarily due to CEA’s incorporation of an estimate of the cost to society of the lives lost to opioids. To quantify the loss of life, CEA used a metric known as the value of statistical life (VSL), which goes beyond lost productivity. There is a range of acceptable values, including ones used by federal agencies. CEA therefore presented its results in a range with the preferred estimate based on a VSL that varies with the age of the deceased.
To arrive at a total estimated cost, CEA updated the non-mortality component (that is, health care and substance abuse treatment costs, criminal justice costs, and lost productivity) of Florence et al. (2016) and then added a new measure of the cost of fatalities. CEA’s preferred estimate totals $504 billion in 2015, which comprises $431.7 billion in mortality costs and $72.3 billion in health, productivity and criminal justice costs.
IV. State- and County-Level Analyses
National estimates of the economic impact of the opioid epidemic offer valuable data to policymakers seeking to grasp the magnitude of the economic burden. However, the impact of the epidemic across the United States is disparate. For example, in 2016, the number of prescription opioid deaths per 100,000 was 37.7 in West Virginia, 19.0 in Connecticut, 9.9 in Nevada, and 4.6 in Iowa (Kaiser Family Foundation 2016). Moreover, factors underlying estimates of the costs of health care, criminal justice services, and worker productivity also vary by locality. Our analysis seeks to address this gap in the literature by estimating the spatial distribution of CEA’s estimate of the economic burden of the opioid crisis in the United States. Below, we first report state-level per-capita cost estimates from our analysis followed by county-level per-capita estimates. We offer estimates of both total and non-mortality costs.
Per-Capita State-Level Costs of the Opioid Crisis
To distribute the CEA estimate of the cost of the opioid crisis across the lower 48 states and the District of Columbia, we consider the geographic variation in four relevant factors: opioid-related mortality, health care costs, criminal justice costs, and worker productivity. We develop a series of models that use key state and local indicators of opioid use and opioid-related costs in order to allocate the national costs estimates to each state. The technical appendix to this paper describes the data sources and methodology by which these data were combined to construct our estimates in greater detail.
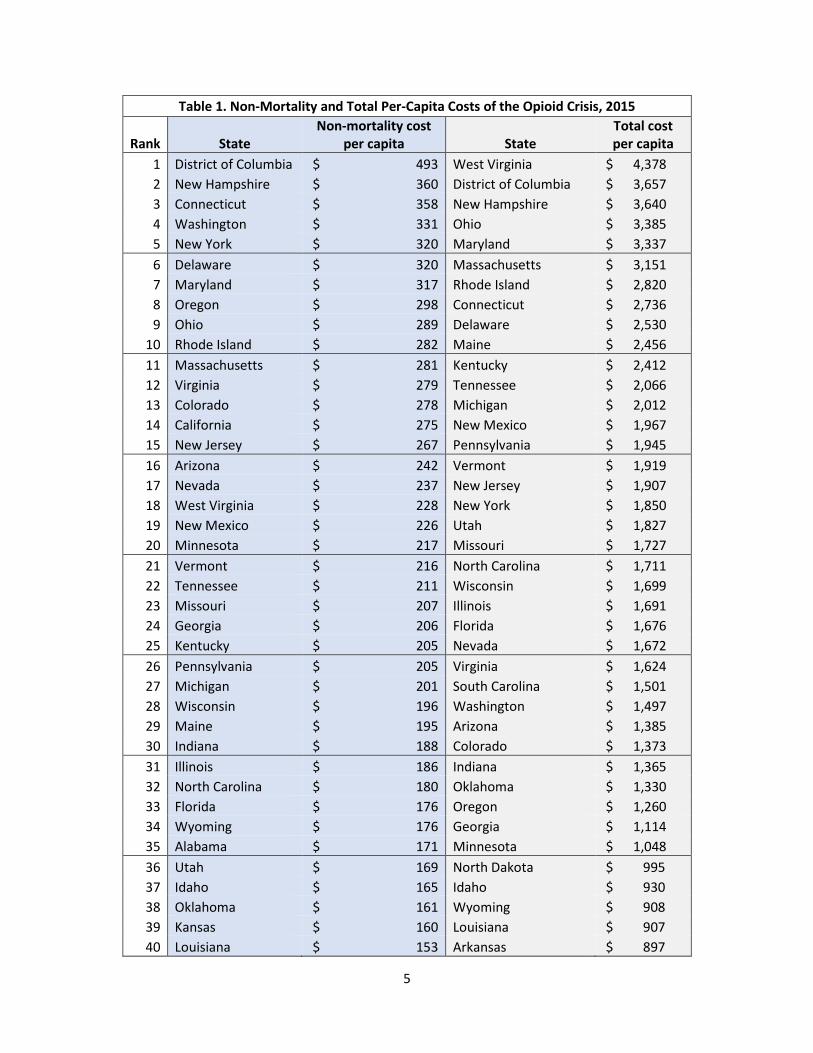
Table 1 offers a breakdown of our estimates of per-capita costs. Our results indicate that the non-mortality per-capita economic burden of the opioid crisis is highest in the District of Columbia ($493 per resident) and lowest in Iowa ($118 per resident). Adding mortality costs gives West Virginia by far the highest per-capita burden ($4,378 per resident) and Nebraska the lowest ($394 per resident).3
3 These estimates vary slightly from those reported in Brill (2018) due to an update in the data and methodology.
5
Table 1. Non-Mortality and Total Per-Capita Costs of the Opioid Crisis, 2015
Rank State Non-mortality cost
per capita State Total cost per capita
1 District of Columbia $ 493 West Virginia $ 4,378 2 New Hampshire $ 360 District of Columbia $ 3,657 3 Connecticut $ 358 New Hampshire $ 3,640 4 Washington $ 331 Ohio $ 3,385 5 New York $ 320 Maryland $ 3,337 6 Delaware $ 320 Massachusetts $ 3,151 7 Maryland $ 317 Rhode Island $ 2,820 8 Oregon $ 298 Connecticut $ 2,736 9 Ohio $ 289 Delaware $ 2,530
10 Rhode Island $ 282 Maine $ 2,456 11 Massachusetts $ 281 Kentucky $ 2,412 12 Virginia $ 279 Tennessee $ 2,066 13 Colorado $ 278 Michigan $ 2,012 14 California $ 275 New Mexico $ 1,967 15 New Jersey $ 267 Pennsylvania $ 1,945 16 Arizona $ 242 Vermont $ 1,919 17 Nevada $ 237 New Jersey $ 1,907 18 West Virginia $ 228 New York $ 1,850 19 New Mexico $ 226 Utah $ 1,827 20 Minnesota $ 217 Missouri $ 1,727 21 Vermont $ 216 North Carolina $ 1,711 22 Tennessee $ 211 Wisconsin $ 1,699 23 Missouri $ 207 Illinois $ 1,691 24 Georgia $ 206 Florida $ 1,676 25 Kentucky $ 205 Nevada $ 1,672 26 Pennsylvania $ 205 Virginia $ 1,624 27 Michigan $ 201 South Carolina $ 1,501 28 Wisconsin $ 196 Washington $ 1,497 29 Maine $ 195 Arizona $ 1,385 30 Indiana $ 188 Colorado $ 1,373 31 Illinois $ 186 Indiana $ 1,365 32 North Carolina $ 180 Oklahoma $ 1,330 33 Florida $ 176 Oregon $ 1,260 34 Wyoming $ 176 Georgia $ 1,114 35 Alabama $ 171 Minnesota $ 1,048 36 Utah $ 169 North Dakota $ 995 37 Idaho $ 165 Idaho $ 930 38 Oklahoma $ 161 Wyoming $ 908 39 Kansas $ 160 Louisiana $ 907 40 Louisiana $ 153 Arkansas $ 897

6
41 North Dakota $ 152 Alabama $ 892 42 Montana $ 151 California $ 847 43 South Dakota $ 145 Kansas $ 745 44 South Carolina $ 145 South Dakota $ 736 45 Texas $ 144 Iowa $ 705 46 Arkansas $ 143 Mississippi $ 703 47 Mississippi $ 138 Texas $ 653 48 Nebraska $ 126 Montana $ 596 49 Iowa $ 118 Nebraska $ 394 Note: See technical appendix for data and methodology.
Charts 2 and 3 show each state’s per-capita costs, ranked by quintile. Chart 2 illustrates the per-capita health care, criminal justice, and productivity costs. Chart 3 includes the additional costs associated with the loss of life.
Chart 2. Non-Mortality Opioid Costs Per Capita by State in 2015

7
Chart 3. Total Opioid Costs Per Capita by State in 2015
Per-Capita County-Level Costs of the Opioid Crisis
While state-level estimates are more informative than national estimates, there is also wide variation within states in opioid abuse and death rates. For this reason, county-level estimates of the cost of the epidemic can offer valuable insights as well. The county-level analysis reallocates the state-level costs among the counties within each state.
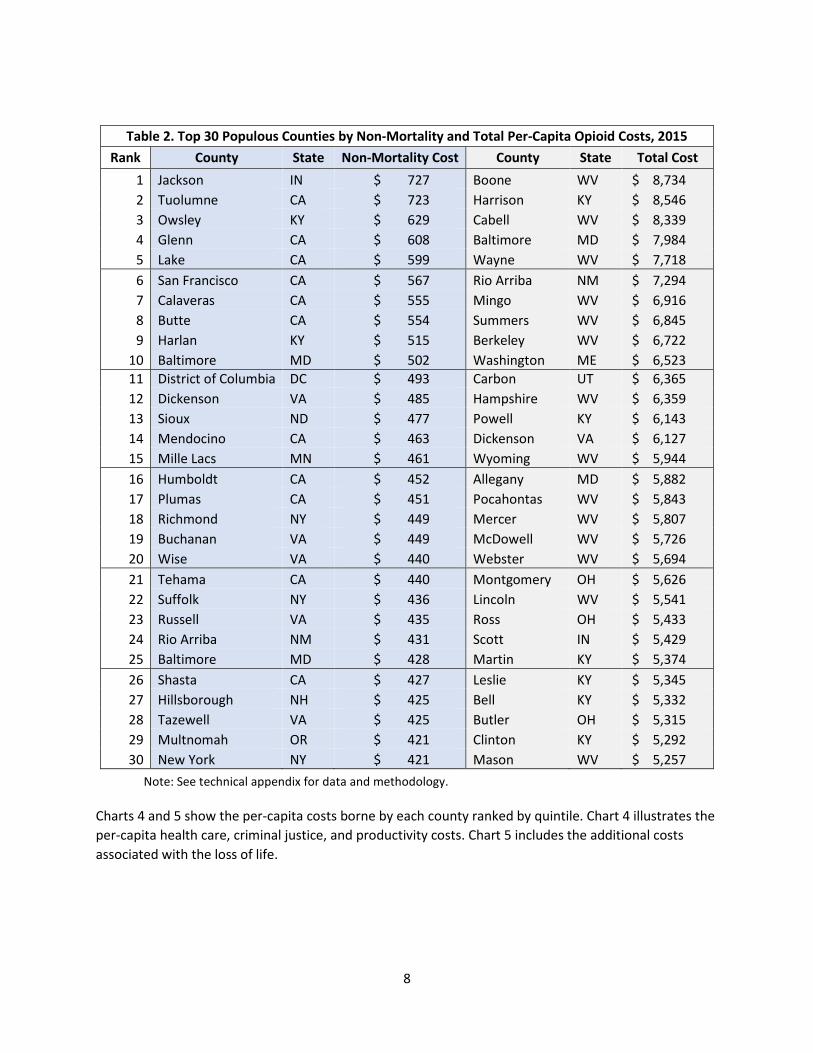
As in the state analysis, the counties with the highest non-mortality costs per capita are not necessarily the same as those with the highest total costs. Table 2 lists the top 30 counties with populations of over 2,500 ranked by non-mortality and total costs. The highest non-mortality per-capita costs are primarily in counties in California, Colorado, and Virginia, while highest total costs are in counties in Kentucky and West Virginia. The non-mortality results are driven by a combination of abuse rates and health care costs, and the total costs are driven primarily by estimated deaths per capita.
8
Table 2. Top 30 Populous Counties by Non-Mortality and Total Per-Capita Opioid Costs, 2015 Rank County State Non-Mortality Cost County State Total Cost
1 Jackson IN $ 727 Boone WV $ 8,734 2 Tuolumne CA $ 723 Harrison KY $ 8,546 3 Owsley KY $ 629 Cabell WV $ 8,339 4 Glenn CA $ 608 Baltimore MD $ 7,984 5 Lake CA $ 599 Wayne WV $ 7,718 6 San Francisco CA $ 567 Rio Arriba NM $ 7,294 7 Calaveras CA $ 555 Mingo WV $ 6,916 8 Butte CA $ 554 Summers WV $ 6,845 9 Harlan KY $ 515 Berkeley WV $ 6,722
10 Baltimore MD $ 502 Washington ME $ 6,523 11 District of Columbia DC $ 493 Carbon UT $ 6,365 12 Dickenson VA $ 485 Hampshire WV $ 6,359 13 Sioux ND $ 477 Powell KY $ 6,143 14 Mendocino CA $ 463 Dickenson VA $ 6,127 15 Mille Lacs MN $ 461 Wyoming WV $ 5,944 16 Humboldt CA $ 452 Allegany MD $ 5,882 17 Plumas CA $ 451 Pocahontas WV $ 5,843 18 Richmond NY $ 449 Mercer WV $ 5,807 19 Buchanan VA $ 449 McDowell WV $ 5,726 20 Wise VA $ 440 Webster WV $ 5,694 21 Tehama CA $ 440 Montgomery OH $ 5,626 22 Suffolk NY $ 436 Lincoln WV $ 5,541 23 Russell VA $ 435 Ross OH $ 5,433 24 Rio Arriba NM $ 431 Scott IN $ 5,429 25 Baltimore MD $ 428 Martin KY $ 5,374 26 Shasta CA $ 427 Leslie KY $ 5,345 27 Hillsborough NH $ 425 Bell KY $ 5,332 28 Tazewell VA $ 425 Butler OH $ 5,315 29 Multnomah OR $ 421 Clinton KY $ 5,292 30 New York NY $ 421 Mason WV $ 5,257
Note: See technical appendix for data and methodology.
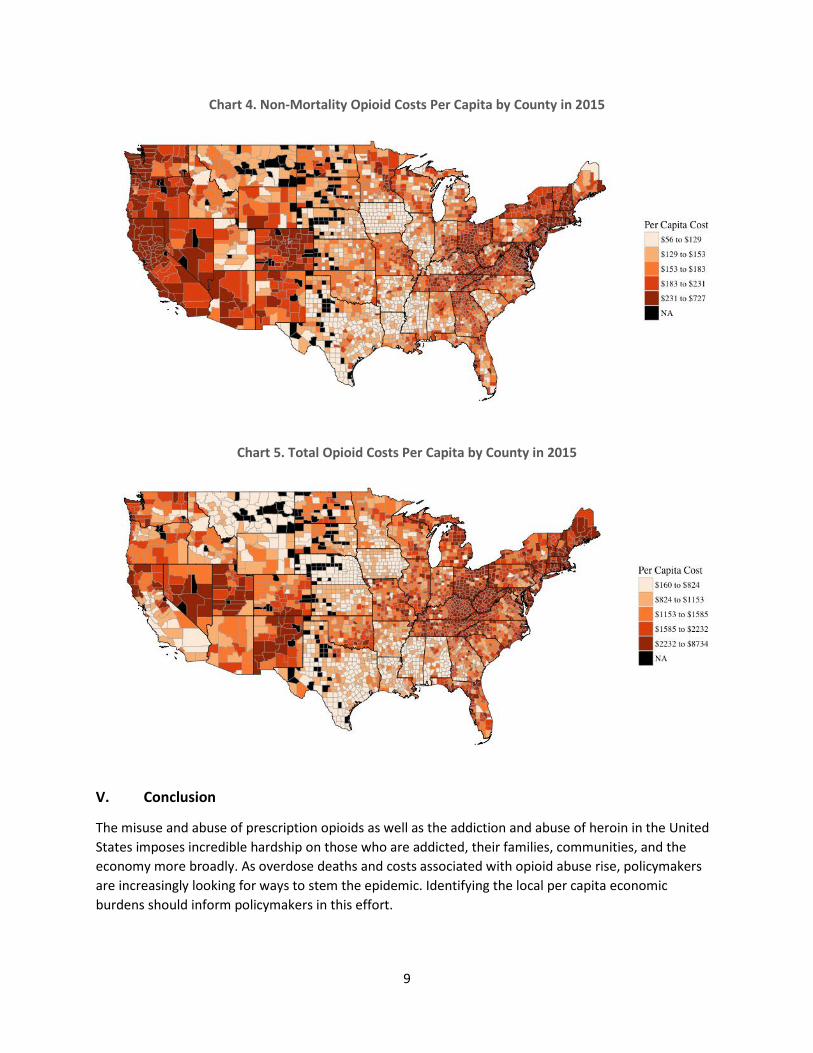
Charts 4 and 5 show the per-capita costs borne by each county ranked by quintile. Chart 4 illustrates the per-capita health care, criminal justice, and productivity costs. Chart 5 includes the additional costs associated with the loss of life.
9
Chart 4. Non-Mortality Opioid Costs Per Capita by County in 2015
Chart 5. Total Opioid Costs Per Capita by County in 2015
V. Conclusion
The misuse and abuse of prescription opioids as well as the addiction and abuse of heroin in the United States imposes incredible hardship on those who are addicted, their families, communities, and the economy more broadly. As overdose deaths and costs associated with opioid abuse rise, policymakers are increasingly looking for ways to stem the epidemic. Identifying the local per capita economic burdens should inform policymakers in this effort.

10
Technical Appendix: Methodology and Data
Our model seeks to allocate the Council of Economic Advisers (CEA 2017) national cost estimates in each cost category (mortality, health care, criminal justice, and productivity) to each state in the state-level analysis. Then, we distribute the state costs in each cost category among the counties in the county-level analysis. We restrict our county-level analysis to counties with populations over 2,500.
Mortality Costs
We determine the weights to distribute the mortality costs using estimates of opioid-related deaths derived from the Centers for Disease Control (CDC) Wide-ranging Online Data for Epidemiologic Research (WONDER) database.
We capture deaths associated with the following ICD-10 codes for 2016: F11.0 (Mental and behavioural disorders due to use of opioids, acute intoxication), F11.1 (Mental and behavioural disorders due to use of opioids, harmful use), F11.2 (Mental and behavioural disorders due to use of opioids, dependence syndrome), F11.3 (Mental and behavioural disorders due to use of opioids, withdrawal state), F11.4 (Mental and behavioural disorders due to use of opioids, withdrawal state with delirium), F11.5 (Mental and behavioural disorders due to use of opioids, psychotic disorder), F11.6 (Mental and behavioural disorders due to use of opioids, amnesic syndrome), F11.7 (Mental and behavioural disorders due to use of opioids, residual and late-onset psychotic disorder), F11.8 (Mental and behavoural disorders due to use of opioids, other mental and behavioural disorders), F11.9 (Mental and behavioural disorders due to use of opioids, unspecified mental and behavioural disorder), T40.0 (Opium), T40.1 (Heroin), T40.2 (Other opioids), T40.3 (Methadone), T40.4 (Other synthetic narcotics), T50.7 (Analeptics and opioid receptor antagonists), and Y45.0 (Opioids and related analgesics).
For state, s, mortality-related costs, 𝑚𝑚𝑠𝑠, are calculated using the following methodology. CEA (2017) estimates that overall mortality-related costs in 2015 were $431.7 billion. Let 𝑑𝑑𝑠𝑠 indicate the number of opioid-related deaths in state, s.
𝑤𝑤𝑠𝑠 =𝑑𝑑𝑠𝑠∑ 𝑑𝑑𝑠𝑠𝑠𝑠
𝑚𝑚𝑠𝑠 = 𝑤𝑤𝑠𝑠 𝑥𝑥 𝑂𝑂𝑂𝑂𝑂𝑂𝑂𝑂𝑂𝑂𝑂𝑂𝑂𝑂 𝑀𝑀𝑀𝑀𝑂𝑂𝑀𝑀𝑂𝑂𝑂𝑂𝑀𝑀𝑀𝑀𝑀𝑀 𝐶𝐶𝑀𝑀𝐶𝐶𝑀𝑀𝐶𝐶
We use the same methodology to allocate mortality-related costs among counties within states. However, CDC WONDER only reports opioid-related deaths for 728 out of approximately 3,000 US counties. Therefore, we model the number of opioid-related deaths where the data are missing using one of two models. For 1,885 of the remaining counties, we have data on overall drug-related deaths (ICD-10: Drug poisonings (overdose) Unintentional (X40-X44), Drug poisonings (overdose) Suicide (X60-X64), Drug poisonings (overdose) Homicide (X85), Drug poisonings (overdose) Undetermined (Y10-Y14)). In these counties, we predict the number of opioid-related deaths using a mixed-effects negative binomial model. In the model, we use the following dependent variables: the log of the count of drug-related deaths, the log of the estimated number of people who use pain relievers for nonmedical use, the log of the population, the log of the median household income in the county, the proportion of the population who live in rural areas, the proportion of the population who are Black, the proportion of the population who are Hispanic, and the proportion of the population who have not graduated high school.
11
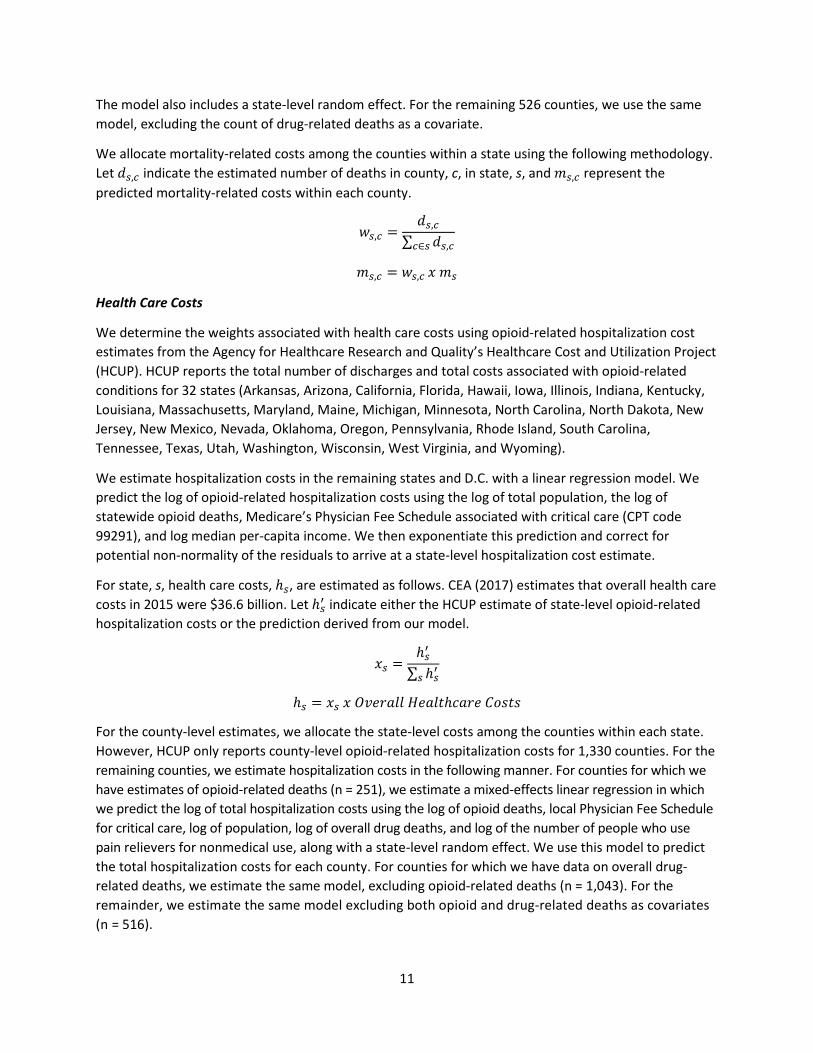
The model also includes a state-level random effect. For the remaining 526 counties, we use the same model, excluding the count of drug-related deaths as a covariate.
We allocate mortality-related costs among the counties within a state using the following methodology. Let 𝑑𝑑𝑠𝑠,𝑐𝑐 indicate the estimated number of deaths in county, c, in state, s, and 𝑚𝑚𝑠𝑠,𝑐𝑐 represent the predicted mortality-related costs within each county.
𝑤𝑤𝑠𝑠,𝑐𝑐 =𝑑𝑑𝑠𝑠,𝑐𝑐
∑ 𝑑𝑑𝑠𝑠,𝑐𝑐𝑐𝑐∈𝑠𝑠
𝑚𝑚𝑠𝑠,𝑐𝑐 = 𝑤𝑤𝑠𝑠,𝑐𝑐 𝑥𝑥 𝑚𝑚𝑠𝑠
Health Care Costs
We determine the weights associated with health care costs using opioid-related hospitalization cost estimates from the Agency for Healthcare Research and Quality’s Healthcare Cost and Utilization Project (HCUP). HCUP reports the total number of discharges and total costs associated with opioid-related conditions for 32 states (Arkansas, Arizona, California, Florida, Hawaii, Iowa, Illinois, Indiana, Kentucky, Louisiana, Massachusetts, Maryland, Maine, Michigan, Minnesota, North Carolina, North Dakota, New Jersey, New Mexico, Nevada, Oklahoma, Oregon, Pennsylvania, Rhode Island, South Carolina, Tennessee, Texas, Utah, Washington, Wisconsin, West Virginia, and Wyoming).
We estimate hospitalization costs in the remaining states and D.C. with a linear regression model. We predict the log of opioid-related hospitalization costs using the log of total population, the log of statewide opioid deaths, Medicare’s Physician Fee Schedule associated with critical care (CPT code 99291), and log median per-capita income. We then exponentiate this prediction and correct for potential non-normality of the residuals to arrive at a state-level hospitalization cost estimate.
For state, s, health care costs, ℎ𝑠𝑠, are estimated as follows. CEA (2017) estimates that overall health care costs in 2015 were $36.6 billion. Let ℎ𝑠𝑠′ indicate either the HCUP estimate of state-level opioid-related hospitalization costs or the prediction derived from our model.
𝑥𝑥𝑠𝑠 =ℎ𝑠𝑠′
∑ ℎ𝑠𝑠′𝑠𝑠
ℎ𝑠𝑠 = 𝑥𝑥𝑠𝑠 𝑥𝑥 𝑂𝑂𝑂𝑂𝑂𝑂𝑂𝑂𝑂𝑂𝑂𝑂𝑂𝑂 𝐻𝐻𝑂𝑂𝑂𝑂𝑂𝑂𝑀𝑀ℎ𝑐𝑐𝑂𝑂𝑂𝑂𝑂𝑂 𝐶𝐶𝑀𝑀𝐶𝐶𝑀𝑀𝐶𝐶
For the county-level estimates, we allocate the state-level costs among the counties within each state. However, HCUP only reports county-level opioid-related hospitalization costs for 1,330 counties. For the remaining counties, we estimate hospitalization costs in the following manner. For counties for which we have estimates of opioid-related deaths (n = 251), we estimate a mixed-effects linear regression in which we predict the log of total hospitalization costs using the log of opioid deaths, local Physician Fee Schedule for critical care, log of population, log of overall drug deaths, and log of the number of people who use pain relievers for nonmedical use, along with a state-level random effect. We use this model to predict the total hospitalization costs for each county. For counties for which we have data on overall drug-related deaths, we estimate the same model, excluding opioid-related deaths (n = 1,043). For the remainder, we estimate the same model excluding both opioid and drug-related deaths as covariates (n = 516).
12
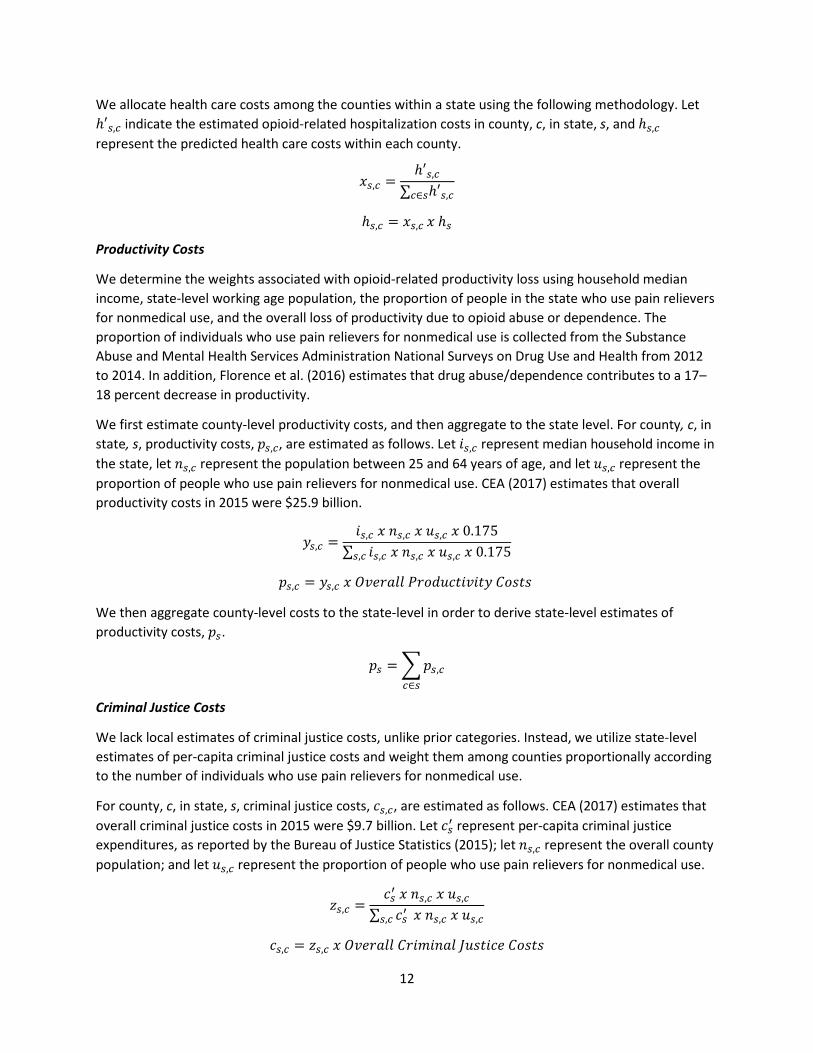
We allocate health care costs among the counties within a state using the following methodology. Let ℎ′𝑠𝑠,𝑐𝑐 indicate the estimated opioid-related hospitalization costs in county, c, in state, s, and ℎ𝑠𝑠,𝑐𝑐 represent the predicted health care costs within each county.
𝑥𝑥𝑠𝑠,𝑐𝑐 =ℎ′𝑠𝑠,𝑐𝑐
∑𝑐𝑐∈𝑠𝑠ℎ′𝑠𝑠,𝑐𝑐
ℎ𝑠𝑠,𝑐𝑐 = 𝑥𝑥𝑠𝑠,𝑐𝑐 𝑥𝑥 ℎ𝑠𝑠
Productivity Costs
We determine the weights associated with opioid-related productivity loss using household median income, state-level working age population, the proportion of people in the state who use pain relievers for nonmedical use, and the overall loss of productivity due to opioid abuse or dependence. The proportion of individuals who use pain relievers for nonmedical use is collected from the Substance Abuse and Mental Health Services Administration National Surveys on Drug Use and Health from 2012 to 2014. In addition, Florence et al. (2016) estimates that drug abuse/dependence contributes to a 17–18 percent decrease in productivity.
We first estimate county-level productivity costs, and then aggregate to the state level. For county, c, in state, s, productivity costs, 𝑝𝑝𝑠𝑠,𝑐𝑐, are estimated as follows. Let 𝑀𝑀𝑠𝑠,𝑐𝑐 represent median household income in the state, let 𝑛𝑛𝑠𝑠,𝑐𝑐 represent the population between 25 and 64 years of age, and let 𝑢𝑢𝑠𝑠,𝑐𝑐 represent the proportion of people who use pain relievers for nonmedical use. CEA (2017) estimates that overall productivity costs in 2015 were $25.9 billion.
𝑀𝑀𝑠𝑠,𝑐𝑐 =𝑀𝑀𝑠𝑠,𝑐𝑐 𝑥𝑥 𝑛𝑛𝑠𝑠,𝑐𝑐 𝑥𝑥 𝑢𝑢𝑠𝑠,𝑐𝑐 𝑥𝑥 0.175
∑ 𝑀𝑀𝑠𝑠,𝑐𝑐 𝑥𝑥 𝑛𝑛𝑠𝑠,𝑐𝑐 𝑥𝑥 𝑢𝑢𝑠𝑠,𝑐𝑐 𝑥𝑥 0.175𝑠𝑠,𝑐𝑐
𝑝𝑝𝑠𝑠,𝑐𝑐 = 𝑀𝑀𝑠𝑠,𝑐𝑐 𝑥𝑥 𝑂𝑂𝑂𝑂𝑂𝑂𝑂𝑂𝑂𝑂𝑂𝑂𝑂𝑂 𝑃𝑃𝑂𝑂𝑀𝑀𝑑𝑑𝑢𝑢𝑐𝑐𝑀𝑀𝑀𝑀𝑂𝑂𝑀𝑀𝑀𝑀𝑀𝑀 𝐶𝐶𝑀𝑀𝐶𝐶𝑀𝑀𝐶𝐶
We then aggregate county-level costs to the state-level in order to derive state-level estimates of productivity costs, 𝑝𝑝𝑠𝑠.
𝑝𝑝𝑠𝑠 = �𝑝𝑝𝑠𝑠,𝑐𝑐𝑐𝑐∈𝑠𝑠
Criminal Justice Costs
We lack local estimates of criminal justice costs, unlike prior categories. Instead, we utilize state-level estimates of per-capita criminal justice costs and weight them among counties proportionally according to the number of individuals who use pain relievers for nonmedical use.
For county, c, in state, s, criminal justice costs, 𝑐𝑐𝑠𝑠,𝑐𝑐, are estimated as follows. CEA (2017) estimates that overall criminal justice costs in 2015 were $9.7 billion. Let 𝑐𝑐𝑠𝑠′ represent per-capita criminal justice expenditures, as reported by the Bureau of Justice Statistics (2015); let 𝑛𝑛𝑠𝑠,𝑐𝑐 represent the overall county population; and let 𝑢𝑢𝑠𝑠,𝑐𝑐 represent the proportion of people who use pain relievers for nonmedical use.
𝑧𝑧𝑠𝑠,𝑐𝑐 =𝑐𝑐𝑠𝑠′ 𝑥𝑥 𝑛𝑛𝑠𝑠,𝑐𝑐 𝑥𝑥 𝑢𝑢𝑠𝑠,𝑐𝑐
∑ 𝑐𝑐𝑠𝑠′𝑠𝑠,𝑐𝑐 𝑥𝑥 𝑛𝑛𝑠𝑠,𝑐𝑐 𝑥𝑥 𝑢𝑢𝑠𝑠,𝑐𝑐
𝑐𝑐𝑠𝑠,𝑐𝑐 = 𝑧𝑧𝑠𝑠,𝑐𝑐 𝑥𝑥 𝑂𝑂𝑂𝑂𝑂𝑂𝑂𝑂𝑂𝑂𝑂𝑂𝑂𝑂 𝐶𝐶𝑂𝑂𝑀𝑀𝑚𝑚𝑀𝑀𝑛𝑛𝑂𝑂𝑂𝑂 𝐽𝐽𝑢𝑢𝐶𝐶𝑀𝑀𝑀𝑀𝑐𝑐𝑂𝑂 𝐶𝐶𝑀𝑀𝐶𝐶𝑀𝑀𝐶𝐶
13
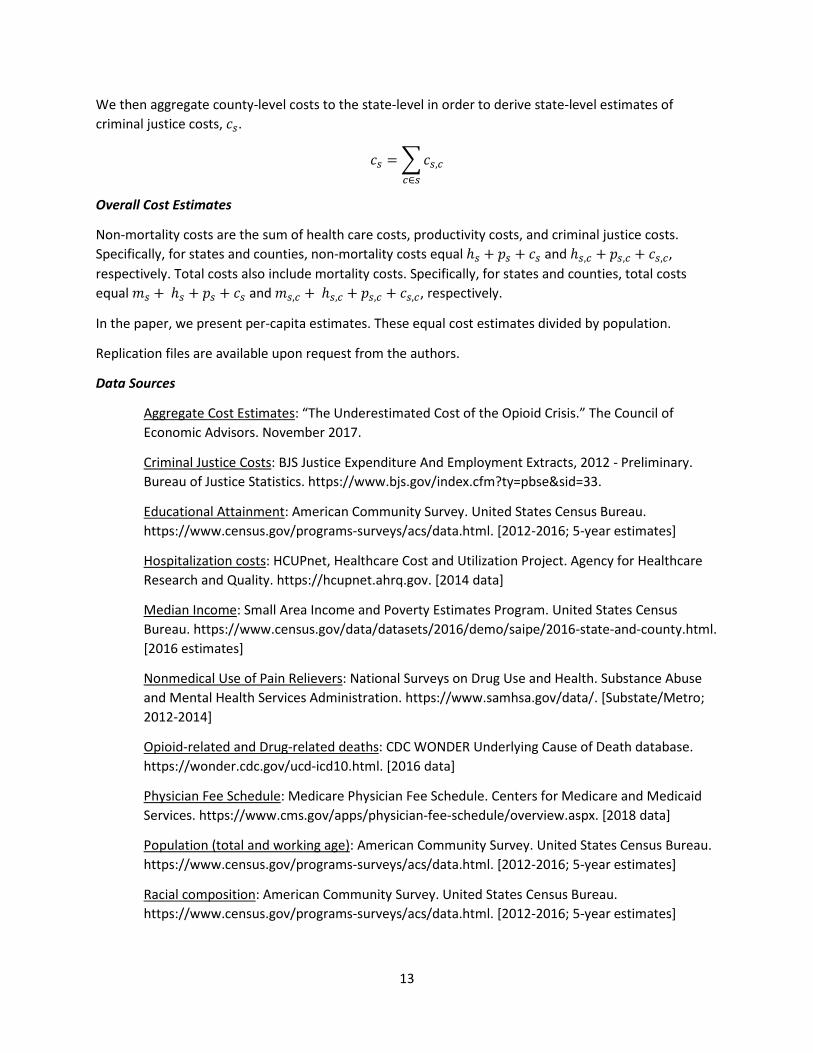
We then aggregate county-level costs to the state-level in order to derive state-level estimates of criminal justice costs, 𝑐𝑐𝑠𝑠.
𝑐𝑐𝑠𝑠 = �𝑐𝑐𝑠𝑠,𝑐𝑐𝑐𝑐∈𝑠𝑠
Overall Cost Estimates
Non-mortality costs are the sum of health care costs, productivity costs, and criminal justice costs. Specifically, for states and counties, non-mortality costs equal ℎ𝑠𝑠 + 𝑝𝑝𝑠𝑠 + 𝑐𝑐𝑠𝑠 and ℎ𝑠𝑠,𝑐𝑐 + 𝑝𝑝𝑠𝑠,𝑐𝑐 + 𝑐𝑐𝑠𝑠,𝑐𝑐, respectively. Total costs also include mortality costs. Specifically, for states and counties, total costs equal 𝑚𝑚𝑠𝑠 + ℎ𝑠𝑠 + 𝑝𝑝𝑠𝑠 + 𝑐𝑐𝑠𝑠 and 𝑚𝑚𝑠𝑠,𝑐𝑐 + ℎ𝑠𝑠,𝑐𝑐 + 𝑝𝑝𝑠𝑠,𝑐𝑐 + 𝑐𝑐𝑠𝑠,𝑐𝑐, respectively.
In the paper, we present per-capita estimates. These equal cost estimates divided by population.
Replication files are available upon request from the authors.
Data Sources
Aggregate Cost Estimates: “The Underestimated Cost of the Opioid Crisis.” The Council of Economic Advisors. November 2017.
Criminal Justice Costs: BJS Justice Expenditure And Employment Extracts, 2012 - Preliminary. Bureau of Justice Statistics. https://www.bjs.gov/index.cfm?ty=pbse&sid=33.
Educational Attainment: American Community Survey. United States Census Bureau. https://www.census.gov/programs-surveys/acs/data.html. [2012-2016; 5-year estimates]
Hospitalization costs: HCUPnet, Healthcare Cost and Utilization Project. Agency for Healthcare Research and Quality. https://hcupnet.ahrq.gov. [2014 data]
Median Income: Small Area Income and Poverty Estimates Program. United States Census Bureau. https://www.census.gov/data/datasets/2016/demo/saipe/2016-state-and-county.html. [2016 estimates]
Nonmedical Use of Pain Relievers: National Surveys on Drug Use and Health. Substance Abuse and Mental Health Services Administration. https://www.samhsa.gov/data/. [Substate/Metro; 2012-2014]
Opioid-related and Drug-related deaths: CDC WONDER Underlying Cause of Death database. https://wonder.cdc.gov/ucd-icd10.html. [2016 data]
Physician Fee Schedule: Medicare Physician Fee Schedule. Centers for Medicare and Medicaid Services. https://www.cms.gov/apps/physician-fee-schedule/overview.aspx. [2018 data]
Population (total and working age): American Community Survey. United States Census Bureau. https://www.census.gov/programs-surveys/acs/data.html. [2012-2016; 5-year estimates]
Racial composition: American Community Survey. United States Census Bureau. https://www.census.gov/programs-surveys/acs/data.html. [2012-2016; 5-year estimates]
14
Sources
Birnbaum, Howard G., Alan G. White, Jennifer L. Reynolds, Paul E. Greenberg, Mingliang Zhang, Sue Vallow, Jeff R. Schein, and Nathaniel P. Katz. 2006. “Estimated Costs of Prescription Opioid Analgesic Abuse in the United States in 2001: A Societal Perspective,” The Clinical Journal of Pain 22, no. 8 (October): 667–676.
Birnbaum, Howard G., Alan G. White, Matt Schiller, Tracy Waldman, Jody M. Cleveland, and Carl L. Roland. 2011. “Societal Costs of Prescription Opioid Abuse, Dependence, and Misuse in the United States,” Pain Medicine 12, no. 4 (April): 657–667.
Brill, Alex. 2018. “New State-Level Estimates of the Economic Burden of the Opioid Epidemic.” AEIdeas. January 16.
Centers for Disease Control and Prevention (CDC). 2017a. Prescription Opioid Overdose Data. (Updated August 1.) www.cdc.gov/drugoverdose/data/overdose.html.
CDC. 2017b. Annual Surveillance Report of Drug-Related Risks and Outcomes — United States, 2017. Surveillance Special Report 1. August 31. www.cdc.gov/drugoverdose/pdf/pubs/2017-cdc-drug-surveillance-report.pdf.
CDC. 2017c. “Opioid Overdose.” www.cdc.gov/drugoverdose/index.html. Updated October 23.
CDC. 2018. “Emergency Department Data Show Rapid Increases in Opioid Overdoses.” Press release. March 6. www.cdc.gov/media/releases/2018/p0306-vs-opioids-overdoses.html.
Cicero, Theodore J., Matthew S. Ellis, and Zachary A. Kasper. 2017. “Increased Use of Heroin as an Initiating Opioid of Abuse.” Addictive Behaviors 74 (November): 63–66.
Council of Economic Advisers (CEA). 2017. “The Underestimated Cost of the Opioid Crisis,” November. www.whitehouse.gov/sites/whitehouse.gov/files/images/The%20Underestimated%20Cost%20of%20the%20Opioid%20Crisis.pdf.
Florence, Curtis S., Chao Zhou, Feijun Luo, and Likang Xu. 2016. “The Economic Burden of Prescription Opioid Overdose, Abuse, and Dependence in the United States, 2013.” Medical Care 54, no. 10 (October): 901–906.
Hansen, Ryan N., Gerry Oster, John Edelsberg, George Woody, and Sean D. Sullivan. 2011. “Economic Costs of Nonmedical Use of Prescription Opioids,” The Clinical Journal of Pain 27, no. 3 (March): 194–202.
Hollingsworth, Alex, Christopher J. Ruhm, and Kosali Simon. 2017. “Macroeconomic Conditions and Opioid Abuse.” Journal of Health Economics 56 (December): 222–233.
Kaiser Family Foundation. 2016. State Health Facts: Prescription Opioid Overdose Deaths and Death Rate per 100,000 Population (Age-Adjusted). www.kff.org/other/state-indicator/prescription-opioid-overdose-deaths-and-death-rate-per-100000-population-age-adjusted/?dataView=1¤tTimeframe=0&sortModel=%7B%22colId%22:%22Location%22,%22sort%22:%22asc%22%7D.
15
Kirson, Noam Y., Lauren M. Scarpati, Caroline J. Enloe, Aliya P. Dincer, Howard G. Birnbaum, and Tracy J. Mayne. 2017. “The Economic Burden of Opioid Abuse: Updated Findings.” Journal of Managed Care and Specialty Pharmacy 23, no. 4 (April): 427–445.
Krueger, Alan B. 2017. “Where Have All the Workers Gone? An Inquiry into the Decline of the U.S. Labor Force Participation Rate.” Brookings Paper on Economic Activity. September 7. www.brookings.edu/bpea-articles/where-have-all-the-workers-gone-an-inquiry-into-the-decline-of-the-u-s-labor-force-participation-rate.
McAdam-Marx, Carrie, Carl L. Roland, Jody Cleveland, and Gary M. Oderda. 2010. “Costs of Opioid Abuse and Misuse Determined from a Medicaid Database.” Journal of Pain and Palliative Pharmacotherapy 24, no. 1: 5–18.
Mericle, David. 2017. “The Opioid Epidemic and the U.S. Economy.” Goldman Sachs Economics Research. July.
National Institute on Drug Abuse. 2018. Opioid Overdose Crisis. www.drugabuse.gov/drugs-abuse/opioids/opioid-overdose-crisis.
President’s Commission on Combating Drug Addiction and the Opioid Crisis. 2017. Final report. November. www.whitehouse.gov/sites/whitehouse.gov/files/images/Final_Report_Draft_11-15-2017.pdf.
Rhyan, Corwin N. 2017. “The Potential Societal Benefit of Eliminating Opioid Overdoses, Deaths, and Substance Use Disorders Exceeds $95 Billion per Year.” Altarum Institute. November 16. https://altarum.org/sites/default/files/uploaded-publication-files/Research-Brief_Opioid-Epidemic-Economic-Burden.pdf.
White, Alan G., Howard G. Birnbaum, Milena N. Mareva, Maham Daher, Susan Vallow, Jeff Schein, and Nathaniel Katz. 2005. “Direct Costs of Opioid Abuse in an Insured Population in the United States,” Journal of Managed Care Pharmacy 11, no. 6 (July/August): 469–479.
White, Alan G., Howard G. Birnbaum, Matt Schiller, Tracy Waldman, Jody M. Cleveland, and Carl L. Roland. 2011. “Economic Impact of Opioid Abuse, Dependence, and Misuse,” American Journal of Managed Care 3(4): e59–e70.