the genetic architecture of lipoprotein subclasses in...
TRANSCRIPT
586 Journal of Lipid Research Volume 51, 2010
Copyright © 2010 by the American Society for Biochemistry and Molecular Biology, Inc.
This article is available online at http://www.jlr.org
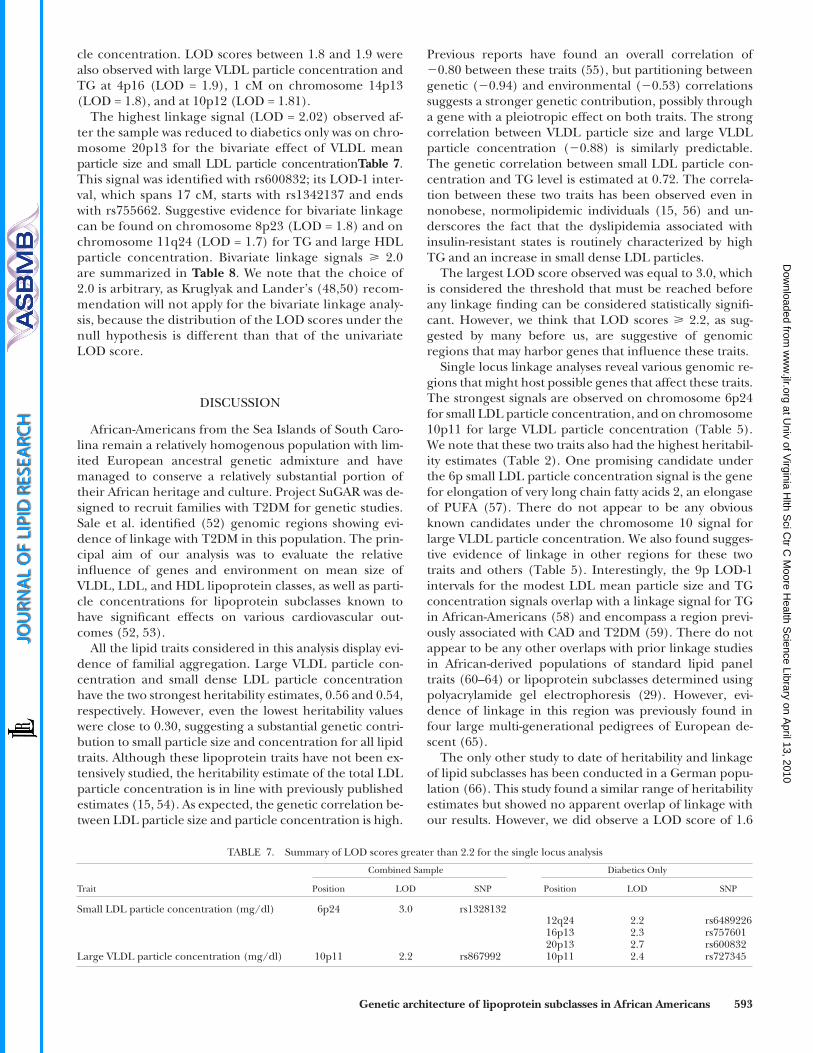
studied in this sample and that novel loci on chromosomes 6, 10, 16, and 20 may harbor genes contributing to small, atherogenic LDL particle concentration and large, triglyc-eride-rich VLDL particle concentration. —Divers, J., M. M. Sale, L. Lu, W-M. Chen, K. H. Lok, I. J. Spruill, J. K. Fernandes, C. D. Langefeld, and W. T. Garvey. The genetic architecture of lipoprotein subclasses in Gullah-speaking African American families enriched for type 2 diabetes: The Sea Islands Genetic African American Registry (Project SuGAR). J. Lipid Res . 2010. 51: 586–597.
Supplementary key words linkage analysis • lipids • lipoproteins • heritability • genetic correlation
Cardiovascular disease (CVD) is the leading cause of morbidity and mortality among individuals with diabetes ( 1–3 ). For example, the risk of coronary heart disease is 2–4 times higher in diabetic patients compared with non-diabetic individuals ( 4–8 ). Dyslipidemia is thought to be a potential common link between these two conditions ( 9, 10 ). The principal lipoprotein classes, VLDL, LDL, and HDL, have received considerable attention as cardiovascu-lar disease risk factors in the epidemiology literature. Sev-eral genes have also been reported to be associated with these lipoprotein phenotypes ( 11–13 ). In fact, genetic cor-relation and genes with possible pleiotropic effect on LDL,
Abstract We sought to partition the genetic and environ-mental infl uences on lipoprotein subclasses and identify ge-nomic regions that may harbor genetic variants that infl uence serum lipoprotein levels in a sample of Gullah-speaking African-Americans. We genotyped 5,974 SNPs in 979 subjects from 418 pedigrees and used the variance component ap-proach to compute heritability estimates, genetic and envi-ronmental correlations, and linkage analyses for selected lipoprotein subclasses. The highest heritability estimate was observed for large VLDL particle concentration (0.56 ± 0.14). Mean LDL particle size and small LDL particle con-centration ( � 0.94) had the strongest genetic correlation es-timate. The highest logarithm of odds (LOD) score detected (3.0) was on chromosome 6p24 for small LDL particle con-centration. The strongest signal, obtained with the reduced sample of diabetic individuals only, was observed on chro-mosome 20p13 for small LDL particle concentration. The highest bivariate linkage signal (LOD 2.4) was observed on chromosome 6p24 for mean LDL particle size and small LDL particle concentration.jlr Our results suggest a signifi -cant genetic contribution to multiple lipoprotein subclasses
Project SuGAR could not have been accomplished without a grant from the W. M. Keck Foundation, Los Angeles CA. We acknowledge the support of the Gen-eral Clinical Research Center at the Medical University of South Carolina (M01 RR-1070), the Genetics Core Facility of the UAB Clinical Nutrition Research Unit (P30 DK-56336), and the UAB Diabetes Research and Training Center (P60 DK079626). The work was supported by the Wake Forest Health Sciences Center for Public Health Genomics (J.D. and C.D.L), research grants from the National Institutes of Health including DK47461 and DK038765 (W.T.G.), DK66358 (M.M.S.), the South Carolina Center of Biomedical Excellence (CO-BRE) for Oral Health P20 RR17696, and from the American Diabetes Associa-tion in the form of a GENNID Study Center grant (W.T.G.) and Career Development Award (M.M.S.). Center for Inherited Disease Research is funded through a federal contract from the National Institutes of Health to Johns Hop-kins University, contract number N01-HG-65403. Its contents are solely the re-sponsibility of the authors and do not necessarily represent the offi cial views of the National Institutes of Health or other granting agencies.
Manuscript received 23 September 2009 and in revised form 25 September 2009.
Published, JLR Papers in Press, September 25, 2009 DOI 10.1194/jlr.M001842
The genetic architecture of lipoprotein subclasses in Gullah-speaking African American families enriched for type 2 diabetes: The Sea Islands Genetic African American Registry (Project SuGAR)
Jasmin Divers, 1, * ,† Michèle M. Sale, §, ** ,†† Lingyi Lu, * Wei-Min Chen, §,§§ Kerry H. Lok, *** Ida J. Spruill, ††† Jyotika K. Fernandes, ††† Carl D. Langefeld, * ,† and W. Timothy Garvey *** ,§§§
Department of Biostatistical Sciences,* and Center for Public Health Genomics, † Wake Forest University School of Medicine , Winston-Salem, NC ; Center for Public Health Genomics, § Department of Medicine,** Department of Biochemistry and Molecular Genetics, †† and Department of Public Health Sciences, §§ University of Virginia , Charlottesville, VA ; Department of Nutrition Sciences,*** University of Alabama at Birmingham , AL ; Department of Medicine, ††† Medical University of South Carolina , Charleston, SC ; and Birmingham VA Medical Center , §§§ Birmingham, AL
Abbreviations: BMI, body mass index; CVD, cardiovascular disease; GENNID, Genetics of NonInsulin Dependent Diabetes; GWAS, genome-wide association studies; IDL, intermediate density lipoprotein; LOD, logarithm�of�odds; T2DM, type 2 diabetes mellitus; Project SuGAR, Sea Islands Genetic African American Registry; SNP, single�nucleotide�poly�morphism; TG, triglyceride; UAB, University of Alabama at Birmingham.
1 To whom correspondence should be addressed. e-mail: [email protected]
at Univ of V
irginia Hlth S
ci Ctr C
Moore H
ealth Science Library on A
pril 13, 2010 w
ww
.jlr.orgD
ownloaded from
Genetic architecture of lipoprotein subclasses in African Americans 587
Georgia. These individuals are believed to be direct d escendants of slaves who were forcibly deported from the “rice or windward coast” of West Africa and trans-ported to these areas because their rice-growing exper-tise was critical for the culture of this cash crop in colonial America ( 32 ). Studies of mitochondrial and Y-chromo-somal markers have determined that the genetic distance between the Gullah and Sierra Leonese tribes is shorter than other African-American populations ( 33–36 ). Our intention was to capitalize upon the relative ancestral ho-mogeneity, common diet, and increased prevalence and familial clustering of diabetes to explore the genetic ar-chitecture of these traits in the African-American Gullah population using a high resolution SNP linkage panel. Traditional lipid panel measures were included to calcu-late genetic and environmental correlations between conventional lipid measures and lipoprotein classes and to determine whether underlying genetic contributors to these traits differed.
RESEARCH DESIGN AND METHODS
Subjects This study was conducted under Institutional Review Board
approval from the Medical University of South Carolina, the Uni-versity of Alabama at Birmingham (UAB), and Wake Forest Uni-versity School of Medicine, and adhered to the tenets of the Declaration of Helsinki. Project SuGAR enlisted medical clinics, churches, and established organizations on the Sea Islands to aid in identifying patients with T2DM who belonged to families with multiple affected members ( 37 ). Inclusion criteria included self-described African-American race, at least one T2DM-affected sib-ling pair, no more than one of the parents affected with T2DM, and at least one parent still living. Probands and their parents were all born and raised in the South Carolina low country. Proj-ect SuGAR assessed medical, anthropometrical, and metabolic information on all consenting affected and nonaffected family members. The data were collected based on a multi-page ques-tionnaire, detailed family history and medical history, standard-ized blood pressures, physical examination, body dimensions and estimation of percent body fat, and laboratory testing. Weights were determined using electronic calibrated scales (Detecto, Cleveland, OH) at 8–10AM after voiding and before breakfast. Heights were measured with a portable Harpenden statiometer. Body mass index (BMI) (kg/m 2 ) was calculated. Standard arm, waist, hip, and thigh circumferences were re-corded using a tension-controlled tape measure (Novel Products, Rockton, IL). Laboratory testing included complete blood count, electrolytes, creatinine/BUN, liver function tests, hemoglobin A 1C , fasting lipid panel (cholesterol, triglycerides, HDL), circulat-ing islet cell antibodies (if diabetic), fasting glucose, and urine albumin-creatinine ratio. All participating nondiabetic family members were evaluated with an oral glucose tolerance test or by fasting glucose. Criteria established by the Expert Committee of the American Diabetes Association ( 38 ) were used to defi ne sub-jects as diabetic, impaired fasting glucose, impaired glucose tol-erance, and normal glucose tolerance. Clinical records and medical history were reviewed to exclude individuals with proba-ble type 1 diabetes on the basis of time to insulin dependence and/or islet cell antibodies. When the entire sample was used in the analysis, covariate adjustments were made for diabetes sta-tus, age, gender, BMI, and lipid and hypertension medication.
triglycerides (TG), and HDL are described in the litera-ture ( 14, 15 ), and it is reasonable to expect this type of pleiotropic effect may be observed with the lipoprotein subclasses.
When assessed by the conventional lipid panel, dyslipi-demia in type 2 diabetes mellitus (T2DM) and metabolic syndrome are characterized by high TG and low HDL-C, while total cholesterol and calculated LDL-C are not con-sistently affected ( 15–17 ). However, there is heterogeneity in particle size and density within the major lipoprotein subclasses, which is not measured by the conventional lipid panel, and these alterations can confer cardiovascu-lar disease risk. For example, in the general population, increased levels of small dense LDL ( 18–21 ) and an excess of the small over large HDL particles ( 22, 23 ) have been shown to be associated with increased risk for atheroscle-rosis. The lipoprotein subclasses can be quantifi ed in plasma using NMR. NMR generates unique spectra for dif-ferent lipoprotein subclasses based on a bulk lipid signal that refl ects particle size, with the amplitude being pro-portional to the lipoprotein subclass particle concentra-tion ( 23–26 ).
We used NMR to demonstrate that insulin resistance af-fects subclasses for all 3 principal lipoprotein classes (VLDL, LDL, and HDL) ( 27, 28 ). First, in insulin-resistant individuals, the NMR lipoprotein subclass profi le indi-cated that large VLDL particles, produced primarily by the liver, are markedly increased without consistent changes in medium or small VLDL. This is important because large VLDL particles may confer more cardiovascular disease risk ( 29, 30 ). Second, the NMR data demonstrated a shift of LDL particles from large, buoyant particles to small, dense particles, with the net result of little or no change in overall LDL-cholesterol. This would also result in an ob-served shift to smaller mean LDL particle size. This latter change could also contribute to CVD, because increments in small LDL particle concentration have been shown to represent increased CVD risk, independent of LDL-cholesterol levels ( 21, 31 ). Another important aspect dem-onstrated only in the NMR data was that the total number of LDL particles was increased by insulin resistance, which has also been shown to confer increased risk of cardiovas-cular disease ( 21 ). Third, the NMR data showed that any decrease in HDL-cholesterol was entirely explained by spe-cifi c loss of the cardio-protective large HDL subclass, while noncardio-protective intermediate and small HDL parti-cles may even have increased. Thus, the NMR lipoprotein subclass profi le provides direct measurements relevant to cardiovascular risk that are either not provided or are ob-scured in the conventional lipid profi le. However, little is known about the genetic determinants of lipoprotein sub-class concentration and particle size. The dearth of infor-mation is even more pronounced in minority populations.
We describe the genetic architecture of particle size and concentrations of VLDL, LDL, and HDL subclasses in the context of the Sea Islands Genetic African Ameri-can Registry (Project SuGAR). This project recruited African-Americans living in coastal communities and on the Sea Islands of South Carolina and northeast coastal
at Univ of V
irginia Hlth S
ci Ctr C
Moore H
ealth Science Library on A
pril 13, 2010 w
ww
.jlr.orgD
ownloaded from

588 Journal of Lipid Research Volume 51, 2010
fi rst cousin, and 60 more distant relationship pairs. The num-ber of generations observed varied between two and four, with only 19 pedigrees containing individuals from four different generations. The smallest pedigree contained three people; we observed 11 such pedigrees. The largest pedigree contained 15 people, and the average pedigree size was about 5.6 people. Each marker was examined for Mendelian inconsistencies us-ing PedCheck ( 42 ), and sporadic problem genotypes were con-verted to missing. Map distances were based on the Rutgers’s genetic map ( 43 ). These distances were computed using the Kosambi map function. Where two SNPs displayed LD values of r 2 > 0.3, we removed one SNP of the pair; 230 SNPs were re-moved for this reason.
Statistical analysis We used the variance component approach as implemented
in the program SOLAR ( 44 ) to compute estimates of heritability genetic and environment correlations and to complete the mul-tipoint linkage analyses. Multipoint estimates of allele sharing IBD probability required by SOLAR were computed using MER-LIN ( 45 ). The pedigree sizes analyzed in this study were within the specifi cations of the algorithms employed in MERLIN. Statis-tical analyses were conducted both on the entire sample and on the smaller, but more homogenous, sample of diabetic individu-als only. All analyses were adjusted for sex, age, and BMI. We also adjusted for diabetes status when the statistical analysis was com-puted on the entire sample. Box-Cox transformations were ap-plied as needed to transform lipoprotein variables whose residual distribution deviated signifi cantly from the normality assumption or exhibited heterogeneity of variance.
We also ran bivariate linkage analysis in an effort to identify genes that may have a pleiotropic and/or coincidence effect on a pair of traits. Bivariate linkage analysis exploits the additional information contained in the correlation pattern between the two quantitative traits. It has shown increased power over univari-ate linkage analysis to detect linkage when the phenotypic vari-ables are correlated ( 46, 47 ). We caution that one should not interpret bivariate LOD scores similarly as univariate LOD scores because they follow a different distribution under the null hy-pothesis. LOD scores were obtained at 1 cM intervals for both the univariate and bivariate linkage analyses.
Multiple testing is always a concern whenever a considerable number of tests are conducted. As will be seen in the “Results” section, a number of these traits are highly correlated, which ar-gues against a Bonferroni type adjustment because it will likely be too conservative. Consequently, following the recommendations of Lander and Kruglyak ( 48 ), we decided to display the highest LOD scores observed on each chromosome and focus on ge-nomic regions where a LOD score of 2.2 or higher was observed. We did so because we think that it is important to provide as much detail as possible regarding potentially interesting genomic regions. It is unlikely that more linkage studies will be done in this minority population, and providing details, even if they do not reach genome-wide signifi cance while adjusting for multiple phenotypes, is important. With these results, we are simply sug-gesting that the identifi ed regions can potentially be of interest, particularly in subsequent genome-wide association studies. Ex-amination of the correlation of LOD scores and genetic variation predisposing to complex genetic traits suggest that regions with intermediate LOD scores are potentially of value.
We also provide the LOD-1 interval for these regions. The LOD-1 interval can be seen as the support interval for which the LOD score equals the observed maximum LOD score � 1 ( 49 ). It is in a sense a crude estimate of the 95% confi dence interval around the marker with the highest LOD score in the genomic region under consideration.
There was no need to adjust for diabetes status in the diabetic-only analysis.
Lipoprotein subclasses were measured by LipoScience, Inc.. (Raleigh, NC) using NMR spectroscopy ( 39 ). All measurements were made prior to 2004 and the availability of the NMR LipoPro-fi le-II. The NMR spectrum of each plasma sample was modeled as the sum of the signals from 16 discrete subpopulations of lipo-protein particles: chylomicrons, six VLDL (V1–V6), intermediate density lipoprotein (IDL), three LDL (L1–L3), and fi ve HDL (H1–H5). Our analyses focused on a subset of grouped subclasses with higher measurement precision and stronger cardiovascular disease outcome associations: large VLDL (V5+V6); large, cardio-protective HDL (H4+H5), and small, dense atherogenic LDL (L1).
The current genome scan involved a total of 967 individuals, including 791 T2DM-affected subjects and 176 unaffected rela-tives who were recruited from 418 families. We included all phe-notyped individuals in the ascertained families that were informative for linkage in the full sample analysis and all diabetic individuals who were informative for linkage in the diabetic-only analysis.
Genotyping DNA was extracted from 20–40 ml of venous blood using a
standardized DNA isolation kit (Gentra Systems, Minneapolis, MN). The Project SuGAR registry includes 70 sib-pairs plus avail-able parents, totaling 162 participants who were part of the Ge-netics of NonInsulin Dependent Diabetes (GENNID) study. For the GENNID subjects, blood was sent to the central laboratory for lymphocyte transformation and DNA extraction was per-formed by Coriell Cell Repositories.
A genome-wide linkage scan was completed by the Center for Inherited Disease Research using Illumina’s Human Linkage Panel IVb. The genetic map position for SNPs on this panel is based on the National Center for Biotechnology Information’s build 35. A total of 5,974 SNPs were successfully genotyped, with a mean spacing of 0.65 cM (518 kb). The missing data rate was 0.26% (17,434 missing genotypes/6,626,408 total genotypes), and the Mendelian consistency rate, after correction or removal of likely misspecifi ed relationships as determined using the ge-netic data (see below), was 99.9% (535 events/6,292,704 study genotypes). The blind duplicate reproducibility rate was 99.9% (7 events/321,713 paired genotypes). Thirteen SNPs were re-moved from analyses because they violated Hardy-Weinberg as-sumptions ( P < 0.0001).
Quality control checks Each pedigree was examined for consistency of familial rela-
tionships using the Pedigree Relationship Statistical Test ( 40 ). When the self-reported familial relationships were strongly in-consistent with the genotypic data for that pedigree, then the pedigree was modifi ed when the identity-by-descent statistics suggested a very clear alternative, or the entire genotypic data was converted to missing for those individuals whose familial relationship could not be resolved. A total of 58 pedigrees ( � 14%) exhibited probable misspecifi ed familial relationships and were modifi ed as above. Sibling relationship in 45 pedi-grees had to be changed from full to half sib after reviewing the PREST ( 41 ) output. There were six pedigrees with duplicated samples; we retained the most complete observation from each pair. There were seven pedigrees containing unrelated individ-uals; these individuals were removed prior to the analysis. After modifying all family relationships that appeared to be incon-sistent with the genome scan data, there were a total of 1,196 parent-child, 320 grandparent-child, 36 great grandparent-grandchild, 281 full sibling, 79 half-sibling, 136 avuncular, 34
at Univ of V
irginia Hlth S
ci Ctr C
Moore H
ealth Science Library on A
pril 13, 2010 w
ww
.jlr.orgD
ownloaded from

Genetic architecture of lipoprotein subclasses in African Americans 589
whereas the environmental correlation estimates are shown above the diagonal. The highest genetic correlation estimates are observed between the LDL average particle size and the small LDL particle concentration ( � 0.94) and between the average VLDL particle size and large VLDL particle concentration ( � 0.88). These genetic cor-relations were observed in the diabetic-only analysis. The second strongest genetic correlations in the combined sample are observed between the cardioprotective large HDL particle concentration and the average LDL particle size (0.75) and between the average LDL particle size and triglyceride concentration (0.72). Note that some of these traits have been transformed to satisfy the normality as-sumption made about the distribution of each trait. If an inverse transformation is needed for one trait while no transformation is needed for another one, the sign of the relationship between the two traits will be different than what would be expected if both variables were used on their original scale. Consequently, we suggest that the reader focus more on the absolute value of the correlation estimate, which measures the strength of the correlation instead of its directionality. Subsequent tests for pleiotropy rejected the hypothesis that the genetic correlations were equal to one, a fi nding that suggests these genes might have a differential effect on each trait.
Single trait linkage results We ran linkage analysis on the complete sample as well
as on a reduced sample of diabetic-only individuals. Re-sults for the cholesterol traits were adjusted for the effect of lipid and /or hypertension controlling medications.
Complete sample analysis The maximum LOD scores observed on each chromo-
some are summarized in Table 5 for single trait linkage results using the complete sample. Following the recom-mendations of Kruglyak and Lander ( 48, 50 ), we focus on
RESULTS
Population characteristics The demographic and lipid characteristics for the Proj-
ect SuGAR participants are summarized in Table 1 . The participants were mostly females ( � 77%), about 80% of the family members had T2DM, and 11% of them were taking lipid-controlling medication.
Heritability of lipid related phenotypes Table 2 displays the heritability estimates and their stan-
dard error. These estimates were computed after adjusting for gender, age, diabetes status, BMI, and whether the par-ticipants were on lipid-controlling medication, and range from 0.33 to 0.56. The highest heritability estimates were observed for large VLDL particle concentration (0.56 ± 0.14) and small LDL particle concentration (0.54 ± 0.15), while large HDL particle concentration (0.33+-0.16) and VLDL mean particle size(0.29+-14) had the lowest herita-bility estimates.
The initial bivariate analyses indicate that signifi cant ge-netic and environmental correlation exists between almost all pairs of traits considered ( Tables 3 and 4 ). A star next to a value in Tables 3 and 4 indicates that the P -value cor-responding to the estimated correlation value is between 0.01 and 0.05; 2 stars imply that a P -value is <0.01. These two tables support the hypothesis that shared genetic and environmental factors account for a signifi cant portion of the total variance for most of these traits. In general, a sig-nifi cant nonzero squared genetic correlation between two traits provides a measure of the extent to which they are both affected by the same underlying genetic variants ( 50 ). Estimates of genetic and environmental correlations con-sidering the entire sample are shown in Table 3. Table 4 depicts these estimates when the analysis was restricted to only diabetic individuals. The genetic correlation esti-mates are shown below the main diagonal in both tables,
TABLE 1. Clinical characteristics and measurements of lipids/lipoproteins
Clinical All Subjects
Subjects with T2DM Nondiabetic Subjects
Females Males Females Males
Number N = 967 N = 614 N = 177 N = 127 N = 49Age (years) (mean ± SD) 52.7 ± 15.5 55.0 ± 14.2 55.0 ± 15.0 45.0 ± 16.1 36.2 ± 15.6BMI (kg/m2) (mean ± SD) 33.5 ± 7.9 34.3 ± 7.9 31.3 ± 6.53 34.1 ± 8.7 29.3 ± 7.4HbA1c (%) (mean ± SD) 8.87 ± 2.22 8.94 ± 2.13 8.85 ± 2.41 5.79 ± 0.97 NA% Taking lipid-lowering medications 11.89% 14.73% 10.98% 2.84% 0.57%
Conventional Lipid Panel
Total cholesterol (mg/dl) (mean ± SD) 196.7 ± 44. 200.8 ± 44.8 190.9 ± 44.8 191.0 ± 43.4 183.0 ± 42.0TG (mg/dl) (mean ± SD) 124.2 ± 85.1 128.0 ± 78.8 139.7 ± 110.8 91.6 ± 63.3 107.6 ± 83.4HDL cholesterol (mg/dl) (mean ± SD) 49.0 ± 14.0 50.2 ± 13.6 43.2 ± 13.2 52.6 ± 15.0 46.2 ± 13.3Calculated LDL cholesterol (mg/dl) (mean ± SD) 124.2 ± 40.0 126.1 ± 40.8 123.1 ± 39.7 119.3 ± 37.7 117.1 ± 36.8VLDL (mean ± SD) 23.1 ± 12.5 24.2 ± 12.6 24.5 ± 12.3 17.4 ± 10.6 19.5 ± 11.6
NMR Lipoprotein Subclass Analysis
Large VLDL particle concentration (mg/dl) (mean ± SD 22.6 ± 38.9 22.0 ± 36.8 33.9 ± 54.2 11.1 ± 17.6 14.3 ± 23.5VLDL mean particle size (nm) (mean ± SD) 45.7 ± 7.4 45.8 ± 7.3 47.0 ± 8.6 43.2 ± 5.5 46.1 ± 8.4Small LDL particle concentration (mg/dl) (mean ± SD) 20.1 ± 29.4 18.3 ± 28.3 31.7 ± 36.1 15.3 ± 23.4 10.8 ± 13.6LDL mean particle size (nm) (mean ± SD) 21.0 ± 0.6 21.0 ± 0.6 20.7 ± 0.7 21.2 ± 0.6 21.1 ± 0.4Large HDL particle concentration (mg/dl) (mean ± SD) 23.7 ± 11.5 25.0 ± 11.5 18.0 ± 10.04 25.8 ± 12.0 19.5 ± 7.0HDL mean particle size (nm) (mean ± SD) 9.0 ± 0.4 9.0 ± 0.4 8.8 ± 0.4 9.1 ± 0.4 9.0 ± 0.4
at Univ of V
irginia Hlth S
ci Ctr C
Moore H
ealth Science Library on A
pril 13, 2010 w
ww
.jlr.orgD
ownloaded from

590 Journal of Lipid Research Volume 51, 2010
TABLE 2. Heritability estimates for lipid related traits
Quantitative Traits Heritability (h 2 ± SD), ( P -value)
Large VLDL particle concentration (mg/dl)
0.56 ± 0.14, (0.00008)
VLDL mean particle size (nm) 0.29 ± 0.14, (0.02)Small LDL particle concentration
(mg/dl)0.54 ± 0.15, (0.0003)
LDL mean particle size (nm) 0.46 ± 0.15, (0.002)Large HDL concentration (mg/dl) 0.33 ± 0.16, (0.02)HDL mean particle size (nm) 0.41 ± 0.17, (0.007)Triglyceride concentration (mg/dl) 0.37 ± 0.11, (0.00046)
LOD scores � 2.2. Two such LOD scores were observed. The largest, a LOD score of 3.0, was detected on chromo-some 6p24 for small LDL particle concentration. The SNP corresponding to this LOD score was rs1328132. The LOD-1 interval spans about 12 cM and is determined by rs2815155 to the left and rs1891284 to the right. The sec-ond largest, a LOD score of 2.2, was identifi ed on chromo-some 10p11 for large VLDL particle concentration. This LOD score was observed with rs867992. Its accompanying LOD-1 interval spans about 6 cM starting at rs959629 and ending at rs1441027.
Six other regions of the genome yielded LOD scores that were between 1.5 and 2.2. We present these results here in an effort to provide as complete a summary as pos-sible given that they were obtained in such a unique popu-lation. We also note that these results can potentially be useful in efforts to prioritize marker selection following other studies, including genome-wide association studies ( 51 ). Two of these LOD scores were observed for large VLDL particle concentration on chromosome 3p26 (LOD score = 1.7) and on chromosome 5p15 (LOD score = 1.7). A LOD score of 1.7 was also observed on chromosome 9p24 for LDL mean particle size. Two additional linkage signals were detected for small LDL particle concentra-tion: the fi rst was located on chromosome 12p24 and the second on chromosome 18q21. Finally, a LOD score of 1.5 was observed on chromosome 9p11 for TG concentration. There were no LOD scores above this threshold for large HDL particle concentration, HDL mean particle size, and VLDL mean particle size.
In summary, large VLDL particle concentration and small LDL particle concentration both display substantial evidence of linkage at various genomic regions, albeit none of them reached genome-wide statistical signifi cance according to thresholds set in Lander and Kruglyak ( 48 ).
Diabetics-only analysis We also completed a linkage analysis on the sample of
diabetic individuals. These results are shown in Table 6 . Some of the diabetic sample linkage signals yielded maxi-mum LOD scores that varied in magnitude and location relative to that of the entire sample. This is to be expected with different partitions of the data. The LOD score of 3.0 observed on chromosome 6p24 for small LDL particle concentration was now reduced to 1.7. However, the LOD score of 1.3 observed on chromosome 20p13 for small LDL particle concentration strengthened to 2.7 in the
TA
BL
E 3
. G
enet
ic a
nd
envi
ron
men
tal c
orre
lati
on in
the
com
bin
ed s
ampl
e
Trai
ts
Lar
ge V
LD
L
Part
icle
Con
cent
ratio
n
(mg/
dl)
VL
DL
Mea
nPa
rtic
le S
ize
(nm
)
Smal
l LD
L
Part
icle
C
once
ntra
tion
(mg/
dl)
LD
L M
ean
Pa
rtic
le S
ize
(nm
)
Lar
ge H
DL
Pa
rtic
le
Con
cent
ratio
n(m
g/dl
)
HD
L M
ean
Part
icle
Siz
e(n
m)
Trig
lyce
ride
C
once
ntra
tion
(mg/
dl)
Tota
lC
hol
este
rol
HD
LC
hol
este
rol
LD
LC
hol
este
rol
VL
DL
Ch
oles
tero
l
Lar
ge V
LD
L p
arti
cle
con
cen
trat
ion
(m
g/dl
) N
A
� 0.
75 *
*0.
14 *
* �
0.53
**
� 0.
30 *
*0.
31 *
* �
0.75
**
� 0.
24 *
* �
0.16
**
� 0.
338
** �
0.77
**
VL
DL
mea
npa
rtic
le s
ize
(nm
) �
0.88
**
NA
�
0.19
**
0.41
**
0.07
00.
26 *
*0.
17 *
*0.
08 *
0.35
**
0.28
**
Smal
l LD
L p
arti
cle
con
cen
trat
ion
(m
g/dl
)0.
53 *
* �
0.12
**
NA
�
0.94
**
� 0.
43 *
*0.
45 *
* �
0.30
**
0.12
**
� 0.
17 *
0.12
**
� 0.
31 *
*
LD
L m
ean
part
icle
siz
e (n
m)
� 0.
61 *
*0.
25 *
* �
0.53
**
NA
0.
64 *
* �
0.66
**
0.47
**
0.04
0.37
**
0.54
**
0.47
**
Lar
ge H
DL
par
ticl
e co
nce
ntr
atio
n (
mg/
dl)
� 0.
44 *
*0.
23 *
* �
0.71
**
0.75
**
NA
0.
72 *
*0.
42 *
* �
0.09
*0.
79 *
* �
0.22
**
0.45
**
HD
L m
ean
part
icle
siz
e (n
m)
0.49
**
� 0.
39 *
*0.
60 *
* �
0.63
**
0.47
**
NA
�
0.42
**
0.32
**
� 0.
6 **
0.37
**
� 0.
47 *
*
Trig
lyce
ride
con
cen
trat
ion
(m
g/dl
) �
0.63
**
0.46
**
� 0.
38 *
*0.
72 *
*0.
33 *
* �
0.53
**
NA
�
0.28
**
0.32
**
� 0.
26 *
*0.
99 *
*
Tota
l ch
oles
tero
l0.
40 *
*0.
17 *
*0.
13 *
* �
0.15
**
0.04
� 0.
11 *
* �
0.43
**
NA
0.
20 *
*0.
94 *
* �
0.30
**
HD
L c
hol
este
rol
� 0.
44 *
*0.
12 *
* �
0.53
**
0.68
**
0.85
**
� 0.
60 *
*0.
23 *
*0.
20 *
* N
A
1 **
0.30
**
LD
L c
hol
este
rol
0.38
**
0.33
**
0.17
**
0.46
**
� 0.
003
� 0.
06 �
0.18
**
0.91
**
0.73
**
NA
�
0.22
**
VL
DL
ch
oles
tero
l �
0.60
**
0.41
**
� 0.
39 *
*0.
71 *
*0.
30 *
* �
0.44
**
0.99
**
� 0.
46 *
*0.
22 *
* �
0.22
**
NA
Th
e n
umbe
rs s
how
n a
bove
the
diag
onal
(in
bol
d) r
epre
sen
t th
e en
viro
nm
ent c
orre
lati
on w
her
eas
num
bers
bel
ow th
e di
agon
al r
epre
sen
t th
e ge
net
ic c
orre
lati
ons.
*, P
-val
ue b
etw
een
0.0
1 an
d 0.
05.
**, P
-val
ue <
0.0
1.
at Univ of V
irginia Hlth S
ci Ctr C
Moore H
ealth Science Library on A
pril 13, 2010 w
ww
.jlr.orgD
ownloaded from

Genetic architecture of lipoprotein subclasses in African Americans 591
TA
BL
E 4
. G
enet
ic a
nd
envi
ron
men
tal c
orre
lati
on in
the
diab
etic
on
ly s
ampl
es
Trai
ts
Lar
ge V
LD
L
Part
icle
C
once
ntra
tion
(m
g/dl
)
VL
DL
Mea
nPa
rtic
le S
ize
(nm
)
Smal
l LD
LPa
rtic
leC
once
ntra
tion
(mg/
dl)
LD
L M
ean
Part
icle
Siz
e(n
m)
Lar
ge H
DL
Pa
rtic
le
Con
cent
ratio
n(m
g/dl
)
HD
L M
ean
Part
icle
Siz
e(n
m)
Trig
lyce
ride
Con
cen
trat
ion
(mg/
dl)
Tota
lC
hol
este
rol
HD
LC
hol
este
rol
LD
L C
hol
este
rol
VL
DL
C
hol
este
rol
Lar
ge V
LD
Lpa
rtic
leco
nce
ntr
atio
n (
mg/
dl)
NA
�
0.81
**
� 0.
31 *
* �
0.12
* �
0.15
**
0.11
* �
0.67
**
� 0.
53 *
* �
0.24
**
� 0.
57 *
* �
0.68
**
VL
DL
mea
npa
rtic
le s
ize
(nm
) �
0.92
**
NA
0.
004
0.35
**
0.03
0.04
0.27
**
0.11
**
0.32
**
0.72
**
0.26
**
Smal
l LD
Lpa
rtic
le
con
cen
trat
ion
(m
g/dl
)
0.85
**
� 0.
41 *
* N
A
� 0.
31 *
* �
0.31
**
0.58
**
0.03
0.03
0.01
0.11
* �
0.00
2
LD
L m
ean
part
icle
siz
e (n
m)
� 0.
86 *
*0.
52 *
* �
0.94
**
NA
0.
53 *
* �
0.54
**
0.18
**
0.28
**
0.17
**
0.10
*0.
23 *
*
Lar
ge H
DL
part
icle
co
nce
ntr
atio
n (
mg/
dl)
� 0.
64 *
*0.
38 *
* �
0.92
**
0.87
**
NA
�
0.87
**
0.27
**
0.03
0.79
**
� 0.
20 *
*0.
28 *
*
HD
L m
ean
part
icle
siz
e (n
m)
0.64
**
� 0.
50 *
*0.
47 *
* �
0.71
**
� 0.
88 *
* N
A
� 0.
28 *
*0.
25 *
* �
0.67
**
0.43
**
� 0.
32 *
*
TG co
nce
ntr
atio
n (
mg/
dl)
� 0.
67 *
*0.
44 *
* �
0.68
**
0.93
**
0.68
**
� 0.
70 *
* N
A
� 0.
23 *
*0.
39 *
* �
0.22
**
0.99
**
Tota
lch
oles
tero
l0.
58 *
*0.
42 *
*0.
24 *
* �
0.32
**
� 0.
19 *
*0.
03 �
0.43
**
NA
0.
09 *
0.97
**
� 0.
28 *
*
HD
Lch
oles
tero
l �
0.36
**
� 0.
05 �
0.63
**
0.73
**
0.85
**
� 0.
55 *
*0.
23 *
*0.
29 *
* N
A
� 0.
005
0.37
**
LD
L chol
este
rol
0.50
**
� 0.
73 *
*0.
22 *
* �
0.19
**
� 0.
06 �
0.07
� 0.
24 *
*0.
90 *
* �
0.00
8 N
A
� 0.
18 *
*
VL
DL
chol
este
rol
� 0.
67 *
*0.
45 *
* �
0.69
**
0.92
**
0.72
**
� 0.
67 *
*0.
99 *
* �
0.44
**
0.22
**
� 0.
26 *
* N
A
Th
e n
umbe
rs s
how
n a
bove
the
diag
onal
(bo
ld)r
epre
sen
t th
e en
viro
nm
ent c
orre
lati
on, w
her
eas
num
bers
bel
ow th
e di
agon
al r
epre
sen
t th
e ge
net
ic c
orre
lati
ons.
*, P
-val
ue b
etw
een
0.0
1 an
d 0.
05.
**, P
-val
ue le
ss th
an 0
.01.
at Univ of V
irginia Hlth S
ci Ctr C
Moore H
ealth Science Library on A
pril 13, 2010 w
ww
.jlr.orgD
ownloaded from

592 Journal of Lipid Research Volume 51, 2010
mosome 10p11 for large VLDL particle concentration, which as described above has a LOD-1 interval that spans about 6 cM starting at rs959629 and ending at rs1441027.
Bivariate linkage analysis The bivariate analyses support the univariate linkage
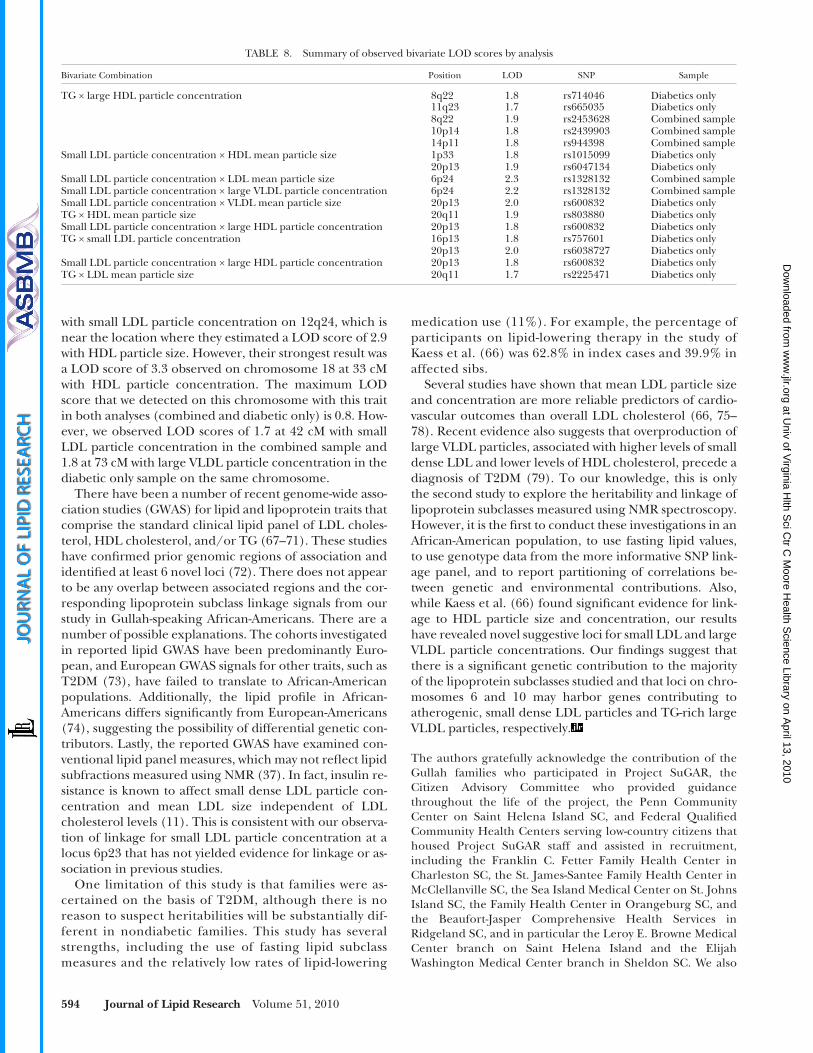
signal identifi ed on chromosome 6 for small LDL particle concentration. The largest bivariate LOD score (2.3) was observed at 6p24 when analyzed with LDL mean particle size, and the second largest score (2.2) was located at the same position, but it was observed with large VLDL parti-
TABLE 5. Maximum LOD score obtained with single point linkage analysis of each trait using the combined sample
Chromo some
Large HDL Particle Concentration
(mg/dl)
HDL MeanParticle Size
(nm)
Small LDL ParticleConcentration
(mg/dl)
LDL MeanParticle Size
(nm)
TGConcentration
(mg/dl)
Large VLDL ParticleConcentration
(mg/dl)
VLDL MeanParticle Size
(nm)
position LOD position LOD position LOD position LOD position LOD position LOD position LOD
1 68 0.7 73 0.2 55 0.8 59 0.5 63 0.3 88 1.3 220 0.9 2 117 0.2 259 0.4 261 0.4 261 0.2 262 0.7 260 0.8 2 0.4 3 168 1.1 167 1.5 85 0.8 85 0.5 43 0.4 35 1.7 132 0.7 4 104 0.3 30 0.8 48 0.7 35 0.4 81 0.3 30 0.6 3 1.1 5 174 0.6 174 0.1 31 0.6 126 0.5 125 0.8 64 1.7 67 0.5 6 38 0.6 39 0.8 23 3.0 18 0.2 139 0.8 89 0.5 83 0.6 7 3.9 0.3 126 1.2 43 1.3 39 0.7 39 0.3 167 1.2 180 0.7 8 16 0.4 17 0.8 7.9 0.5 7.9 1.1 24 0.4 106 1.3 125 1.3 9 35 0.3 67 0.9 35 1.2 47 1.7 44 1.5 60 1.0 69 0.210 104 0.7 108 0.8 146 1.3 107 0.3 97 0.6 59 2.2 21 1.011 81 0.3 83 0.4 154 0.4 154 0.2 120 0.0 45 0.5 87 0.512 154 0.1 67 0.0 127 1.6 59 0.9 19 1.2 32 1.2 36 0.913 55 0.5 29 0.4 55 0.0 106 0.9 91 0.3 128 0.3 26 0.114 30 0.2 2 0.0 107 0.2 105 0.1 26 0.3 49 0.2 26 0.515 114 0.1 122 0.4 120 0.7 130 0.3 37 0.2 129 0.7 47 0.516 101 0.0 57 0.1 130 0.7 65 0.2 4 0.4 63 0.8 82 0.817 120 0.1 122 0.1 69 0.3 89 0.3 116 0.4 95 0.2 97 0.218 31 0.8 95 0.2 42 1.7 43 0.2 43 0.1 73 1.5 71 1.119 64 0.7 59 0.8 51 0.28 56 0.6 49 0.5 53 0.4 49 0.320 63 0.5 32 0.7 8.8 1.26 24 0.7 24 0.2 23 0.6 17 0.721 7.6 0.1 7.6 0.0 47 0.16 45 0.5 45 0.4 45 0.1 7.6 0.022 0 0.0 53 0.1 42 0.21 12 0.1 44 0.5 36 0.3 34 0.2
TABLE 6. Maximum LOD score obtained with single point linkage analysis of each trait using only the diabetic individuals
Chromo some
Large HDL Particle Concentration
(mg/dl)
HDL Mean Particle
Size(nm)
Small LDL ParticleConcentration
(mg/dl)
LDL Mean Particle
Size(nm)
TGConcentration
(mg/dl)
Large VLDL ParticleConcentration
(mg/dl)
VLDL Mean Particle
Size(nm)
Position LOD Position LOD Position LOD Position LOD Position LOD Position LOD Position LOD
1 59 0.4 59 0.3 54 1.4 69 0.5 53 0.8 260 0.8 131 0.4 2 101 0.5 102 0.9 100 0.8 57 0.3 55 0.8 253 0.5 180 0.3 3 168 0.8 167 1.6 85 0.3 160 0.1 167 0.7 31 1.5 39 0.5 4 30 0.6 30 1.1 42 0.6 18 0.4 16 0.6 3 1.2 128 0.6 5 174 0.4 174 0.3 26 0.4 150 0.2 124 0.3 67 0.6 67 0.2 6 28 0.6 22 0.9 23 1.7 103 0.4 7.9 0.6 89 1.2 93 0.5 7 3.9 0.4 126 1.4 38 1.2 12 0.1 39 0.8 35 0.9 187 0.6 8 16 0.3 16 0.5 9.9 0.2 142 0.4 0 0.6 128 1.5 124 0.8 9 104 0.2 104 0.7 35 0.7 47 0.5 84 1.0 65 1.1 120 0.310 104 1.2 108 0.9 101 1.7 34 0.3 108 1.0 60 2.4 34 0.811 79 0.3 81 0.4 85 0.2 128 0.1 69 0.4 120 1.0 73 0.312 154 0.2 154 0.1 155 2.2 39 0.6 19 0.8 32 1.4 24 0.513 55 0.2 29 0.3 55 0.3 95 0.6 91 0.4 26 0.2 110 0.414 28 0.2 2 0.0 28 0.1 16 0.1 66 1.0 26 0.1 26 0.315 112 0.3 120 0.3 97 0.5 65 0.0 38 0.8 17 1.3 47 0.416 55 0.1 8.9 0.6 6 2.3 83 0.1 127 0.6 87 0.7 86 0.717 30 0.1 59 0.3 66 0.8 87 0.1 125 0.9 101 0.2 97 0.418 93 0.6 93 0.6 42 1.3 12 0.1 99 0.2 73 1.8 72 0.819 63 0.7 63 1.0 2 0.4 73 0.4 51 0.4 106 0.2 49 0.320 31 0.8 35 1.6 8.8 2.7 5.9 0.4 30 1.1 16 2.0 16 0.821 7.6 0.2 7.6 0.0 5.7 0.1 35 0.0 5.7 0.2 5.7 0.3 35 0.122 0 0.0 0 0.1 75 0.0 9.9 0.2 34 0.3 30 0.1 30 0.1
diabetic-only sample. This LOD score was observed near rs600832 and its LOD-1 interval spans 17 cM starting at rs1342137 and ending at rs755662. The LOD score of 2.2 observed on chromosome 10p11 with the complete sam-ple also increased to 2.4 with the reduced sample.
In summary, four LOD scores > 2.2 were observed in the analysis conducted on the diabetic-only subset compared with three in the combined sample. Three of these LOD scores were identifi ed with the same trait, small LDL parti-cle concentration, on chromosomes 12q24, 16p13, and 20p13. The fourth LOD score > 2.2 was observed on chro-
at Univ of V
irginia Hlth S
ci Ctr C
Moore H
ealth Science Library on A
pril 13, 2010 w
ww
.jlr.orgD
ownloaded from
Genetic architecture of lipoprotein subclasses in African Americans 593
Previous reports have found an overall correlation of � 0.80 between these traits (55), but partitioning between genetic ( � 0.94) and environmental ( � 0.53) correlations suggests a stronger genetic contribution, possibly through a gene with a pleiotropic effect on both traits. The strong correlation between VLDL particle size and large VLDL particle concentration ( � 0.88) is similarly predictable. The genetic correlation between small LDL particle con-centration and TG level is estimated at 0.72. The correla-tion between these two traits has been observed even in nonobese, normolipidemic individuals ( 15, 56 ) and un-derscores the fact that the dyslipidemia associated with insulin-resistant states is routinely characterized by high TG and an increase in small dense LDL particles.
The largest LOD score observed was equal to 3.0, which is considered the threshold that must be reached before any linkage fi nding can be considered statistically signifi -cant. However, we think that LOD scores � 2.2, as sug-gested by many before us, are suggestive of genomic regions that may harbor genes that infl uence these traits.
Single locus linkage analyses reveal various genomic re-gions that might host possible genes that affect these traits. The strongest signals are observed on chromosome 6p24 for small LDL particle concentration, and on chromosome 10p11 for large VLDL particle concentration ( Table 5 ). We note that these two traits also had the highest heritabil-ity estimates ( Table 2 ). One promising candidate under the 6p small LDL particle concentration signal is the gene for elongation of very long chain fatty acids 2, an elongase of PUFA ( 57 ). There do not appear to be any obvious known candidates under the chromosome 10 signal for large VLDL particle concentration. We also found sugges-tive evidence of linkage in other regions for these two traits and others ( Table 5 ). Interestingly, the 9p LOD-1 intervals for the modest LDL mean particle size and TG concentration signals overlap with a linkage signal for TG in African-Americans ( 58 ) and encompass a region previ-ously associated with CAD and T2DM ( 59 ). There do not appear to be any other overlaps with prior linkage studies in African-derived populations of standard lipid panel traits ( 60–64 ) or lipoprotein subclasses determined using polyacrylamide gel electrophoresis ( 29 ). However, evi-dence of linkage in this region was previously found in four large multi-generational pedigrees of European de-scent ( 65 ).
The only other study to date of heritability and linkage of lipid subclasses has been conducted in a German popu-lation ( 66 ). This study found a similar range of heritability estimates but showed no apparent overlap of linkage with our results. However, we did observe a LOD score of 1.6
cle concentration. LOD scores between 1.8 and 1.9 were also observed with large VLDL particle concentration and TG at 4p16 (LOD = 1.9), 1 cM on chromosome 14p13 (LOD = 1.8), and at 10p12 (LOD = 1.81).
The highest linkage signal (LOD = 2.02) observed af-ter the sample was reduced to diabetics only was on chro-mosome 20p13 for the bivariate effect of VLDL mean particle size and small LDL particle concentration Table 7 . This signal was identifi ed with rs600832; its LOD-1 inter-val, which spans 17 cM, starts with rs1342137 and ends with rs755662. Suggestive evidence for bivariate linkage can be found on chromosome 8p23 (LOD = 1.8) and on chromosome 11q24 (LOD = 1.7) for TG and large HDL particle concentration. Bivariate linkage signals � 2.0 are summarized in Table 8 . We note that the choice of 2.0 is arbitrary, as Kruglyak and Lander’s (48,50) recom-mendation will not apply for the bivariate linkage analy-sis, because the distribution of the LOD scores under the null hypothesis is different than that of the univariate LOD score.
DISCUSSION
African-Americans from the Sea Islands of South Caro-lina remain a relatively homogenous population with lim-ited European ancestral genetic admixture and have managed to conserve a relatively substantial portion of their African heritage and culture. Project SuGAR was de-signed to recruit families with T2DM for genetic studies. Sale et al. identifi ed ( 52 ) genomic regions showing evi-dence of linkage with T2DM in this population. The prin-cipal aim of our analysis was to evaluate the relative infl uence of genes and environment on mean size of VLDL, LDL, and HDL lipoprotein classes, as well as parti-cle concentrations for lipoprotein subclasses known to have signifi cant effects on various cardiovascular out-comes ( 52, 53 ).
All the lipid traits considered in this analysis display evi-dence of familial aggregation. Large VLDL particle con-centration and small dense LDL particle concentration have the two strongest heritability estimates, 0.56 and 0.54, respectively. However, even the lowest heritability values were close to 0.30, suggesting a substantial genetic contri-bution to small particle size and concentration for all lipid traits. Although these lipoprotein traits have not been ex-tensively studied, the heritability estimate of the total LDL particle concentration is in line with previously published estimates ( 15, 54 ). As expected, the genetic correlation be-tween LDL particle size and particle concentration is high.
TABLE 7. Summary of LOD scores greater than 2.2 for the single locus analysis
Trait
Combined Sample Diabetics Only
Position LOD SNP Position LOD SNP
Small LDL particle concentration (mg/dl) 6p24 3.0 rs132813212q24 2.2 rs648922616p13 2.3 rs75760120p13 2.7 rs600832
Large VLDL particle concentration (mg/dl) 10p11 2.2 rs867992 10p11 2.4 rs727345
at Univ of V
irginia Hlth S
ci Ctr C
Moore H
ealth Science Library on A
pril 13, 2010 w
ww
.jlr.orgD
ownloaded from
594 Journal of Lipid Research Volume 51, 2010
medication use (11%). For example, the percentage of participants on lipid-lowering therapy in the study of Kaess et al. ( 66 ) was 62.8% in index cases and 39.9% in affected sibs.
Several studies have shown that mean LDL particle size and concentration are more reliable predictors of cardio-vascular outcomes than overall LDL cholesterol ( 66, 75–78 ). Recent evidence also suggests that overproduction of large VLDL particles, associated with higher levels of small dense LDL and lower levels of HDL cholesterol, precede a diagnosis of T2DM ( 79 ). To our knowledge, this is only the second study to explore the heritability and linkage of lipoprotein subclasses measured using NMR spectroscopy. However, it is the fi rst to conduct these investigations in an African-American population, to use fasting lipid values, to use genotype data from the more informative SNP link-age panel, and to report partitioning of correlations be-tween genetic and environmental contributions. Also, while Kaess et al. ( 66 ) found signifi cant evidence for link-age to HDL particle size and concentration, our results have revealed novel suggestive loci for small LDL and large VLDL particle concentrations. Our fi ndings suggest that there is a signifi cant genetic contribution to the majority of the lipoprotein subclasses studied and that loci on chro-mosomes 6 and 10 may harbor genes contributing to atherogenic, small dense LDL particles and TG-rich large VLDL particles, respectively.
The authors gratefully acknowledge the contribution of the Gullah families who participated in Project SuGAR, the Citizen Advisory Committee who provided guidance throughout the life of the project, the Penn Community Center on Saint Helena Island SC, and Federal Qualifi ed Community Health Centers serving low-country citizens that housed Project SuGAR staff and assisted in recruitment, including the Franklin C. Fetter Family Health Center in Charleston SC, the St. James-Santee Family Health Center in McClellanville SC, the Sea Island Medical Center on St. Johns Island SC, the Family Health Center in Orangeburg SC, and the Beaufort-Jasper Comprehensive Health Services in Ridgeland SC, and in particular the Leroy E. Browne Medical Center branch on Saint Helena Island and the Elijah Washington Medical Center branch in Sheldon SC. We also
with small LDL particle concentration on 12q24, which is near the location where they estimated a LOD score of 2.9 with HDL particle size. However, their strongest result was a LOD score of 3.3 observed on chromosome 18 at 33 cM with HDL particle concentration. The maximum LOD score that we detected on this chromosome with this trait in both analyses (combined and diabetic only) is 0.8. How-ever, we observed LOD scores of 1.7 at 42 cM with small LDL particle concentration in the combined sample and 1.8 at 73 cM with large VLDL particle concentration in the diabetic only sample on the same chromosome.
There have been a number of recent genome-wide asso-ciation studies (GWAS) for lipid and lipoprotein traits that comprise the standard clinical lipid panel of LDL choles-terol, HDL cholesterol, and/or TG ( 67–71 ). These studies have confi rmed prior genomic regions of association and identifi ed at least 6 novel loci ( 72 ). There does not appear to be any overlap between associated regions and the cor-responding lipoprotein subclass linkage signals from our study in Gullah-speaking African-Americans. There are a number of possible explanations. The cohorts investigated in reported lipid GWAS have been predominantly Euro-pean, and European GWAS signals for other traits, such as T2DM ( 73 ), have failed to translate to African-American populations. Additionally, the lipid profi le in African-Americans differs signifi cantly from European-Americans ( 74 ), suggesting the possibility of differential genetic con-tributors. Lastly, the reported GWAS have examined con-ventional lipid panel measures, which may not refl ect lipid subfractions measured using NMR ( 37 ). In fact, insulin re-sistance is known to affect small dense LDL particle con-centration and mean LDL size independent of LDL cholesterol levels ( 11 ). This is consistent with our observa-tion of linkage for small LDL particle concentration at a locus 6p23 that has not yielded evidence for linkage or as-sociation in previous studies.
One limitation of this study is that families were as-certained on the basis of T2DM, although there is no reason to suspect heritabilities will be substantially dif-ferent in nondiabetic families. This study has several strengths, including the use of fasting lipid subclass measures and the relatively low rates of lipid-lowering
TABLE 8. Summary of observed bivariate LOD scores by analysis
Bivariate Combination Position LOD SNP Sample
TG × large HDL particle concentration 8q22 1.8 rs714046 Diabetics only11q23 1.7 rs665035 Diabetics only8q22 1.9 rs2453628 Combined sample10p14 1.8 rs2439903 Combined sample14p11 1.8 rs944398 Combined sample
Small LDL particle concentration × HDL mean particle size 1p33 1.8 rs1015099 Diabetics only20p13 1.9 rs6047134 Diabetics only
Small LDL particle concentration × LDL mean particle size 6p24 2.3 rs1328132 Combined sampleSmall LDL particle concentration × large VLDL particle concentration 6p24 2.2 rs1328132 Combined sampleSmall LDL particle concentration × VLDL mean particle size 20p13 2.0 rs600832 Diabetics onlyTG × HDL mean particle size 20q11 1.9 rs803880 Diabetics onlySmall LDL particle concentration × large HDL particle concentration 20p13 1.8 rs600832 Diabetics onlyTG × small LDL particle concentration 16p13 1.8 rs757601 Diabetics only
20p13 2.0 rs6038727 Diabetics onlySmall LDL particle concentration × large HDL particle concentration 20p13 1.8 rs600832 Diabetics onlyTG × LDL mean particle size 20q11 1.7 rs2225471 Diabetics only
at Univ of V
irginia Hlth S
ci Ctr C
Moore H
ealth Science Library on A
pril 13, 2010 w
ww
.jlr.orgD
ownloaded from

Genetic architecture of lipoprotein subclasses in African Americans 595
15 . Kullo , I. J. , M. de Andrade , E. Boerwinkle , J. P. McConnell , S. L. Kardia , and S. T. Turner . 2005 . Pleiotropic genetic effects con-tribute to the correlation between HDL cholesterol, triglycerides, and LDL particle size in hypertensive sibships. Am. J. Hypertens. 18 : 99 – 103 .
16 . McFarlane , S. I. , M. Banerji , and J. R. Sowers . 2001 . Insulin re-sistance and cardiovascular disease. J. Clin. Endocrinol. Metab. 86 : 713 – 718 .
17 . Ayyobi , A. F. , and J. D. Brunzell . 2003 . Lipoprotein distribution in the metabolic syndrome, type 2 diabetes mellitus, and familial com-bined hyperlipidemia. Am. J. Cardiol. 92 : J 27 – 33 .
18 . Cromwell , W. C. , J. D. Otvos , M. J. Keyes , M. J. Pencina , L. Sullivan , R. S. Vasan , P. W. F. Wilson , and R. B. D’Agostino . 2007 . LDL particle number and risk of future cardiovascular disease in the Framingham Offspring Study: implications for LDL management. J. Clin. Lipidol. 1 : 583 – 592 .
19 . Reaven , G. M. 2004 . Insulin resistance, cardiovascular disease, and the metabolic syndrome: how well do the emperor’s clothes fi t? Diabetes Care . 27 : 1011 – 1012 .
20 . Gardner , C. D. , S. P. Fortmann , and R. M. Krauss . 1996 . Association of small low-density lipoprotein particles with the incidence of cor-onary artery disease in men and women. JAMA . 276 : 875 – 881 .
21 . Lamarche , B. , A. Tchernof , S. Moorjani , B. Cantin , G. R. Dagenais , P. J. Lupien , and J. P. Despres . 1997 . Small, dense low-density lipo-protein particles as a predictor of the risk of ischemic heart disease in men. Prospective results from the Quebec Cardiovascular Study. Circulation . 95 : 69 – 75 .
22 . Assmann , G. , and A. M. Gotto , Jr . 2004 . HDL cholesterol and pro-tective factors in atherosclerosis. Circulation . 109 : III8 – III14 .
23 . Rosenson , R. S. , J. D. Otvos , and D. S. Freedman . 2002 . Relations of lipoprotein subclass levels and low-density lipoprotein size to progression of coronary artery disease in the Pravastatin Limitation of Atherosclerosis in the Coronary Arteries (PLAC-I) trial. Am. J. Cardiol. 90 : 89 – 94 .
24 . Otvos , J. D. 2002 . Measurement of lipoprotein subclass profi les by nuclear magnetic resonance spectroscopy. Clin. Lab. 48 : 171 – 180 .
25 . Shao , B. , and J. W. Heinecke . 2009 . HDL, lipid peroxidation, and atherosclerosis. J. Lipid Res. 50 : 599 – 601 .
26 . Freedman , D. S. , J. D. Otvos , E. J. Jeyarajah , J. J. Barboriak , A. J. Anderson , and J. A. Walker . 1998 . Relation of lipoprotein sub-classes as measured by proton nuclear magnetic resonance spec-troscopy to coronary artery disease. Arterioscler. Thromb. Vasc. Biol. 18 : 1046 – 1053 .
27 . Garvey , W. T. , S. Kwon , D. Zheng , S. Shaughnessy , P. Wallace , A. Hutto , K. Pugh , A. J. Jenkins , R. L. Klein , and Y. Liao . 2003 . Effects of insulin resistance and type 2 diabetes on lipoprotein subclass particle size and concentration determined by nuclear magnetic resonance. Diabetes . 52 : 453 – 462 .
28 . Liao , Y. , S. Kwon , S. Shaughnessy , P. Wallace , A. Hutto , A. J. Jenkins , R. L. Klein , and W. T. Garvey . 2004 . Critical evaluation of adult treatment panel III criteria in identifying insulin resistance with dyslipidemia. Diabetes Care . 27 : 978 – 983 .
29 . Kullo , I. J. , K. Ding , E. Boerwinkle , S. T. Turner , and M. de Andrade . 2006 . Quantitative trait loci infl uencing low density lipoprotein particle size in African Americans. J. Lipid Res. 47 : 1457 – 1462 .
30 . Oberman , A. 2000 . Hypertriglyceridemia and coronary heart dis-ease. J. Clin. Endocrinol. Metab. 85 : 2098 – 2105 .
31 . Austin , M. A. 1996 . Genetic epidemiology of dyslipidaemia and atherosclerosis. Ann. Med . 28 : 459 – 463 .
32 . Opala , J. A. 1987 . The Gullah: rice, slavery, and the Sierra Leone-American connection. United States Information Service, Freetown, Sierra Leone.
33 . Parra , E. J. , R. A. Kittles , G. Argyropoulos , C. L. Pfaff , K. Hiester , C. Bonilla , N. Sylvester , D. Parrish-Gause , W. T. Garvey , L. Jin , et al . 2001 . Ancestral proportions and admixture dynamics in geographi-cally defi ned African Americans living in South Carolina. Am. J. Phys. Anthropol. 114 : 18 – 29 .
34 . Mclean , D. C. , G. P. Page , and W. T. Garvey . 2001 . Mitochondrial DNA and Y-chromosome haplotypes of Gullah-speaking African Americans show closer genetic distance to Sierra Leoneans and lower Caucasian admixture than other new world African popula-tions. Am. J. Hum. Genet. 69 : 227 – 227 .
35 . McLean , D. C. , Jr ., I. Spruill , G. Argyropoulos , G. P. Page , M. D. Shriver , and W. T. Garvey . 2005 . Mitochondrial DNA (mtDNA) haplotypes reveal maternal population genetic affi nities of Sea Island Gullah-speaking African Americans. Am. J. Phys. Anthropol. 127 : 427 – 438 .
thank multiple personnel in the Division of Endocrinology at the Medical University of South Carolina, including offi ce and data manager Ann Smuniewski, data entry manager Cedric Rivers, BS, the Project SuGAR nurse coordinators Pam Wilson, LPN, Susan Cromwell, LPN, Frederica Hudges-Joyner RN, BSN, Karen Wilder-Smalls, LPN, Guinevere M. Maine, RN, Mattie Wideman, LPN, Gloria Smith, LPN, Deborah Daniels, LPN, Andrea Collins, LPN, Montrese Edwards, RN, BSN, and Janet Carter RD, and laboratory and analytic support from Barbara Wojciechowski, MA, George Argyropoulos, PhD, David McLean, PhD, Kerin McCormack MS, Nikki Rogers, PhD, Miranda Marion, Joyce Hicks, Theresa Kearns, and Dell Curry. We are grateful for the assistance of other staff, friends, supporters, volunteers, social worker interns, and nursing and medical students. Finally, we are thankful for the operation of the Project SuGAR Van by Rosalyn Cato and Brother William.
REFERENCES
1 . Engelgau , M. M. , L. S. Geiss , J. B. Saaddine , J. P. Boyle , S. M. Benjamin , E. W. Gregg , E. F. Tierney , N. Rios-Burrows , A. H. Mokdad , E. S. Ford , et al . 2004 . The evolving diabetes burden in the United States. Ann. Intern. Med. 140 : 945 – 950 .
2 . Haffner , S. M. , S. Lehto , T. Ronnemaa , K. Pyorala , and M. Laakso . 1998 . Mortality from coronary heart disease in subjects with type 2 diabetes and in nondiabetic subjects with and without prior myo-cardial infarction. N. Engl. J. Med. 339 : 229 – 234 .
3 . Casiglia , E. , G. Zanette , A. Mazza , V. Donadon , C. Donada , A. Pizziol , V. Tikhonoff , P. Palatini , and A. C. Pessina . 2000 . Cardiovascular mortality in non-insulin-dependent diabetes mellitus. A controlled study among 683 diabetics and 683 age- and sex-matched normal subjects. Eur. J. Epidemiol. 16 : 677 – 684 .
4 . Klein , B. E. , R. Klein , P. E. McBride , K. J. Cruickshanks , M. Palta , M. D. Knudtson , S. E. Moss , and J. O. Reinke . 2004 . Cardiovascular disease, mortality, and retinal microvascular characteristics in type 1 diabetes: Wisconsin epidemiologic study of diabetic retinopathy. Arch. Intern. Med. 164 : 1917 – 1924 .
5 . Eckel , R. H. , R. Kahn , R. M. Robertson , and R. A. Rizza . 2006 . Preventing cardiovascular disease and diabetes. Diabetes Care . 29 : 1697 – 1699 .
6 . Fox , C. S. , S. Coady , P. D. Sorlie , R. B. D’Agostino , Sr ., M. J. Pencina , R. S. Vasan , J. B. Meigs , D. Levy , and P. J. Savage . 2007 . Increasing cardiovascular disease burden due to diabetes mellitus: the Framingham Heart Study. Circulation . 115 : 1544 – 1550 .
7 . Fox , C. S. , S. Coady , P. D. Sorlie , D. Levy , J. B. Meigs , R. B. D’Agostino , Sr ., P. W. Wilson , and P. J. Savage . 2004 . Trends in cardiovascular complications of diabetes. JAMA . 292 : 2495 – 2499 .
8 . He , Z. , and G. L. King . 2004 . Microvascular complications of diabe-tes. Endocrinol. Metab. Clin. North Am. 33 : 215 – 238 .
9 . Bloomgarden , Z. T. 2007 . Insulin resistance, dyslipidemia, and car-diovascular disease. Diabetes Care . 30 : 2164 – 2170 .
10 . Watkins , P. J. 2003 . ABC of diabetes: cardiovascular disease, hyper-tension, and lipids. BMJ . 326 : 874 – 876 .
11 . Sandhu , M. S. , D. M. Waterworth , S. L. Debenham , E. Wheeler , K. Papadakis , J. H. Zhao , K. Song , X. Yuan , T. Johnson , S. Ashford , et al . 2008 . LDL-cholesterol concentrations: a genome-wide associa-tion study. Lancet . 371 : 483 – 491 .
12 . Ober , C. , A. S. Nord , E. E. Thompson , L. Pan , Z. Tan , D. Cusanovich , Y. Sun , R. Nicolae , C. Edelstein , D. H. Schneider , et al . 2009 . Genome-wide association study of plasma lipoprotein(a) levels identifi es multiple genes on chromosome 6q. J. Lipid Res. 50 : 798 – 806 .
13 . Knoblauch , H. , A. Busjahn , S. Munter , Z. Nagy , H. D. Faulhaber , H. Schuster , and F. C. Luft . 1997 . Heritability analysis of lipids and three gene loci in twins link the macrophage scavenger receptor to HDL cholesterol concentrations. Arterioscler. Thromb. Vasc. Biol. 17 : 2054 – 2060 .
14 . Edwards , K. L. , M. C. Mahaney , A. G. Motulsky , and M. A. Austin . 1999 . Pleiotropic genetic effects on LDL size, plasma triglyceride, and HDL cholesterol in families. Arterioscler. Thromb. Vasc. Biol. 19 : 2456 – 2464 .
at Univ of V
irginia Hlth S
ci Ctr C
Moore H
ealth Science Library on A
pril 13, 2010 w
ww
.jlr.orgD
ownloaded from

596 Journal of Lipid Research Volume 51, 2010
et al . 2008 . Susceptibility to coronary artery disease and diabetes is encoded by distinct, tightly linked SNPs in the ANRIL locus on chromosome 9p. Hum. Mol. Genet. 17 : 806 – 814 .
60 . Coon , H. , Leppert , M. F. , Eckfeldt , J. H. , Oberman, A., Myers, R. H., Peacock, J. M., Province, M. A., Hopkins, P. N., and Heiss, G. 2001 . Genome-Wide Linkage Analysis of Lipids in the Hypertension Genetic Epidemiology Network (HyperGEN) Blood Pressure Study. Arterioscler. Thromb. Vasc. Biol. 21 : 1969 – 1976 .
61 . Malhotra , A. , J. K. Wolford , and the American Diabetes Association GENNID Study Group. 2005 . Analysis of Quantitative Lipid Traits in the Genetics of NIDDM (GENNID) Study. Diabetes . 54 : 3007 – 3014 .
62 . Feitosa , M. F. , I. B. Borecki , T. Rankinen , T. Rice , J. P. Despres , Y. C. Chagnon , J. Gagnon , A. S. Leon , J. S. Skinner , C. Bouchard , et al . 2005 . Evidence of QTLs on chromosomes 1q42 and 8q24 for LDL-cholesterol and apoB levels in the HERITAGE Family Study. J. Lipid Res. 46 : 281 – 286 .
63 . Li , W. D. , C. Dong , D. Li , C. Garrigan , and R. A. Price . 2005 . A ge-nome scan for serum triglyceride in obese nuclear families. J. Lipid Res. 46 : 432 – 438 .
64 . Adeyemo , A. A. , Johnson , T. , Acheampong , J. , Oli , J. , Okafor , G. , Amoah , A. , Owusu , S. , Gyenim-Boateng, K., Eghan, B. A., Jr., Abbiyesuku, F., et al. 2005 . A genome wide quantitative trait link-age analysis for serum lipids in type 2 diabetes in an African popula-tion. Atherosclerosis . 181 : 389 – 397 .
65 . Badzioch , M. D. , R. P. Igo , Jr ., F. Gagnon , J. D. Brunzell , R. M. Krauss , A. G. Motulsky , E. M. Wijsman , and G. P. Jarvik . 2004 . Low-density lipoprotein particle size loci in familial combined hyperlip-idemia: evidence for multiple loci from a genome scan. Arterioscler. Thromb. Vasc. Biol. 24 : 1942 – 1950 .
66 . Kaess , B. , M. Fischer , A. Baessler , K. Stark , F. Huber , W. Kremer , H. R. Kalbitzer , H. Schunkert , G. Riegger , and C. Hengstenberg . 2008 . The lipoprotein subfraction profi le: heritability and identifi cation of quantitative trait loci. J. Lipid Res. 49 : 715 – 723 .
67 . Cupples , L. A. , H. Arruda , E. Benjamin , R. D’Agostino , S. Demissie , A. DeStefano , J. Dupuis , K. Falls , C. Fox , D. Gottlieb , et al . 2007 . The Framingham Heart Study 100K SNP genome-wide association study resource: overview of 17 phenotype working group reports. BMC Med. Genet. 8 : S1 .
68 . Kooner , J. S. , Chambers , J. C. , Guilar-Salinas, C. A., Hinds, D. A., Hyde, C. L., Warnes, G. R., Gomez Perez, F. J., Frazer, K. A., Elliott, P., Scott, J., et al. 2008 . Genome-wide scan identifi es variation in MLXIPL asso-ciated with plasma triglycerides. Nat. Genet. 40 : 149 – 151 .
69 . Wallace , C. , Newhouse , S. J. , Braund , P. , Zhang , F. , Tobin , M. , Falchi , M. , Ahmadi , K. , Dobson , R. J. , Marrano, A. C., Hajat, C., et al. 2008 . Genome-wide association study identifi es genes for bio-markers of cardiovascular disease: serum urate and dyslipidemia. Am. J. Hum. Genet. 82 : 139 – 149 .
70 . Diabetes Genetics Initiative of Broad Institute of Harvard and MIT, Lund University, and Novartis Institutes of BioMedical Research, Saxena R, Voight BF, Lyssenko V, Burtt NP, de Bakker PI, Chen H, Roix JJ . 2007 . Genome-wide association analysis identifi es loci for type 2 diabetes and triglyceride levels. Science . 316 : 1331 – 1336 .
71 . Willer , C. J. , Sanna , S. , Jackson , A. U. , Scuteri , A. , Bonnycastle , L. L. , Clarke , R. , Heath , S. C. , Timpson , N. J. , Najjar , S. S. , Stringham , H. M. , et al . 2008 . Newly identifi ed loci that infl uence lipid concentra-tions and risk of coronary artery disease. Nat. Genet. 40 : 161 – 169 .
72 . Kathiresan , S. , O. Melander , C. Guiducci , A. Surti , N. P. Burtt , M. J. Rieder , G. M. Cooper , C. Roos , B. F. Voight , A. S. Havulinna , et al . 2008 . Six new loci associated with blood low-density lipoprotein cholesterol, high-density lipoprotein cholesterol or triglycerides in humans. Nat. Genet. 40 : 189 – 197 .
73 . Lewis , J. P. , N. D. Palmer , P. J. Hicks , M. M. Sale , C. D. Langefeld , B. I. Freedman , J. Divers , and D. W. Bowden . 2008 . Association analy-sis of European-derived type 2 diabetes SNPs from whole genome association studies in African Americans. Diabetes . 57 : 2220 – 2225 .
74 . Miljkovic-Gacic , I. , C. H. Bunker , R. E. Ferrell , C. M. Kammerer , R. W. Evans , A. L. Patrick , and L. H. Kuller . 2006 . Lipoprotein subclass and particle size differences in Afro-Caribbeans, African Americans, and white Americans: associations with hepatic lipase gene variation. Metabolism . 55 : 96 – 102 .
75 . Lamarche , B. , A. C. St-Pierre , I. L. Ruel , B. Cantin , G. R. Dagenais , and J. P. Després . 2001 . A prospective, population-based study of low density lipoprotein particle size as a risk factor for ischemic heart disease in men. Can. J. Cardiol. 17 : 859 – 865 .
76 . El Harchaoui K. , W. A. van der Steeg , E. S. Stroes , J. A. Kuivenhoven , J. D. Otvos , N. J. Wareham , B. A. Hutten , J. J. Kastelein , K. T. Khaw , and S. M. Boekholdt . 2007 . Value of low-density lipoprotein particle
36 . Parra , E. J. , A. Marcini , L. Akey , J. Martinson , M. A. Batzer , R. Cooper , T. Forrester , D. B. Allison , R. Deka , R. E. Ferrell , et al . 1998 . Estimating African American admixture proportions by use of population-specifi c alleles. Am. J. Hum. Genet. 63 : 1839 – 1851 .
37 . Garvey WT , McClean DC , and, S. I. 2003. The search for obesity genes in isolated populations: Gullah-speaking African Americans and the role of Uncoupling Protein 3 as a thrifty gene. In Progress in Obesity Research. Madeiros G, Halpern A, and Bouchards C. John Libbey Eurotext Ltd., London. 373–380.
38 . Report of the Expert Committee on the Diagnosis and Classifi cation of Diabetes Mellitus 2003 . Diabetes Care . 26 : S5 – S20 .
39 . Otvos , J. D. 2000. Measurement of lipoprotein subclass profi les by nuclear magnetic resonance spectroscopy. In Handbook of Lipoprotein Testing. American Association for Clinical Chemistry., Washington (DC). 609 –623.
40 . Sun , L. , K. Wilder , and M. S. McPeek . 2002 . Enhanced pedigree error detection. Hum. Hered. 54 : 99 – 110 .
41 . McPeek , M. S. , and L. Sun . 2000 . Statistical tests for detection of misspecifi ed relationships by use of genome-screen data. Am. J. Hum. Genet. 66 : 1076 – 1094 .
42 . O’Connell , J. R. , and D. E. Weeks . 1998 . PedCheck: a program for identifi cation of genotype incompatibilities in linkage analysis. Am. J. Hum. Genet. 63 : 259 – 266 .
43 . Kong , X. , K. Murphy , T. Raj , C. He , P. S. White , and T. C. Matise . 2004 . A combined linkage-physical map of the human genome. Am. J. Hum. Genet. 75 : 1143 – 1148 .
44 . Almasy , L. , and J. Blangero . 1998 . Multipoint quantitative-trait linkage analysis in general pedigrees. Am. J. Hum. Genet. 62 : 1198 – 1211 .
45 . Abecasis , G. R. , S. S. Cherny , W. O. Cookson , and L. R. Cardon . 2002 . Merlin: rapid analysis of dense genetic maps using sparse gene fl ow trees. Nat. Genet. 30 : 97 – 101 .
46 . Comuzzie , A. G. , M. C. Mahaney , L. Almasy , T. D. Dyer , and J. Blangero . 1997 . Exploiting pleiotropy to map genes for oligogenic phenotypes using extended pedigree data. Genet. Epidemiol. 14 : 975 – 980 .
47 . Almasy , L. , T. D. Dyer , and J. Blangero . 1997 . Bivariate quantitative trait linkage analysis: pleiotropy versus co-incident linkages. Genet. Epidemiol. 14 : 953 – 958 .
48 . Lander , E. , and L. Kruglyak . 1995 . Genetic dissection of complex traits: guidelines for interpreting and reporting linkage results. Nat. Genet. 11 : 241 – 247 .
49 . Conneally , P. M. , J. H. Edwards , K. K. Kidd , J. M. Lalouel , N. E. Morton , J. Ott , and R. White . 1985 . Report of the Committee on Methods of Linkage Analysis and Reporting. Cytogenet. Cell Genet. 40 : 356 – 359 .
50 . van Ooijen , J. W. 1999 . LOD signifi cance thresholds for QTL analysis in experimental populations of diploid species. Heredity. 83 : 613 – 624 .
51 . Xu , Z. , and J. A. Taylor . 2009 . SNPinfo: integrating GWAS and can-didate gene information into functional SNP selection for genetic association studies. Nucleic Acids Res. 37 : W600 – W605 .
52 . Sale , M. M. , L. Lu , I. J. Spruill , J. K. Fernandes , K. H. Lok , J. Divers , C. D. Langefeld , and W. T. Garvey . 2009 . Genome-wide linkage scan in Gullah-speaking African American families with type 2 dia-betes. Diabetes . 58 : 260 – 267 .
53 . Snieder , H. , L. J. P. van Doornen , and D. I. Boomsma . 1999 . Dissecting the genetic architecture of lipids, lipoproteins, and apo-lipoproteins: lessons from twin studies. Arterioscler. Thromb. Vasc. Biol. 19 : 2826 – 2834 .
54 . Bosse , Y. , M. C. Vohl , J. P. Despres , B. Lamarche , T. Rice , D. C. Rao , C. Bouchard , and L. Perusse . 2003 . Heritability of LDL peak particle diameter in the Quebec Family Study. Genet. Epidemiol. 25 : 375 – 381 .
55 . Otvos JD . 2004 . NMR LipoProfi le test Subclass Particle Analysis. LipoScience, Inc .
56 . Kazumi , T. , A. Kawaguchi , T. Hozumi , M. Nagao , M. Iwahashi , M. Hayakawa , K. Ishihara , and G. Yoshino . 1999 . Low density li-poprotein particle diameter in young, nonobese, normolipidemic Japanese men. Atherosclerosis . 142 : 113 – 119 .
57 . Jakobsson , A. , R. Westerberg , and A. Jacobsson . 2006 . Fatty acid elongases in mammals: their regulation and roles in metabolism. Prog. Lipid Res. 45 : 237 – 249 .
58 . Wu , J. , M. A. Province , H. Coon , S. C. Hunt , J. H. Eckfeldt , D. K. Arnett , G. Heiss , C. E. Lewis , R. C. Ellison , D. C. Rao , et al . 2007 . An investiga-tion of the effects of lipid-lowering medications: genome-wide linkage analysis of lipids in the HyperGEN study. BMC Genet. 8 : 60 .
59 . Broadbent , H. M. , Peden , J. F. , Lorkowski , S. , Goel , A. , Ongen , H. , Green , F. , Clarke , R. , Collins , R. , Franzosi , M. G. , Tognoni , G. ,
at Univ of V
irginia Hlth S
ci Ctr C
Moore H
ealth Science Library on A
pril 13, 2010 w
ww
.jlr.orgD
ownloaded from

Genetic architecture of lipoprotein subclasses in African Americans 597
number and size as predictors of coronary artery disease in ap-parently healthy men and women: the EPIC-Norfolk Prospective Population Study. J. Am. Coll. Cardiol. 49 : 547 – 553 .
77 . Kuller , L. , A. Arnold , R. Tracy , J. Otvos , G. Burke , B. Psaty , D. Siscovick , D. S. Freedman , and R. Kronmal . 2002 . Nuclear mag-netic resonance spectroscopy of lipoproteins and risk of coronary heart disease in the cardiovascular health study. Arterioscler. Thromb. Vasc. Biol. 22 : 1175 – 1180 .
78 . Stampfer , M. J. , R. M. Krauss , J. Ma , P. J. Blanche , L. G. Holl , F. M. Sacks , and C. H. Hennekens . 1996 . A prospective study of triglyc-eride level, low-density lipoprotein particle diameter, and risk of myocardial infarction. JAMA . 276 : 882 – 888 .
79 . Adiels , M. , S. O. Olofsson , M. R. Taskinen , and J. Boren . 2008 . Overproduction of very low-density lipoproteins is the hallmark of the dyslipidemia in the metabolic syndrome. Arterioscler. Thromb. Vasc. Biol. 28 : 1225 – 1236 .
at Univ of V
irginia Hlth S
ci Ctr C
Moore H
ealth Science Library on A
pril 13, 2010 w
ww
.jlr.orgD
ownloaded from