the general agreement on tariffs and trade: world trade ... · the general agreement on tariffs and...
TRANSCRIPT
THE GENERAL AGREEMENT ON TARIFFS ANDTRADE: WORLD TRADE FROM A MARKET
PERSPECTIVE
LEONARD BIERMAN,* DONALD R. FRASER,** ANDJAMES W. KoLARI***
1. INTRODUCTION
On April 15, 1994, the contracting parties to the GeneralAgreement on Tariffs and Trade ("GATT")1 finalized the "Uru-guay Round" of trade negotiations.2 The agreement reached aspart of these negotiations is perhaps the most comprehensive inhistory, lowering yearly global tariffs by over $700 billion,4while increasing world income by over $500 billion per year.'
The Agreement and the new World Trade Organization("WTO")6 it creates have already received considerable attention
* Professor of Management, Texas A&M University.Hugh Roy Cullen Chair and Professor of Finance, Texas A&M
University.Texas Commerce Bank Professor of Finance, Texas A&M University.
1 See General Agreement on Tariffs and Trade, Oct. 30, 1947, 61 Stat. All,T.I.A.S. 1700, 55 U.N.T.S. 194 [hereinafter GATT 1947].
2 See Final Act Embodying the Results of the Uruguay Round ofMultilateral Trade Negotiations, Apr. 15, 1994, LEGAL INSTRUMENTS -RESULTS OF THE URUGUAY ROUND vol. 1 (1994), 33 I.L.M. 1125 (1994).[hereinafter GATT 1994].
3 See Results of the Uruguay Round Trade Negotiations: Hearings Before theSenate Comm. on Fin., 103d Cong. 211 (1994) (statement of U.S. TradeRepresentative Mickey Kantor).
' See The New Trade Pact, N.Y. TIMES, Dec. 2, 1994, at A22 (highlightingClinton administration estimates that global tariffs will go down by $744billion).
5 See G. Richard Shell, Trade Legalism and International Relations Theory:An Analysis of the World Trade Organization, 44 DUKE LJ. 829, 831 & n.3(1995). Shell cites a 1994 report by the GATT Secretariat projecting a $510billion increase, measured in 1992 dollars, to occur before the year 2005. Seeid. (citing GATT SECRETARIAT, THE RESULTS OF THE URUGUAY ROUND -MARKET ACCESS FOR GOODS AND SERVICES: OVERVIEW OF THE RESULTS 12(1994)).
6 See GATT 1994, supra note 2, art. 1, 33 I.L.M. at 1144 (establishing theWTO). See generally Shell, supra note 5 (giving an overall analysis of the

U. Pa. J. Int'l Econ. L.
in leading legal periodicals. This journal hosted a symposium on"Current Issues in the World Trade Organization" last spring toexamine a number of controversial topics already created by theWTO.7 Elsewhere, in recent articles in the Harvard Law Review,Professor Laurence H. Tribe and Professors Bruce Ackerman andDavid Golove debate the legitimacy of the process by which theU.S. Congress ratified the Uruguay Round of GATT and thegeneral constitutionality of "congressional-executive agreements. " 'Additionally, in a recent article in the Duke Law Journal,Professor G. Richard Shell extensively examines the theoreticalunderpinnings of the new WTO and its dispute resolutionsystem.9
Commentators have paid little attention, however, to theprecise economic impacts of this massive change in internationaltrade regulation. This Article focuses on these impacts. It doesso by observing the nature of the changes affected by the UruguayRound as well as the reactions in markets throughout the worldto events leading up to Uruguay Round ratification. Section 2outlines a theory of "event study analysis" involving observationsof international stock market reactions to publicized events.Section 3 examines the major changes that the Uruguay Roundmakes in the international trade regime and predicts certain logicaleconomic impacts. Section 4 reveals the results of applying the"event study analysis" to different regions and industries in the
WTO).' See Wesley A. Cann, Jr., Internationalizing Our Views Toward Recoup-
ment and Market Power: Attacking the Antidumping/Antitrust DichotomyThrough WTO-Consistent Global Welfare Theory, 17 U. PA. J. INT'L ECON. L.69 (1996); Steve Charnovitz, Participation of Nongovernmental Organizations inthe World Trade Organization, 17 U. PA. J. INT'L ECON. L. 331 (1996); PhilipM. Nichols, Extension of Standing in World Trade Organization Disputes toNongovernment Parties, 17 U. PA. J. INT'L ECON. L. 295 (1996); G. RichardShelf, The Trade Stakeholders Model and Participation by Nonstate Parties in theWorld Trade Organization, 17 U. PA. J. INT'L ECON. L. 359 (1996); Jared R.Silverman, Comment, Multilateral Resolution Over Unilateral Retaliation:Adjudicating the Use of Section 301 Before the WTO, 17 U. PA. J. INT'L ECON.L. 233 (1996); see also Curtis Reitz, Enforcement of the General Agreement onTariffs and Trade, 17 U. PA. J. INT'L ECON. L. 555 (1996) (offering commentaryon and suggestions for improving the new enforcement mechanisms).
I See Bruce Ackerman & David Golove, Is NAFTA Constitutional?, 108HARV. L. REV. 799 (1995); Laurence H. Tribe, Taking Text and StructureSeriously: Reflections on Free-Form Method in Constitutional Interpretation, 108HARV. L. REV. 1221 (1995).
" See Shell, supra note 5.
[Vol. 17:3

MARKET PERSPECTIVE
world. Ultimately, this Article concludes that the long-termnature of the impacts will redound mostly to the benefit of theAsian/Pacific economic region.
2. EVENT STUDY ANALYSIS
One of the best ways to gain insight into the economicimplications of regulatory changes such as the GATT/WTO isthrough stock market event analysis.1 ° This type of analysisinvolves examining the impact of a given event or events on stockprices in various markets throughout the world. This analysisassumes, pursuant to the so-called "efficient markets hypothe-ses, "
12 that all present and future economic implications of givenevents are immediately reflected in stock prices throughoutrelevant markets. Stock market event analysis is designed tomeasure the effect of an event on stock prices independently ofthe effects of other factors. To achieve this goal, estimates of thenormal "expected return" of stock prices are calculated and thencompared with the actual post-event returns. The difference,referred to as the "abnormal return," is attributed to the givenevent.
13
In distinguishing between expected and abnormal returns,event analysis focuses on two time periods: (1) the "estimationperiod" prior to the event, during which a regression modeldesigned to measure the normal relationship between the worldstock index and the stock index of a particular country or
10 See generally ROBERT C. RADCLIFFE, INVESTMENT: CONCEPTS,
ANALYSIS, STRATEGY (2d ed. 1987) (outlining a recommended process forinvestors to evaluate the advantages of capital investments requiring prospectivespeculation about the long-term impacts of current events); Leonard Biermanet al., Denmark and the Maastricht Treaty: A Market Analysis, 3 DUKE J. COMP.& INT'L L. 147 (1992) (conducting a similar empirical analysis of market reac-tions to the Danish vote ratifying the Maastricht Treaty).
n See Bierman et al., supra note 10, at 147.12 See SEHA M. TINIC & RICHARD R. WEST, INVESTING IN SECURITIES:
AN EFFICIENT MARKETS APPROACH 278-79 (1979) [hereinafter TINIC & WEST](explaining the "efficient markets" approach to investing); Eugene F. Fama etal., The Adjustment of Stock Prices to New Information, 10 INT'L. ECON. REV.1, 12-16 (1969) (discussing the speed of adjustment of stock prices to specifickinds of new information); Daniel Seligman, Can You Beat the Stock Market?,FORTuNE, Dec. 26, 1983, at 82 (debating the efficient market hypothesis).
13 Stock markets will always experience general price movements regardlessof the given event or events. Thus, it is necessary to isolate the impact of thegiven event from the impact of other pricing factors.
1996]

U. Pa. . Int'l Econ. L.
industry is developed; and (2) the "analysis period," whichencompasses a small number of days immediately surrounding thegiven event day. The market model version of the capital assetpricing model14 is commonly used to estimate these relationshipsand is used in the study discussed in this Article.
There was considerable controversy in the U.S. Congressduring 1994 regarding ratification of the Uruguay Round of theGATT.5 This controversy extended far beyond the aforemen-tioned constitutional debate between Professor Tribe andProfessors Ackerman and Golove regarding whether the agree-ment was a "treaty" subject to two-thirds ratification by the U.S.Senate. 6 Concerns regarding congressional ratification of theUruguay Round came from various sectors.
First, because the Uruguay Round reduces tariffs, criticsexpressed concern regarding the loss of approximately $10 billionin tariff revenue that the United States will experience during thefirst five years of the agreement."' Opponents of the agreementalso noted the likely negative impact its less restrictive trademandates would have on U.S. jobs, particularly in such industries
14 See TINIG & WEST, supra note 12, at 278-79 (discussing the theory behindthe capital asset pricing model); see also William F. Sharpe, Capital Asset Prices:A Theory of Market Equilibrium Under Conditions of Risk, 19 J. FIN. 425, 427(1964) (presenting an example of a capital asset pricing model).
15 See, e.g., Peter H. Stone, GA7T-ling Guns, NAT'L. J., July 2, 1994, at1571 (discussing the lobbying efforts related to the ratification of the GATT);Michael J. Boskin, Pass GA 7T Now, FORTUNE, Dec. 12, 1994, at 137 (urgingCongressional Republicans to put politics aside and pass GATT); GATTImperiled, Bus. WEEK, Oct. 31, 1994, at 57 (detailing President Clinton'sconcern regarding GATT's chances for ratification success); Senate Support orPact on World Trade Is Low, WALL ST. J., Nov. 14, 1994, at A2 [hereinafterSenate Support] (reporting on the statement of Senator Daniel Patrick Moynihanthat GATT lacked the necessary support to achieve ratification).
16 See Ackerman & Golove, supra note 8; Tribe, supra note 8; see alsoGA TT Implementing Legislation: Hearings on S. 2467 Before the Senate Comm.On Commerce, Science, and Transp., 103d Cong. 285-339 (1994) (containingstatements and testimony of Prof. Laurence H. Tribe and Prof. BruceAckerman arguing that because the results of the Uruguay Round constitute atreaty, they must be subject to Senate approval by a two-thirds majority). Al-though the latter view finally prevaileda, the pact's revenue-losing provisionsrequired a larger majority (60 members) in the U.S. Senate. See Senate Support,supra note 15, at A2.
17 See Boskin, supra note 15, at 138 (estimating the loss as likely to be $12billion); Stone, supra note 15, at 1572 (citing a $10 billion loss).
[Vol. f7:3

MARKET PERSPECTIVE
as textiles,18 and on the integrity of U.S. labor and environmen-tal standards.1 9 The most vociferous opposition to the agree-ment, however, focused on its creation of the WTO to regulatetrade disputes, and the corresponding potential encroachment onU.S. legal "sovereignty."" An anti-ratification campaign entitled"Save Our Sovereignty" was launched in May of 1994.21 Thiscampaign enjoyed considerable success in convincing variouslegislators that the WTO and its dispute resolution process poseda major threat to the United States' ability to enforce andmaintain its own laws.'
This political controversy throughout 1994 placed the Agree-ment's ultimate approval by the U.S. Congress, considered thelinchpin for the agreement's ratification by other major coun-tries,' in continual doubt. Indeed, resolution of the issue wasnot clear until the U.S. Senate's December 1, 1994, vote approvingthe Agreement. 24 The U.S. House of Representatives passed asimilar resolution just two days earlier.' Throughout theprocess, the probability of ultimate congressional approvalvacillated dramatically.
At least four dates prior to the final vote are noteworthy: (1)August 15, 1994, when major newspapers reported that the
"S See Stone, supra note 15, at 1572-74 (claiming that the textiles industryis likely to lose "hundreds of thousands" of jobs if te agreement is approved).
19 See id. at 1572, 1574 (noting that many U.S. environmental and laborlaws could suffer from legitimacy attacks under a strengthened GATT system).
2 See id. at 1572 (stating that "[c]ritics fear that the WTO - where all 117nations will have equal votes and vetoes will no longer be possible - couldinfringe on U.S. sovereignty").
21 See John Harwood, GA 7T Backers are Given Edge in the Senate, WALLST. J., Dec. 1, 1994, at A3 (quoting Senator Robert Byrd of West Virginia asstating that the WTO will be a "Tyrannosaurus" that will "ransack" U.S. laws);Stone, supra note 15, at 1574 (noting concerns of Senator John F. Kerry ofMassachusetts regarding the impact of the WTO on U.S. laws).
n See Stone, supra note 15, at 1574.See generally Boskin, supra note 15, at 137 (noting that the European
Community, Japan and other nations were waiting to see if the U.S. Congresswould pass GATT before acting on ratification).
24 See H.R. 5110, 103d Cong. (1994) (enacted) (setting forth the text of theresolution); Helene Cooper & John Harwood, Major Sh i in Trade are Ensuredas GATT Wins Key Senate Vote, WALL ST. J., Dec. 2, 1994, at A12 (reportingon the Senate's approval of GATT).
s See John Harwood & Helene Cooper, House Clears GA TTAccord In 288-147 Vote, WALL ST. J., Nov. 30, 1994, at Al.
1996]

U. Pa. J. Int'l Econ. L.
Clinton Administration and House Republicans had reached acompromise regarding the President's authority to link environ-mental and labor standards to trade agreements, thereby greatlyenhancing prospects for the ratification of GATT;26 (2) Septem-ber 21, 1994, when the Wall Street Journal reported that Houseand Senate negotiators had reached an important accord on theworld trade pact;V (3) September 30, 1994, when U.S. SenateCommerce Committee Chairman Ernest Hollings of SouthCarolina, a key opponent of the agreement, agreed to allow aSenate vote on the measure in early December of 1994;2' and (4)November 22, 1994, when a major compromise deal betweenPresident Clinton and Senate Majority Leader Robert Doleregarding the role of the WTO became public, thus removing amajor stumbling block to GATT ratification. 29 The importanceof these dates to the ultimate success of GATT 1994 marks themas "events" for purposes of testing world stock market reactions.
3. EVENT STUDY HYPOTHESES
3.1. Changes in the GATT System by the Uruguay Round
3.1.1. Overview
The Uruguay Round of GATT represents a massive liberaliza-tion of international trade, cutting tariffs on thousands of articlesby approximately forty percent and mandating the removal ofsignificant import restrictions throughout the world.30 Interna-tional trade theory generally predicts that such a multilateral
26 See Helene Cooper, White House Compromises on GA TT With HouseRepublicans to Ease Passage, WALL ST. J., Aug. 15, 1994, at A2.
2 See Bob Davis, GA TT Pact Moves Forward In Congress as House, SenateNegotiators End Work, WALL ST. J., Sept. 21, 1994, at A4.
2 See David Rogers & Bob Davis, Senators Pledge December Vote on GA TTPact, WALL ST. J., Sept. 30, 1994, at A2.
29 See Bob Davis & David Rogers, Clinton, Dole Are Close to Deal Seekingto Assure Critics of World-Trade Pact, WALL ST. J., Nov. 22, 1994, at A26.
30 See Harwood & Cooper, supra note 25, at Al (reporting that theagreement wil reduce tariffs by 40%); Alan Riding, One Hundred Nine NationsSign Trade Agreement, N.Y. TIMES, Apr. 16, 1994, at 35, 48 (detailing therequired reductions in import restrictions); see generally Bob Davis, A Primeron GAT: Sure, it's Tedious, But the Important Things Often Are, WALL ST. J.,Nov. 28, 1994, at A3 (outlining key questions and answers regarding thechanges made by the Uruguay Round).
[Vol. 17:3
MARKET PERSPECTIVE
liberalization of trade policies will increase economic efficiencyand enhance economic growth for all signatory countries.3'Indeed, the Uruguay Round is expected to increase world incomeby over $500 billion per year.32 Consequently, one wouldprobably expect markets in all areas of the world to reactpositively to events signaling a likely agreement of this kind.
Nevertheless, it is reasonable to expect the Uruguay Round tohave some disparate impacts on different nations, regions, andeconomic sectors throughout the world. These impacts will beprecipitated, in part, by the interplay between substantive changesembodied in certain specific provisions of the Uruguay Roundagreement.
3.1.2. Specific Provisions
3.1.2.1. Tariff Reductions
As noted above, the Uruguay Round will cut tariffs on a widearray of products by about forty percent.3 For example, inEurope the tariff on computers dropped from 4.9% to 2.5% as aresult of the Uruguay Round, while the average fourteen percenttariff on imported computer chips dropped to approximately eightpercent.34 Tariff reductions on computers helps companiesexporting computers to Europe by lowering the tariffs charged ontheir products. Companies manufacturing computers in Europealso benefit because lower tariffs on imported computer chipsmeans lower costs of raw materials.35 Over time, the UruguayRound slashes tariffs on thousands of items, and even eliminatesthem altogether with respect to certain goods.36 The agreement
31 See U.S. International Trade Commission, Potential Impact on the U.S.Economy and Selected Industries of the GA 77 Uruguay Round Agreements, June,1994, 1-9 (unpublished study, available from the U.S. International TradeCommission). [hereinafter ITC Study].
32 See Shell, supra note 5, at 831 & n.3.31 See supra note 30 and accompanying text.31 See Many Business Leaders See Long-Term Gain, Especially at Computer,
Dru, Farming Firms, WALL ST. J., Dec. 2, 1994, at A6 [hereinafter ManyBusiness Leaders].
35 See id.31 See Trade Pact's Key Provisions, WALL ST. J., Dec. 2, 1994, at A6.
19961

U. Pa. J. Int'l Econ. L.
thus gives an especially big boost to companies and countries thatare major exporters. 7
3.1.2.2. Elimination of Import Restrictions
The agreement takes major steps toward the reduction and/orelimination of import restrictions with respect to both industrialand agricultural goods.3" Perhaps most significant in this regardis the ten-year phasing out of the Multifiber Arrangement("MFA"), a system of quotas that limits imports of textiles andapparel into the United States and other industrialized coun-tries.39 According to some estimates, world trade in textiles andapparel may increase by as much as sixty percent once the MFAphase out is completed.40
3.1.2.3. Subsidies
The Uruguay Round agreement places limits on governmentsubsidies of certain economic activities, 41 particularly in theagricultural sector.42 For example, the Uruguay Round reducesexport subsidies and government budgetary support for agricultureby thirty-six percent in "developed" countries and twenty-fourpercent in "developing" countries.43 The agreement restrictssubsidies to tropical agricultural products even further.44
3.1.2.4. Intellectual Property Rights
The Uruguay Round agreement stipulates that all signatorieswill adopt intellectual property protection in copyrights, trade-marks, patents, industrial designs, layout designs of integratedcircuits, geographical indications, and undisclosed information.45
17 See Many Business Leaders, supra note 34, at A6 (speculating that some ofthe biggest winners could be companies like K-Mart, Compaq, Mattel, Georgia-Pacific, Caterpillar, and Microsoft).
31 See ANNE 0. KRUEGER, TRADE POLICIES AND DEvELOPING NATIONS50 (1995).
'9 See Trade Pact's Key Provisions, supra note 36, at A6.40 See KRUEGER, supra note 38, at 51.41 See Trade Pact's Key Provisions, supra note 36, at A6.42 See KRUEGER, supra note 38, at 51.43 See id. at 51-52.1 See id. at 51.41 See id. at 52 & n.28.
[Vol. 17:3

MARKET PERSPECTIVE
This provision represented a "big win" for worldwide pharmaceu-tical, software, film, and book publishing industries which haveconsistently registered complaints about international piracy.'Under the agreement, however, developing countries will haveconsiderably more time to implement intellectual property rightsthan developed countries. 47
3.1.2.5. Trade in Services
With technological advances reducing transportation andcommunication costs and time, trade in services has increased inimportance relative to trade in goods.4
' The Uruguay Roundbrings trade in services under the multilateral negotiating umbrellaof the GATT/WTO, and further negotiations in various areas canbe expected.49 The Uruguay Round does not, however, includeany immediate substantive changes in this area. For example, U.S.negotiators failed in their attempt to gain access for U.S. banksand securities firms to markets in Japan and other key coun-tries."0
3.2. "Competitiveness" Issues
3.2.1. Overview
It thus appears that various specific provisions of the UruguayRound clearly will impact certain industries, nations, and regionsdifferently. In a general sense, however, the agreement's provi-sions liberalizing world trade will be most beneficial to thosecountries in a competitive position to take advantage of newtrading opportunities. Moreover, because many of the trade-liberalizing aspects of GATT will be phased in several years afterthe Agreement's January 1, 1995, effective date," the countriesmost likely to benefit will probably be those in the best competi-
46 Trade Pact's Key Provisions, supra note 36, at A6.47 See KRUEGER, supra note 38, at 52.11 See id. at 55." See Trade Pact's Key Provisions, supra note 36, at A6.50 See id."1 See GATT 1994, supra note 2, pt. I, para. 3, 33 I.L.M. at 12 (recognizing
the negotiators' desire to make GATT effective as of January 1, 1995).
19961

U. Pa. JI Int'l Econ. L.
tive position a decade or more from now. 2 Consequently,although today's top competitors will receive some benefit fromthe Agreement, one would predict that tomorrow's most competi-tive countries will benefit most from the Uruguay Round.
3.2.2. Measuring Current Competitiveness
One of the best measures of current national competitivenessis national output or Gross Domestic Product ("GDP") percapita. 3 This measure encapsulates the quality and availabilityof production inputs, as well as the impact of government andother policies.54 A 1995 national output ranking of the majornations of the world using an index5 provided the followingresults:
CHART ONECurrent Competitiveness
United States 100Switzerland 92Singapore 88
Top 25% of Canada 83
Countries Japan 82
Ranked France 78Australia 75Austria 75Belgium 74Italy 73
52 For example, the phase out of the MFA under the Uruguay Roundoccurs over a ten-year period and is heavily "backloaded," as most of the quotarestrictions will not be lifted until the years 2000 through 2005. See KRUEGER,supra note 38, at 51.
53 See International Competitiveness Revisited, UBS INT'L FIN., Winter 1996,at 1, 2 [hereinafter International Competitiveness].
51 See id. at 2." Since the United States received the highest score, the survey arbitrarily
gave it a benchmark score of 100.
[Vol. 17:3

MARKET PERSPECTIVE
CHART ONECurrent Competitiveness
United Kingdom 73Netherlands 72Germany 72
Top 50% of Sweden 70Countries New Zealand 63Ranked Israel 61
Spain 53Ireland 50Korea 43Portugal 40
Argentina 38Malaysia 37Chile 34
Top 75% of Greece 33Countries Thailand 28Ranked Mexico 27
Hungary 26Brazil 23Columbia 23Poland 21
Turkey 20Russia 16Egypt 14Indonesia 13
All Countries South Africa 11Ranked China 10
Iran 9Pakistan 9Nigeria 6India 5
From the perspective of current competitiveness, one wouldexpect many of the world's industrialized powers to benefit fromthe Uruguay Round. In particular, the United States, Canada, theEuropean Community, and Japan seem well-poised to capitalizeon new economic opportunities afforded by the Uruguay Round.
3.2.3. Future Competitiveness
Although immediate opportunities under the Uruguay Roundare significant, because many of its provisions do not becomeeffective for many years, and it will be in effect for a long time,the question of future national competitiveness is also criticallyimportant. Because economic growth is ultimately driven by
1996]

U. Pa. J. Int'l Econ. L.
investment, and generally most investment is funded domestically,examination of gross domestic savings as a percentage of GDP isone good predictor of future competitiveness.56 In this regard,the United States, although currently the world's most competi-tive country, only has a domestic savings rate of about fifteenpercent.5' Singapore, China, Korea, Indonesia, Thailand, andJapan on the other hand, all have savings rates of thirty percentor more.58 Chart Two below illustrates the domestic savingsrates for nineteen key countries.59
56 See International Competitiveness, supra note 53, at 3 (concluding thatdomestic investment in excess of 30% combined with domestic savings in excessof 30% will render a country exceptionally competitive in the future).
57 See id.58 See id.59 See id.
[Vol. 17:3
MARKET PERSPECTIVE
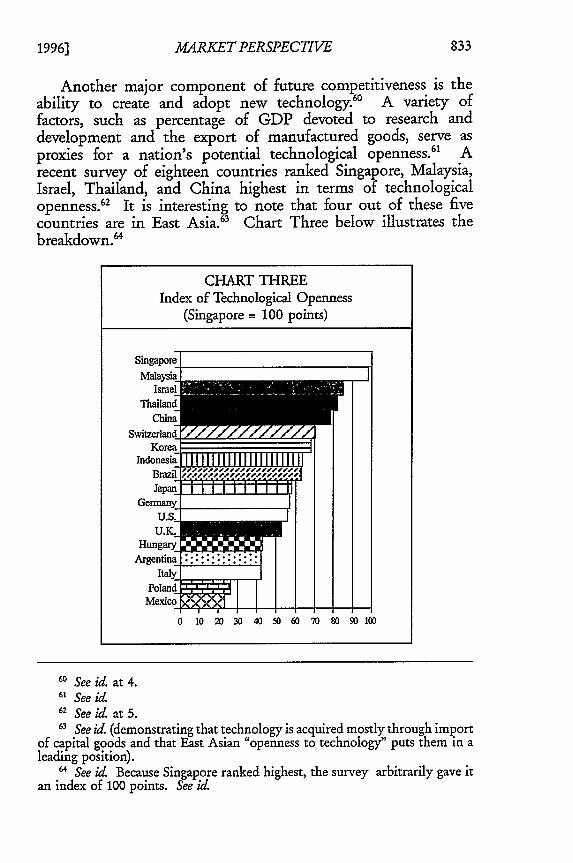
Another major component of future competitiveness is theability to create and adopt new technology.' A variety offactors, such as percentage of GDP devoted to research anddevelopment and the export of manufactured goods, serve asproxies for a nation's potential technological openness. 61 Arecent survey of eighteen countries ranked Singapore, Malaysia,Israel, Thailand, and China highest in terms of technologicalopenness. 62 It is interesting to note that four out of these fivecountries are in East Asia.63 Chart Three below illustrates thebreakdown. 64
60 See id. at 4.61 See id.62 See id. at 5.63 See id. (demonstrating that technology is acquired mostly through import
of capital goods and that East Asian "openness to technology" puts them in aleading position).
64 See id. Because Singapore ranked highest, the survey arbitrarily gave itan index of 100 points. See id.
CHART THREEIndex of Technological Openness
(Singapore = 100 points)
:Ni
0 10 20 30 40 50 60 70 80 90 100
1996]

U. Pa. . Int'l Econ. L.
Other factors, particularly those of a macro economic natureincluding percentage of government consumption of GNP andreal rates of exchange, also figure into calculating potential futurenational competitiveness. 5 Chart Four below sets forth a recentcomprehensive calculation of the potential future nationalcompetitiveness of forty different countries: 66
CHART FOURFuture Competitiveness
(Maximum points = 100)
Singapore 96
Top 15% of Malaysia 91
Countries Thailand 83
Ranked China 83Japan 81Korea 78
Top 25% of Ireland 76
Countries Switzerland 75
Ranked Indonesia 75Netherlands 72
Germany 71Belgium 68Austria 67
Top 50% of France 67
Countries Sweden 66
Ranked Canada 63United States 62Italy 62United Kingdom 60New Zealand 60
65 See id. at 7.66 See id.
[Vol. 17:3

MARKET PERSPECTIVE
CHART FOURFuture Competitiveness
(Maximum points = 100)
Chile 59Australia 59Israel 57
Top 75% of Spain 57Countries Russia 55Ranked India 52
Argentina 52South Africa 52Mexico 50Colombia 49
Hungary 49Pakistan 47Portugal 47Egypt 46
All Countries Brazil 44Ranked Poland 41
Nigeria 39Iran 39Greece 36Turkey 33
It is interesting to note that all of the countries in the top 15%of the future competitiveness ranking are in Asia, while variouscountries like the United States and Canada, which are currentlyextremely competitive, drop close to the middle of the pack. 67
Thus, if the Uruguay Round agreement is predicted to have itsgreatest impact in years to come, the top future competitors, allAsian countries, are likely to be its greatest beneficiaries.
3.3. Industry Impacts
As noted above, the Agreement impacts specific industriesaround the world.68 New intellectual property rights regulationsshould significantly benefit pharmaceutical, software, and relatedcompanies. Indeed, a comprehensive U.S. International Trade
67 See id.6 See supra notes 3147 and accompanying text.
1996]

U. Pa. . Int'l Econ. L.
Commission study ("ITC study") regarding the potential impactof the agreement on U.S. industries predicted that the U.S.pharmaceutical industry will be the only U.S. industry likely toexperience a sizable69 positive net trade effect as a result of theaccord.70 The agreement's gradual elimination of the MFA isalso likely to greatly impact the textiles and apparel industries.1
Elimination of the MFA will enable lower-cost producers oftextiles and apparel to gain access to new markets, allowingconsumers in these markets to purchase products at lower prices.This may hurt higher-cost producers of these goods in the samemarkets.72 The ITC study predicts that the relatively high-costU.S. textile and apparel industry will suffer the most of any U.S.industry from the results of the Uruguay Round.73 Accordingto the study, the U.S. textile and apparel industry will experiencea sizable negative net trade effect due to the accord.74
Worldwide reductions in national government export subsidiesmandated by the Uruguay Round should greatly benefit agricul-tural exporters.7s The ITC study predicted modest net tradeeffects76 for U.S. exporters of fruits and vegetables as well asgrain and animal feed.77
4. EVENT STUDY RESULTS AND ANALYSIS
4.1. Overview/Aggregate Results
Table One sets forth the prediction errors for the overall stockmarkets of the United States, Canada, and Mexico.78 It also
69 The ITC study considered an impact of more than 15% to be "sizable."See ITC Study, supra note 31, at 1-7.
70 See id. at xx.71 See supra notes 36-40 and accompanying text.72 See generally ITC Study, supra note 31, at xix (outlining the impact of
multilateral trade liberalization under Uruguay Round Agreements on exportsand imports).
71 See id.'4 See id. at xx.s See supra notes 38-44 and accompanying text.
76 The ITC study characterizes an effect between 5% and 15% as "modest."See ITC Study, supra note 31, at 1-7.
77 See id. at xx.71 See infra Table One.
For our purposes, prediction error is calculated as follows:
[V7ol. 17:3

MARKET PERSPECTIVE
provides aggregated stock market statistics for North America asa whole, the Asian/Pacific region, and Europe.79 Market statis-tics are based on "Dow Jones Equity" indices reported daily in theWall Street Journal.8 0 The recent nature of the "events" analyzed
PEIt = RIt - (c I + tPIRWt)
when all rates of return are in ex post terms. Prediction errors are tested forstatistically significant differences from zero with the following t-test tech-nique:
Ltitwhen
SE~t S 21+ 1+ - Rwt-Tw)2
n
t+1
with:
s2 = the variance of the market model residuals in the estimation period; andn = the number of days in the estimation period.
In other words, SEI, is the square root of the estimated forecast variance forday r in the analysis period. This test statistic has n-2 degrees of freedom andis Student's t-distributed. The null and alternative statistical hypotheses to betested using the equation to determine SEI, are:
H.: EE ) =0-L: E(PEIJ 0
"Event clustering" problems are avoided here by using portfolio results ratherthan individual security returns. See Larry Y. Dann & Christopher M.James,An Analysis of the Impact of Deposit Rate Ceilings on the Market Values of ThriftInstitutions, 37 J. FIN. 1259, 1272 (1982) (theorizing that portfolios are generallydiverse enough to avoid the impact of specific industry event clustering).
71 See infra Table One." See, e.g., Listed Options Quotations, WALL ST. J. Mar. 26, 1996, at C12
[hereinafter Listed Options]. The Dow Jones index for North America containsaggregate stock market statistics for Canada, Mexico, and the United States.
1996]

U. Pa. J Int'l Econ. L.
in this Article precludes use of computerized tape records. Thus,all market data was gleaned from manual examinations of theWall Street Journal.
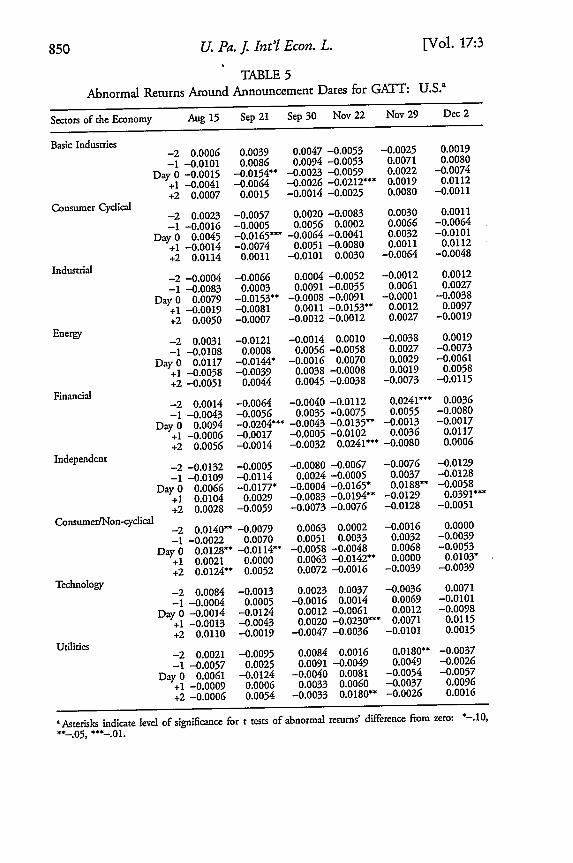
Tables Two, Three, Four, and Five build on the overallmarket analysis presented in Table One by examining the impactof the studied "events" on nine different sectors of the worldeconomy.1 Table Two examines prediction errors for economicsectors in North America, while Table Three conducts the sameanalysis for Asia.82 Table Four analyzes how industry sectors inEurope reacted to events leading to the U.S. ratification of theUruguay Round, while Table Five focuses on the impact of theseevents on economic sectors in domestic United States markets.83
The aggregate world market results are very interesting. Thereare absolutely no significant or abnormal prediction errors, eitherpositive or negative, for Europe.8 4 The same is true for Mexi-co.8" There are three abnormal returns for Canada, two positive,and one strongly negative.86 There are also three abnormalreturns for the United States, two strongly negative and onestrongly positive. For the North American region as a whole,including the United States, Canada, and Mexico, there are twoabnormal returns, one positive and one negative.88 These returnsdemonstrate that securities markets in the world did not react
The Asia/Pacific index contains statistics from Australia, Hong Kong,Indonesia, Japan, Malaysia, New Zealand, the Philippines, Singapore, SouthKorea, and Thailand. The European index contains market data from: Austria,Belgium, Denmark, Finland, France, Germany, Ireland, Italy, the Netherlands,Norway, Spain, Sweden, Switzerland, and the United Kingdom. See id.
81 See id. The Dow Jones World Stock Index sets forth the followingsectors: basic industries (e.g., chemicals, metals, paper products); consum-er/cyclical (e.g., apparel, retailers, media); industrial (e.g., railroad, trucking);energy (e.g., oil companies, pipelines, coal); financiale.g., banks, insurancecompanies); independent (e.g., conglomerates, overseas trading, plantations);consumer/non-cyclical (e.g., pharmaceuticals, medical supplies, food);technology (e.g., semiconductors, software, aerospace/defense); andutilities (e.g.,telephone, water, electric). See id.
82 See infra Table Two.83 See infra Tables Four and Five.84 See infra Table One.85 See id.86 See id.87 See id.88 See id.
[Vol. 17:3
MARKET PERSPECTIVE
conclusively, if at all, to positive events regarding the ratificationof the Uruguay Round.89
The only region in the world with an apparently clear reactionto these events was the Asian/Pacific region. While this regionexperienced only one significant prediction error, it was extremelypositive in nature.90
Given the anticipated widespread positive economic effects ofthe Uruguay Round,91 these results are somewhat surprising.They seem, however, to strongly confirm the earlier hypothesisthat the Uruguay Round will be the most beneficial for those na-tions/regions that are going to be the strongest competitors in thefuture.9 2 As noted, the Asian/Pacific region experienced themost positive net wealth effect of the regions studied. Further-more, the region's index is comprised of market data fromcountries like Singapore, Malaysia, Thailand, Korea, and Japan,93
countries that rank at the very top of the index of futurecompetitiveness. 4
In contrast, markets in the United States showed no evidenceof positive wealth effects associated with the ratification of theUruguay Round of GATT.9s While ranking number one in theworld in terms of current competitiveness/GDP per capita,96 theUnited States is only a middle-ranking future competitor.9 7
European countries, also ranked in the middle of the futurecompetitiveness charts,98 likewise showed no market reaction toUruguay Round ratification.9 In sum, the aggregate data seemsto confirm the theory that the impact of the Uruguay Round is
" See id. Prediction areas for all regions, whether normal or abnormal,were balanced between positive and negative. Canada had more positiveprediction errors (eighteen out of thirty dates having positive signs) than anyother country in North America or the European region. See infra Table One.
' See infra Table One (showing a single prediction error of extremepositive nature).
" See supra notes 3-5 and accompanying text.92 See supra note 52 and accompanying text.9' See supra note 80.9' See supra Chart Four.9' See infra Table One.96 See supra Chart One.9' See supra Chart Four.9' See supra Chart Four.99 See infra Table One.
1996]

U. Pa. J. Int'l Econ. L.
going to be long-term in nature'O° and that future, rather thanpresent, competitors will be its greatest beneficiaries.
4.2. Sector Analysis
4.2.1. Overview
Although events surrounding Congressional ratification of theUruguay Round did not have a net wealth effect on the overallmarket in the United States or other countries/regions, theseevents did significantly impact certain economic sectors/industriesin these countries and regions.0 1 This section presents a sectoralanalysis of the data.
4.2.2. United States
While the studied events had no significant impact on U.S.markets as a whole, the events did negatively impact certainspecific sectors of the U.S. economy." Not surprisingly, goodsof a consumer cyclical nature, including apparel, had a strongnegative prediction error.13 This is consistent with the negativeimpact the gradual elimination of the MFA will have on theapparel and related industries in the United States.0 4 It is alsoconsistent with the ITC Study's prediction of a sizable negativetrade effect for this and related U.S. industries as a result of theUruguay Round.0 5
The U.S. consumer non-cyclical sector, including the pharma-ceutical industry, showed an unsurprising slightly positive netreaction to the studied events.106 The Uruguay Round's intellec-tual property protections should be a boon to U.S. pharmaceuticalmanufacturers.' 7 The ITC Study predicted a major positive net
"00 See supra note 52 and accompanying text. To some extent, of course,this is obvious since many of the Uruguay Round's key provisions, like theelimination of the Multifiber Arrangement, don't completely phase in for fiveor more years. See supra note 52.
'01 See infra Tables One to Five.'02 See infra Table Five.103 See infra Table Five.104 See ITC Study supra note 31, at xix.105 See ITC Study, supra note 31, at xx.106 See infra Table Five.17 See Trade Pact's Key Provisions, supra note 36, at A6 (stating that the
pharmaceutical industry should be the "clearest winner" in the trade agree-
[Vol. 17:3

MARKET PERSPECVE
trade effect on this industry.'°8 The more modest positivemarket reaction, though, may reflect fears that while the agree-ment's intellectual property provisions represent a positive firststep, they need to be a lot stronger to really help U.S. holders ofvaluable pharmaceutical patents and other intellectual proper-ty.10
9
The overall flat reaction of the U.S. financial sector to theagreement is also not surprising. ° While the Uruguay Roundfailed to directly reach an agreement on the financial servicesissue,"' it did include an explicit framework for future negotia-tion on this and related trade-in-services subjects. 112 Thus, whileU.S. negotiators failed to secure immediate access for U.S. banksand securities firms to Japan and other Asian countries wheremarkets are currently closed to them, the door has been somewhatopened."'
A variety of other U.S. economic sectors, however, hadsurprisingly negative market reactions to Uruguay Round ratifica-tion events. Such reactions run counter to the ITC's generallysanguine predictions for all U.S. industry under the UruguayRound."1 For example, the basic industries sector (includingchemicals, metals, and paper products) had a sharply negativereaction, as did both the industrial (railroads, trucking, andbuilding materials) and technology sectors.1 These results tendto signal that U.S. industry may face more competition from
ment).108 See ITC Study, supra note 31, at xx.109 See Boskin, supra note 15, at 138 (noting that the agreement reached in
the Uruguay Round provides better protection than the current practically non-existent system); Many Business Leaders, supra note 34, at A6 (statement of PeterTeeley, Vice President, Amgen, Inc., claiming that protections should be muchstronger).
... See infra Table Five.'11 See Boskin, supra note 15, at 138 (admitting that the Uruguay Round
agreement has some shortcomings, including a failure on this account); TradePact's Key Provisions, supra note 36, at A6 (listing the major provisions of theUruguay Round agreement).
112 See ITCStudy, supra note 31, at IX-5-6 (noting that future developmentsin this area could greatly benefit certain U.S. service industries); Trade Pact'sKey Provisions, supra note 36, at A6 (stating that "negotiations would continue"about financial services issues).
113 See Trade Pact's Key Provisions, supra note 36, at A6.114 See ITC Study, supra note 31, at 1-9.11 See infra Table Five.
1996]

U. Pa. J Int'l Econ. L.
Asian and other countries under the Uruguay Round thanexpected. In particular, the negative reaction in the technologysector may illustrate the weakness of GATT's present intellectualproperty protections, ostensibly intended to protect and help U.S.software, semiconductor, and biotechnology companies. " "
4.2.3. North America
The sectoral results for North America in large measure mimicthose for the United States.117 The reactions of the basic indus-tries (chemicals, metals) and technology sectors in North Americacontinue to be clearly negative, while the financial services sectoris flat."' Surprisingly, the consumer cyclical sector, includingapparel, is flat for North America as a whole while negative forthe United States." 9 This may, in part, indicate that the elimi-nation of the MFA will negatively impact Mexico and Canada lessthe United States.12" In contrast, the consumer/non-cyclicalsector, including the pharmaceutical industry, while showingslightly positive abnormal returns for the United States, is flat forNorth America as a whole.12
' This may reflect some of thebenefits that the United States' strong pharmaceutical industrywill reap from the Uruguay Round's new intellectual propertyprotections." Overall, though, the results for North Americaas a whole are very similar to those for the United States.
4.2.4. Europe
While overall market reaction in Europe to the studied eventswas completely flat,1'2 sectoral analysis indicated flat to some-what negative reactions./A There were no significant or abnor-mal returns for the European basic industries, industrial, energy,financial, consumer/non-cyclical, and utilities sectors. 2 The
116 See supra note 107 and accompanying text.117 See infra Table Two.118 See infra Table Two.119 Compare infra Table Two with infra Table Five.12. See supra notes 71-74 and accompanying text.121 Compare infra Table Two with infra Table Five.122 See supra note 107 and accompanying text.12 See infra Table One.14 See infra Table Four.
" See infra Table Four.
[Vol. 17:3

MARKET PERSPECTIVE
European consumer/cyclical sector, including apparel, showed aslightly negative reaction, which may once again be related to thephasing out of the Multifiber Arrangement. 26 The sharpestnegative reaction in European markets, however, was in the"independent" sector of the economy, which includes overseastrading companies and conglomerates.1 27 These results appearcounterintuitive because companies of this kind should benefitmost from the generally liberalized world trade regime imple-mented as part of the Uruguay Round.12
' The empirical resultsappear to indicate, however, that European-based companies ofthis kind may be comparatively weaker future competitors underthe post-Uruguay Round economic construct. 129 The sameassertion may hold true for the European technology sector,which also experienced a clear negative reaction to the studiedevents.
130
4.2.5. Asia
Sectoral reaction in the Asian/Pacific region to the studiedevents was extremely positive, confirming the overall positivereaction in Asian/Pacific markets.131 Clear positive abnormalreturns were found for the consumer/cyclical, industrial, energy,financial, consumer/non-cyclical, and technology sectors. 132 Theremaining sectors (basic industries, independent, and utilities) werebasically flat.133 There were no abnormal or significant negativereturns for any Asian/Pacific economic sector."3 The strongestpositive significant returns were for the Asian financial andconsumer/non-cyclical sectors. 13
' The strong positive returnsfor the financial services sector in Asia makes considerable sense
126 See supra notes 39-40 and accompanying text.127 See infra Table Four.128 See supra notes 3-5 and accompanying text.129 See supra Chart Four.130 See supra Chart Four. See generally Terence Roth and Bhushan Bahree,
Europe, Despite Rising Joblessness, Isn't Likely to Turn to Protectionism, WALL ST.J., Apr. 1, 1996, at A9 (discussing problems the European economy has had incompeting in the new, post-WTO, globalized world economy).
131 See infra Table Three.132 See infra Table Three.133 See infra Table Three.131 See infra Table Three.131 See infra Table Three.
19961

U. Pa. J. Int'l Econ. L.
given the success, as noted above, of Japanese and other Asiannegotiators in keeping this sector of the Asian economy mostlyclosed to foreign competition. 36 While the Uruguay Roundagreement does put the issue of more open trade in financialservices "on the table," that is the limit of its accomplishments inthis area.17 In the meantime, Japanese and other Asian banks,securities firms, and other financial institutions remain largely freefrom competition from American and other foreign institu-tions.1
31
The very strong positive reaction in the Asian consumer/non-cyclical economic sector, which includes the pharmaceutical andother industries,139 is somewhat more puzzling. The data seemto suggest that Asian/Pacific countries are in a unique position toprofit in this sector.'4° For example, the agreement's newintellectual property provisions may hurt various developingcountries by forcing them to pay much higher prices for drugsand other goods. The developed and newly industrializedcountries of the Asian/Pacific region, however, are probably in aposition to benefit from stronger intellectual property rules.141
This situation should help spur even greater Asian/Pacific researchand development activity.142 Moreover, some Asian/Pacificcountries, like Malaysia, 43 already have strict rules regarding theprotection of intellectual property. The Uruguay Round removesany comparative advantage other countries currently enjoy overthem in this regard. Consequently, Malaysia will become an evenstronger Asian competitor in the future.'4
136 See supra note 50 and accompanying text.137 See supra note 50 and accompanying text.13. See supra note 50 and accompanying text; see also Trade Pact's Key
Provisions, supra note 36, at A6 (noting that U.S. negotiators failed to gainaccess for U.S. banks and securities firms in Japan and several SoutheasternAsian nations).
139 See infra Table Three.140 See KRUEGER, supra note 38, at 53. This is because of the Uruguay
Round's new phase-in intellectual property protections and its overall easing ofexport barriers. See id.
141 See id. at 53 & n.30.142 See id. at 53143 See id. at 53 n.30.144 See generally id. at 53 n.30 (noting that "besides the direct cost of higher
prices, developing countries will be financing the foreign exchange cost ofthelarger royalty payments"). Malaysia ranked second only to Singapore as the
[Vol. 17:3

MARKET PERSPECTIVE
5. CONCLUSION
The Uruguay Round agreement of the GATT/WTO isperhaps the most important event in recent world economichistory. Our event study analysis, however, shows that securitiesmarkets throughout the world did not react equally to theagreement. While the overall Asian/Pacific market as well asnumerous industrial sectors in that market reacted extremelypositively to the accord, reactions in markets in Europe andNorth America were basically flat to slightly negative. The long-term nature of the impact of the Uruguay Round on the worldeconomy likely contributed in large measure to our empiricalfindings. Many of the agreement's provisions, such as itselimination of the world MFA, will not be fully phased in for upto a decade. Moreover, even after all the agreement's provisionsbecome fully implemented it will take numerous years for theireconomic impact to be fully felt. Consequently, the agreementwill probably most benefit those countries and regions which arein the best "competitive" position a decade or two into the future.A recent comprehensive analysis of "future competitiveness" gavethe highest scores in this regard to Singapore, Malaysia, Thailand,China, Japan, and Korea, with scores for North America andEuropean countries generally lagging far behind. Consequently,the empirical results of our study appear to provide hard evidencecorroborating the perceived positive economic benefit theUruguay Round of the GATT/WTO will bring to theAsian/Pacific region of the world.
top future competitor in the world. See supra Chart Four.
1996]

U. Pa. J Int'l Econ. L. [Vol. 17:3
TABLE 1Abnormal Returns Around Announcement Dates for GATT:
Aggregate Average Results for Selected Countries and Regions?
Aug 15 Sep 21 Sep 30 Nov 22 Nov 29 Dec 2
-2 0.0040 -0.0050 0.0023 -0.0030 0.0043 0.0017-1 -0.0047 0.0015 0.0043 -0.0021 0.0053 -0.0048
Day 0 0.0067 -0.0138* -0.0036 -0.0042 0.0023 -0.0057+1 -0.0007 -0.0031 0.0027 -0.0098 0.0017 0.0104*+2 0.0067 0.0019 -0.0001 0.0043 -0.0048 -0.0026
-2 0.0046 -0.0058 0.0026 -0.0026 0.0043 0.0013-1 -0.0049 0.0013 0.0051 -0.0017 0.0052 -0.0050
Day 0 0.0074 -0.0146*** -0.0032 -0.0040 0.0022 -0.0061+1 -0.0008 -0.0031 0.0026 -0.0108" 0.0013 0.0113*+2 0.0064 0.0018 0.0007 0.0043 -0.0050 -0.0024
North America
U.S.
Canada
Mexico
Asia
Europe
-2 -0.0074 0.0016-1 0.0065 0.0048
Day 0 0.0114 -0.0041+1 0.0055 0.0135+2 0.0153 0.0085
-0.0068 -0.0159-0.0206 -0.0117-0.0147 -0.0026
0.0114 0.0169-0.0177 -0.0011
-2 -0.0003 0.0045 -0.0073 0.0042-1 0.0049 -0.0003 -0.0050 0.0008
Day 0 -0.0047 0.0192** 0.0077 0.0001+1 0.0004 0.0030 -0.0036 0.0086+2 -0.0048 0.0004 0.0037 -0.0038
-2 -0.0052 0.0010 0.0130 -0.0017-1 0.0007 -0.0024 0.0015 0.0017
Day 0 -0.0030 -0.0069 -0.0063 0.0060+1 0.0005 0.0004 0.0013 0.0011+2 -0.0024 0.0030 -0.0058 -0.0019
0.0134* 0.00310.0023 -0.0042
-0.0052 0.00380.0031 0.0070
-0.0043 -0.0011
-0.0011 0.01280.0176 -0.00230.0254 -0.02010.0128 -0.0089
-0.0023 -0.0020
-0.0038 0.0005-0.0046 0.0025-0.0008 0.0047
0.0005 -0.01030.0025 0.0020
-0.0019 -0.0026-0.0011 0.0049-0.0015 0.0011-0.0026 -0.0017
0.0049 0.0028
'Asterisks indicate level of significance for t tests of abnormal returns' diffrence from zero: *-.10,**-.05, *** --01.
-2 0.0034 0.0075 0.0035 -0.0038-1 -0.0100 0.0108 0.0028 -0.0014
Day 0 0.0024 -0.0150* -0.0008 -0.0058+1 0.0001 -0.0017 -0.0011 0.0037+2 0.0071 0.0038 0.0010 0.0134"

1996] MARKET PERSPECTIVE
TABLE 2Abnormal Returns Around Announcement Dates for GATT: North America
Sectors of the Economy Aug 15 Sep 21 Sep 30 Nov 22 Nov 29 Dec 2
Basic Industries-2 0.0004 0.0054 0.0059 -0.0063 -0.0016 0.0039-1 -0.0103 0.0109 0.0072 -0.0064 0.0075 0.0063
Day 0 -0.0019 -0.0132- -0.0024 -0.0066 0.0010 -0.0045+1 -0.0034 -0.0049 -0.0024 -0.0170" 0.0039 0.0111+2 0.0014 0.0020 -0.0023 -0.0016 0.0063 -0.0019
Consumer Cyclical -2 0.0018 -0.0054 0.0027 -0.0081 0.0084 0.0016-1 -0.0016 -0.0002 0.0045 0.0001 0.0013 -0.0062
Day 0 0.0047 -0.0153 -0.0063 -0.0044 0.0037 -0.0095+1 -0.0011 -0.0072 0.0042 -0.0065 0.0016 0.0105+2 0.0118 0.0013 0.0026 0.0084 -0.0062 -0.0049
Industrial-2 -0.0013 -0.0055 0.0052 -0.0054 -0.0016 0.0030-1 -0.0058 0.0003 0.0003 -0.0580 0.0061 0.0022
Day 0 0.0079 -0.0127- -0.0028 -0.0062 0.0037 -0.0034+1 -0.0014 -0.0073 0.0018 -0.0126* 0.0030 0.0085+2 0.0063 0.0006 -0.0041 -0.0016 0.0022 -0.0027
Energy -2 0.0029 -0.0116 -0.0014 0.0002 -0.0040 0.0017-1 -0.0105 0.0007 0.0056 -0.0064 0.0027 -0.0067
Day 0 0.0112 -0.0139- -0.0017 0.0058 0.0027 -0.0066+1 -0.0058 -0.0038 0.0037 -0.0015 0.0017 0.0053+2 -0.0047 0.0041 0.0040 -0.0040 -0.0067 -0.0111
Financial-2 0.0018 -0.0063 -0.0036 -0.0106 0.0250 0.0033-1 -0.0049 -0.0049 0.0038 -0.0070 0.0058 -0.0077
Day 0 0.0093 -0.0195- -0.0043 -0.0127" -0.0015 -0.0014+1 -0.0002 -0.0022 -0.0003 -0.0092 0.0033 0.0112"+2 0.0060 -0.0010 -0.0034 0.0250- -0.0077 0.0010
Independent -2 -0.0132 -0.0005 -0.0080 -0.0066 -0.0076 -0.0129-1 -0.0109 -0.0114 0.0023 -0.0006 0.0037 -0.0127
Day 0 0.0066 -0.0177- -0.0005 -0.0165- 0.0188* -0.0064+1 0.0103 0.0029 -0.0083 -0.0195* -0.0129 0.0302**+2 0.0028 -0.0059 -0.0073 -0.0076 -0.0127 -0.0053
ConsumerfNon-cyclical -2 0.0131 -0.0075 0.0059 0.0001 -0.0014 0.0002-1 -0.0026 0.0071 0.0048 0.0030 0.0031 -0.0038
Day 0 0.0128- -0.0111"* -0.0059 -0.0048 0.0066 -0.0049+1 0.0023 -0.0003 0.0064 -0.0135* 0.0002 0.0098*+2 0.0123 0.0051 0.0069 -0.0014 -0.0038 -0.0038
Technology -2 0.0085 -0.0004 0.0021 0.0034 -0.0033 0.0072-1 -0.0008 0.0003 -0.0011 0.0010 0.0067 -0.0100
Day 0 -0.0011 -0.0124 0.0011 -0.0062 0.0010 -0.0095+1 -0.0011 -0.0041 0.0020 -0.0225*** 0.0072 0.0117+2 0.0113 -0.0017 -0.0043 -0.0033 -0.0100 0.0012
Utilities-2 0.0015 -0.0073 0.0070 0.0002 0.0169.* -0.0028-1 -0.0054 0.0023 0.0071 -0.0047 0.0054 -0.0027
Day 0 0.0070 -0.0115 -0.0040 0.0065 -0.0040 -0.0048+1 -0.0017 0.0004 0.0035 0.0068 -0.0028 0.0076+2 0.0006 0.0056 -0.0036 0.0169*** -0.0027 0.0016
'Asterisks indicate level of significance for t tests of abnormal returns' difference from zero: *-.10,*-.05, -*-.01.

U. Pa. J. Int'l Econ. L. [Vol. 17:3
TABLE 3Abnormal Returns Around Announcement Dates for GATT: Asia
Sectors of the Economy Aug 15 Sep 21 Sep 30 Nov 22 Nov 29 Dec 2
Basic Industries
Consumer Cyclical
Industrial
Energy
Financial
Independent
Consumer/Non-cyclical
Technology
Utilities
-2 0.0018 0.0031-1 0.0038 0.0026
Day 0 -0.0025 0.0222**+1 0.0032 0.0050+2 -0.0013 0.0066
-2 0.0007 0.0037-1 0.0045 -0.0034
Day 0 -0.0062 0.0205**+1 -0.0016 0.0018+2 -0.0053 0.0031
-2 -0.0024 0.0026-1 0.0062 -0.0003
Day 0 -0.0042 0.0205**+1 0.0002 0.0021+2 -0.0052 -0.0002
-2 0.0036 0.0081-1 0.0057 0.0001
Day 0 -0.0016 0.0169*+1 -0.0041 -0.0020+2 -0.0051 0.0027
-2 -0.0018 0.0048-1 0.0038 -0.0007
Day 0 -0.0047 0.0189**+1 0.0023 0.0046+2 -0.0052 -0.0009
-2 0.0064 0.0082-1 -0.0005 -0.0024
Day 0 -0.0056 0.0128+1 -0.0004 -0.0004+2 -0.0040 -0.0043
-2 0.0006 0.0021-1 0.0059 0.0029
Day 0 -0.0043 0.0159**+1 -0.0006 0.0003+2 -0.0049 -0.0032
-2 -0.0061 0.0021-1 0.0032 0.0020
Day 0 -0.0056 0.0234*+1 -0.0011 0.0038+2 -0.0086 -0.0030
-2 0.0055 0.0129-1 0.0125 -0.0001
Day 0 -0.0060 0.0099+1 -0.0014 0.0028+2 -0.0030 0.0025
-0.0061 0.0062 -0.0005 -0.0077-0.0070 0.0014 -0.0058 0.0042
0.0103 0.0013 -0.0008 -0.0024-0.0024 0.0088 -0.0077 -0.0175*
0.0003 -0.0005 0.0042 -0.0003
-0.0089 0.0053 -0.0075 -0.0012-0.0060 0.0002 -0.0046 0.0029
0.0086 -0.0021 -0.0031 0.0016-0.0043 0.0065 -0.0012 -0.0106
0.0020 -0.0075 0.0029 0.0039
-0.0081 0.0055 -0.0036 -0.0032-0.0058 0.0025 -0.0085 0.0038
0.0077 0.0005 -0.0008 -0.0017-0.0027 0.0087 -0.0032 -0.0107
0.0036 -0.0036 0.0038 0.0011
-0.0153 0.0021 0.0073 -0.0058-0.0091 0.0041 -0.0056 -0.0001
0.0167" -0.0063 0.0036 0.0052-0.0071 0.0166* -0.0058 -0.0143
0.0094 0.0073 -0.0001 0.0035
-0.0090 0.0011 0.0016 0.0068-0.0005 -0.0012 -0.0016 0.0030
0.0063 0.0007 0.0006 0.0146**-0.0034 0.0057 0.0068 -0.0087
0.0057 0.0016 0.0030 0.0022
-0.0058 -0.0005 -0.0095 -0.0022-0.0050 0.0029 0.0004 -0.0014
0.0099 -0.0004 -0.0016 0.0025-0.0059 -0.0037 -0.0220 -0.0152
0.0039 -0.0095 -0.0014 -0.0021
-0.0054 0.0069 -0.0015 -0.0018-0.0083 0.0023 -0.0063 0.0129*
0.0041 0.0006 -0.0012 0.0025-0.0001 0.0087 -0.0018 -0.0098
0.0049 -0.0015 0.0129* 0.0053
0.0017 0.0078 -0.0043 0.0011-0.0104 -0.0011 -0.0099 -0.0050
0.0111 -0.0037 0.0002 0.0050-0.0090 0.0108 0.0011 -0.0081
0.0013 -0.0043 -0.0050 0.0009
-0.0009 0.0032 -0.0055 0.0009-0.0078 0.0035 -0.0021 -0.0050-0.0005 0.0053 -0.0034 -0.0036
0.0002 0.0101 0.0009 -0.00800.0030 -0.0055 -0.0050 -0.0004
'Asterisks indicate level of significance for r tests of abnormal returns' difference from zero: *-.10,**-05, *** -.01.

MARKET PERSPECTIVE
TABLE 4Abnormal Returns Around Announcement Dates for GATT: Europe
Sectors of the Economy Aug 15 Sep 21 Sep 30 Nov 22 Nov 29 Dec 2
Basic Industries
Consumer Cyclical
Industrial
Energy
Financial
Independent
Consumer/Non-cyclical
-2 -0.0044 0.0047 0.0047-1 0.0003 -0.0060 -0.0016
Day 0 -0.0067 -0.0046 -0.0040+1 0.0027 -0.0005 -0.0061+2 -0.0067 -0.0012 -0.0056
-2 -0.0051 0.0001 0.0054-1 0.0005 -0.0060 0.0004
Day 0 -0.0053 -0.0079 -0.0109"+1 -0.0017 -0.0023 0.0014+2 -0.0041 0.0010 -0.0043
-2 -0.0078 0.0013 0.0070-1 -0.0026 -0.0049 -0.0026
Day 0 -0.0049 -0.0074 -0.0093+1 -0.0017 -0.0015 -0.0004+2 -0.0025 0.0033 -0.0060
-2 -0.0061 -0.0046 0.0029-1 0.0016 -0.0050 -0.0035
Day 0 -0.0044 -0.0093 -0.0032+1 0.0011 -0.0022 0.0039+2 -0.0088 -0.0060 0.0001
-2 -0.0078 0.0022 0.0080-1 -0.0017 -0.0029 0.0010
Day 0 -0.0086 -0.0077 -0.0059+1 -0.0025 0.0023 0.0005+2 -0.0020 0.0008 -0.0093
-2 -0.0023 0.0051 0.0101-1 -0.0018 -0.0104 0.0033
Day 0 -0.0007 -0.0137* -0.0157""+1 0.0003 -0.0056 0.0008+2 -0.0049 0.0040 -0.0074
-2 -0.0005 -0.0049 0.0079-1 0.0043 0.0010 0.0003
Day 0 0.0075 -0.0082 -0.0040+1 0.0013 -0.0018 0.0001+2 -0.0015 0.0042 -0.0097
-0.0062 -0.0037 -0.0083-0.0003 -0.0030 0.0013
0.0024 -0.0031 -0.0015-0.0019 -0.0083 -0.0048-0.0037 0.0013 0.0050
-0.0022 -0.0090 -0.0059-0.0005 -0.0046 0.0048
0.0050 -0.0040 -0.0043-0.0010 -0.0059 -0.0067-0.0090 0.0048 -0.0003
-0.0031 -0.0047 -0.00570.0021 -0.0019 0.00230.0062 -0.0028 -0.0008
-0.0004 -0.0057 -0.0073-0.0047 0.0023 -0.0009
-0.0021 -0.0008 0.0026-0.0021 -0.0016 0.0070
0.0069 -0.0048 -0.0042-0.0040 0.0026 -0.0001-0.0008 0.0070 -0.0028
-0.0022 0.0016 -0.00260.0016 -0.0015 0.00500.0038 -0.0011 0.00240.0003 -0.0026 0.00010.0015 0.0050 0.0057
-0.0047 -0.0188- 0.00190.0019 -0.0018 -0.00140.0042 0.0009 0.0031
-0.0002 0.0019 -0.0058-0.0188- -0.0014 0.0044
-0.0029 -0.0020 -0.00140.0001 -0.0013 0.00370.0046 -0.0008 -0.00350.0013 -0.0014 -0.0024
-0.0020 0.0037 0.0041
-2 -0.0129 -0.0015 0.0091 -0.0060 0.0040 -0.0134-1 0.0021 -0.0058 0.0009 -0.0043 -0.0015 0.0039
Day 0 -0.0134 -0.0078 -0.0321** 0.0040 -0.0031 0.0059+1 0.0005 0.0029 -0.0012 -0.0056 -0.0134 -0.0023+2 -0.0008 0.0040 -0.0042 0.0040 0.0039 0.0039
Uilities-2 -0.0108 0.0003 0.0074 -0.0010 -0.0111 -0.0015-1 -0.0030 -0.0039 0.0106 0.0015 0.0006 0.0083
Day 0 -0.0099 -0.0085 -0.0063 0.0044 -0.0014 0.0025+1 -0.0015 -0.0012 0.0007 -0.0062 -0.0015 -0.0027+2 0.0001 0.0039 -0.0121 -0.0111 0.0083 -0.0009
'Asterisks indicate level of significance for t tests of abnormal returns' difference from zero: -. 10,**-.05, ***--.1
1996]
Technology
U. Pa. J. Int'l Econ. L. [Vol. 17:3
TABLE 5
Abnormal Returns Around Announcement Dates for GATT: U.S.a
Sectors of the Economy Aug 15 Sep 21 Sep 30 Nov 22 Nov 29 Dec 2
Basic Industries
Consumer Cyclical
Industrial
Energy
Financial
Independent
Consumer/Non-cyclica
-2 0.0006 0.0039 0.0047 -0.0053 -0.0025 0.0019-1 -0.0101 0.0086 0.0094 -0.0053 0.0071 0.0080
Day 0 -0.0015 -0.0154* -0.0023 -0.0059 0.0022 -0.0074+1 -0.0041 -0.0064 -0.0026 -0.0212** 0.0019 0.0112
+2 0.0007 0.0015 -0.0014 -0.0025 0.0080 -0.0011
-2 0.0023 -0.0057 0.0020 -0.0083 0.0030 0.0011
-1 -0.0016 -0.0005 0.0056 0.0002 0.0066 -0.0064Day 0 0.0045 -0.0165** -0.0064 -0.0041 0.0032 -0.0101
+1 -0.0014 -0.0074 0.0051 -0.0080 0.0011 0.0112+2 0.0114 0.0011 -0.0101 0.0030 -0.0064 -0.0048
-2 -0.0004 -0.0066 0.0004 -0.0052 -0.0012 0.0012
-1 -0.0083 0.0003 0.0091 -0.0055 0.0061 0.0027Day 0 0.0079 -0.0153** -0.0008 -0.0091 -0.0001 -0.0038
+1 -0.0019 -0.0081 0.0011 -0.0153" 0.0012 0.0097+2 0.0050 -0.0007 -0.0012 -0.0012 0.0027 -0.0019
-2 0.0031 -0.0121 -0.0014 0.0010 -0.0038 0.0019-1 -0.0108 0.0008 0.0056 -0.0058 0.0027 -0.0073
Day 0 0.0117 -0.0144" -0.0016 0.0070 0.0029 -0.0061+1 -0.0058 -0.0039 0.0038 -0.0008 0.0019 0.0058+2 -0.0051 0.0044 0.0045 -0.0038 -0.0073 -0.0115
-2 0.0014 -0.0064 -0.0040 -0.0112 0.0241- 0.0036-1 -0.0043 -0.0056 0.0035 -0.0075 0.0055 -0.0080
Day 0 0.0094 -0.0204*** -0.0043 -0.0135"* -0.0013 -0.0017+1 -0.0006 -0.0017 -0.0005 -0.0102 0.0036 0.0117+2 0.0056 -0.0014 -0.0032 0.0241*** -0.0080 0.0006
-2 -0.0132 -0.0005 -0.0080 -0.0067 -0.0076 -0.0129
-1 -0.0109 -0.0114 0.0024 -0.0005 0.0037 -0.0128Day 0 0.0066 -0.0177" -0.0004 -0.0165" 0.0188* -0.0058
+1 0.0104 0.0029 -0.0083 -0.0194** -0.0129 0.0391"**+2 0.0028 -0.0059 -0.0073 -0.0076 -0.0128 -0.0051
-2 0.0140* -0.0079 0.0063 0.0002 -0.0016 0.0000-1 -0.0022 0.0070 0.0051 0.0033 0.0032 -0.0039
Day 0 0.0128"* -0.0114* -0.0058 -0.0048 0.0068 -0.0053+1 0.0021 0.0000 0.0063 -0.0142* 0.0000 0.0103"+2 0.0124"* 0.0052 0.0072 -0.0016 -0.0039 -0.0039
Technology -2 0.0084 -0.0013 0.0023 0.0037 -0.0036 0.0071
-1 -0.0004 0.0005 -0.0016 0.0014 0.0069 -0.0101Day 0 -0.0014 -0.0124 0.0012 -0.0061 0.0012 -0.0098
+1 -0.0013 -0.0043 0.0020 -0.0230*** 0.0071 0.0115+2 0.0110 -0.0019 -0.0047 -0.0036 -0.0101 0.0015
Utilities -2 0.0021 -0.0095 0.0084 0.0016 0.0180* -0.0037
-1 -0.0057 0.0025 0.0091 -0.0049 0.0049 -0.0026Day 0 0.0061 -0.0124 -0.0040 0.0081 -0.0054 -0.0057
+1 -0.0009 0.0006 0.0033 0.0060 -0.0037 0.0096
+2 -0.0006 0.0054 -0.0033 0.0180* -0.0026 0.0016
aAsterisks indicate level of significance for t tests of abnormal returns' difference from zero: *-.10,**-.05, ***-.01.