the future of solar energy: power plant scale csp
TRANSCRIPT

The Future of Solar Energy: Power Plant Scale CSP
December 10, 2008
María MéndezTom DownesJames Blatchford
Contents Paper Outline.............................................................................................................................................2 Why Concentrating Solar Power?.....................................................................................................3 Policy History of the Solar Power Industry..................................................................................7 Market Status of CSP Technology...................................................................................................13 The Economic Benefits of CSP.........................................................................................................19 Areas for Future Research.................................................................................................................23 Cost Analysis............................................................................................................................................27 Policy Recommendations...................................................................................................................31 Appendices...............................................................................................................................................33

Paper Outline Solar energy is the largest renewable energy resource in the world. The technology is here. With targeted investment and thoughtful public policy the United States can establish solar as a vital part of its electricity portfolio.
This document offers a comprehensive look at the potential for developing concentrating solar power (CSP) as a competitive electricity-generating alternative to more traditional U.S.
energy sources. CSP uses mirrors to concentrate sunlight in order to heat a liquid or gas which is used to generate
electricity.
Our focus is three-fold—policy, technology and economics. We ask how these can combine to drive the investment, technological advancements and deployment necessary to
further raise efficiency and push down costs.
We begin with an analysis of why CSP technology should be developed in the U.S. Southwest. A close look at the public policy history that surrounds renewable energy follows. The technologies and their current market statuses are then highlighted and the potential economic benefits associated with deployment of solar technology on a large scale are outlined. The technological aspects vital to greater market penetration are then discussed and a simple model is developed to calculate and compare the per energy unit costs of various projects. We conclude by providing several policy recommendations which we believe will be essential to achieve these goals. Figure 1 - From left; dish/engine, power tower and parabolic trough technologies (credit: NREL)
Solar Potential
E New projects are both planned and under construction, but at the end of 2007 total U.S. installed capacity (including photovoltaics) was still just 1,293MW4.

Figure 2 – Direct normal solar resource availability in the Southwestern U.S. (credit: NREL)
Further diversifying the energy portfolio by expanding solar electricity generating capacity decreases the total risk of the portfolio to fluctuations in the value of any one component. Renewable Resource Electricity Demand
An average U.S. household consumes 11,000kWh/year of electricity11. Even if we were to conservatively estimate that just 4GW of solar is deployed by 2030 this will still provide the entire yearly electricity needs for 1 million households at a capacity factor of 30 percent.
Public Policy State initiatives such as renewable portfolio standards (RPSs) have also promoted development by requiring utilities to purchase and distribute more energy from renewable sources.
Technical Characteristics CSP has a stand-alone capacity that enables it to be an alternative to major grid upgrades (especially at the edges) by placing units near to demand centres.
Policy History of the Solar Power Industry

T The Energy Policy Act of 2005 and the Economic Stabilization Package of 2008 have extended incentives and improved the certainty of the investment environment. Early Developments The idea of harnessing sunlight for energy can be traced to ancient Rome and Greece. Active research on the potential of solar as an energy source began at the beginning of the 20th century, with scientists like Nikola Tesla and Albert Einstein exploring radiation. Parabolic troughs were used to produce steam in France during the 1800s, and in the 1960s, the first parabolic trough system was developed in Odeillo, France by Professor Félix Trombe in the form of an eight-story parabolic mirror. During 1958 alone, five different satellites were launched incorporating PV, developed by the then newly-created government space program, NASA (National Aeronautics and Space Administration). Silicon solar cells are still the most widely used energy source for space applications.
The 1970s and the First Energy Act The six systems of what is commonly referred to as SEGS that remain operational today provide around 350MW of generating capacity. Pilot projects of the 1980s and favorable legislation of the 1990s In 1979 President Carter announced an increase in the national allocation for research and development (R&D) in solar energy. This effort culminated in 1980 with the passing of the Renewable Energy Resource Act (RERA—part of the National Energy Security Act). By 1982, the Solar One plant was fully operational at 10MW, establishing the feasibility of power-tower systems and of CSP in general. In 1986, the Kramer Junction solar field was commissioned and purchased by Southern California Edison (SCE). Throughout the
Figure 4 - CSP Timeline, 1900s to Today Source: DOE
decade eight more of the Solar Electric Generating Systems (SEGS) were commissioned. Until a 64MW plant came online in Nevada in late-2006 no other additions had been made to CSP generating capacity since. Despite the relative success of the SEGS, the twenty years that followed saw almost no progress in CSP deployment. During the 1980s the Reagan administration did not enact any new renewable energy initiatives and the tax credit passed in 1978 was eventually reduced to 12 percent in 1987 and 10 percent in 1988 by a mandate of the 1986 Tax Reform Act. The 2000s and a resurgence in support and growth
The completion of NREL’s Solar Energy Research Facility building in 1991 was recognized as the most energy-efficient of all government buildings in the world,
incorporating both PV and solar thermal technologies. The present decade has seen some major changes in policy. Oil price increases and heightened public awareness of the environmental damages of conventional fuel sources have incentivized commercial and governmental R&D initiatives for CSP and other renewable technologies. Since 2001, the government has spent around $18 billion in alternative energy research. An amendment to PURPA made in 2005 calls for state standards. This change is largely superficial as many states had already implemented them, but it does allow them to embed in their legislation mandatory percentages of energy that utilities must purchase from clean sources with particular carve outs for specific
technologies. The RPS mandate effectively creates a market in tradable renewable electricity certificates because electricity distributors or purchasers are required to source a percentage of their electricity portfolio from renewable energy sources. If entities fall short of their state-mandated quota, they can purchase certificates from suppliers who have generated renewable electricity. At present, 25 States and the District of Columbia have mandatory RPS programs while Missouri, North Dakota, Vermont, and Virginia have voluntary renewable energy programs38.
The Energy Policy Act of 2005 renewed the ITC for two years (1/1/2006-12/31/2007). In 2006, the Tax Relief and Health Care Act of 2006 extended the credit for one additional year to December 2008. More recently, the Emergency Economic Stabilization Act of 2008 mandated further provisions supporting efficiency and renewable energy, including the extension of the ITC (commercial and residential) until 2016. The 8-year extension eliminates the monetary cap for residential solar electric appliances, allowing utilities and alternative minimum tax filers to take the credit for those installations. This change works towards removing the conflict of interest that utilities have in solar consumption. Currently, public utility company (PUC) revenues are a function of net consumer energy consumption. Therefore, PUCs have no incentive to push for alternative sources energy (net metered with what is produced from PV panels) because it reduces revenue. The installation credit is a small push towards aligning solar incentives with utility objectives as it rewards PUCs for sourcing from alternative energy. The 8-year timeframe provides greater certainty for developers and investors. The bill also authorizes $800 million for clean energy bonds for renewable energy generating facilities. The 2008 bill extends many of the provisions made in the 2005 bill enabling the sector to sustain its forward momentum. Appendix II provides further details on current policies in place at the Federal level.
Looking to the near future, the 2009 federal budget includes around $3 billion for all varieties of alternative energy technology. With a change in administration occurring in January 2009 it is unlikely that any less focus will be placed on renewable energy development, but near-term investment from the DOE and other industry players will largely be influenced by economic stability, not policy and new legislation.
Market Status of CSP Technology
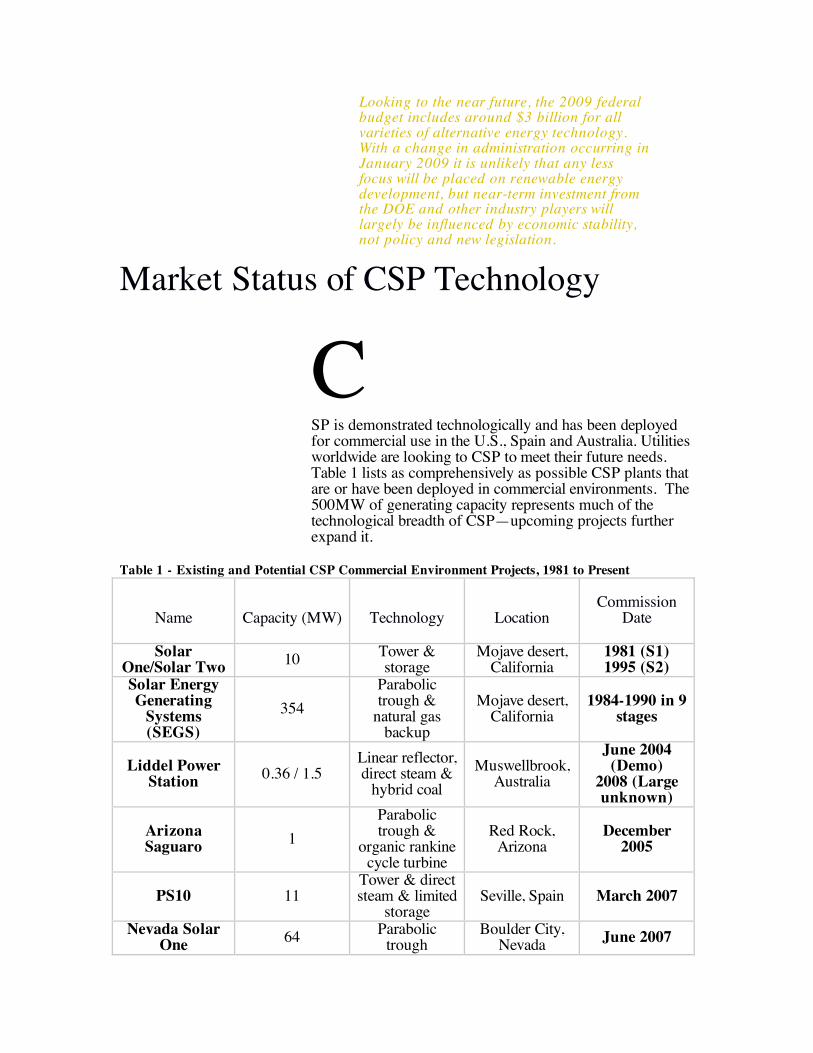
C SP is demonstrated technologically and has been deployed for commercial use in the U.S., Spain and Australia. Utilities worldwide are looking to CSP to meet their future needs. Table 1 lists as comprehensively as possible CSP plants that are or have been deployed in commercial environments. The 500MW of generating capacity represents much of the technological breadth of CSP—upcoming projects further expand it.
Table 1 - Existing and Potential CSP Commercial Environment Projects, 1981 to Present
Name
Capacity (MW)
Technology
Location
Commission
Date
Solar One/Solar Two 10 Tower &
storage Mojave desert,
California 1981 (S1) 1995 (S2)
Solar Energy Generating
Systems (SEGS)
354
Parabolic trough &
natural gas backup
Mojave desert, California
1984-1990 in 9 stages
Liddel Power Station 0.36 / 1.5
Linear reflector, direct steam &
hybrid coal
Muswellbrook, Australia
June 2004 (Demo)
2008 (Large unknown)
Arizona Saguaro 1
Parabolic trough &
organic rankine cycle turbine
Red Rock, Arizona
December 2005
PS10 11 Tower & direct steam & limited
storage Seville, Spain March 2007
Nevada Solar One 64 Parabolic
trough Boulder City,
Nevada June 2007

Kimberlina 5 Linear reflector & direct steam
Bakersfield, California
27 October 2008
Andasol 1 50
Parabolic trough & thermal storage
Granada, Spain
6 November 2008
CSP Technologies Parabolic Troughs and Linear (Fresnel) Reflectors Parabolic trough technology is the most popularly deployed CSP option. Linear reflectors are quite similar to parabolic trough systems and so we include them together, but there are notable engineering differences that might make linear reflectors more attractive in the future or in certain applications. HTFs are heated in the solar field by concentrated sunlight. They are then used to boil water to spin a turbine or are sent to a storage tank to provide power at a later time. Typical HTFs include synthetic oils and molten salts.
Parabolic troughs use long parabolic mirrors oriented length-wise from north to south whose focus tracks the east-west position of the sun throughout the day. In a trough system the tube resides at the focus of the parabola and moves as the mirrors move with the sun.
The size of both Andasol 1 and the individual SEGS plants are directly related to contemporary public policies. The SEGS plants were limited to 30MW each until a regulation limiting small power suppliers was changed to allow up to 80MW of production. Similarly the Spanish government does not allow renewable energy subsidies to plants above 50MW in capacity. The fact that many 30MW SEGS plants were built and that 2 more Andasol plants are planned suggests that public policy often limits the size of CSP plants rather than technological or financial concerns. In fact, finances may be harmed when policy hampers the ability to reach economies of scale.
A big advantage for both trough and linear systems is the possibility of incorporating storage of heat to provide power dispatchability when the plant is operating below peak capacity. Without energy storage, solar power plants are unable to always produce at peak capacity. This is due to reduced insolation during nighttime or cloudy periods—the insolation is less in the early morning, late afternoon and, obviously, at night. Often the HTF or steam is stored in an insulated tank but alternative storage media may be used. The amount of designed storage can enable a CSP plant to run at peak capacity throughout the day and into the night depending on the amount. In Spain, recently deployed Andasol 1 incorporates 7.5 hours of storage at full generating capacity, allowing for near continuous operation in the summertime.

The most famous CSP plants are the nine parabolic trough plants in the Mojave Desert, California. SEGS I was built in 1984 with one or more succeeding stations being built in every year until 1990 and have been in continuous operation since. The largest individual SEGS stations, numbers VIII and IX, produce 80MW each and remain the world’s largest solar power plants, including PV technology. Only one SEGS plant has hear storage, but each has a natural gas backup for periods when the natural insolation is insufficient to meet demand,.
Figure 4 - Schematic of a generic parabolic trough system (credit: Renewable Energy
World)
Figure 5 - The Kimberlina linear reflector power plant. The mirrors are shown pointing vertically with the HTF pipe
mechanically separate (credit: Ausra Inc.) The Andasol 1 power station was commissioned on 6 November 2008 and is arguably the most compelling CSP power plant to date. It builds directly on the SEGS plants in that it uses the same synthetic oil for its HTF and that it demonstrated the SKAL-ET parabolic mirrors through expansion of SEGS V before deployment in Spain. However it adds nitrate salt thermal storage, allowing for dispatchability without falling back on fossil fuel generation as SEGS did. Ausra, an American-founded company with a large Australian presence, has built two demonstration linear reflector direct steam plants in New South Wales, Australia and Bakersfield, California. One advantage of direct steam plants is the potential for hybridization with another fuel source as was done by combining a 1.5MW linear
system with the Liddell Coal Power Station in New South Wales. This was built after demonstrating a 0.36MW system in June 2004. The Kimberlina plant in Bakersfield is a non-hybridized linear system producing 5MW of peak power. Solar Power Towers Solar tower systems have a heritage going back even further than the SEGS plants. However they left the commercial market until PS10 was built near Seville, Spain in 2007. A solar power tower plant is similar to a trough/linear plant except that rather than concentrating light on a set of linear pipes, a field of mirrors ( “heliostats”) focus light on a

single central tower. Inside the tower can be a HTF or steam. Figure 6 – Solar Two, Mojave Desert (credit: NREL)
The main advantage of the design is that there are fewer materials for storage of the HTF/steam and also a more favorable surface area—leading to (potentially) lower up-front costs and lower thermal energy loss. Disadvantages include the cost of expansion—more mirrors further from the tower contribute less power. Dish/Engine Systems Both trough and tower systems rely on turbines to generate electricity. A dish and Stirling engine system instead generates electricity directly at the point of concentrated light. The dish, typically a set of panels of order 10m in diameter, focuses light on a gas within the Stirling engine. The gas heats and expands and works the engine’s piston to produce electricity. A typical dish produces 10-50kW of peak power. No commercially deployed dish/engine system plants are yet in existence, however several are coming soon. Figure 4 – Dish/engine system (credit: Sandia National Laboratories)
The Economic Benefits of CSP Gross State Output
A California-based study estimated the total investment required for a large-scale deployment scenario (at least 2.1GW) is estimated to be around $3.3 billion per gigawatt (GW) of capacity. 40 percent of this will typically be spent in the local area to source materials and hire workers for construction and operating activities. For 4GW installed capacity, the annual economic impact of operating is anticipated to reach $390 million. Over 30 years of operation

this is a total gain of between $3.8 and $6.6 billion to the economy. In comparison to the other potential investments that could be made in electricity generating capacity, CSP has the largest gross state output to investment ratio, despite being around eight times the installed cost per unit of energy. This ratio is estimated to be as high as $1.40 per $1 spent, exceeding those for both the combined cycle and simple cycle combustion turbine plants (both $0.90). With so much investment in the economy, we would hope to see positive ‘multiplier’ effects, especially at the local level. Investment
Employment
Consumption
Demand
Figure 5 - ‘Multiplier’ Effects (credit: authors)
Fiscal Contribution Employment
Equation 1 - Tax revenues calculation (credit: authors)
Environmental Table 2 - Comparison of emissions (credit: NREL) Generating Portfolio Developing CSP resources as part of a more diversified portfolio acts as a hedge against natural gas prices (which even with solar growth will remain an important part of the electricity generating supply). There are two benefits of this: (1) the decreased demand for natural gas will lower prices, and (2) the lower exposure of the generating portfolio to natural gas will reduce the negative effects of its price fluctuations. It has been estimated that a 1 percent decrease in demand will lower prices by as much as 4 percent. The extra competition and risk mitigation has the potential to reduce both the average price of electricity and the volatility of this price. This reduces the costs and increases the certainty for all consumers. This is especially relevant for residential consumers who have seen average electricity prices rise from 8.72¢/kWh in 2003 to 11.05¢/kWh in 2008 (year-to-date). An average household consumes 920kWh/month. This is an increase in costs of more
than $250/year/household. For commercial and industrial applications it means lower costs of operating activities and the reduced uncertainty means improved accuracy of planning and budgeting. Reducing the costs of an essential economic input will be beneficial to the local economy and the U.S. economy

as a whole. Technology Work on Sterling engines earlier this year resulted in a new world record for solar-to-grid conversion efficiency of 31.25 percent (the old record that stood since 1984 was 29.4 percent)77. Grid Effects These high-need areas have a total amount of solar resources within 10 miles of suitable transmission access locations equal to 1,100MW. Overall the system benefit ratio is expected to be greater than 3:1. For an estimated total of $2.75 billion this amounts to $2,500/kW installed cost, but just $800/kW for the total benefit79.
Areas for Future Research
A s a set of developing technologies, CSP is an active area of research. The primary goal of this research is to improve the economics of CSP by reducing construction and operational costs or by increasing the CSP efficiency and capacity factor. We focus on the research into future options for incorporating stored, dispatchable thermal energy as it has the greatest potential for cost savings. Stored thermal energy gives CSP plants the ability to use a period of excess production to provide constant output power during a subsequent period of cloudiness or after sunset. Without storage, a CSP plant’s power output decreases and increases with cloud cover and as the sun moves through the sky. With storage, the capacity factor of a CSP plant—the annual ratio of actual energy produced to the plant’s rated maximum—can be increased and more energy can be sold. This increases profitability as long as the construction and operation of storage is cost effective. CSP profitability is also increased because the ability to provide constant output allows grid operators to have confidence in their production and in the electrical stability of the grid. The status quo of thermal storage is well represented by Andasol 1 in Spain. It uses a two tank indirect system in which the HTF and storage materials are different (“indirect”). Two tanks, one hot and one cold are used for the nitrate salt thermal storage medium. The HTF, a synthetic oil, heats the nitrate salt storage medium through coiled heat exchangers. Though this represents current state-of-the-art technology there are obvious cost inefficiencies. Foremost is the

“indirect” nature of the system—using one material for the HTF and another for the storage engenders both energy loss and higher costs due to the necessity of heat exchangers. One solution to the problem is to make the system “direct” by using a single material for both the HTF and the storage medium. Typically this material is also a salt, but “direct steam” uses
water. Using nitrate salts allows for higher operating temperatures and thus better efficiencies, though they often have high freezing points (at best 100°C or greater) which require external heating to avoid freezing overnight. Nonetheless, one NREL estimate suggested that a 15 percent reduction in the levelized cost of electricity can be achieved by using molten salt as the HTF. Research is on-going into developing materials that have lower freezing points while maintaining other desirable properties. Direct steam systems presently have lower storage capacity than nitrate salts because of the difficulty and expense of building pressurized tanks. Two tanks are typically used in a storage system so that the hot tank can be refilled with salt taken from a cold tank. This need not be the case if one can maintain a thermal gradient across a single thermocline tank. Usually, the majority of the thermocline volume is filled with low cost filler materials such as quartzite rock and silica sand. These materials provide the heat capacity for thermal storage while the high cost HTF provides thermal conductivity as it flows through the tank. Another NREL study identified cost savings of 35 percent for a thermocline system as compared to a two-tank system. Figure 6 - Thermocline storage system schematic (Credit: Brousseau et al.)
When solar field thermal energy production exceeds the electrical capacity of the steam turbine, heat is added to the storage tank. Overnight or during periods of cloudiness heat is
drawn from the tank to offset the decreased thermal energy from the solar field.
Perhaps the most promising storage options are phase change materials. Storage of nitrate salts is presently limited by the cost of increasing volume of storage tanks and the salts to fill them. An alternative way of increasing heat storage is to increase the “heat capacity” of the storage material—a physical quantity that represents how much heat is stored when a material’s temperature is increased. Nitrate salts were identified in part because of their high heat capacity. The heat capacity of most materials is very small compared to the heat required to change a material from one phase to another, e.g. solid to liquid. This is another form of heat capacity that represents the energy required to separate molecules in a solid so that they flow as a liquid. When the storage material is liquid this energy is stored and can be re-obtained, with a small thermodynamic efficiency penalty, when the liquid reforms as a solid. The engineering requirements are high as it is difficult to combine solid and liquid in a dynamic system. Nonetheless, the much higher

heat capacity allows for a smaller system for a given amount of storage. Likewise similarly sized systems will allow for much greater storage. Either choice represents a potentially large reduction in costs/kWh. Previously existing systems such as SEGS and Solar One/Solar Two have proven vital testing grounds for new technologies incorporated into plants such as Andasol 1 and Solar Tres. We are hopeful that the new technologies described above will find similar demonstration homes to help develop their potential in the marketplace.
Table 3 - Comparison of the advantages and disadvantages of CSP technologies
CSP Technology Advantages Disadvantages
Best-suited
Environment
Linear Fresnel Reflectors
Cheaper to build Able to integrate
thermal storage
Able to hybridize steam turbine with other fuels
Only requires east-west tracking of sun
Low wind profile
Requires water Slightly lower
capacity factor due to non-focusing flat mirrors
Needs flat land
Flat, arid region
but with external supply of water
Parabolic Troughs
Able to integrate
thermal storage
Able to hybridize steam turbine with other fuels
Only requires east-west tracking of sun
Requires water More complicated
piping than linear reflector
Needs flat land
Flat, arid region
but with external supply of water
Power Towers

Able to integrate thermal storage
Simpler to build a single, central tank without a field of pipes
High temperature
More distant mirrors contribute less power (less scalable)
Requires 2-axis tracking of sun
Less flat, but arid areas with external supply of water
Dish/Engine
Lower water
consumption Distributed
generation Faster return on
investment due to modular nature
High temperature
Requires
improved storage using batteries or storage as another form of energy (e.g. heat or pumped-hydro potential energy)
Moving parts in engine
Must combine many to get utility scale power
Regions far from
water Regions far from
grid Distributed
generation at key points in the grid
Cost Analysis
A n advantage of all solar power plants is that the fuel is “free” and therefore the post-construction costs are limited to operation and maintenance. Problematically, the capital constructions costs (per MW) are higher than for traditional fossil fuel plants. Thus securing funding for CSP plants which, though proven, are not widely deployed, can be very difficult.
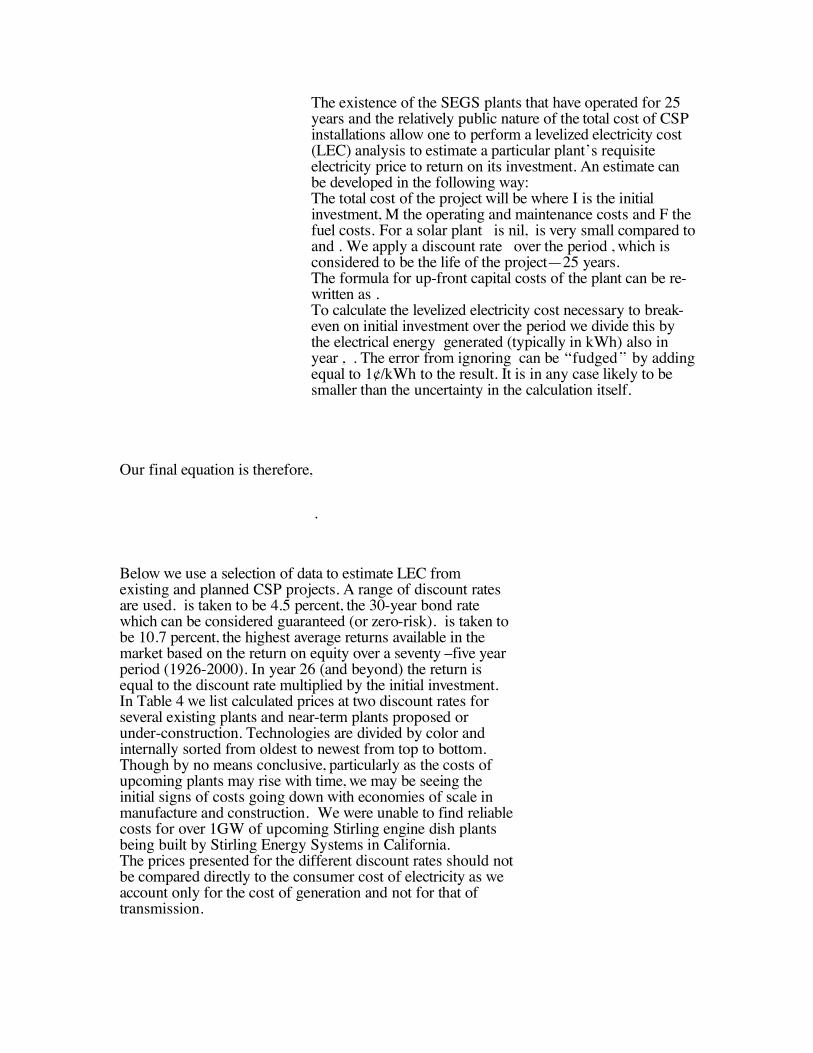
The existence of the SEGS plants that have operated for 25 years and the relatively public nature of the total cost of CSP installations allow one to perform a levelized electricity cost (LEC) analysis to estimate a particular plant’s requisite electricity price to return on its investment. An estimate can be developed in the following way: The total cost of the project will be where I is the initial investment, M the operating and maintenance costs and F the fuel costs. For a solar plant is nil, is very small compared to and . We apply a discount rate over the period , which is considered to be the life of the project—25 years. The formula for up-front capital costs of the plant can be re-written as . To calculate the levelized electricity cost necessary to break-even on initial investment over the period we divide this by the electrical energy generated (typically in kWh) also in year , . The error from ignoring can be “fudged” by adding equal to 1¢/kWh to the result. It is in any case likely to be smaller than the uncertainty in the calculation itself.
Our final equation is therefore,
.
Below we use a selection of data to estimate LEC from existing and planned CSP projects. A range of discount rates are used. is taken to be 4.5 percent, the 30-year bond rate which can be considered guaranteed (or zero-risk). is taken to be 10.7 percent, the highest average returns available in the market based on the return on equity over a seventy –five year period (1926-2000). In year 26 (and beyond) the return is equal to the discount rate multiplied by the initial investment. In Table 4 we list calculated prices at two discount rates for several existing plants and near-term plants proposed or under-construction. Technologies are divided by color and internally sorted from oldest to newest from top to bottom. Though by no means conclusive, particularly as the costs of upcoming plants may rise with time, we may be seeing the initial signs of costs going down with economies of scale in manufacture and construction. We were unable to find reliable costs for over 1GW of upcoming Stirling engine dish plants being built by Stirling Energy Systems in California. The prices presented for the different discount rates should not be compared directly to the consumer cost of electricity as we account only for the cost of generation and not for that of transmission.

Table 4 - Levelized cost of electricity calculation and comparison Name & Date of
Commission
Technology
Capacity@Factor(
MW)
Cost ($ Million)
LEC(r=4.5%)
LEC(r=10.7%)
Deployed
PS10(March 2007)
Tower, direct steam & limited
storage
[email protected] 44.5 ( 35)
$0.23 $0.14 Y
Solar Tres(Decemb
er 2008)
Tower & thermal storage
[email protected] 67.3 $0.09 $0.05 N
Arizona Saguora(December 2005)
Parabolic trough
[email protected] 6.1 $0.36 $0.21 Y
Nevada Solar One(June
2007)
Parabolic trough
[email protected] 260 $0.24 $0.15 Y
Andasol 1/2/3(Varies)
Parabolic trough & thermal storage
[email protected] 330 $0.25 $0.15 Y
Arizona Solana(Febru
ary 2008)
Parabolic trough & thermal storage
[email protected] 1,000 $0.14 $0.08 N
Ausra Kimberlina(
October 2008)
Linear reflector & direct steam
[email protected] 15 $0.21 $0.13 Y
Ausra Carrizo(Not
set)
Linear reflector & direct steam
[email protected] 550 $0.22 $0.13 N
One should note the heritage the newer and yet to be completed plants have in earlier plants. For example, Solar Tres has deep design roots in the Solar One and Solar Two projects in California (not the similarly named Nevada Solar One). By saving on design costs it may reach prices previously unreachable. Likewise the Solana plant, constructed by Abengoa Solar of Spain, in Arizona builds on well-developed trough and storage technology and Abegnoa’s experience with PS10.
One outlier is the Carrizo plant constructed by Ausr. Its lack of cost reduction as compared to the demonstration plant may be due to the newness of Ausra’s factory in Las Vegas and because it is the only company yet to deploy linear reflector technology. Notably neither Ausra plant includes significant storage so the capacity factors are low and much of the potential from scaling

up is being lost. Most of the new plants built or being built include storage that bring capacity factors up to one-third or better. Though these costs are clearly higher than is typical for baseload fossil fuel or nuclear generation, they are comparable to prices for less efficient intermediate load plants. As the Southwest, and in particular California, is already relying heavily on intermediate load power these prices are already competitive and explains the commercial success of existing plants like SEGS. As demand increases the reliance on intermediate load power will increase further, allowing for even greater price decreases as more CSP plants are deployed.
Policy Recommendations
The core of the challenge is overcoming the “first cost” requirement that solar energy technology currently presents. Even perfect technology might not be deployed if the costs are prohibitive or pose too much risk for the investor/developer. Large-scale deployment can rapidly reduce costs and it is this that the U.S. government must work towards. To achieve the cost-competitiveness that will enable CSP technology to become established as a vital part of the electricity generating portfolio a number of policies should be considered:
Work to improve standardization of solar policy nationwide by enacting a Federal RPS with a target of 20 percent by 2020.
Require that a majority percentage of the renewables requirement from any RPS (state or federal) comes from solar-generated energy in states with large solar resources.
Federal
State Public Utility Companies (PUCs), other utilities and project developers should be encouraged to coordinate to bid for large CSP plants (in the 500MW range)—this avoids states needing to cover cost gaps with additional incentives.
Teach and train a new group of workers for the renewable energy industry by

encouraging enrolment in university science and engineering programs to ensure that technical discovery and development in the solar sector can be sustained.
The current 8-year timeframe for the 30 percent ITC is too short for completing solar energy generating projects—it should be extended to at least 10 years to increase the likelihood of deployment.
Expand the goals of the Federal ‘Green Purchasing’ program to 10 percent by 2010, 20 percent by 2015 and 30 percent 2020—do not set an upper limit and review progress regularly.
State
Enhance the incentives for solar energy systems by providing highly-skilled workers and suppliers of vital materials locally to improve efficiency, sourcing and quality, and lower costs.
Increase penalties for non-compliance with RPS requirements by using fines or higher
taxes on the electricity that utilities sell from fossil fuel generation.
Both
Regulation should involve decoupling revenues from power consumption so that utilities can actively promote conservation and energy efficiency without sacrificing financial stability.
Appendix I: Selected State Policies Relevant to CSP (As of October, 2008)
State
Major Policy
Overview
California
California Solar Initiative (CSI)
Enacted August 2006Effective January 2008
Managed by the Pacific Gas and Electric Company (PG&E), Southern California Edison (SCE) and the California Center for Sustainable Energy
Goal
$3.2 billion in incentives over 10 years to provide 3,000MW of solar capacity by 2016
Property tax exclusion for solar energy systems (solar space heat, solar thermal, PV...)
Targets the new construction market (~$400 million) and existing homes and non-residential projects ($2+ billion)
Performance based incentives (PBIs) for systems

50kW and larger: $0.39/kWh for taxable entities (first five years) and $0.50/kWh for government entities and nonprofits
Arizona
Property Tax Assessment
Enacted July 2008 Expires December 2040
Solar Energy Property Tax Exemption
Enacted June 2006 No Expiration
Solar and Wind Equipment Sales Tax Exemption
Enacted 2003 Expires December 2010
Goal
Incentivize greater use of renewable electricity generating systems
Renewable energy equipment owned by utilities and other entities is assessed at 20 percent of its depreciated cost for the purpose of determining property tax
Goal
Encourage use of solar by commercial, industrial and residential entities through elimination of a property tax burden
For tax assessment purposes the devices are considered to add no value to the property
Goal
Encourage purchase of solar equipment
100 percent of sales tax
on eligible equipment
No maximum incentive
Nevada
Renewable Energy Producers Property Tax Abatement
Enacted 1997 Expires June 2009
Goal
Incentivize long-term development of renewable resource projects
50 percent property tax

abatement valid for 10 years
New Mexico
Renewable Energy Production Tax Credit
Enacted 2002 (amended 2003 & 2007) Expires 2018
Solar Thermal Electric Tax Credit
Enacted April 2007 Effective July 2007
Alternative Energy Product Manufacturers Tax Credit
Enacted April 2007 Effective July 2007
Solar Energy Gross Receipts
Enacted April 2007 Effective July 2007
Goal
Encourage companies to generate electricity using renewable sources
Average $0.027/kWh tax
credit against corporate income tax for solar energy production
Only applicable to the first 200,000MWh of electricity in each tax year
For electricity generated prior to 10/1/2007 excess credit may be carried forward for up to five consecutive taxable years
Goal
Reduce the construction costs of solar thermal electric plants and associated energy storage devices
6 percent tax credit May be carried forward for
up to five years Credit is capped at $60
million Goal
Reduce the construction costs of renewable energy systems and component parts
5 percent tax credit May be carried forward for
up to five years Credit is capped at 5 percent
of taxpayer’s qualified

expenditures Goal
Increase sales of solar technology
100 percent of receipts from sale and installation of solar systems
Colorado
Renewable Energy Property Tax Assessment
Enacted 2001 Local Option for Property Tax Exemption
Enacted April 2007 Effective August 2007
Goal
Reduce property tax for renewable energy projects to incentivize deployment
Property tax is assessed
based on installed cost so renewable facilities are assessed as though their installed costs were comparable to non-renewable facilities
Goal
Delegate authority to counties and municipalities to offer property or sales tax rebates or credits to residential and commercial property owners who install renewable energy systems
Amount varies (local option) Limit varies (local option)
Texas
Solar and Wind Energy Device Franchise Tax Deduction
Enacted 1981 (amended 1991, 1999) Effective 1982
Solar and Wind Energy
Goal
Reduce the cost of solar energy devices for commercial and industrial deployments
Either total cost of the
system can be deducted from the company’s taxable

Business Franchise Tax Exemption
Enacted 1981 Effective 1982
Renewable Energy Systems Property Tax Exemption
Enacted 1981 Effective 1982
capital, or 10 percent of the cost may be deducted from the company’s income
Goal
Support those working solely in the business of selling, manufacturing or installing solar energy devices
Complete exemption from the franchise tax (no limits)
Goal
Encourage use of solar by commercial, industrial and residential entities through elimination of a property tax burden
For tax assessment purposes the devices are considered to add no value to the property
Utah
Renewable Energy Systems Tax Credit
Enacted 2001 (amended 2007) Effective 2001
Renewable Energy Sales Tax Exemption
Enacted July 2004 Expires June 2019
Goal
Encourage entities (including residential) to generate heat and electricity using renewable sources
25 percent tax credit that can
be carried forward for up to four years for residential entities (maximum incentive $2,000)
Commercial solar systems have a $50,000 limit and receive a 10 percent tax credit (cannot be carried forward or back)
Goal

Encourage purchase of solar equipment
100 percent of sales tax on
eligible equipment Equipment must be 20kW or
larger, or for expansions of 1MW or greater
Source: Database of State Incentives for Renewables and Efficiency (DSIRE); North Carolina State University Solar Center; http://www.dsireusa.org/index.cfm?&CurrentPageID=7&EE=0&RE=1.

Appendix II: Relevant Federal Incentives for CSP (As of October, 2008)
Incentive
Application
Detail and Authority
Corporate Depreciation (MACRS + Bonus
Depreciation)
Under the federal Modified Accelerated Cost-Recovery System (MACRS) businesses may recover investments on property through depreciation deductions.
Solar property installed post-1986 is eligible for depreciation treatment with a 5-year class life. The Economic Stabilization Act of 2008 added a 50 percent bonus depreciation for some renewable energy systems, CSP included (Internal Revenue Code of 1986, Title 26 of the United States Code (26 USC)).
Corporate Tax Credit – Business Energy Tax Credit
8-year federal business tax credits of 30 percent are applied to renewable energy projects, utilities and alternative minimum tax filers.
Eligible solar energy property includes equipment that uses solar energy to generate electricity, heat, cool or provide water to a structure. Credits are available for systems placed into service on or before 2016 and equal 30 percent of expenditures with no maximum credit limit stated. The incentive is applied to the taxpayer and must be adjusted if the financing of the project includes clean energy bonds or by subsidies from energy financing (Energy Improvement and Extension Act of 2008 (H.R 1424) and Energy Policy Act of 2005 (H.R. 6 a.k.a. EPAct 2005)).
Federal Loan Program – Clean Renewable Energy
Bonds (CREBs)
$800 million for CREBs to finance renewable energy projects, the technologies generally the same as those used for the Corporate Tax Credit. Existing allocations have been extended until December 31, 2009.
Eligible entities are electric cooperatives, government entities, and certain lenders with a reserved share (33 1/3 of allocation) for each. In theory, they are 0 percent interest rate bonds because the bond issuer pays back only the principal of the bond at

maturity, while the bondholder receives federal tax credits in lieu of traditional bond interest. The tax credit rate is set daily by the U.S Treasury Department. To date, 922 projects had benefited from the loan program on a rollover basis. (26 USC).
Federal Loan Program – Qualified Energy
Conservation Bonds
State, local and tribal governments may authorize the issuance of qualified energy conservation bonds to finance energy projects.
Similar to CREBs in treatment and applicable to projects related to energy efficiency in capital expenditure of buildings, renewable energy production, R&D applications, mass transport facilities, and demonstration and education projects. The authorized volume is up to $800 million on the bonds, allocated to states on the basis of their population and to local government on the basis of its share of habitants (H.R. 1424).
United States Department of Energy (DOE) Loan Guarantee Program
Loan guarantee for projects that reduce emissions of greenhouse gases and/or employ new technologies for energy generation.
Encourages the early commercial use of new or significantly improved technologies in energy projects. Not intended for R&D. No set limit, though most are for projects with financing over $25 million. Full payment of the obligation must be completed in 30 years or within 90 percent of the useful life of the physical asset financed. Projects include those for manufacturing, stand-alone projects or large-scale integration systems that combine technologies (42 USC).
Provides incentive
Applicable to production

Renewable Energy Production Incentive
(REPI)
payments for electricity produced and sold by eligible renewable energy facilities.
facilities, not-for-profit cooperatives, public utilities, state governments, Commonwealths, territories, possessions of the United States and the District of Columbia. Qualifying systems must generate electricity using solar, wind, geothermal, biomass or other similar renewable energy sources. Systems are paid 1.5¢ per kWh (1993 dollars indexed for inflation) for the first 10 years of operation (Energy Policy Act of 1992, extended by EPAct 2005 and Title 42 of the United States Code).
U.S. Federal Government Green Purchasing Goal
Green power purchase and aggregation scheme for new and existing federal buildings.
Half of the required renewable energy sources currently used must come from new renewable sources and should not be less than the following: 3 percent (2007-2009), 5 percent (2010-2012) and 7.5 percent (2013 thereafter). For FY2006-FY2010 Congress has allocated $50 million and guidelines for spending under the Federal Energy Management Program (EPAct 2005).
Source: Database of State Incentives for Renewables and Efficiency (DSIRE); North Carolina State University Solar Center; http://www.dsireusa.org/index.cfm?&CurrentPageID=7&EE=0