the future of oats - poga.ca · why oat prices have spiked since 2003 • 50% increase in...
TRANSCRIPT

The Future of OatsAg Commodity Research –
Oatinsight.comVancouver, Canada

Quarterly CBOT Oat Prices
1997 1998 1999 2000 2001 2002 2003 2004 2005 2006 2007 2008 2009 2010 2011
708090
100110120130140150160170180190200210220230240250260270280290300310320330340350360370380390400410420430440450460470480490500
708090
100110120130140150160170180190200210220230240250260270280290300310320330340350360370380390400410420430440450460470480490500Record high
$4.71 1/2
21 of the last 31 quarters have seen price increases

Why Oat Prices Have Spiked Since 2003
• 50% increase in “Managed Money” oat & corn longs
• US grain use for ethanol use up 435%• Increasing incomes in China and India• Chinese consumption of meat up 50%• Global grain supplies not keeping pace
with consumption• Declining world grain stocks

The Future of Oats

“Just the Oat Facts Ma’am
• Oats are viewed by consumers as one of the healthiest foods
• Rising global food demand for oats• Re-confirmation that oats are beneficial for
equine• Highly concentrated market;
• Production, milling & trade• Bio-Fuel crops threatening oat area• The oat future has challenges……………….

World Crop Production
45%39%
26%
9%4% 2% 1% 1%
0%5%
10%15%20%25%30%35%40%45%50%
% o
f tot
al

Number of Countries Growing a Crop
90
7564 59
4231
20 20 20
0102030405060708090
100

World Oat Area and Production
5,000
15,000
25,000
35,000
45,000
55,000
65,000
62 65 68 71 74 77 80 83 86 89 92 95 98 01 04 07 10
thou
sand
s Production
AreaRecord lows

World Oat Production % of Total
16%
12%
4% 4% 4% 4% 3% 3% 3% 2%
22%
0%
5%
10%
15%
20%
25%%
of t
otal
10 countries account for 78%

Changes in World Oat Area
232%222%
144%
38%5% 1%
-1% -23%-57% -63%-100%
-50%0%
50%100%150%200%250%
1961 to 2009

World Yield Change – 1970s to 2000s
93%83%
50%
35%
18% 16%
0%10%20%30%40%50%60%70%80%90%
100%
Corn Wheat Rye Barley Sorghum Oats

World Oat Production
90% of world production

North American and EU Oat Area
0
2,000
4,000
6,000
8,000
10,000
12,000
14,000
16,000
60 62 64 66 68 70 72 74 76 78 80 82 84 86 88 90 92 94 96 98 00 02 04 06 08 10
thou
sand
N. American
EU-27

EU Oat Area – Top 5 Oat Millers
0
100
200
300
400
500
600
700
1988
1989
1990
1991
1992
1993
1994
1995
1996
1997
1998
1999
2000
2001
2002
2003
2004
2005
2006
2007
2008
2009
Thou
sand
Hec
tare
s
Germany United Kingdom DenmarkSweden Finland

EU Oat Area – Top 5 Oat Milling Countries
600
800
1,000
1,200
1,400
1,600
1,800
1989
1990
1991
1992
1993
1994
1995
1996
1997
1998
1999
2000
2001
2002
2003
2004
2005
2006
2007
2008
2009
2010
Thou
sand
Hec
tare
s
Record low

US & Canadian Seeded Oat Area
0
2,000
4,000
6,000
8,000
10,000
12,000
14,000
16,000
88 89 90 91 92 93 94 95 96 97 98 99 00 01 02 03 04 05 06 07 08 09 10
Thou
sand
acr
es
US
Canada
Record lows

US & Canadian Harvested Area
0
1,000
2,000
3,000
4,000
5,000
6,000
7,000
8,000
88 89 90 91 92 93 94 95 96 97 98 99 00 01 02 03 04 05 06 07 08 09 10
% h
arve
sted
US
Canada
Record lows

Australia and S. American Oat Area
0200400600800
1,0001,2001,4001,6001,8002,000
60 62 64 66 68 70 72 74 76 78 80 82 84 86 88 90 92 94 96 98 00 02 04 06 08 10
thou
sand
Australia & Oceania
South American

Oat Trade

Oat Trade Highly Concentrated
• Nine countries account for 80% of the world’s oat trade
• 85% of the Exports• Canada, Sweden, Finland and Australia
• 77% of the Imports• US, Germany, Spain & Mexico

Free Flow of Trade?
• No such thing• EU Import Tariffs• US “Avena sterilis” restrictions• Australian import restrictions• Phytosanitary requirements

World Oat Exports

Oat Exports
1,809
321178 149 58 53 51 43 38 29 27
0200400600800
1,0001,2001,4001,6001,8002,000
000
mt

World Oat Imports

Oat Imports
1,727
20987 86 63 62 52 49 38 35 31
0200400600800
1,0001,2001,4001,6001,8002,000
000
mt

World Oat Import Competition
US
Mexico
South Africa
Ecuador
Canada
Finland
Sweden
Australia
Japan

Oat Product Exporters
• Canada• Mainly to US and Mexico
• EU-27• Mainly internal trade from UK, Germany
and Scans• Australia
• Oceania, Asia and sub continent• US
• Canada, Latin America and Asia• Chile
• Latin America

Oat Product Importers
• Mexico• EU-27
• Mainly internal due to Import Tariffs• South America
• Mainly from Chile• Indian Sub Continent, Asia, South Pacific
• Mainly from Australia and the US

Oat Utilization

World Oat Feed and Food Use
0
1,000
2,000
3,000
4,000
5,000
6,000
7,000
8,000
9,000
0
10,000
20,000
30,000
40,000
50,000
60,000
60 63 66 69 72 75 78 81 84 87 90 93 96 99 02 05 08
Food
use
Feed
Use
Food Use
Feed useThis is lowering
oat area

World Oat Milling Activity
North America1.5 mmt
EU-270.950 mmt
Chile, Brazil, Ecuador & Argentina
0.125 mmt
0.150 mmt
Approx range of oat product
exports

World Oat Milling Breakdown
Canada 18%
US 36%
Europe 34%
Chile 2%
Australia 5%Others 5%

N. American Breakfast Cereal & Snack Bar Sales
2504506508501,0501,2501,4501,6501,8502,050
1,900
1,910
1,920
1,930
1,940
1,950
1,960
1,970
1,980
Hot
Cere
al, B
B &
GB
–00
0 m
t
Cere
al &
SB
–00
0 m
t
Breakfast cereal/SB
Hot cereal, Breakfast & Granola Bars

W. Europe Breakfast Cereal & Hot Cereal Sales
80
90
100
110
120
130
140
150
800850900950
1,0001,0501,1001,1501,2001,2501,300
1998
1999
2000
2001
2002
2003
2004
2005
2006
2007
2008
2009
2010
2011
2012
2013
2014
2015
Hot C
erea
l –00
0 m
t
Brea
kfas
t Ce
real
–00
0 m
t
Hot Cereal
Breakfast Cereal

W. Europe Breakfast Cereal Per Capita Consumption
2.12.22.22.32.32.42.42.52.52.62.62.7
Kg p
er h
ead

E. Europe Breakfast Cereal & Hot Cereal Sales
10
20
30
40
50
60
70
80
50
100
150
200
250
300
1998
1999
2000
2001
2002
2003
2004
2005
2006
2007
2008
2009
2010
2011
2012
2013
2014
2015
Hot c
erea
l –00
0 m
t
Brea
kfas
t Ce
real
–00
0 m
t
Hot Cereal
Breakfast Cereal

E. Europe Breakfast Cereal Per capita Consumption
0.00.10.20.30.40.50.60.70.80.9
Kg p
er h
ead

Latin American Breakfast Cereal & Snack Bar Sales
8090100110120130140150160170180
200250300350400450500550600650700
1998 1999 2001 2002 2003 2004 2005 2006 2007 2008 2009
000
mt
Breakfast cereal/SB
Hot cereal, Breakfast & Granola Bars

China Breakfast Cereal Per Capita Consumption
2.6
4.9
0.03163
0.000
0.005
0.010
0.015
0.020
0.025
0.030
0.035
1.52.02.53.03.54.04.55.05.56.06.5
1998 1999 2000 2001 2002 2003 2004 2005 2006 2007 2008 2009 2010
Kg/h
ead
Western Europe
North America
China

Largest Oat Food Growth Potential

What Does This All Mean
• Continued divergence of oat production & mill demand
• Oat production could very well slide into “grower contract” status
• Higher feed demand (equine) needed to stem oat supply declines
• All the above could threaten CBOT oat futures contract…… and in turn price discovery

2011/12 Oat Outlook

Canada Oat Stocks to Usage-Ratio
32%
23%
35%
25%
27%
13%
29%
31%
11%
28%
13%
41%
37%
18%
25%
87/8
888
/89
89/9
090
/91
91/9
292
/93
93/9
494
/95
95/9
696
/97
97/9
898
/99
99/0
000
/01
01/0
202
/03
03/0
404
/05
05/0
606
/07
07/0
808
/09
09/1
010
/11F
11/1
2F
Avg 28%

Canadian End Stocks Near Record Low
-
200
400
600
800
1,000
1,200
1,400
1,600
79/8
080
/81
82/8
282
/83
83/8
484
/85
85/8
686
/87
87/8
888
/89
89/9
090
/91
91/9
292
/93
93/9
494
/95
95/9
696
/97
97/9
898
/99
99/0
000
/01
01/0
202
/03
03/0
40/
405
05/0
606
/07
07/0
808
/09
09/1
010
/11F
Avg 1,000
Record High 1,523
345
535
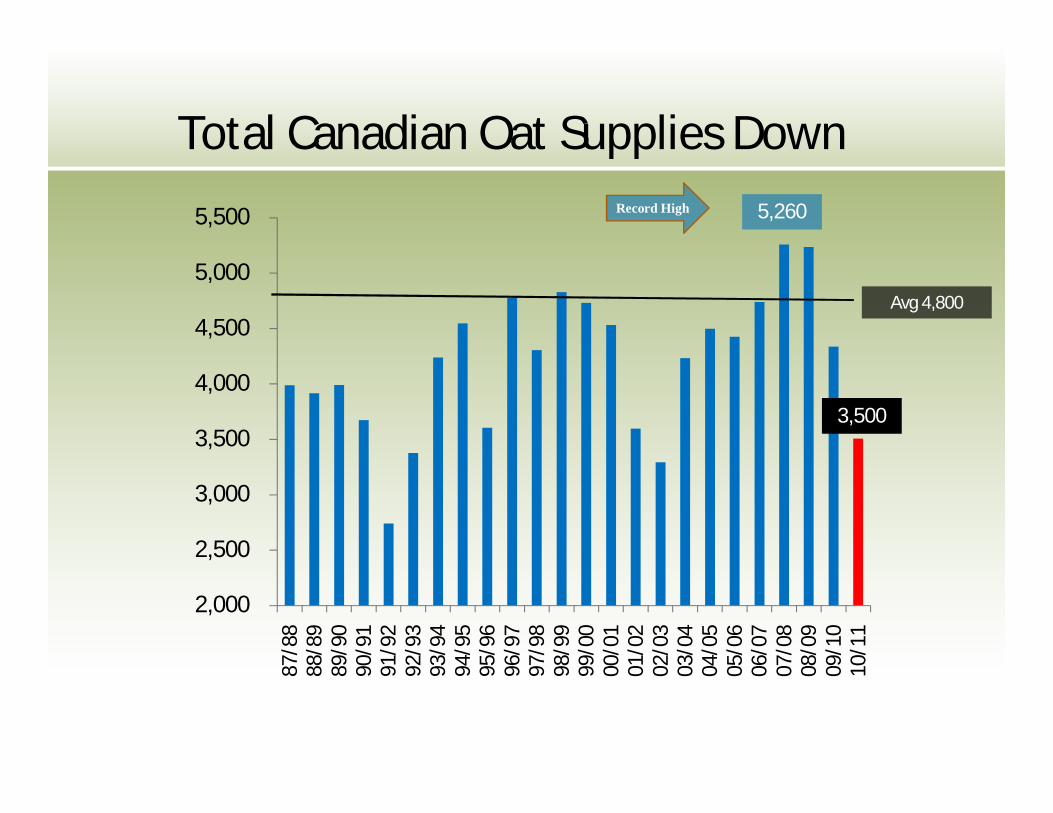
Total Canadian Oat Supplies Down
2,000
2,500
3,000
3,500
4,000
4,500
5,000
5,500
87/8
888
/89
89/9
090
/91
91/9
292
/93
93/9
494
/95
95/9
696
/97
97/9
898
/99
99/0
000
/01
01/0
202
/03
03/0
404
/05
05/0
606
/07
07/0
808
/09
09/1
010
/11
Avg 4,800
Record High
3,500
5,260

Mpls/Duluth Oat Stocks
20,000
22,000
24,000
26,000
28,000
30,000
32,000
34,000
36,000
38,000
Sep/08 Feb/09 Jul/09 Dec/09 May/10 Oct/10 Mar/11
This “Backstop” has a price?
28,865

Net Farm Returns E. Saskatchewan
223 222
173 166
130 129 129 123 12191
$0
$50
$100
$150
$200
$250
Malt Barley
Canola Spring Wheat
Canary Seed
CPS Wheat
Feed Peas
Feed Barley
Flax Oats Large Green Lentils
$CDN
per
acr
e

Net Farm Returns S. Manitoba
232 220 215
179 166136 136 126 125 117
$0
$50
$100
$150
$200
$250
$CDN
per
acr
e

2011 Canadian Oat Production Outlook Scenarios
2010 5 yr avg 2011Seeded acreage changes
000 mt -bu/ac Unchg 5% 10% 15%
Planted 3,737 4,633 3,737 3,924 4,111 4,298Abandonment 67% 75% 75%
Harvested 2,347 3,497 2,803 2,943 3,083 3,223Yield 77.5 71.3 71.3Production 2,798 3,811 3,082 3,236 3,390 3,544Change prod 284 438 592 746

Canadian Oat End Stocks Expected Rise
535
795
-
200
400
600
800
1,000
1,200
1,400
1,600
79/8
080
/81
82/8
282
/83
83/8
484
/85
85/8
686
/87
87/8
888
/89
89/9
090
/91
91/9
292
/93
93/9
494
/95
95/9
696
/97
97/9
898
/99
99/0
000
/01
01/0
202
/03
03/0
40/
405
05/0
606
/07
07/0
808
/09
09/1
0F10
/11F
11/1
2F5
yr a
vg
1.0 mmtAverage

CBOT Continuous Monthly Oats
$0.00$0.50$1.00$1.50$2.00$2.50$3.00$3.50$4.00$4.50$5.00
Mar
/89
Mar
/91
Mar
/93
Mar
/95
Mar
/97
Mar
/99
Mar
/01
Mar
/03
Mar
/05
Mar
/07
Mar
/09
Mar
/11
$3.47
Record High 4.72

Duluth Milling Quality Cash Oat Basis
-$0.80
-$0.60
-$0.40
-$0.20
$0.00
$0.20
$0.40
$0.60
2000 2001 2002 2003 2004 2005 2006 2007 2008 2009 2010
5 yr avg$.15
Current$.05

Looking Forward
• Increasing food use of oats into 2015• Oat area threaten by Bio-fuel crops• Research funding seriously lagging other
crops• Increasing equine feed use good for milling
• – “push the price envelope”• Removal of EU Tariffs• Removal of “Avena sterilis” in US…….
tolerance?

OatInsight.comThe source for oat information