the future of new jersey's suburbs: demographic analysis · the future of new jersey's...
TRANSCRIPT

The Future of New
Jersey's Suburbs:
Demographic Analysis
Tim Evans
New Jersey Future
Kislak Real Estate Institute at Monmouth University
Stephen B. Siegel Lecture Series
May 4, 2017

New Jersey Future is a nonprofit,
nonpartisan organization that brings
together concerned citizens and
leaders to promote responsible land-
use policies. The organization
employs original research, analysis
and advocacy to build coalitions and
drive land-use policies that help
revitalize cities and towns, protect
natural lands and farms, provide more
transportation choices beyond cars,
expand access to safe and affordable
neighborhoods and fuel a prosperous
economy.

Population by Age Group,
2000 vs 2013

Change in Population by Age
Group, 2000 vs 2013

Millennials
• generally defined as people born from ~1980 to ~2000. So they are/were:
• Age 0 to 20 in 2000 (and hence not relevant to analysis of locational preferences)
• Age 13 to 33 in 2013 (date of the ACS I’ve used for my analysis) – the 22-to-34 age group thus roughly corresponds to the bulk of the Millennials, the ones in young adulthood, in 2013.
• Age 17 to 37 in 2017

Change in Population by Age
Group, 2000 vs 2013
Millennials….definitely not smaller than GenX, yet NJ’s 22-to-34 population has decreased as Millennialsaged into this age group –what is going on here??

New Jersey’s “Missing
Millennials”
-2.26%
6.83%
-3%
-2%
-1%
0%
1%
2%
3%
4%
5%
6%
7%
8%
NJ US
% Change in Number of 22-to-34-year-olds, 2000 to 2013
Where did they go?
To Brooklyn?
To Pennsylvania in search of cheaper housing?
To cheaper cities in the Midwest?
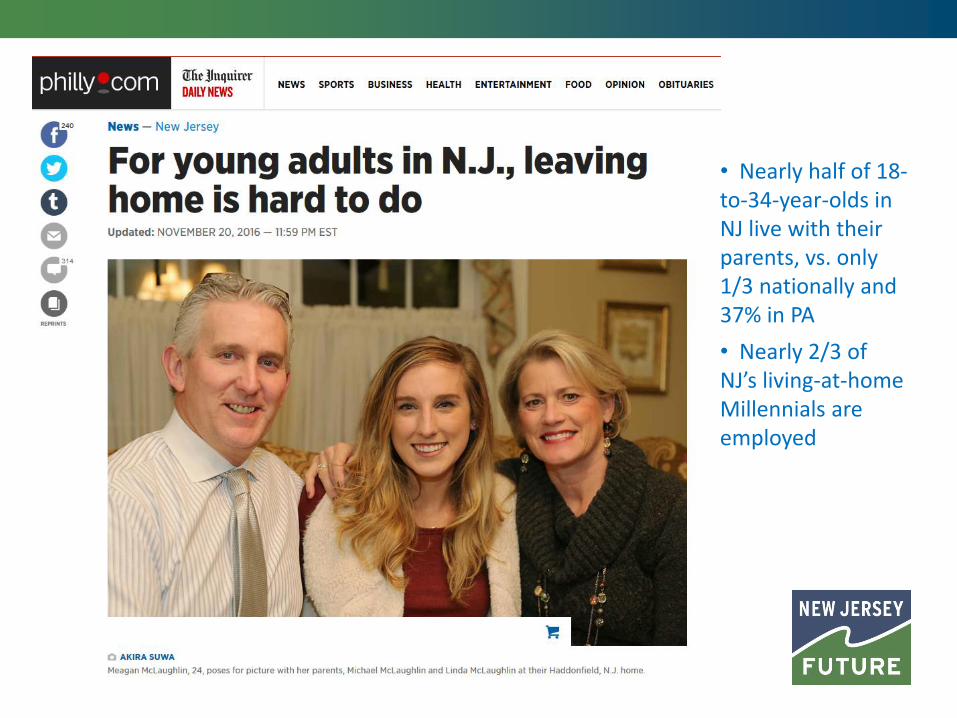
• Nearly half of 18-to-34-year-olds in NJ live with their parents, vs. only 1/3 nationally and 37% in PA
• Nearly 2/3 of NJ’s living-at-home Millennials are employed
NJ Millennials
What about the ones who have stayed, and who can afford to move out of their parents’ houses?
Where have they moved to?
Do Millennials really love cities?

Finding Concentrations of
Millennials: Location Quotients
for Age Groups
To find out where an age cohort is concentrated geographically, we can use location quotients (LQs). For a given municipality, its location quotient for a given age group is:
• % of the municipality’s residents that fall in that age group, divided by• % of all NJ residents that fall in that age group
LQ > 1 means that age group is more prevalent in the municipality than in the state as a whole
LQ < 1 means that age group is less prevalent in the municipality than in the state as a whole

Finding Concentrations of
Millennials: Location Quotients
for Age Groups
Example: Hoboken (which ranks #1 in the state)
Hoboken’s LQ for 22-to-34-year-olds in 2013 is:
774.2%4.16
%4.45
34 to22 age residentsJersey New of %
34to22ageresidentsHobokenof%
Millennials are 177.4 percent more common in Hoboken than they are statewide!

Municipalities with Highest
Location Quotients for 22-to-34-
Year-Olds, 2013
county municipality name
22 to 34 LQ, 2013
Hudson Hoboken 2.774
Cumberland Maurice River township 2.003 prison
Burlington New Hanover township 1.877 McGuire AFB
Hudson East Newark 1.826
Mercer Hightstown 1.730
Hudson Jersey City 1.694
Hudson Harrison 1.694
Burlington Chesterfield township 1.688 prison
Bergen Palisades Park 1.650
Middlesex New Brunswick 1.586
Burlington North Hanover township 1.578 McGuire AFB
Cumberland Bridgeton 1.531
Burlington Maple Shade 1.527
Bergen Fairview 1.522
Hudson Weehawken 1.519
Hudson West New York 1.492

Typology of Places
More generally, what types of places are attracting Millennials? What kinds of places have high LQs for 22-to-34-year-olds?
If we want to know if Millennials like “smart growth” places, we need to have a working definition of smart growth. Criteria from Creating Places to Age in New Jersey:
• Density of destinations, as measured by “net activity density” = (population + employment) / developed acres
• Presence of a mixed-use center, as indicated by:• designated center in the State Plan or Pinelands (or Highlands)
• SID, BID, or “Main Street” organization
• Walkability, as measured by local road density – route-miles of local road per square mile – which is a good indicator of connectivity
Each municipality is assigned to a category on each of these 3 metrics.

scoring “well”
→
Net Activity
Density

scoring “well”
→
Presence of a
Center

scoring “well”
→
Local Road Network
Density

Typology of
Places

No matter how you slice it,
Millennials love compact,
walkable urbanism
net activity density category
# of munis in category
22 to 34 LQ, 2013
urban 34 1.396
small city / urban suburb 46 1.145
dense suburban / small town 75 1.061
moderate suburban 179 0.889
low-density suburban 130 0.772
large-lot 101 0.672

No matter how you slice it,
Millennials love compact,
walkable urbanism
"center" category
# of munis in category
22 to 34 LQ, 2013
center 111 1.204
contains ≥ 1 center 58 1.187
contains single center 67 0.853
contains multiple centers 22 0.830
no centers identified 307 0.839

No matter how you slice it,
Millennials love compact,
walkable urbanism
local road density category# of munis in
category22 to 34
LQ, 2013
very high 44 1.277
high 96 1.070
good 132 1.130
medium 123 0.893
low 123 0.802
very low 47 0.835
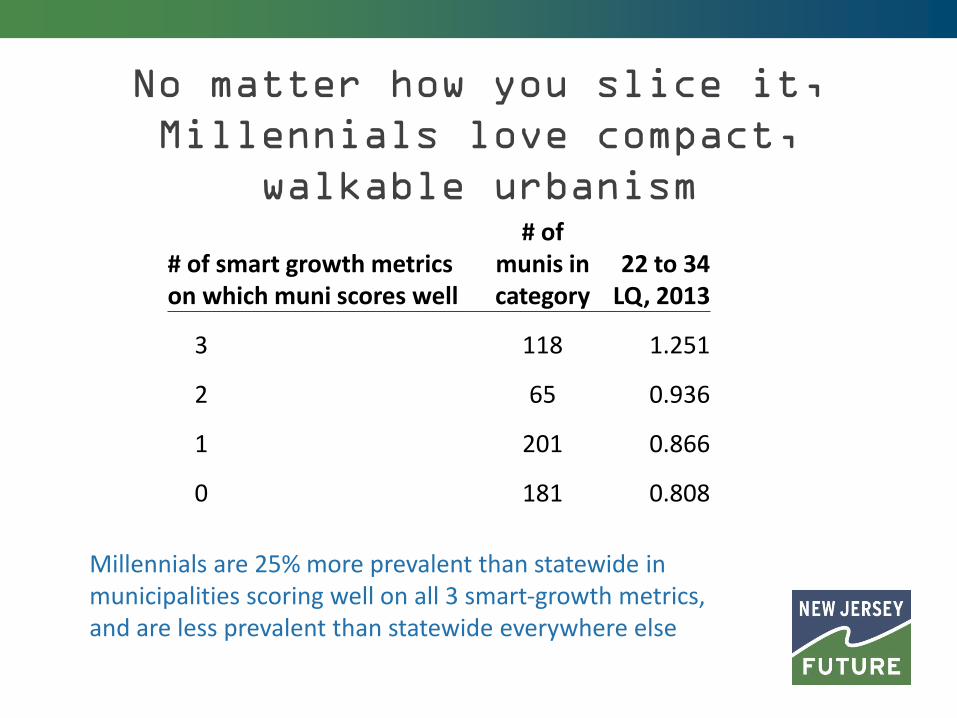
No matter how you slice it,
Millennials love compact,
walkable urbanism
# of smart growth metrics on which muni scores well
# of munis in category
22 to 34 LQ, 2013
3 118 1.251
2 65 0.936
1 201 0.866
0 181 0.808
Millennials are 25% more prevalent than statewide in municipalities scoring well on all 3 smart-growth metrics, and are less prevalent than statewide everywhere else

# of smart-growth metrics
scoring well

…but really Generation X started it!
Generation X:
• generally defined as people born from ~1965 to ~1979. So they are/were:
• Age 21 to 35 in 2000, so in 2000 the 22-to-34 age group roughly corresponds to GenX in their young-adult years
• Age 34 to 48 in 2013 – the 35-to-49 age group thus roughly corresponds to GenX in their early middle age, in 2013
• Age 38 to 52 in 2017
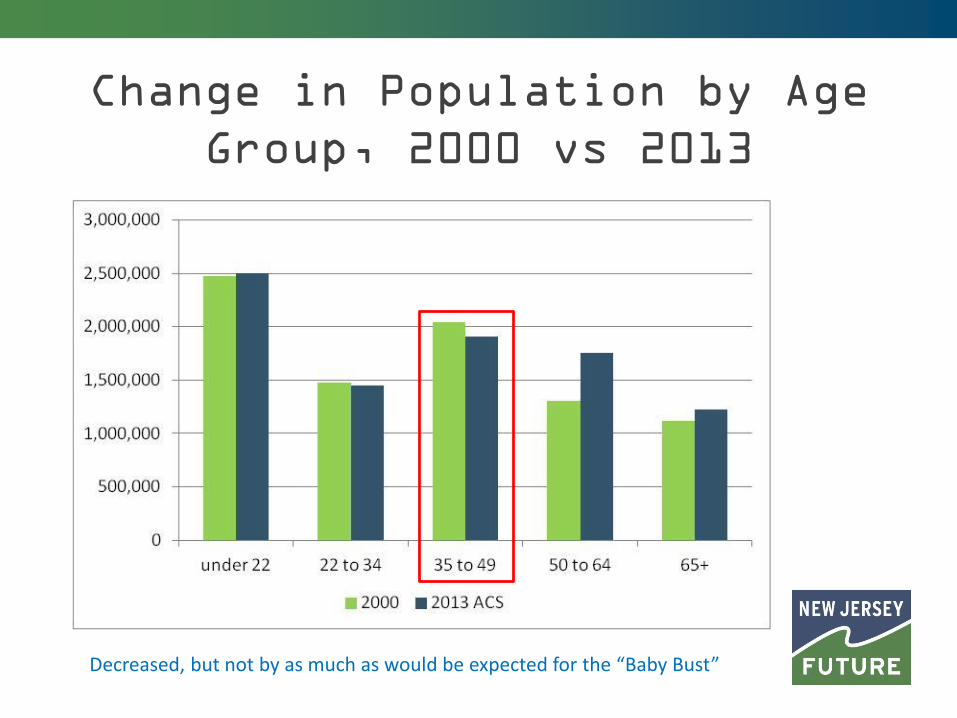
Change in Population by Age
Group, 2000 vs 2013
Decreased, but not by as much as would be expected for the “Baby Bust”

Generation X growing over
time?
Generation X’s New Jersey numbers appear to be being augmented…by immigrants from other countries? By domestic in-migrants from other states?

…but really Generation X
started it!Look at LQs for 22-to-34-year-olds in 2000:
# of smart growth metrics on which muni scores well
# of munis in category
22 to 34 LQ, 2000
3 118 1.193
2 65 0.955
1 201 0.876
0 181 0.860
net activity density category
# of munis in category
22 to 34 LQ, 2000
urban 34 1.320
small city / urban suburb 46 1.119
dense suburban / small town 75 1.030
moderate suburban 179 0.901
low-density suburban 130 0.818
large-lot 101 0.748 Generation X liked walkableurbanism in their young-adult years, too, though Millennialslike it even more

Maybe the Baby Boomers were the same way?
Remember yuppies (Young Urban
Professionals)?
“Since 1980, the relative preference of young adults for close-in neighborhoods has increased steadily. In 1980, young adults were 10 percent more likely than all metro residents to live in these neighborhoods; in 1990, 12 percent more likely; in 2000, 32 percent more likely; and in 2010, 25- to 34-year-olds were fully 51 percent more likely to live in close-in neighborhoods than other metro residents. The relative preference of 25- to 34-year-olds with a four-year degree to live in such neighborhoods was even higher: over 100 percent in 2010.”
no, not to same extent

Did Generation X stay in compact,
walkable places as they aged?
Which places does Generation X like
best today, in early middle age?
Although Generation X has moved to the suburbs as it has aged out of young adulthood, it has retained a preference for some degree of walkable urbanism that was not evident among Baby Boomers at this same stage of their life cycle.
# of smart growth metrics
on which muni scores well
# of
munis in
category
LQ for 22-
to-34-year-
olds, 2000
LQ for 35-
to-49-year-
olds, 2013
LQ for 35-
to-49-year-
olds, 2000
3 118 1.193 0.995 0.935
2 65 0.955 0.999 0.997
1 201 0.876 0.976 1.010
0 181 0.860 1.033 1.088
↑Gen X as
young adults
↑Gen X in
early middle age
↑Boomers in
early middle age

# of smart-growth metrics
scoring well

The Baby Boom
• generally defined as people born from ~1946 to ~1964. So they are/were :
• Age 36 to 54 in 2000, so the 35-to-49 age group in 2000 roughly corresponds to the bulk of the Baby Boom in early middle age
• Age 49 to 67 in 2013 – the 50-to-64 age group in 2013 thus contains the bulk of the Baby Boom in late middle age (with the 65+ age group containing the older Boomers, plus older generations).
• Age 53 to 71 in 2017

Change in Population by Age
Group, 2000 vs 2013
Bulk of the Baby Boomers hitting middle age

Change in Population by Age
Group, 2000 vs 2013
Oldest Baby Boomers retiring, plus older generations living longer

Retirees do not love walkable
urbanism…
location quotient
for:
age 65+
# of smart growth metrics on which muni scores well
# of munis 2000 2013
3 118 0.927 0.834
2 65 1.160 1.116
1 201 1.136 1.142
0 181 0.913 1.049
The 65+ population was already under-represented in “smart-growth” places in 2000, and has gotten more so in the intervening years as the older Baby Boomers have aged into this age range.
↑older
Boomers now in this age range

Retirees do not love walkable
urbanism, and the next generation
of retirees likes it even less!
location quotient for:
age 50 to 64 age 65+
# of smart growth metrics on which muni scores well
# of munis 2000 2013 2000 2013
3 118 0.911 0.891 0.927 0.834
2 65 1.040 1.038 1.160 1.116
1 201 1.048 1.042 1.136 1.142
0 181 1.069 1.098 0.913 1.049
The problem of older people being stranded in car-dependent suburbia is likely to get worse if the Baby Boomers follow through on their expressed desire to “age in place” in their preferred suburban environments.
↑older
Boomers
↑older
Boomers
↑younger Boomers

From AARP report What Is Livable? Community
Preferences of Older Adults:

# of smart-growth metrics
scoring well
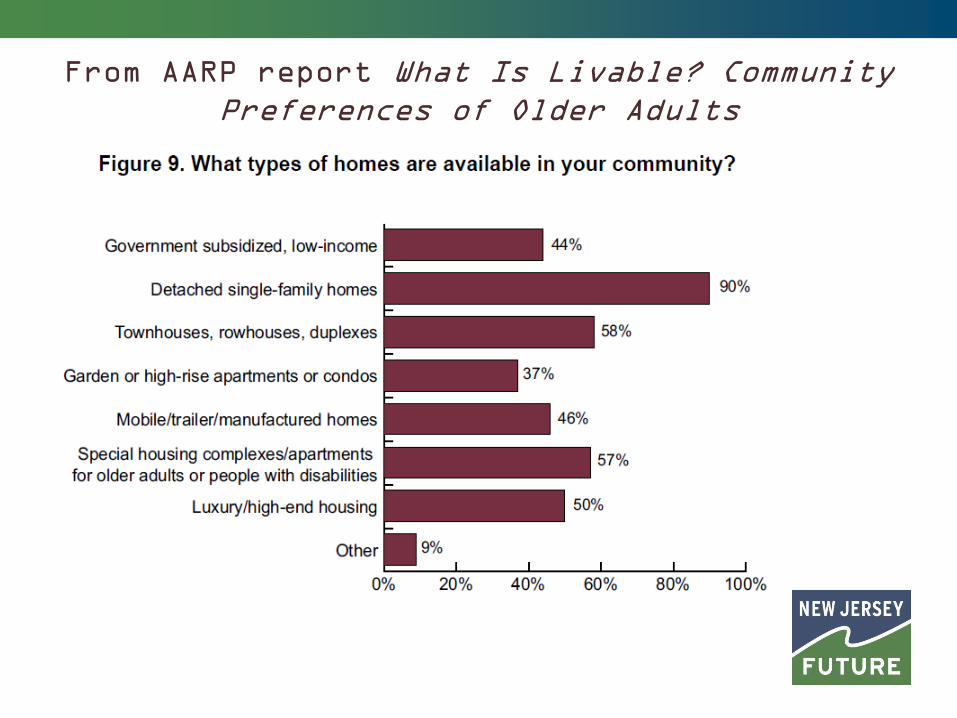
From AARP report What Is Livable? Community
Preferences of Older Adults

Building for New Demographic
Realities
In places that already have “good bones” (cities, but also many older suburbs):
• Add to and diversify the housing stock
In places that score poorly (post-WWII car-oriented suburbia):
• Create brand-new “downtowns” (e.g. Robbinsville Town Center, Plainsboro)
• Retrofit existing single-use development to make more mixed-use and pedestrian-friendly (e.g. Willingboro, Echelon Mall, Somerdale)

Thank you!
Tim EvansResearch Director
[email protected] Jersey Future16 W. Lafayette St.Trenton, NJ 08618
609-393-0008 ext. 103http://www.njfuture.org