the future of mineral exploration in a changing world - stephen mcintosh from rio tinto at mines and...
TRANSCRIPT

Stephen McIntoshHead of Exploration, Rio Tinto1st December 2015
Mines and Money LondonThe future of mineral exploration in a changing world
© 2015, Rio Tinto, All Rights Reserved
Cautionary statement
This presentation has been prepared by Rio Tinto plc and Rio Tinto Limited (“Rio Tinto”). By accessing/attending this presentation you acknowledge that you have read and understood the following statement.
Forward-looking statements
This document contains certain forward-looking statements with respect to the financial condition, results of operations and business of the Rio Tinto Group. These statements are forward-looking statements within the meaning of Section 27A of the US Securities Act of 1933, and Section 21E of the US Securities Exchange Act of 1934. The words “intend”, “aim”, “project”, “anticipate”, “estimate”, “plan”, “believes”, “expects”, “may”, “should”, “will”, “target”, “set to” or similar expressions, commonly identify such forward-looking statements.
Examples of forward-looking statements include those regarding estimated ore reserves, anticipated production or construction dates, costs, outputs and productive lives of assets or similar factors. Forward-looking statements involve known and unknown risks, uncertainties, assumptions and other factors set forth in this presentation.
For example, future ore reserves will be based in part on market prices that may vary significantly from current levels. These may materially affect the timing and feasibility of particular developments. Other factors include the ability to produce and transport products profitably, demand for our products, changes to the assumptions regarding the recoverable value of our tangible and intangible assets, the effect of foreign currency exchange rates on market prices and operating costs, and activities by governmental authorities, such as changes in taxation or regulation, and political uncertainty.
In light of these risks, uncertainties and assumptions, actual results could be materially different from projected future results expressed or implied by these
forward-looking statements which speak only as to the date of this presentation. Except as required by applicable regulations or by law, the Rio Tinto Group does not undertake any obligation to publicly update or revise any forward-looking statements, whether as a result of new information or future events. The Group cannot guarantee that its forward-looking statements will not differ materially from actual results. In this presentation all figures are US dollars unless stated otherwise.
Disclaimer
Neither this presentation, nor the question and answer session, nor any part thereof, may be recorded, transcribed, distributed, published or reproduced in any form, except as permitted by Rio Tinto. By accessing/ attending this presentation, you agree with the foregoing and, upon request, you will promptly return any records or transcripts at the presentation without retaining any copies.
This presentation contains a number of non-IFRS financial measures. Rio Tinto management considers these to be key financial performance indicators of the business and they are defined and/or reconciled in Rio Tinto’s annual results press release and/or Annual report.
2
© 2015, Rio Tinto, All Rights Reserved
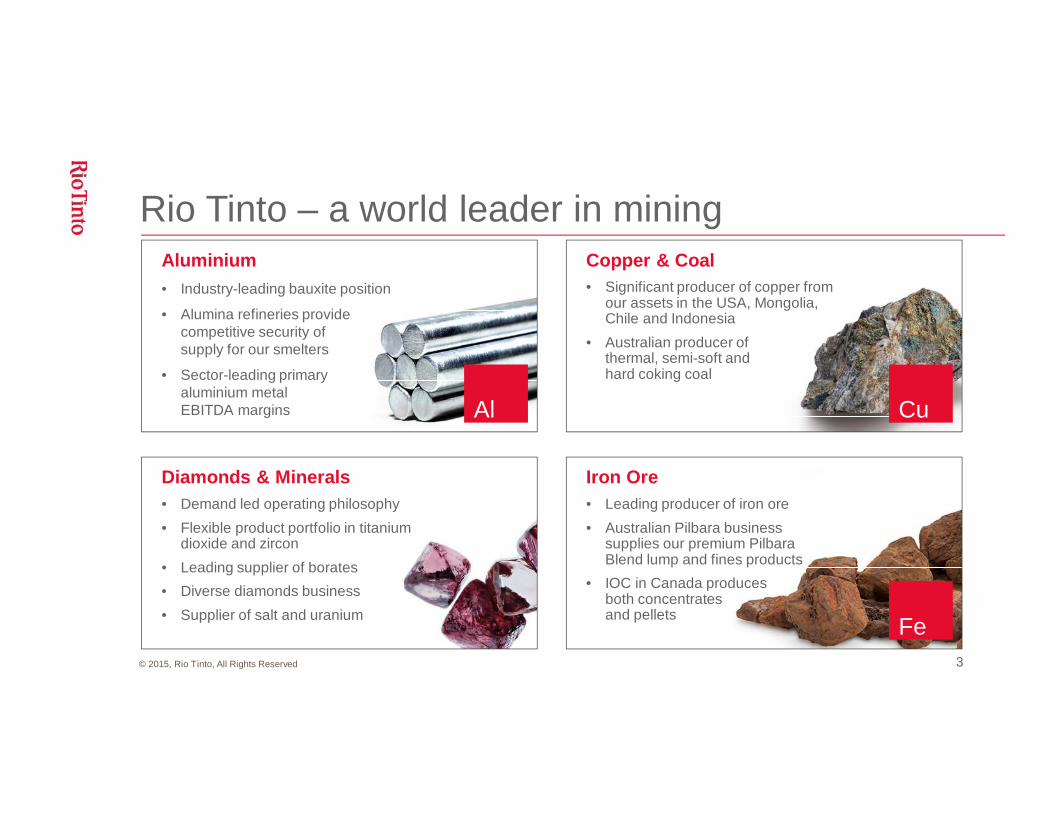
Rio Tinto – a world leader in mining
3
Aluminium• Industry-leading bauxite position
• Alumina refineries providecompetitive security ofsupply for our smelters
• Sector-leading primaryaluminium metalEBITDA margins Al
Copper & Coal• Significant producer of copper from
our assets in the USA, Mongolia, Chile and Indonesia
• Australian producer ofthermal, semi-soft andhard coking coal
Cu
Diamonds & Minerals• Demand led operating philosophy
• Flexible product portfolio in titaniumdioxide and zircon
• Leading supplier of borates
• Diverse diamonds business
• Supplier of salt and uranium
Iron Ore• Leading producer of iron ore
• Australian Pilbara business supplies our premium Pilbara Blend lump and fines products
• IOC in Canada producesboth concentratesand pellets
Fe

© 2015, Rio Tinto, All Rights Reserved
World Population and global production trendsPrimary Copper Supply (Mt/a)
Primary copper, not refined copper demand, which is above 20Mt this year, but includes scrap
0
5
10
15
20
1900 1920 1940 1960 1980 2000
18.83Mt
Aluminum Supply (Mt/a)
Source: US Geological Survey / Wood Mackenzie 2014
0
15
30
45
60
1900 1920 1940 1960 1980 2000
53.72Mt
World Population GrowthEstimated Population (Billions)
0
2
4
6
8
1900 1920 1940 1960 1980 2000
7.35B
Source: UN Department of Economic & Social Affairs 2015
4

© 2015, Rio Tinto, All Rights Reserved
We are not running out of resources globally
5
BKM – Brockman iron formationMM – Marra Mamba iron formationDID – Detrital iron deposit
Data sourced from 2013 global public domain 3rd party and Rio Tinto reports of Ore Reserves, Resources and Exploration Targets. Due to multiple reporting codes and various report timeframes these charts are for comparative purposes only and do not represent current Resources and Reserves for Rio Tinto or other competitors.
CID – Channel iron depositET – Exploration target

© 2015, Rio Tinto, All Rights Reserved
Mineral exploration spend and discovery rateSignificant* mineral discoveries and expenditures (excluding bulk commodities)Western world: 1996 - 2014
Caution: Incomplete discovery data in recent years*Signif icant defined as >100Koz Au, >10Kt Ni, >100Kt Cu equiv, 250Kt Zn+Pb, >5Moz Ag, >5kt U3O8
Source: Discoveries - MinEx Consulting June 2015 ; Expenditures - SNL Metals & Mining December 2014
0
50
100
150
200
0
5
10
15
20
25
1996 2000 2004 2008 2012
Number of discoveries
Estimated worldwide exploration expenditure (US$B)
Exp
lora
tio
n
exp
end
itu
re(r
eal 2
014
US
$B)
Discoveries
Expenditures
Nu
mb
er o
f D
isco
veri
es
Estimated spend (1996 – 2014): $155BTotal number of discoveries (1996 – 2014): 1031
Incompletediscovery data in recent years
6

© 2015, Rio Tinto, All Rights Reserved
2002Resolution
Copper
65 year track record discovery success1947Lac AllardIlmenite
1953Elliot Lake
Uranium
1955Weipa
Bauxite
1956PalaboraCopper
1960Kirka
Borates
1962Tom PriceIron Ore
1968RössingUranium
1970Tarong (QLD)Coal
1972ParagominasBauxite
1979Argyle
Diamonds
1982Moro de Ouro
Gold
1983LihirGold
1986Kintyre
Uranium
1996Diavik
Diamonds
2004SimandouIron Ore
2008BunderDiamonds
2008SulawesiNickel
2008MutambaIlmenite
1960SeirritaCopper
1955Mary KathleenUranium
1964PangunaCopper
1968OK TediCopper
1972Richards BayIlmenite
1977Kelian
Gold
1984Kaltim Prima
Coal
1990CenturyLead-Zinc
1996Las Cruces
Copper
2000PRC
Potash
2009JadarLithium
2005Caliwingina
Iron Ore
2005La Granja
Copper
2007Chapudi
Coal
1991Corumba
Iron ore
2011AmargosaBauxite
1996Sepon
Copper
2013SaskatchewanPotash
1956SangarediBauxite
2004EagleNickel
2004ConstanciaCopper
1999Murowa
Diamonds
2014Yandi BraidIron Ore
1947
1950
1953
1956
1959
1962
1965
1968
1971
1974
1977
1980
1983
1986
1989
1992
1995
1998
2001
2004
2007
2010
2013
2016
Founding discoveries for key product groups
7
© 2015, Rio Tinto, All Rights Reserved
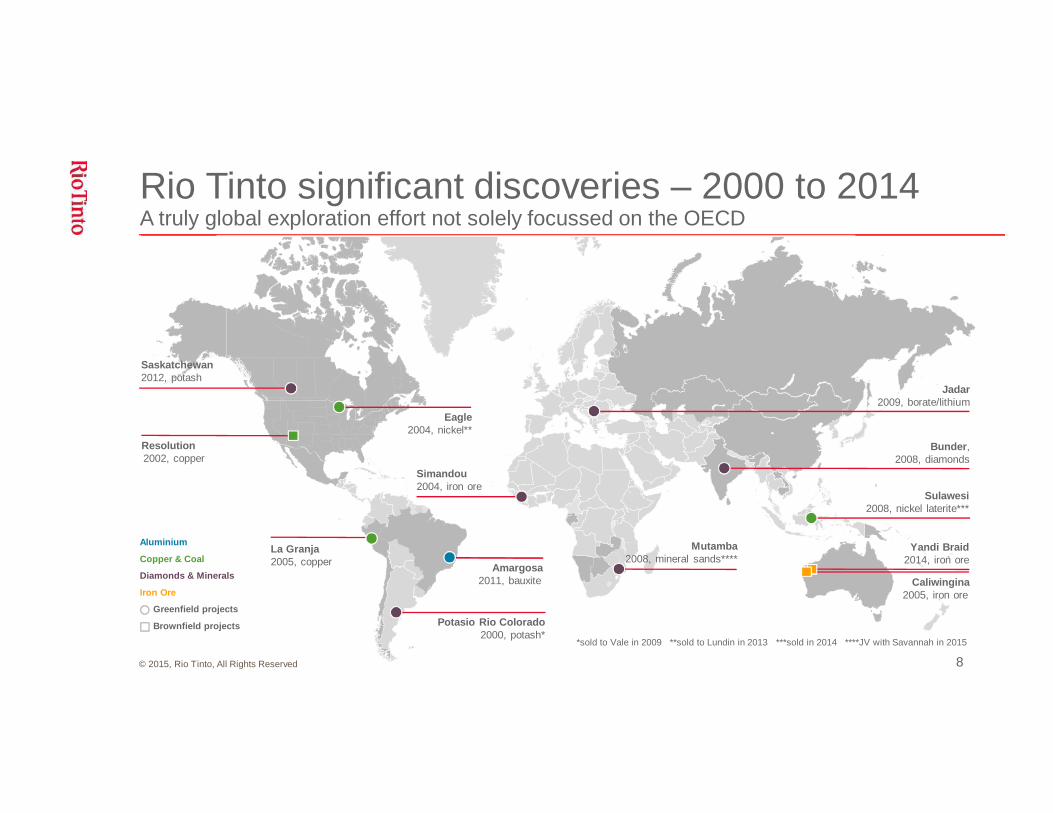
Saskatchewan2012, potash
Eagle2004, nickel**
Resolution2002, copper
La Granja2005, copper Amargosa
2011, bauxite
Potasio Rio Colorado2000, potash*
Simandou2004, iron ore
Bunder,2008, diamonds
Mutamba2008, mineral sands****
Jadar2009, borate/lithium
Sulawesi2008, nickel laterite***
Caliwingina2005, iron ore
Yandi Braid2014, iron ore
Aluminium
Copper & Coal
Diamonds & Minerals
Iron Ore
Greenfield projects
Brownfield projects
Rio Tinto significant discoveries – 2000 to 2014A truly global exploration effort not solely focussed on the OECD
*sold to Vale in 2009 **sold to Lundin in 2013 ***sold in 2014 ****JV with Savannah in 2015
8

© 2015, Rio Tinto, All Rights Reserved
Leading exploration capability delivering future growth options for <$40 million* each
Mine & Process
*net Average USD cost 2004 - 2013 after divestment income
• Continue generating options to invest in Tier 1 brownfield and greenfield projects aligned with portfolio strategy
• Maintain disciplined process to ensure that only highest quality projects advance through the pipeline
• Focus on partnering with juniors and using new technology coupled with legacy data to generate new projects
Aluminium
Copper & Coal
Diamonds & Minerals
Iron Ore
Greenfield projects
Brownfield projects
…and a strong pipeline of future prospects
ExplorationAccountability
Target Generation
TargetTesting
Projectof Merit
Order ofMagnitude
AreaSelection
Discovery PreFeasibility
Feasibility
Product GroupAccountability
100% of targets <0.1% of targets
Global portfolio prioritisation
9

© 2015, Rio Tinto, All Rights Reserved
Mineral exploration and the role of cover
10
Caliwingina
Tom Price
Kintyre
Argyle
Mary Kathleen
Century
Tarong
Weipa
ValeriaBlair Athol
Hail Creek
Kestrel
Gove
Salt
Hunter Valley
Rio Tinto Exploration 2015 projects
Rio Tinto discoveries
Rio Tinto mines
Outcrop & shallow basement (the highlighted areas serve as an indication only)Cover
Year Discovery Commodity
1955 Weipa Bauxite
1955 Mary Kathleen Uranium
1962 Tom Price Iron Ore
1963 Paraburdoo Iron Ore
1968 Hail Creek Coking Coal
1969 Valeria Thermal Coal
1970 Tarong Coal
1979 Argyle Diamonds
1986 Kintyre Uranium
1990 Century Lead-Zinc
2005 Caliwingina Iron ore
2014 Yandi Braid Iron Ore

© 2015, Rio Tinto, All Rights Reserved
Non-technical barriers to exploration
11
Source: Australian Government Productivity Commission Inquiry Report September 2013
a A work program must be submitted with the application, but may not be part of the decision-making process.
b Jurisdictions require different environmental, heritage and land access agreements to be completed at different stages of the exploration licence approval process.
Application for exploration licencea
Public notification
Scope for public comment (some jurisdictions)
Environmental assessment (some cases)
Exploration licence granted
Works and access approvals and agreements
Exploration commences
Land access agreements and compensation for landholders
Native title agreement
Heritage surveys
Other land access agreements
Works approval
Environmental approvals
Other approvals as required
b
Australian Government Productivity Commission Inquiry – 2013
ExplorationProcess
Australiaaverage
timeframe(months)
Canadaaverage
timeframe(months)
Concept 6 - 12 6 – 12
Pre grantApplication to governments for claims
6 – 13improving
0.25
Post grantPermits or work access agreements, stakeholder engagement for ground work*
8 – 30(exceptional +60
months)
2
Total (months)
(years)
~ 20 – 55
~ 1.6 – 4.5
~ 8 – 14
~ 0.6 – 1.2
Trend in timePost grant processesincreasing
Increase
Rio Tinto Exploration experienceTimeframes for license access for exploration
Source: Australia - Rio Tinto Exploration Pty Ltd experience post 2000; WA government – July 2015; Not all States have the same trend
*Includes negotiations with all stakeholders, some aspects may be done in parallel with government claim application
© 2015, Rio Tinto, All Rights Reserved
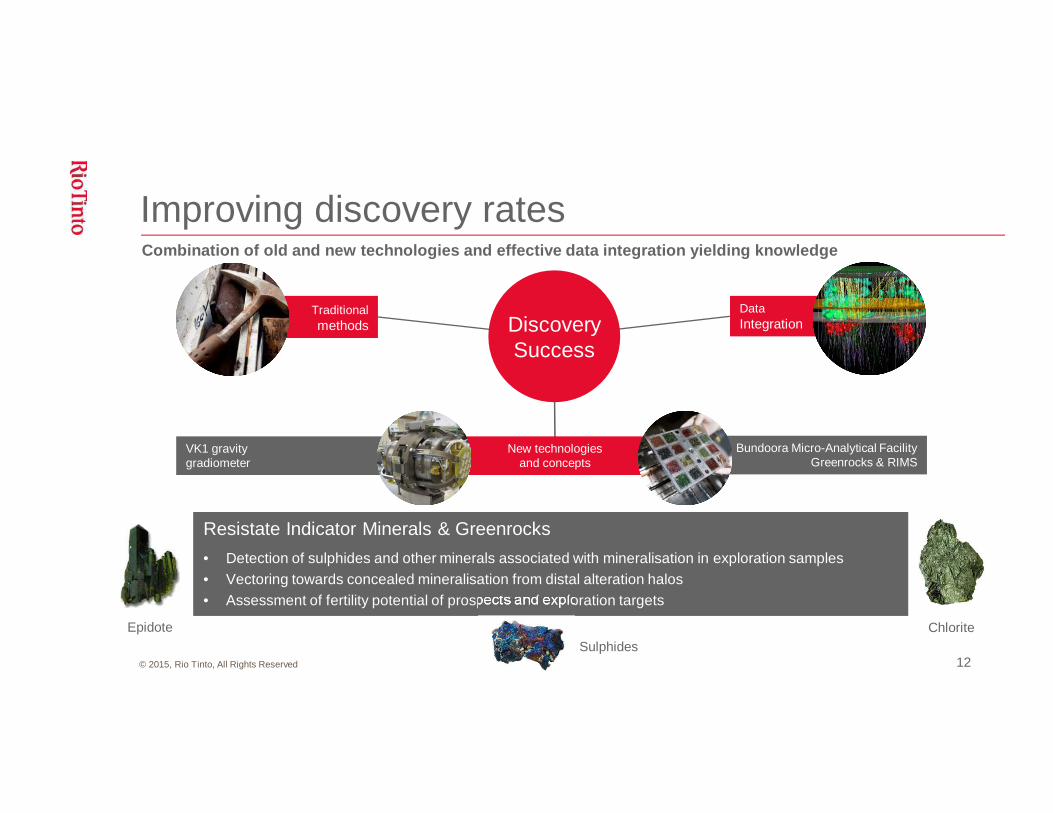
Improving discovery rates
12
Combination of old and new technologies and effective data integration yielding knowledge
New technologiesand concepts
DataIntegration
Traditionalmethods
Bundoora Micro-Analytical FacilityGreenrocks & RIMS
VK1 gravity gradiometer
Discovery Success
Resistate Indicator Minerals & Greenrocks
• Detection of sulphides and other minerals associated with mineralisation in exploration samples• Vectoring towards concealed mineralisation from distal alteration halos• Assessment of fertility potential of prospects and exploration targets
Resistate Indicator Minerals & Greenrocks
• Detection of sulphides and other minerals associated with mineralisation in exploration samples• Vectoring towards concealed mineralisation from distal alteration halos• Assessment of fertility potential of prospects and exploration targets
Epidote ChloriteSulphides

© 2015, Rio Tinto, All Rights Reserved
Vast quantities of geochemical data –but lacking in many developing countries
Australia surfacesamples: >6.3 million
Total public geochemistry surface samples: 14.4 millionTotal public geochemistry surface samples: 14.4 million
RTX Global Public Geochemical Database (GPG)Africa surface
samples: 1.3 million
Updated Nov 2015
Total in-house geochemistry surface samples: 3.2 millionTotal in-house geochemistry surface samples: 3.2 million
13
© 2015, Rio Tinto, All Rights Reserved
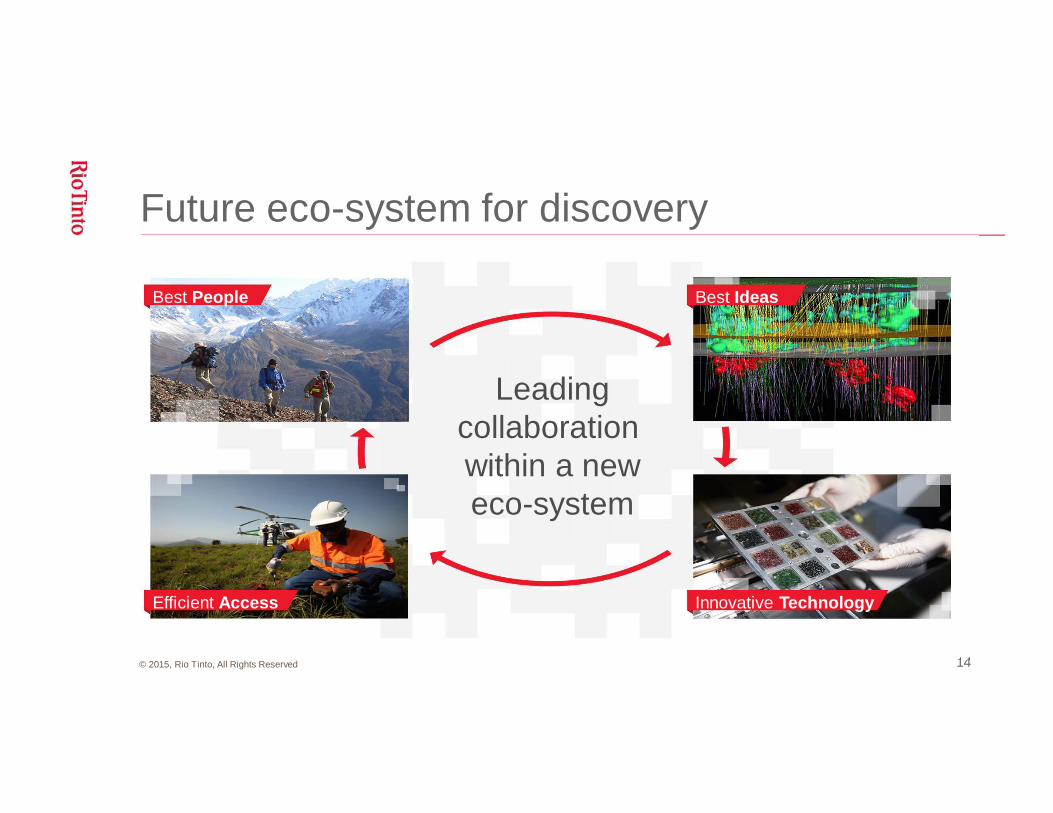
Future eco-system for discovery
14
Best People Best Ideas
Efficient Access Innovative Technology
Leadingcollaboration within a neweco-system