the future of agriculture in egypt - · pdf filethe future of agriculture in egypt comparative...
TRANSCRIPT

The Future of Agriculture in EgyptComparative Full Cost Accounting Study of Organic
and Conventional Food Production Systems in Egypt
Version 1.0 – January 2016

Heliopolis University for Sustainable DevelopmentMisr-Ismailia Road, km 20P.O.Box 2834 El Horreya HeliopolisCairo, [email protected]
Carbon Footprint CenterMisr-Ismailia Road, km 20P.O.Box 2834 El Horreya HeliopolisCairo, [email protected]
The Future of Agriculture in EgyptComparative Study of Organic and Conventional
Food Production Systems in EgyptVersion 1.0 – January 2016
Study prepared for the Carbon Footprint Center byEng. Thoraya SeadaDr. Ramy MohamedMr. Tobias FletscherMr. Helmy Abouleish
Mr. Maximilian Abouleish-Boesand in cooperation with the Heliopolis University
Carbon Footprint CenterThe Carbon Footprint Center (CFC) was set up by Heliopolis University for Sustainable Development (HU) and
the Academy of Scientific Research and Technology (ASRT) in 2014, where it became active in Carbon Footprint Assessment and CO2-Emission reduction projects.
For further information on this study please contact:Eng. Thoraya SeadaCFC Project Manager
E-Mail: [email protected]
AcknowledgementThis study was financially supported by Carbon Footprint Center (CFC).
The Carbon Footprint Center and the authors would like to express their sincere gratitude to Dr. Ibrahim Abouleish, Dr.Kadria Motaal, Mr. Thomas Abouleish, Dalia Abdou, Suzan Salem and other people within HU & SEKEM for their hospitality and support. We are grateful to Dr. Ayman Abouhadid, Arid Land Agricultural stud-ies and Research Institute (ALARI), Eng. Attia Sobhy, Egyptian Biodynamic Association (EBDA), and Mr. Tobias
Bandel, Soil and More International, for their valuable input and support.

FOOD FULL COST ACCOUNTING
Heliopolis University for Sustainable Developmentwww.hu.edu.eg | [email protected]
Carbon Footprint Center Egyptwww.cfc-eg.com | [email protected]
02
Abstract
Organic farming has proven to be remarkably effective in reversing the negative impact of agriculture on the envi-ronment; however, it has not found wider application in total national food production, due to being associated with higher costs. The aim of this study is to conduct a cost comparison between organic and conventional ag-riculture in Egypt, by using the “Full Cost Accounting” methodology. Full cost accounting measures and values in monetary terms the external costs of environmental impacts of food wastage. The research concludes that although organic agriculture has a slightly higher direct input cost of production, it enables a reduction of the environmental and health damage costs, and therefore, results in better cost effectiveness and profitability in the long term for society as a whole.
Table of ContentList of Figures 03List of Tables 03Acronyms 031 Introduction 042 Background 05 2.1 Global Challenges 05 2.2 Challenges facing Egypt 06 2.3 Full Cost Accounting 073 Methodology 07 3.1 Data Collection 07 3.2 Calculation and Evaluation 08 3.3 Parameters 094 Data Analysis 11 4.1 Rice 12 4.2 Maize 13 4.3 Potatoes 15 4.4 Wheat 17 4.5 Cotton 195 Conclusion 20 5.1 Summary of Results 20 5.2 Research Limitations 21 5.3 Conclusion 22References 23

FOOD FULL COST ACCOUNTING
Heliopolis University for Sustainable Developmentwww.hu.edu.eg | [email protected]
Carbon Footprint Center Egyptwww.cfc-eg.com | [email protected]
03
List of FiguresFigure 1: World Population Growth (UN Population Division, from van der Mensbrugghe et al. 2009) 05Figure 2: Arable Land (Bruinsma, 2009) 05Figure 3: Cost Overview Rice Old Land 12Figure 4: Cost Benefit Analysis Rice Old Land 12Figure 5: Cost Overview Maize Old Land 13Figure 6: Cost Benefit Analysis Maize Old Land 13Figure 7: Cost Overview Maize New Land 14Figure 8: Cost Benefit Analysis maize New Land 14Figure 9: Cost Overview Potatoes Old Land 15Figure 10: Cost Benefit Analysis Potatoes Old Land 15Figure 11: Cost Overview Potatoes New Land 16Figure 12: Cost Benefit Analysis Potatoes New Land 16Figure 13: Cost Overview Wheat Old Land 17Figure 14: Cost Benefit Analysis Wheat Old Land 17Figure 15: Cost Overview Wheat Old Land 18Figure 16: Cost Benefit Analysis Wheat New Land 18Figure 17: Cost Overview Cotton Old Land 19Figure 18: Cost Benefit Analysis Cotton Old Land 19Figure 19: Cost Overview - Summary 20Figure 20: Cost Benefit Analysis Summary 21
List of TablesTable 1: Parameters 09Table 2: Water Quality Cost 10Table 3: GHG Emission Cost 10Table 4: Soil Erosion Cost 11
AcronymsCFC Carbon Footprint CenterEBDA Egyptian BioDynamic Association FAO Food and Agriculture Organization of the United NationsFd Feddan (1 Fd = 0.42 Hectare)GHG Greenhouse GasHU Heliopolis UniversityMALR Ministry of Agriculture and Land Reclamation

FOOD FULL COST ACCOUNTING
Heliopolis University for Sustainable Developmentwww.hu.edu.eg | [email protected]
Carbon Footprint Center Egyptwww.cfc-eg.com | [email protected]
04
Introduction
Modern agronomy, plant breeding, agrochemicals such as pesticides and fertilizers, and technological improve-ments have sharply increased yields from cultivation, but at the same time these technological improvements have caused widespread ecological damage and a growing negative impact on human health that is associated with in organic consumption. Selective breeding and modern practices in animal husbandry have similarly in-creased the output of meat, but have raised concerns about animal welfare and the health effects of antibiotics, growth hormones, and other chemicals commonly used in industrial meat production. Agricultural food produc-tion and water management are increasingly becoming global issues which are fostering debates on a number of fronts. Significant degradation of land and water resources, including the depletion of aquifers, has been ob-served in recent decades, and the effects of global warming on agriculture and of agriculture on global warming are still not fully understood. New technologies have led the agricultural sector to tremendous growth but have also resulted in soil depletion, pollution of groundwater and in increasing economic instability and other social costs. Besides that, intensive agriculture has led to a growing subsidy burden for the Egyptian government.On the other hand, organic agriculture leads to improved soil structure while maintaining the water quality and increasing biodiversity and soil fertility. These factors gradually lead to increasing production and to a reduction of the total cost of production per ton of any crop. Egyptian agriculture will also impact climate by increased sea lev-els, higher temperature that is decreased in arable land and more water required for producing respective crops. Egypt is a unique country as almost 95% of water comes from outside. It is therefore possible that climate change may affect the water availability (Bayoumi B., 2003). The Nile valley and delta are the areas where intensive use of agricultural land took place for many years; however, in last 20 years, the Egyptian government has promoted the expansion of agriculture extensively into the Newlands located in the desert region. Reclamation of desert areas is still continuing in various locations. Considering these developments, this study was initiated to compare the different approaches to agriculture. The objective of the study was to analyze the economic costs for five of the strategic crops growing in both old land and new land in Egypt, thus getting an overview whether the organic or the conventional growing system is ecologically and economically more sustainable for the long-term future. The presented study is subsequent to the previous study: “The 100% Organic Egypt Study” which was written by Soil and More International and the Louis Bolk Institute (Soil & More, 2011). Due to important new references such as the “Final Report - Food wastage footprint - Full-cost accounting” conducted by the Food and Agriculture Organization of the United Nations (FAO, 2014) it was decided to rewrite and update the original study with the result of this work.There are mainly five national strategic crops in Egypt’s agriculture analyzed in this study such as 1) cotton 2) maize, 3) potatoes, 4) rice, and 5) wheat. These crops heave been selected due to their importance in terms of the cultivated area, food insecurity, economy and employment in Egypt (IMC, 2007).

FOOD FULL COST ACCOUNTING
Heliopolis University for Sustainable Developmentwww.hu.edu.eg | [email protected]
Carbon Footprint Center Egyptwww.cfc-eg.com | [email protected]
05
Background Analysis
2.1 Global ChallengesAgriculture in the 21st century faces multiple challenges: It has to produce more food and fibre to feed a grow-ing population with a smaller rural labour force and more feedstocks for a potentially huge bioenergy market. Contribute to the overall development in agriculture, developing countries adopt more efficient and sustainable production methods and adapt to climate change as well. (FAO, 2009)A. Food demand and productionWorld population/ is expected to grow by over a third, or 2.3 billion people, between 2009 and 2050. This is a much slower rate of growth than the one seen in the past four decades, during which it grew by 3.3 billion people, or more than 90 percent. Nearly all of this growth is forecast to take place in the developing countries. Among this group, sub-Saharan Africa’s popula-tion would grow the fastest (+114 per-cent) and East and Southeast Asia’s the slowest (+13 percent). Urbaniza-tion is foreseen to continue at an ac-celerating pace with urban areas to account for 70 percent of world pop-ulation in 2050 (up from 49 percent at present) and rural population, after peaking sometime in the next decade, actually declining (FAO, 2009).B. Natural ResourcesNinety percent of the growth in crop production globally (80 percent in developing countries) is expected to come from higher yields and increased cropping intensity, with the remainder coming from land expansion. Arable land would expand by some 70 million ha (or less than 5 percent), with the expansion in developing countries by about 120 million ha (or 12 percent) being offset by a decline of some 50 million ha (or 8 percent) in the developed countries. Almost all of the land expansion in developing countries would take place in sub-Saharan Africa and Latin America. Land equipped for irrigation would expand by some 32 million ha (11 percent), while harvested irrigated land would expand by 17 percent. All of this increase would be in the developing countries. Due to a slowly improving efficiency in water use and a decline in the area under rice (which is relatively intensive in water use), water withdrawals for irrigation would grow at a slower pace but still increase by almost 11 percent (or some 286 cubic km) by 2050. The pressure on renewable water resources from irrigation would remain severe and could even increase slightly in several countries in the Near East/North Africa and South Asia (Bruinsma, 2009).

FOOD FULL COST ACCOUNTING
Heliopolis University for Sustainable Developmentwww.hu.edu.eg | [email protected]
Carbon Footprint Center Egyptwww.cfc-eg.com | [email protected]
06
2.2 Challenges facing EgyptThe objective of this chapter is to outline the different challenges, currently faced by Egypt: Desertification, rising world food prices as well as limited water and agricultural land in Egypt, in addition to population growth and climate change, which hinder Egypt’s ability to provide food for its people in the future. Egypt consists of over 95% desert which leaves less than 450 m2 arable land per person for over 85 million people with the notion that the average arable land to support one person’s consumption in the developed world needs more than 4,000 m2 of arable land. Furthermore the population grows annually by 2% on average, which raises the question of future food security in Egypt. (CAPMAS, 2005)A. PovertyAccording to the latest World Bank figures, this situation is further exacerbated due to the fact that approximately 20% of the Egyptian population is below the national poverty line and another 20% of Egyptians are considered to be near poor. This affects mainly those people working in the agricultural sector that represents around 40% of the Egyptian workforce. B. Water ScarcityEgypt has reached a state where the quantity of water available is imposing limits on its national economic de-velopment. As indication of scarcity in absolute terms, often the threshold value of 1000 m3/capita/year, is used. Egypt has passed that threshold already in the nineties. As a threshold of absolute scarcity 500 m3/capita/year is used, Egypt will reach this level soon, considering the population projections for 2025. (MWR, 2014)C. AgricultureEgypt has a total land area of approximately 1 million km2 or the equivalent of 238 million feddans. Most of it is desert and only 5.5% is inhabited. Settlements are concentrated in and around the Nile Delta and its valley, which narrows considerably in Upper Egypt. The total cultivated land area is about 8.6 million feddan – 3% of the total land area – and consists mostly of old and newly reclaimed areas. The climate is arid with very scarce rainfall in a narrow strip along the north coast. The Nile River is the main and almost exclusive source of surface water in Egypt. Agriculture depends on the Nile water and consumes between 80 and 85% of its annual water supply. The agricultural land base consists of old lands in the Nile Valley and Delta, new lands reclaimed from the desert since 1952, rainfed areas, and several oases where groundwater is used for irrigation. (Andrew F. Cooper, Agata Antkiewicz and Timothy M., 2007) D. Soil characteristicsIn the desert areas, soil types and their properties are very much influenced by geomorphic and pedogenic factors. Generally, soils in the new lands are short of fertile nutrients (especially micronutrients), very low in organic mat-ter, alkaline (high pH), and have inferior physical properties and moisture characteristics. In many areas, other ad-verse features include a high percentage of calcium carbonate (CaCO3), high salinity content, and, in some cases, gypsum. In the main, the physical constraints are hard pans, which are formed at varying depths in the soil profile under the influence of many cementing agents. The characteristics of these resources vary considerably from one location to another because of their mode of formation.E. Old landThe old lands represent the largest irrigated area in Egypt and are found in the Nile Valley and Delta. These include lands which were claimed from the desert many generations ago and are intensively cultivated, mostly using wa-ter from the Nile. These lands, characterized by alluvial soils and spreading over 5.36 million feddan, are irrigated by traditional surface irrigation systems, which, compared to modern and improved irrigation systems, have a very low field water application efficiency of around 50%. Two problems occur at most of this land, on the one hand continued encroachment by non-agricultural uses at a rate of 20,000 feddan/year and continued degradation of soil fertility. (El-Gindy, A.M. 2011)F. New landNew lands include lands that have been reclaimed relatively recently particularly since the construction of the Aswan High Dam – or areas that are currently in the process of being reclaimed. They are located mainly on the east and west sides of the Nile Delta and are scattered over various areas of the country. New lands cover 2.5 mil-lion feddan and cover old-new lands as well as new-new lands. The Nile is the main source of irrigation water, but in some desert areas also underground water is used. Sprinkler and drip irrigation regimes are common as well.

FOOD FULL COST ACCOUNTING
Heliopolis University for Sustainable Developmentwww.hu.edu.eg | [email protected]
Carbon Footprint Center Egyptwww.cfc-eg.com | [email protected]
07
Reclamation of these lands started in the early 1950s and is continuing. The government reclaimed approximately 1.92 million feddan of desert land between 1952 and 1987 and an additional 627,000 feddan between 1987 and 1991. During the fifth five year plan (1993-1997), the reclamation of 572,700 feddan was proposed, of which about 469,900 feddan were actually reclaimed. (ICARDA, 2011).G. Soil erosion Soil erosion is regarded as being one of the most serious environmental problems associated with land use (Mor-gan 1996). In many cases, erosion causes an almost irreversible decline in soil productivity and other soil functions (Biot & Lu 1995; Bruce et al. 1995) and leads to environmental damage. Egypt is located in the severely dry region extended from North Africa to West Asia, the wind erosion is considered one of the important land desertification processes in areas exceeding 90% of the state area in western desert, eastern desert and particularly Sinai. These areas are characterized by a fragile ecosystem, scarcity of vegetation cover and severe drought (Wassif, M.M., 2002). Organic agriculture aims to be a production system that is in closer alignment with natural cycles and processes. Hence organic agriculture should also be less conducive to erosion than conventional agriculture, although this is yet to be proved.
2.3 Full Cost AccountingOne of the main objectives of this study is to raise awareness for the topic of the external effects of agriculture on the environment and the society. The external effects are described as all unintended effects on the life of one person occurring during an action done by another person, which can be any action in the daily life as well as any economic activity. Examples for human actions like this, include even one person spewing smoke into the air or dumping litter on the highway (Buchanan, 1962). Throughout this study the most important examples for external costs are soil erosion, atmosphere damage through greenhouse gases and water damage, these are described in more detail at the chapter “Methodology”. In this study the term “Damage Costs” is used as an equivalent for the more commonly used term of ”External Costs” and they include particularly “Environmental Damage Costs”. Right now these damage costs are being payed by the society and future generations, an internalization by for example an environmental tax would represent a cost shift from the common responsibility to the responsibility of the polluter. The Method of “Full Cost Accounting” is, as described in the chapter “Methodology” in more detail, highlighting the fact of further hidden costs beside the direct costs of e.g. raw material and labour. This term of “Environmen-tal Full Cost Accounting” (EFCA) can be seen as equal to the term of “True Cost Accounting” (TCA). True Costs are described as the sum of internal and external costs, which can be understood for this study as “Direct Costs” and “Damage Costs”.
3 Methodology
The study “Food Full Cost Accounting” is an economic and financial comparison of organic and conventional food production systems in Egypt for five of its strategic crops: rice, cotton, wheat, potatoes and maize in old lands and in new lands. The comparison structure and the calculation for the direct cost parameters is based on the Methodology of the FAO Study on “Economic & Financial Comparison of Organic and Conventional Citrus-growing systems” prepared by University of Valencia, except for the financial investment calculation. This is since the presented study aims to focus on the explanation of the specific damage costs, which would be distorted by integrating financial multi-pliers. The calculation methodology for the damage cost parameter Water Quality, Atmosphere Damage, Green-house Gas (GHG) emissions and Soil erosion is based on the FAO report “Food wastage footprint Full-cost account-ing - Final Report”.
3.1 Data CollectionThe data collection and calculations are conducted by the CFC team, led by Engineer Thoraya Seada and Dr. Ramy Mohamed. Primary and secondary data were collected from a total of four different parties:

FOOD FULL COST ACCOUNTING
Heliopolis University for Sustainable Developmentwww.hu.edu.eg | [email protected]
Carbon Footprint Center Egyptwww.cfc-eg.com | [email protected]
08
A. Primary Data Collection: 1. Site visits: During several site visits in various Egyptian governments such as Fayoum, Beheira, Kafr Elsheikh and Sharkia, in-depth interviews with farmers were conducted to collect more data about the agri-culture process, costs, expenses and income. B. Secondary Data Collection: 2. The Egyptian Ministry of Agriculture (MALR), provided data for the direct costs of conventional agriculture such as: raw material costs, costs for fertilizer, insecticides, fungicides, and herbicides, other costs, seed costs and labour & machinery costs. 3. Egyptian Biodynamic Association (EBDA), provided data for the direct costs of organic agriculture.4. The FAO Report “Food Wastage Footprint (FWF) Final Report” was used for the calculation of external damage cost: water quality (Water pollution caused by pesticides and nitrate and phosphate), atmosphere damage regarding to GHG emissions, soil erosion and pesticide poisoning.
3.2 Calculation and Evaluation3.2.1 Carbon Footprint CalculationThe Carbon Footprint assessment is conducted by the Cool Farm Tool. It was originally developed by Unilever and researchers at the University of Aberdeen and the Sustainable Food Lab to help growers measure and understand on-farm GHG emissions. The Cool Farm Tool requires general information about your farm, such as crop area, yield, soil type, fertilizer and inputs, as well as some detailed information on electricity and fuel use (for field oper-ations and primary processing). The CFT includes calculations of soil carbon sequestration, which is a key feature of agriculture that has both mitigation and adaptation benefits.In organic farming, the calculation for the carbon footprint assessment includes the carbon sequestration through the use of compost. Carbon sequestration is defined as long-term storage for carbon dioxide or other forms of carbon. The sequestration amount from compost may offset carbon dioxide emitted by other farm operations such as diesel consumption. Through calculations using the Cool Farm Tool the results for total GHG emission in organic farming in Egypt are calculated to be negative or zero. This development is also confirmed through calcu-lations in New Zealand. The carbon tax is calculated as zero where there is carbon sequestration. Thus this study considers that the total GHG emission cost for organic farming is zero. Subsequently, in conventional farming, the calculation for the carbon footprint assessment was done by the pre-viously described methodology of the Cool Farm Tool. For conventional farming the carbon footprint is calculated with a higher amount of CO2 emission because there is no carbon sequestration from compost.3.2.2 Water Footprint CalculationThe concept of water footprint emerged in 2002, and it has been created in analogy to the ecological footprint. While an ecological footprint measures how much land a human population requires to produce the resources it consumes and to absorb its waste, a water footprint measures human demand on freshwater. In November 2009, the first manual of the methodology - “Water Footprint Manual” - was published.The Water Footprint methodology distinguishes three types of water usage:
1. Consumptive use of rainwater (green water)2. Consumptive use of water withdrawn from groundwater or surface water (blue water)3. Pollution of water (grey water)
In organic farming, the water calculation was conducted with the previously described methodology “Water Foot-print Assessment” to determine the amount of water required per faddan (Green & Blue water). The water quality costs (greywater) for organic farming equates to zero, as these costs are related to the usage of pesticides and to the amount of nitrates in sources of drinking water. In conventional farming, the calculation was conducted by using the Water Footprint Assessment to determine the amount of water required per faddan (Green & Blue water). These costs are dependent on the usage of pesti-cides and the amount of nitrates in sources of drinking water, therefore integrating grey water data as well.3.2.3 Soil Erosion This Study indicates that wind erosion ratio in Egypt is an average of 5.5 ton/hectare (2.33 ton/fd) a year in oases areas in the western desert and 71- 100 ton/hectare a year in areas of rainfed agriculture on the northwest coast.

FOOD FULL COST ACCOUNTING
Heliopolis University for Sustainable Developmentwww.hu.edu.eg | [email protected]
Carbon Footprint Center Egyptwww.cfc-eg.com | [email protected]
09
This shows wind erosion risks in these areas wavering between moderate and severe (Wassif, M.M., 2002). This information was used to calculate the amount of soil erosion from wind for conventional farming and the cost is calculated according to the FAO Report. In organic farming, the soil loss is 15% less for organic agriculture than for conventional agriculture according to Auerswald, Kainz and Fiener (2003).Soil erosion is treated differently for old land and new land in this study. Since the erosion at old land areas is reduced on a minimum in comparison to the new land because of the much more stable clay soil in the old land area. These circumstances are similar for conventional agriculture as well as organic agriculture. 3.3 ParametersThis chapter demonstrates the explanation of all the used parameters in this study. In the following table you will find a first outline of the main comparison parameters (Direct Cost, Damage Cost and the Total Income as well as total Expenses). After this short overview each Parameter listed in the cost tables will be explained in more detail.
Table 01: ParametersA Direct cost
A.1 Raw materials InputsA.1.1 Irrigation waterA.1.2 Fertilizers A.1.3 Insecticides, Fungicides, HerbicidesA.1.4 Other costA.1.5 Seed costA.2 Labour & MachineryA.3 Certification
B Damage costB.1 Water Quality B.1.1 Pesticides in sources of drinking waterB.1.2 Nitrate and Phosphate in sources of drinking waterB.2 Atmosphere Damage B.2.1 GHG emissionsB.3 Soil erosion
C. TotalC.1 Total IncomeC.2 Total ExpensesC.3 Net Benefit
A Direct Cost: This represents all variable factors of production. For the sake of greater clarity, it has been broken down into different subcategories.A.1 Raw Materials Inputs: This category represents the costs generated by inputs – that is, the value of all inputs immobilized during the productive process.A.1.1 Irrigation Water: The irrigation cost includes the energy cost such as diesel and electricity cost for the irriga-tion system which is calculated per Feddan. As water is freely available to Egyptian farmers, the cost for irrigation is only related to the energy cost. The price of diesel and electricity for the year 2010 was obtained from World Bank data. Cost of Irrigation water regarding to electricity and diesel consumption:
Irrigation using electricity on (old land) 0.05 LE/m3Irrigation using Diesel on (new land) 0.20 LE/m3
A.1.2 Fertilizer: This includes the cost of compost for organic farming and the cost of fertilizer for conventional farming. The price is calculated using data from MALR for conventional farming and data from EBDA for organic farming. The amount of fertilizer usage varies according to the type of the crop.

FOOD FULL COST ACCOUNTING
Heliopolis University for Sustainable Developmentwww.hu.edu.eg | [email protected]
Carbon Footprint Center Egyptwww.cfc-eg.com | [email protected]
10
A.1.3 Insecticides, Fungicides and Herbicides: Conventional systems rely on pesticides (herbicides, insecticides, fungicides), many of which are toxic to humans and animals. The data for cost of pesticides is based on MALR. For organic farming the cost of pesticides is assumed to be zero.A.1.4 Other Costs: Costs, not directly related to the manufacturing of a product or delivery of a service such as Maintenance or Emergency. (MALR and EBDA)A.1.5 Seed Costs: The cost of seeds are similar in conventional and organic farming. Prices were taken from MALR and EBDA.A.2 Labour & Machinery: Includes total cost of labour required during the production cycle to perform farming tasks. Also included is the cost of renting machinery, since this is common in Egypt.A.3 Certification: Cost incurred by the farmer to have his or her land certified as organic by the Organic Farming Board, which is the agency responsible for inspecting land and verifying the nature of the used growing method.B Damage Cost: In reference to the chapter of “2.3 Full Cost Accounting”, this cost determines the amount of dam-age on environment and society caused by agriculture through the unsustainable use of water, atmosphere and soil. The environmental impacts of food wastage has been monetized. These costs are estimated via the wastage quantities and unit costs of the related environmental (and some social) impacts. This also applies to the catego-ries that are assessed on the basis of per-area cost data, as the area numbers related to food wastage are in the end linked to the food wastage quantities. B.1 Water Quality: Describes the effect on water resources, occurring through the use of pesticides and fertilizer in agriculture. B.1.1 Pesticides in sources of drinking water: These estimates are based on the removal costs of pesticide from drinking water for the UK.B.1. Nitrate and Phosphate in sources of drinking water: These estimates are based on the removal costs of ni-trate from drinking water for the UK – as no other data were available.
Table 02: Water quality costs (FWF, FAO, 2014)Impact Category Evaluation Method Unit Value used (USD 2012)Water quality (nitrate and pesticidecontamination of drinking water, nitrate / phosphate eutrophication)
Defensive expenditures (costs of pesticide, nitrate, phosphate removal from drinking water), damage costs, Willingness to Pay to avoid.
Eutrophication (based on 0.286$/kg N leached in UK, correction for N input and output levels and agricul-tural areas in each country, and benefit transfer)P eutrophication (based on 12.32$/kg P leached, cor-rection for P input and output levels and agricultural areas in each country and benefit transfer) 0.78$/ha (Thailand) for pesticide contamination (to-tal 264 million in UK, 14.6 million Thailand, corrected for toxicity levels, area, benefit transfer)
**Benefit transfer is done as region-wide as possible. Where values for the UK and Thailand are given, UK numbers are used for developed country benefit trans-
fer and Thailand numbers are used for developing country benefit transfer (FWF, FAO, 2014).**
B.2. Atmosphere Damage: Removal of the main greenhouse gas emissions from the atmosphere.B.2.1 GHG emissions: Damage cost of GHG emissions (including deforestation and managed organic soils), based on a range of approaches, damage costs and defensive expenditure.
Table 3: GHG Emission Cost (FWF, FAO, 2014).Impact Category Evaluation Method Unit Value used (USD 2012)GHG emissions (including deforestation and managed organic soils)
Social cost of carbon (based on a range of approaches, damage costs and defen-sive expenditure)
113 $tCO2/e (globally, no benefit transfer needed)
FOOD FULL COST ACCOUNTING
Heliopolis University for Sustainable Developmentwww.hu.edu.eg | [email protected]
Carbon Footprint Center Egyptwww.cfc-eg.com | [email protected]
11
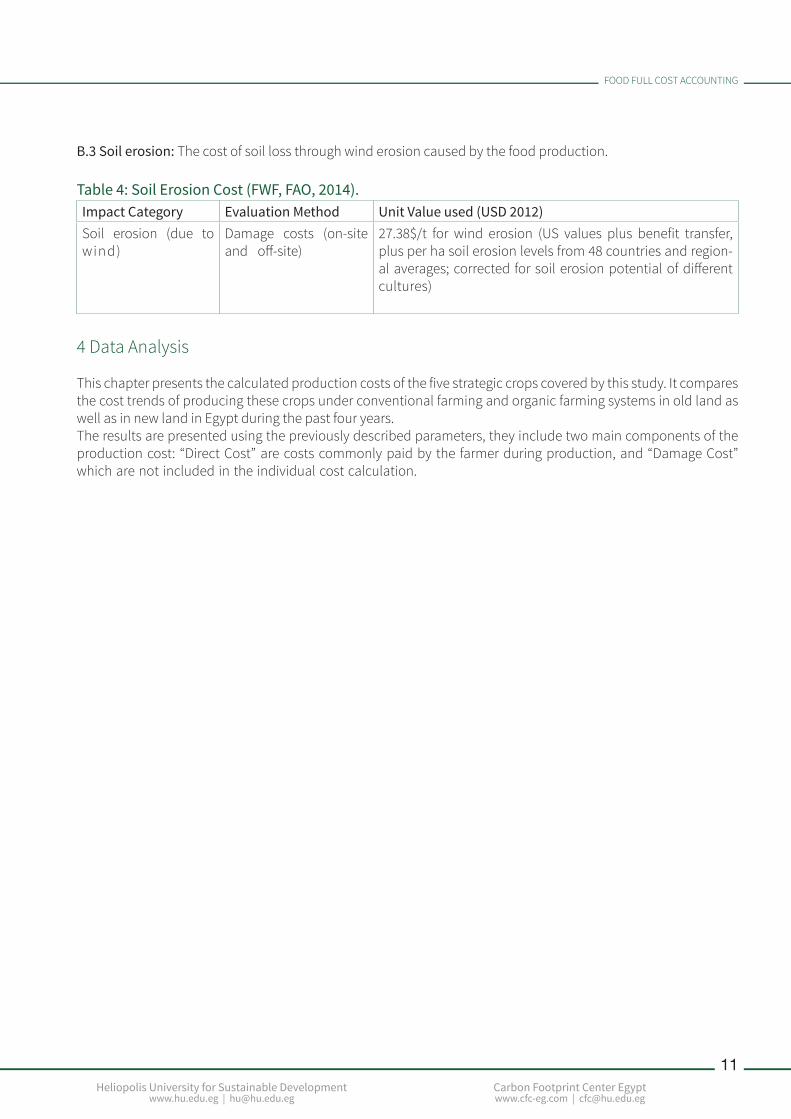
B.3 Soil erosion: The cost of soil loss through wind erosion caused by the food production.
Table 4: Soil Erosion Cost (FWF, FAO, 2014).Impact Category Evaluation Method Unit Value used (USD 2012)Soil erosion (due to wind)
Damage costs (on-site and off-site)
27.38$/t for wind erosion (US values plus benefit transfer, plus per ha soil erosion levels from 48 countries and region-al averages; corrected for soil erosion potential of different cultures)
4 Data Analysis
This chapter presents the calculated production costs of the five strategic crops covered by this study. It compares the cost trends of producing these crops under conventional farming and organic farming systems in old land as well as in new land in Egypt during the past four years. The results are presented using the previously described parameters, they include two main components of the production cost: “Direct Cost” are costs commonly paid by the farmer during production, and “Damage Cost” which are not included in the individual cost calculation.

FOOD FULL COST ACCOUNTING
Heliopolis University for Sustainable Developmentwww.hu.edu.eg | [email protected]
Carbon Footprint Center Egyptwww.cfc-eg.com | [email protected]
12
4.1 Rice
4.1.1 Rice Old Land
The higher direct cost for rice pro-duction under the organic farming system was calculated at EGP 5,788, in contrast to EGP 3,933 under con-ventional farming system. However, the damage costs in convention-al system were around EGP 4,444 compared with EGP 0.0 for organic farming.
As shown in Figure 4 total expenses per feddan for conventional farming are calculated to be 8,377 EGP and the total income was 8,583EGP. Therefore the net benefit was 207 EGP. While in the organic farming the total expenses were 5,788 EGP and the total income was 10,928 EGP so a net benefit was calculated to be 5,140 EGP. These results clearly emphasize the remarkable advantage of organic farming.

FOOD FULL COST ACCOUNTING
Heliopolis University for Sustainable Developmentwww.hu.edu.eg | [email protected]
Carbon Footprint Center Egyptwww.cfc-eg.com | [email protected]
13
4.2 Maize
4.2.1 Maize Old Land
The direct production costs for maize, growing in the old lands are higher under the organic farming regime, calculated around 4,713 EGP, however in conventional farming the direct cost were around EGP 3,761. In contrast the damage cost in conventional system was calculated EGP 3,470
As shown in figure 6, total expenses per feddan for conventional farming was 7,232 EGP while the total income was 5,506 EGP, which results in a deficit of 1,726- EGP. In organic farming, the total expenses were 4,713 EGP and the total income was 5,580 EGP, thus there is a small net benefit of 866 EGP.

FOOD FULL COST ACCOUNTING
Heliopolis University for Sustainable Developmentwww.hu.edu.eg | [email protected]
Carbon Footprint Center Egyptwww.cfc-eg.com | [email protected]
14
4.2.2 Maize New Land
The direct costs for Maize production in a new land area are higher for organic farming, calculated to be 5,513 EGP, while at conventional farming the direct cost was around EGP 3,472. On the other hand, the damage cost in conventional farming was around EGP 4,767 and EGP 407 for organic farming in the new land.
As shown in figure 8 using conventional farming, the total expenses were 8,240 EGP while the total income was 5,316 EGP thus it creates a loss of 2,924- EGP. The organic farming shows a similar result, through total expenses of 5,922 EGP and a total income of 3,168 EGP generates a total loss of 2,754- EGP, which is slightly lower than the deficit of conventional farming.

FOOD FULL COST ACCOUNTING
Heliopolis University for Sustainable Developmentwww.hu.edu.eg | [email protected]
Carbon Footprint Center Egyptwww.cfc-eg.com | [email protected]
15
4.3 Potatoes
4.3.1 Potatoes Old Land
Figure 9 shows that the average direct cost per feddan for potato production in conventional farming at old land was EGP 8,075, and the damage cost was EGP 9,940. The graph also shows that the average direct cost per feddan for potato production in organic farming was EGP 9,614, and the damage cost was EGP 0.0.
As Figure 10 illustrates, the total expenses per feddan are a total of 18,014 EGP and total income per feddan is 13,604 EGP for conven-tional farming equals to a deficit of -4,411 EGP. In contrast organic farm-ing produces a net benefit of 10,966 EGP through the total expenses of 9,614 EGP and a total income of 20,580 EGP.Therefore, after including the dam-age cost the potato production is much more sustainable in organic farming than in conventional.

FOOD FULL COST ACCOUNTING
Heliopolis University for Sustainable Developmentwww.hu.edu.eg | [email protected]
Carbon Footprint Center Egyptwww.cfc-eg.com | [email protected]
16
4.3.2 Potatoes New Land
The comparison in Figure 11 shows in conventional farming at new land direct costs of 6,846 EGP per fd, and additionally damage cost of EGP 6,505. It also shows the average direct cost per fd of potato production in organic farming in new land areas of EGP 10,880, and damage costs of 407.9EGP.
Under conventional farming system, the total expenses were 13,352 EGP while the total income was 13,754 EGP accordingly the net benefit was 402.8 EGP. Under the organic farming system, the total expenses were 11,288 EGP while the total income was 22,050 EGP and thus the net benefit was 10,762 EGP. After including the damage cost potato production is more sustainable in organic farming than in conventional.

FOOD FULL COST ACCOUNTING
Heliopolis University for Sustainable Developmentwww.hu.edu.eg | [email protected]
Carbon Footprint Center Egyptwww.cfc-eg.com | [email protected]
17
4.4 Wheat
4.4.1 Wheat Old Land
For old land, wheat production in organic farming generates a direct cost of around 4,893 EGP as shown in Figure 13. However in conventional farming the direct cost was slightly lower, at EGP 3,373. While the damage cost for conventional farming was EGP 4,147 and for organic farming 0 EGP.
Figure 14 shows the total expenses per feddan of 7,520 EGP and the total income per feddan of 7,889 EGP for conventional farming, therefore it generates a small benefit of 368.8 EGP. In contrast organic farming shows a clear net benefit of 2,187 EGP, calculated by total expenses of 4,893 EGP and a total income of 7,080 EGP.

FOOD FULL COST ACCOUNTING
Heliopolis University for Sustainable Developmentwww.hu.edu.eg | [email protected]
Carbon Footprint Center Egyptwww.cfc-eg.com | [email protected]
18
4.4.2 Wheat New Land
Conventional farming producing wheat in new land generates direct costs of 3,067 EGP, and damage costs at 5,584 EGP as shown in Figure 15. Furthermore it shows the average direct cost per feddan of wheat production in organic farming of around EGP 6,507 and damage cost around EGP 408.
The cost benefit analysis for wheat production at new land shows as a result for conventional farming total expenses of 8,651 EGP and a total income of 6,738 EGP. Consequently there is a net deficit generated of around 1,913- EGP. On the other hand the figure shows the slightly smaller loss of organic farming which is around 602- EGP, which is calculated by the he total expenses of 6,915 EGP and the total income of 6.313 EGP.

FOOD FULL COST ACCOUNTING
Heliopolis University for Sustainable Developmentwww.hu.edu.eg | [email protected]
Carbon Footprint Center Egyptwww.cfc-eg.com | [email protected]
19
4.5 Cotton
4.5.1 Cotton Old Land
Figure 17 shows the average direct cost per feddan of cotton production at conventional farming in the old land, which was 4,280 EGP, and the damage cost, at around EGP 3,556. The graph also shows direct cost of cotton production in organic farming which was 6,109 EGP, and the damage Cost for organic farming at EGP 0 in the old land.
Figure 18 shows the total expenses per feddan (7,836 EGP) and the total income per feddan (8,340 EGP) for conventional farming, resulting in a very small net benefit of 504.3 EGP. In contrast the organic farming generated total expenses of 6,109 EGP and a total income of 6,824 EGP, consequently it shows a higher net benefit of 715 EGP.

FOOD FULL COST ACCOUNTING
Heliopolis University for Sustainable Developmentwww.hu.edu.eg | [email protected]
Carbon Footprint Center Egyptwww.cfc-eg.com | [email protected]
20
5 Conclusion
5.1 Summary of ResultsThe aim of this chapter is to summarize the results in two graphs, to give an overview and show the main outcome of the previously described results. Figure 19 compares the total production costs of organic and conventional farming considering all five evaluated crops.
The graph outlines the higher costs for environment and society occurring through the use of conventional farming methods, since they include higher damage costs. Organic farming enables a cost reduction for society of around 2000 EGP per Feddan for nearly every crop evaluated in this study, because of the low damage costs included in the calculation.

FOOD FULL COST ACCOUNTING
Heliopolis University for Sustainable Developmentwww.hu.edu.eg | [email protected]
Carbon Footprint Center Egyptwww.cfc-eg.com | [email protected]
21
To summarize the results of the study, figure 20 below, gives an overview on the five evaluated crops in terms of total income and total expenses, calculating the net benefit and comparing it between organic farming and conventional farming methodologies. The result of this comparison shows that the net benefit for society and environment using conventional farming methodologies is negative, while organic farming produces a positive net benefit for the most part.
5.2 Research LimitationsThis study was conducted for five strategic crops in Egypt in 2015. The results obtained were determined by the agroecological and socio-economic context of the country during that period. Consequently, this cannot be used to draw general conclusions on the comparative profitability of organic and conventional farming. Moreover, one should be cautious when trying to replicate the results in other geographical areas or in other commodities without taking into account the inevitable differences in contexts. However, the methodology presented in this paper is one that can be useful to carry out comparative analyses for Egyptian crops as well as other crops in other countries. In the selection of crops to be analyzed it is important to choose crops that are grown in both organic and conventional production systems and preferably in old lands as well as new lands.
In response to earlier mentioned global challenges in relation to climate change, Gold Standard has expanded its methodological scope to apply proven certification schemes to the agriculture sector, with the goal of maintaining and enhancing the carbon stock stored and contributing to greenhouse gas reduction at the landscape level. Gold Standard Agriculture projects, such as tree or soil carbon sequestration allow for carbon credit generation that can generate additional funding. These potential extra funds, relevant for organic agriculture with its negative carbon credit, are not taken into consideration. If one would consider this extra income sources the net benefit of organic agriculture would be further improved and realised.

FOOD FULL COST ACCOUNTING
Heliopolis University for Sustainable Developmentwww.hu.edu.eg | [email protected]
Carbon Footprint Center Egyptwww.cfc-eg.com | [email protected]
22
5.3 ConclusionSustainable Agriculture has been identified as a main element of the Green Egyptian Economy (UNEP, 2012). Egypt is at a crossroad of starting a new era, the main challenges according to the Global Competitiveness Report 2015 (WEF, 2015) are “Green Economy”, “Human Development” and “Innovation”. However, the amount of land devoted to certified organic farming accounts for merely 1 percent of the total farming, but has shown significant growth in recent years.
This study concludes that at least for the five examined strategic crops it would be economically more expensive to produce crops based on a conventional farming system, which represents business as usual. For Egypt as an economy true costs are relevant, reflecting the shortage of natural resources such as land, water and fertile soil. For the long-term strategic vision, organic agriculture methods are better equipped to deliver sustainable and cost-efficient food production systems. In organic farming systems, an increase in yield per year with an input reduction due to soil quality improvements will gradually reduce the cost per tonne of production. However, in conventional farming system the input needs to be increased over time to maintain the same output. This will cause higher cost per tonne of production. In general, organic farmers enjoy better prices for their products and a guaranteed market. In addition to that, organic production methods are better for farmer’s health due to the avoidance of chemical usage and in general create more employment opportunities (FAO, 2015).
Currently, the Egyptian government has the strategic ambition of reclaiming 1.5 Million feddan in the desert, presenting an opportunity for sustainable agriculture towards the Egyptian Green Economy. For the future of agriculture in Egypt it will be essential to internalize the external damage costs into cost calculations of every farmer, i.e. let polluters pay. This does not necessarily ask for a radical choice between using conventional or organic farming but rather supports a transition towards more sustainable practices. There are several strategies for the internalization of external costs, such as introducing an environmental tax (e.g. pigouvian tax) which is intended to correct an inefficient market outcome. It should be one of the next steps to analyze which internalization methodology will be the best strategy for the Egyptian society to prevent further environmental damage through agriculture, and enable a sustainable and efficient food production in Egypt. Currently, through high energy subsidies and no generic water prices, the unsustainable practices are supported and the market is distorted because there is no fair distribution of the true costs occurring in agricultural production. In the end the costs are carried by the environment and future generations that are both the basis for Egypt’s economy.
The CFC recommends to conduct further comparative studies for other crops in Egypt including more detailed and direct measurements related to key cost drivers, especially water and carbon footprints. This will give a better perspective about the agricultural challenge in Egypt and the potential benefits from organic agriculture production systems. Still, there are some cost factors from the FAO study coming from other country experiences, which needs to be overcome and adapted to get more accurate results for the Egyptian agriculture context.
Additionally, organic methods could also prove beneficial in terms of human development, which should be investigated in a separate study with a different approach.

FOOD FULL COST ACCOUNTING
Heliopolis University for Sustainable Developmentwww.hu.edu.eg | [email protected]
Carbon Footprint Center Egyptwww.cfc-eg.com | [email protected]
24
References
Andrew F. Cooper, Agata Antkiewicz and Timothy M. Shaw, 2007. Lessons from BRICSAM about South-North Relations at the Start of the 21st Century: Economic Size Trumps All Else›, International Studies Review, Vol. 9, No. 4, pp. 687 ,675.
Auerswald, K. M. Kainz & P. Fiener, 2003. Soil erosion potential of organic versus conventional farming evaluated by USLE modelling of cropping statistics for agricultural districts. Bavaria
Buchanan J. M. and Stubblebine Wm. C, 1962. “Externality”. In: Economica, New Series, Vol. 29, No. 116, pp. 384-371
Biot Y & Lu XX, 1995. Loss of yield caused by soil erosion on sandy soils. UK
Booz Allen, 2009. Egypt Agricultural Export Strategy. Egypt: IMC. Retrieved January, 2016, from www.imc-egypt.org
Egyptian Biodynamic Association (EBDA), 2015. Organic Cost Report. Egypt.
FAO, 2009. “Global Agriculture towards 2050”. Rome: Agricultural Development Economics Division. Retrieved January 2016 ,3 from http://www.fao.org/fileadmin/templates/wsfs/docs/
Global Competitiveness Report, 2014. Cairo. Egyptian Council for Economic Studies (ECES) and the Egyptian National Competitiveness Council (ENCC).
Igual and Ricardo J. Server Izquierdo, 2000. Economic and Financial Comparison of Organic and Conventional Citrus-Growing Systems. Spain: FAO. Retrieved January, 2016, from http://www.fao.org
International Center for Agricultural Research in the Dry Areas (ICARDA), 2011. Egypt-Australia-ICARDA Workshop on On-farm Water-use Efficiency. Egypt.
Mekonnen and Hoekstra, 2010. Global Assessment of the Water Footprint. Water footprint Network. Retrieved January, 2016, from www.footprintnetwork.org
Ministry of Agriculture and Land Reclamation (MALR), 2009. Agriculture Directorates in Governorates. Egypt: MALR.
Ministry of Water Resources and Irrigation, 2014. Water Report. Egypt
Nadia El-Hage Scialabba, Climate, Energy and Tenure Division, 2014. The Food Wastage Footprint (FWF) Report. FAO. Retrieved January, 2016, from www.fao.org
Wassif, M.M, 2002. Determination of Wind Erosion Precipitation and the Economic Measures to Combat Desertification in Western Desert Oases. A.R.E.