the functional morphology and internal structure of the
TRANSCRIPT

EVOLUTIONARY STUDIES INSTITUTE AND SCHOOL OF GEOSCIENCES,
UNIVERSITY OF THE WITWATERSRAND
The functional morphology and internal structure of
the forelimb of the Early Triassic non-
mammaliaform cynodont Thrinaxodon liorhinus Master’s Dissertation
Safiyyah Iqbal 5/6/2015
Supervisors:
Dr. Kristian Carlson
Dr. Fernando Abdala
Student Number: 360821

2
DECLARATION
I, Safiyyah Iqbal (Student number: 360821), am a student registered for the degree in Master of Science
by Dissertation (SR000) in the academic year 2014 completing in January 2015. I herewith submit the
following research “The functional morphology and internal structure of the forelimb of the Early Triassic
mammal-like cynodont Thrinaxodon liorhinus” in fulfillment of the requirements of the above course.
I hereby declare the following:
I am aware that plagiarism (the use of someone else’s work without their permission
and/or without acknowledging the original source) is wrong.
I confirm that the work submitted for assessment for the above degree is my own unaided
work except where I have explicitly indicated otherwise.
This research has not been submitted before, either individually or jointly, for any course
requirement, examination or degree at this or any other tertiary educational institution.
I have followed the required conventions in referencing the thoughts and ideas of others.
I understand that the University of the Witwatersrand may take disciplinary action against
me if it can be shown that this task is not my own unaided work or that I failed to
acknowledge the sources ideas or words in my writing in this research.
Signature: _________________________ Date: 06 May 2015

3
TABLE OF CONTENTS:
Declaration________________________________________________________________ Page 2
Table of Contents___________________________________________________________ Page 3
List of Tables and Figures ____________________________________________________Page 4
List of Abbreviations________________________________________________________ Page 5
Abstract___________________________________________________________________ Page 6
Keywords__________________________________________________________________ Page 6
Introduction________________________________________________________________Page 7
Materials and Methods
Materials____________________________________________________________Page 10
Methods____________________________________________________________ Page 13
Muscle attachment sites_______________________________________________Page 19
Results
Geometric morphometric landmark-based analyses_______________________Page 19
Humerus_____________________________________________________ Page 20
Radius_______________________________________________________Page 23
Ulna_________________________________________________________ Page 26
Indices______________________________________________________________Page 29
Cortical thickness_____________________________________________________Page 34
Torsion_____________________________________________________________ Page 40
Discussion
General configuration_________________________________________________ Page 41
Internal morphology__________________________________________________ Page 45
Limitations___________________________________________________________Page 45
Conclusion_________________________________________________________________ Page 46
Acknowledgments___________________________________________________________Page 47
References_________________________________________________________________ Page 48
Appendix 1_________________________________________________________________ Page i
Appendix 2_________________________________________________________________Page xi
Appendix 3_________________________________________________________________Page xiii

4
LIST OF TABLES AND FIGURES:
Table 1: Sample composition____________________________________________________ Page 11
Table 2: Scan parameters_______________________________________________________ Page 14
Figure 1: Measurements of indices________________________________________________Page 15
Table 3: Scale factor___________________________________________________________Page 17
Figure 2: Humeral PC1_________________________________________________________Page 21
Figure 3: Humeral PC1 displacement______________________________________________Page 21
Figure 4: Humeral PC2_________________________________________________________Page 22
Figure 5: Humeral PC2 displacement______________________________________________Page 22
Figure 6: Radial PC1___________________________________________________________Page 24
Figure 7: Radial PC1 displacement________________________________________________Page 24
Figure 8: Radial PC2___________________________________________________________Page 25
Figure 9: Radial PC2 displacement________________________________________________Page 25
Figure 10: Ulnae PC1__________________________________________________________ Page 27
Figure 11: Ulnae PC1 displacement_______________________________________________ Page 27
Figure 12: Ulnae PC2__________________________________________________________ Page 28
Figure 13: Ulnae PC2 displacement_______________________________________________ Page 28
Table 4: Regression____________________________________________________________Page 29
Figure 14: SMI________________________________________________________________Page 30
Figure 15: HRI________________________________________________________________Page 31
Figure 16: EI_________________________________________________________________ Page 32
Figure 17: IFA________________________________________________________________Page 33
Figure 18: URI________________________________________________________________Page 34
Figure 19: %Ct.Ar. ____________________________________________________________Page 35
Figure 20: Ln Ix and Ln Iy_______________________________________________________ Page 36
Figure 21: Ln Ix and Ln Iy_______________________________________________________ Page 37
Figure 22: Ix/Iy and Imax/Imin______________________________________________________Page 38
Figure 23: J__________________________________________________________________ Page 39
Figure 24: J/2_________________________________________________________________Page 40
Figure 25: Torsion_____________________________________________________________Page 41

5
LIST OF ABBREVIATIONS
AZ – Assemblage Zone
MA – Millions of years ago
ESI – Evolutionary Studies Institute
APES – Animal, Plant and Environmental Sciences
SAS – School of Anatomical Sciences
DNMNH – Ditsong National Museum of Natural History
MCZ – Museum of Comparative Zoology
ANWC – Australian National Wildlife Collection
QM – Queensland Museum
TM – Tasmanian Museum
Sp. – Species
CT – Computed Tomography
SMI – Shoulder Moment Index
DLH – Deltoid Length of Humerus
HL – Humeral Length
HRI – Humerus Robustness Index
TDH – Transverse Diameter of Humerus
EI – Epicondyle Index
DEH – Epicondylar Width of Humerus
IFA – Index of Fossorial Ability
OL – Olecranon Length
FUL – Functional Ulna Length
URI – Ulna Robustness Index
TDU – Transverse Diameter of Ulna
Ps. Ar. – Periosteal Area
Ct. Ar. – Cortical Area
AP – Anteroposterior
ML – Mediolateral
Ө – Principal Angle
%Ct. Ar. – Percentage Cortical Area
J – Polar Moment of Area
J/2 – Bending Rigidity
GM – Geometric Morphometric
PCA – Principal Component Analyses
PC – Principal Component
DF – Degrees of Freedom
n – Sample size
.stl – Stereolithography
.ver – Version description file format

6
Abstract
Thrinaxodon liorhinus, a cynodont that has been of captivating importance in the evolution of
therapsids, is one of the best known transitional fossil taxa from non-mammaliaform cynodonts to
mammals. The species is abundant in the South African Karoo Basin and is one of the best represented
taxa immediately after the Permian-Triassic mass extinction. One of the key adaptive characteristics that
may have aided in their survival was fossorialism. Numerous fossils of Thrinaxodon have been found in
burrows or in a curled-up position, which has provided important circumstantial evidence for the
formalization of the hypothesis of Thrinaxodon as a burrower. However, finding a fossil inside a burrow
or even in a curled-up position only provides firm evidence for burrow use, not for burrow creation.
Direct evidence for burrowing capability can come from the understanding of the functional morphology
of Thrinaxodon limbs. The present study investigates internal and external structure of the Thrinaxodon
forelimb, a variety of reptiles characterized by different behavioural patterns, and other cynodonts in
order to advance present knowledge about the functional morphology of the transitional phase cynodont.
The study uses Geometric Morphometric analyses, forelimb metric indices, torsion and cortical thickness
of humeri in order to determine the extent to which, the Thrinaxodon forelimb functionally and
structurally resembles that of a fossorial mammal versus a digging reptile. Results of the study tease apart
the extent to which the Thrinaxodon forelimb illustrates modifications due to gait (e.g., sprawling versus
semi-sprawling) versus a fossorial lifestyle. This would indicate that Thrinaxodon retained the reptilian
skeletal configuration and adapted a posture that had begun to resemble parasagittal more than sprawling
or semi-sprawling gait. Nonetheless, Thrinaxodon exhibits forelimb structural similarities to digging
species, whether mammals or reptiles.
Keywords: Cross-sectional properties, fossorial lifestyle, geometric morphometric, muscle attachments,
sprawling posture.

7
Introduction
Cynodonts, members of the mammal-like therapsid lineage, are first documented in the Late
Permian and include mammals as the only living group (Kemp 2005). Cynodonts are the youngest
therapsid group whose main diversification occurred in the Triassic (Abdala and Ribeiro 2010). Non-
mammaliaform cynodonts (fossil members of the group closely related to mammals) are acknowledged as
documenting one of the best transformational sequences in the fossil record, showing the acquisition of
several key mammalian characteristics (Kemp 1983; Hopson 1987; Luo and Crompton 1994; Rubidge
and Sidor 2001; Sidor and Smith 2004; Botha et al. 2004, 2007; Abdala and Ribeiro 2010). Features that
evolve in these fossils that are present in today’s mammals are the enlargement of the masseteric fossa in
the lower jaw, development of a complete secondary osseous palate and double occipital condyle, among
others (Kemp 2005).
The Beaufort Group of the Karoo Basin in South Africa is well-known for having the most
complete record of non-mammaliaform cynodonts in a successive sequence going from Late Permian to
the Middle Triassic (Kemp 1983; Botha et al. 2004, 2007). This geologic unit contains diverse and
abundant fossils that enhance our understanding of Permian-Triassic palaeocommunities (Rubidge 1995,
2005). The earliest cynodont appears in the Tropidostoma Assemblage Zone (AZ) of the Karoo, while
three genera have been found in the Dicynodon AZ at the end of the Permian, and four are documented
after the Permian-Triassic extinction event (Abdala and Ribeiro 2010). The oldest evidence of cynodont
burrowing has been found in the Lower Triassic of South Africa and has been attributed to Thrinaxodon
(Damiani et al. 2003; Fernandez et al. 2013).
It was suggested that non-mammaliaform cynodonts may have evolved burrowing as a
behavioural strategy (Damiani et al. 2003, Iqbal 2013) to escape the harsh environmental conditions
(Bordy et al. 2009) that followed the Permian-Triassic mass extinction event 252 million years ago (MA).
Accordingly, this mode of survival may have been instrumental to success of the lineage that gave rise to
8
mammals in the Jurassic (Ruta et al. 2013). Discovering a specimen inside a burrow is not necessarily
indicative of the animal being fossorial, however, as animals can occupy burrows opportunistically,
whether they have the ability to create their own burrow or not (Lamping 2012). Musculoskeletal
structure convergent on that of known fossorial animals (e.g. wombats) would provide more definitive
evidence for this type of adaptive behavioural strategy (and morphology) than would an association with
a fossilized burrow cast. It is evident that the musculature of the forelimb plays an important role in the
mode of behaviour of the organism (Abdala and Moro 2006). However, there has been a lack of internal
(e.g., cross-sectional properties) skeletal description of Thrinaxodon’s forelimb. The forelimbs of
fossorial species are stout and robust with large areas of muscle attachments (Milne et al. 2009;
Elissamburu and De Santis 2011). In a recent morphological study using landmarks (Iqbal 2013, Iqbal et
al. in prep), humeral shape of Thrinaxodon was morphologically closer to that of wombats, which is a
well-known fossorial marsupial, than it was to that of Varanus niloticus and Thylacinus cynocephalus.
This evidence supports the hypothesis of Thrinaxodon as a potential burrow maker (Iqbal 2013).
However, intriguingly, the radius retained a form resembling the condition of digging reptiles, which also
have a sprawled limb posture (Iqbal 2013).
In addition to selective pressures generated by fossorialism, morphology of Thrinaxodon
forelimbs undoubtedly is shaped by selective pressures associated with gait type. Skeletal elements of the
forelimb are likely adapted according to locomotion and habitual gait posture, as well as active
fossorialism (Turnbull and Reed 1967; Szalay 1994; Iqbal 2013). A few morphological characteristics in
the limb of Thrinaxodon are interpreted as to allow for larger muscle attachment (Kemp 2005), thus
supporting the body off the ground (Kardong 2009). However, this degree of attachment decreased across
cynodonts towards modern mammals, permitting the limbs to adopt a parasagittal posture (Blob 2001).
Detailed quantitative studies of forelimb posture in therapsids, including Thrinaxodon, are lacking and
this has resulted in an interpreted semi-sprawling posture for all non-mammaliaform therapsids (Jenkins
1971). In fact, transition from the sprawling posture of reptilian forelimbs to a more erect mammalian

9
parasagittal posture receives critical support in the semi-sprawled gait reconstruction attributed to
Thrinaxodon (Reilly and Delancey 1997; Blob and Biewener 1999; Damiani et al. 2003; Iqbal 2013). A
recent study (Iqbal 2013) demonstrated structural trends in broad humeral epiphyses that provide large
areas for muscle attachment in the forelimb of Thrinaxodon, noting that they fall between those of the
mammalian wombat and the reptilian Varanus forelimb which suggested a mosaic pattern of features
indicating digging ability and sprawled limb posture.
In order to evaluate the evolutionary origins of forelimb functional morphology in Thrinaxodon
liorhinus, comparison with a non-burrowing cynodont relative, Cynognathus, and a dicynodont,
Cistecephalus that exhibits fossorial morphology in the forelimb, is necessary. Cynognathus was one of
the larger carnivorous cynodonts common during the Early-Middle Triassic (Solomon et al. 2011). This
species was estimated to be two metres in body length with the hind limbs directly underneath the body
and the forelimbs semi-sprawled (Jenkins 1971; Palmer 1999; Nasterlack et al. 2013). Cistecephalus, a
dicynodont from the Late Permian, is interpreted as a specialized burrower because of specialized features
in its forelimbs resembling those of modern burrowing mammals (Cluver 1978; Palmer 1999).
Extant reptiles present a marked heterogeneity in terms of adaptive strategies (e.g., arboreal, rock-
dwelling, fossorial), making them an ideal comparative group for providing insight into understanding
form-function relationships in the limb musculoskeletal anatomy of the fossil species. There are different
types of digging behavior (e.g., occasional digger, scratch digger, generalized digger, etc.) that digging
reptiles, as well as other fossorial animals, exhibit. These may be reflected in minor differences of the
limb bone morphology depending on how these types of digging behavior affect the bone structure.
Research on posture and behaviour in the cynodont, Thrinaxodon, has not fully determined
functional morphology of the forelimb as reflecting adaptation to fossorialism or response to the semi-
sprawling posture, nor have quantitative analyses (e.g., geometric morphometric approaches) been
applied in addressing this issue. The main goal of this study is to enhance insight into the functional

10
morphology of the forelimb of Thrinaxodon, primarily through comparisons with those of a burrower
mammal and a variety of reptiles with different general activity patterns. Forelimb structure is externally
assessed using geometric morphometrics, a qualitative analysis of muscle attachment and internally
assessed using cross-sectional geometric properties. This will allow for a comprehensive understanding of
the overall variability in functional morphology of cynodont forelimbs, and specifically, a better
understanding of which features drive observed morphological differences. Achieving these aims will
allow specific hypotheses to be addressed.
1. The forelimb of the mammal-like cynodont Thrinaxodon is adapted for burrowing. If the fossil
taxon resemble fossorial marsupials and reptiles, these features would seem to be related to
fossorial behavior and relatively independent of phylogeny.
2. Alternatively, the forelimb musculoskeletal structure of Thrinaxodon may be adapted to semi-
sprawled posture and gait. Where the fossil taxon (i.e., Thrinaxodon) resemble fossorial reptiles
only, these features could resemble either gait type or fossorial behavior, unless resemblance with
other reptiles (e.g., non-digging reptiles) was minimal.
3. The forelimb of Thrinaxodon, presumably adapted for digging, should exhibit greater
configurational similarity to the forelimb of the dicynodont Cistecephalus, also regarded as a
fossorial taxon, than Cynognathus, generally considered to be a non-fossorial cynodont.
4. The forelimb structure of the fossil taxa, Cistecephalus and Cynognathus, share similarities with
Thrinaxodon that are not shared by modern taxa, indicating a phylogenetic signal.
Materials and Methods
Materials
Morphological features of the right forelimb of fossil taxa were included for Thrinaxodon
liorhinus (BPI/1/7199), which was found in a burrow cast numbered BPI/1/ 5558; Cynognathus
(BPI/1/1675) and Cistecephalus (BPI/1/2915); which is housed at the Evolutionary Studies Institute,
11
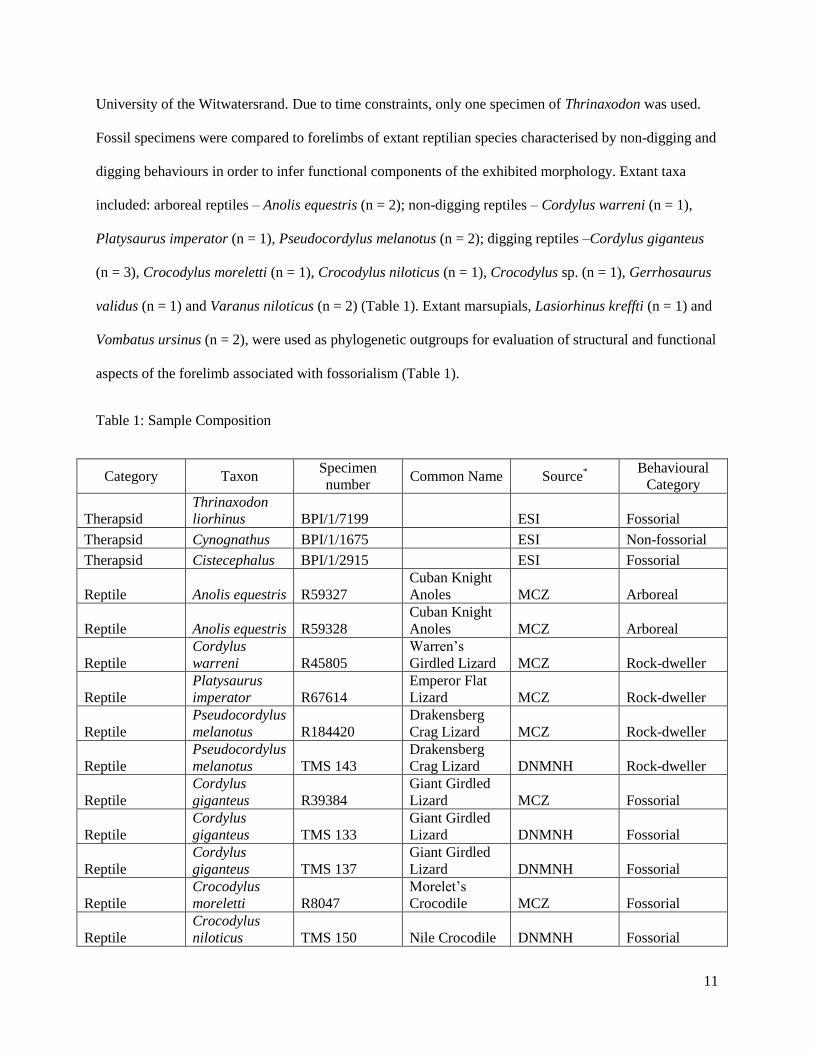
University of the Witwatersrand. Due to time constraints, only one specimen of Thrinaxodon was used.
Fossil specimens were compared to forelimbs of extant reptilian species characterised by non-digging and
digging behaviours in order to infer functional components of the exhibited morphology. Extant taxa
included: arboreal reptiles – Anolis equestris (n = 2); non-digging reptiles – Cordylus warreni (n = 1),
Platysaurus imperator (n = 1), Pseudocordylus melanotus (n = 2); digging reptiles –Cordylus giganteus
(n = 3), Crocodylus moreletti (n = 1), Crocodylus niloticus (n = 1), Crocodylus sp. (n = 1), Gerrhosaurus
validus (n = 1) and Varanus niloticus (n = 2) (Table 1). Extant marsupials, Lasiorhinus kreffti (n = 1) and
Vombatus ursinus (n = 2), were used as phylogenetic outgroups for evaluation of structural and functional
aspects of the forelimb associated with fossorialism (Table 1).
Table 1: Sample Composition
Category Taxon Specimen
number Common Name Source
* Behavioural
Category
Therapsid
Thrinaxodon
liorhinus BPI/1/7199 ESI Fossorial
Therapsid Cynognathus BPI/1/1675
ESI Non-fossorial
Therapsid Cistecephalus BPI/1/2915
ESI Fossorial
Reptile Anolis equestris R59327
Cuban Knight
Anoles MCZ Arboreal
Reptile Anolis equestris R59328
Cuban Knight
Anoles MCZ Arboreal
Reptile
Cordylus
warreni R45805
Warren’s
Girdled Lizard MCZ Rock-dweller
Reptile
Platysaurus
imperator R67614
Emperor Flat
Lizard MCZ Rock-dweller
Reptile
Pseudocordylus
melanotus R184420
Drakensberg
Crag Lizard MCZ Rock-dweller
Reptile
Pseudocordylus
melanotus TMS 143
Drakensberg
Crag Lizard DNMNH Rock-dweller
Reptile
Cordylus
giganteus R39384
Giant Girdled
Lizard MCZ Fossorial
Reptile
Cordylus
giganteus TMS 133
Giant Girdled
Lizard DNMNH Fossorial
Reptile
Cordylus
giganteus TMS 137
Giant Girdled
Lizard DNMNH Fossorial
Reptile
Crocodylus
moreletti R8047
Morelet’s
Crocodile MCZ Fossorial
Reptile
Crocodylus
niloticus TMS 150 Nile Crocodile DNMNH Fossorial

12
Reptile Crocodylus sp. ZA913 Crocodile SAS Fossorial
Reptile** Crocodylus sp. Fresh Specimen Crocodile SAS Fossorial
Reptile
Gerrhosaurus
validus R44579
Giant Plated
Lizard MCZ Fossorial
Reptile
Varanus
niloticus VN1 Nile monitor APES Fossorial
Reptile
Varanus
niloticus VN2 Nile monitor APES Fossorial
Mammal
Lasiorhinus
kreffti J14051
Northern
Hairy-nosed
Wombat TM Fossorial
Mammal
Vombatus
ursinus M10000
Common
Wombat ANWC Fossorial
Mammal
Vombatus
ursinus A1258
Common
Wombat QM Fossorial
* ESI: Evolutionary Studies Institute at the University of the Witwatersrand (South Africa); APES:
Animal, Plants and Environmental Sciences Museum at the University of the Witwatersrand (South
Africa); SAS: School of Anatomical Sciences at the University of the Witwatersrand (South Africa);
DNMNH: Ditsong National Museum of Natural History (South Africa); MCZ: Museum of Comparative
Zoology at Harvard University (Massachusetts); ANWC: Australian National Wildlife Collection
(Canberra); QM: Queensland Museum (Brisbane); TM: Tasmanian Museum (Hobart)
** The fresh specimen that was used for dissecting purposes was obtain from the School of Anatomical
Sciences at the University of the Witwatersrand with the help of Prof. Paul Manger and Mr. Brendon
Billings.
The forelimb of Varanus niloticus and that of Vombatus ursinus and Lasiorhinus kreffti, have
been examined previously (Iqbal 2013; Iqbal et al. In prep), and were shown to be broadly comparable to
that of Thrinaxodon. These four specimens allowed for a better understanding of the extent to which
Thrinaxodon forelimb resembles either fossorial mammals or reptiles.
Gerrhosaurus sp. is fossorial, and is adapted to living on rocky out-crops (Branch 1998;
Alexander and Marais 2007). Cordylus giganteus is a sungazing lizard that lives in burrows (Branch
1998; Alexander and Marais 2007). Crocodylus niloticus is the second largest extant reptile, and is found
throughout Sub-Saharan Africa (Branch 1998). Juveniles of this species often dig burrows to inhabit for
up to four years (Branch 1998). They exhibit short but strong limbs (Alexander and Marais 2007).
Cordylus warreni is one of the few non-digging reptiles in southern Africa (Branch 1998). They are found
on mountainous slopes that are rocky with deep fractures that allow sheltering during hot-dry seasons

13
(Branch 1998; Alexander and Marais 2007). Platysaurus imperators are rock-dwelling, non-digging,
savanna lizards (Branch 1998; Alexander and Marais 2007). Pseudocordylus melanotus, a non-digging
reptile, is found in large colonies in rocky outcrops (Alexander and Marais 2007). Anolis equestris is
native to Cuba and are strictly arboreal lizards (Nicholson and Richards 2011).
Methods
The forelimbs of Cynognathus BPI/1/1675, Cistecephalus BPI/1/2915, Cordylus giganteus (TMS
133 and TMS 137), Crocodylus ZA 913, Crocodylus niloticus TMS 150, Pseudocordylus melanotus TMS
143 and Varanus niloticus were scanned using high resolution computed tomography (CT). The Nikon
Metrology XT H 225 LC microCT scanner located in the Evolutionary Studies Institute (ESI) at the
University of the Witwatersrand (www.wits.ac.za/microCT) (see Table 2 for scan parameters) and the
Skyscan 1173 microCT at the Museum of Comparative Zoology (www.mcz.harvard.edu) was used for
acquiring data from the above-mentioned species (Table 2). Other material, such as the Thrinaxodon
liorhinus specimen (BPI/1/ 7199), was scanned at the European Synchrotron Radiation Facility (ESRF,
France, Grenoble) on ID 17 beamline using a monochromatic beam 96 keV, isotropic voxels of 45.5
microns, and 4000 projections (Fernandez et al. 2013; Iqbal et al. In prep). The marsupial specimens
(Lasiorhinus kreffti J14051, Vombatus ursinus A1258 and M10000) were scanned with a medical CT
scanner using different scan parameters: tube voltage = 120 kV; tube current = 200mA-300mA; slice
thickness = 0.5-0.625 mm, reconstruction increment = 0.4 mm; 512x512 voxel matrix (Carlson et al.
2013).
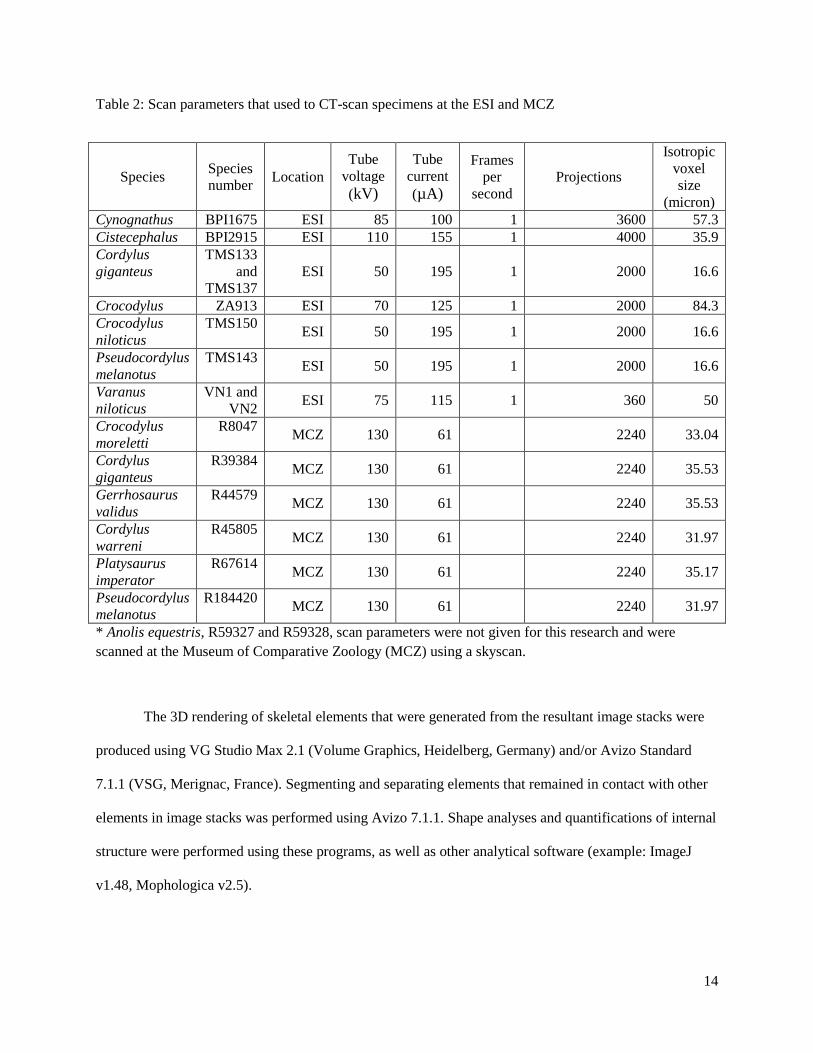
14
Table 2: Scan parameters that used to CT-scan specimens at the ESI and MCZ
Species Species
number Location
Tube
voltage
(kV)
Tube
current
(µA)
Frames
per
second
Projections
Isotropic
voxel
size
(micron)
Cynognathus BPI1675 ESI 85 100 1 3600 57.3
Cistecephalus BPI2915 ESI 110 155 1 4000 35.9
Cordylus
giganteus
TMS133
and
TMS137
ESI 50 195 1 2000 16.6
Crocodylus ZA913 ESI 70 125 1 2000 84.3
Crocodylus
niloticus
TMS150 ESI 50 195 1 2000 16.6
Pseudocordylus
melanotus
TMS143 ESI 50 195 1 2000 16.6
Varanus
niloticus
VN1 and
VN2 ESI 75 115 1 360 50
Crocodylus
moreletti
R8047 MCZ 130 61 2240 33.04
Cordylus
giganteus
R39384 MCZ 130 61 2240 35.53
Gerrhosaurus
validus
R44579 MCZ 130 61 2240 35.53
Cordylus
warreni
R45805 MCZ 130 61 2240 31.97
Platysaurus
imperator
R67614 MCZ 130 61 2240 35.17
Pseudocordylus
melanotus
R184420 MCZ 130 61 2240 31.97
* Anolis equestris, R59327 and R59328, scan parameters were not given for this research and were
scanned at the Museum of Comparative Zoology (MCZ) using a skyscan.
The 3D rendering of skeletal elements that were generated from the resultant image stacks were
produced using VG Studio Max 2.1 (Volume Graphics, Heidelberg, Germany) and/or Avizo Standard
7.1.1 (VSG, Merignac, France). Segmenting and separating elements that remained in contact with other
elements in image stacks was performed using Avizo 7.1.1. Shape analyses and quantifications of internal
structure were performed using these programs, as well as other analytical software (example: ImageJ
v1.48, Mophologica v2.5).

15
Using the digital calipers option in Avizo 7.1.1, seven linear measurements (Figure 1) were taken,
from which five functional indices were calculated. These indices reflect mechanical usage of muscles
related to humerus and ulna function (Elissamburu and Vizcaino 2004; Elissamburu and De Santis 2011):
Shoulder moment index (SMI) – length of the deltoid insertion on the humerus (DLH) divided by
the functional length of the humerus (HL).
Humerus robustness index (HRI) – transverse diameter of the humerus midshaft (TDH) divided
by the functional length of the humerus (HL).
Epicondyle index (EI) – epicondylar width of the humerus (DEH) divided by the functional
length of the humerus (HL).
Index of fossorial ability (IFA) – proximo-distal length of the olecranon process (OL) divided by
the functional ulna length (FUL).
Ulna robustness index (URI) – transverse diameter of the ulna midshaft (TDU) divided by the
functional ulna length (FUL).
Figure 1: A, B: humerus; C: ulna. Measurements taken for the indices. DEH – diameter of the
epicondyles; DLH – deltoid length of the humerus; HL – functional humerus length; OL –
olecranon length from the tip of the olecranon process to the centre of the trochlear notch; TDH –
transverse diameter of the humerus at the midpoint; TDU – transverse diameter of the ulna at the
A: B: C:

16
midpoint; UL – functional ulna length (Figure adapted from Elissamburu and Vizcaino 2004;
Elissamburu and De Santis 2011).
Cortical thickness was analysed only for humeri as the internal properties proved to be
challenging to quantify during the segmentation process. It was not always possible to reliably discern
medullary cavities in the ulna and radius. The images were taken in Avizo 7.1.1 where the humeral bone
was aligned so that the frontal, longitudinal and transverse planes were centred before taking snapshots of
midshaft cross-sections (50% of full length). The scale for images was analysed on ImageJ, and then
imported into Scion Image (release Beta 4.0.2). Resultant images were analysed using custom-written
macros (Carlson 2005). Briefly, this involved inverting images and establishing an upper and lower
threshold range that highlighted the cortical bone in the cross section. Subsequently, cortical bone was
selected in order to calculate cross-sectional properties. Standard cross-sectional properties were acquired:
Periosteal Area (Ps.Ar), Cortical Area (Ct.Ar), second moments of area about anteroposterior (AP) (Iy)
and mediolateral (ML) (Ix), principal moments of area (Imax, Imin) and the principal angle (Ө) (Carlson
2014). Percentage cortical area (% Ct.Ar) was computed as Ct.Ar. divided by Ps.Ar, and multiplied by
100. The polar moment of area (J), was calculated as the sum of Imax and Imin. J quantifies resistance to
torsion whereas the average bending rigidity (J/2) represents a measure of overall bending rigidity of the
diaphysis. Cross-sectional properties (Iy, Ix, Imax, Imin and J) were standardised by natural logging the
variable divided by the length of the humerus to the fourth power, i.e., [ln(variable/length)4].
Standardising cross-sectional properties is customary, as these are known to exhibit allometric
relationships with body size. Cross-sectional properties determines stress and displacement of a bone that
undergoes bending and torsional loads (O’Neill and Ruff 2004; Lieberman et al. 2004; Ruff and Larson
2014).
Each rendered element was aligned to a common morphospace and then standardized (equalised
in length) to the length of respective elements of a representative Vombatus ursinus (M10000) (Table 3).
This permitted exclusively analysing shape changes of the proximal and distal ends as well as torsion

17
amongst the elements. By standardizing bones to equal lengths, direct effects of allometry were reduced.
The purpose of the analysis was to assess configurational differences rather than size differences.
Geometric morphometric (GM) landmark-based analyses were used to measure morphological
similarities between each element of the forelimb elements (humerus, radius and ulna) in order to assess
functional similarities. Landmarks were placed on analogous structures of rendered elements using Avizo
7.1.1. The chosen landmarks emphasize articular surfaces and muscle attachment areas (Milne et al.
2009). A combined total of 70 landmarks were chosen on the forelimb skeleton: twenty-nine humeral
(Table A3), eighteen radial (Table A4) and twenty-three ulnar (Table A5) (Iqbal 2013; Iqbal et al. In
prep).
Table 3: The scale factor that was used to standardize the elements to the length of Vombatus ursinus
M10000.
Humeri Radii Ulnae
Vombatus ursinus M10000 To 117.73 mm To 104.55 mm To 136.03 mm
Vombatus ursinus A1258 Scaled by: 1.171 Scaled by: 0.91 Scaled by: 1.115
Lasiorhinus kreffti J14051 Scaled by: 1.025 Scaled by: 0.92 Scaled by: 0.99
Thrinaxodon liorhinus BPI5558 Scaled by: 3.675 Scaled by: 3.69 Scaled by: 4.68
Cynognathus BPI 1675 (large)* Scaled by: 1.25 Scaled by: 0.95 Scaled by: 0.99
Cynognathus BPI 1675 (small)* Scaled by: 1.2 Scaled by: 1.7
Cistecephalus BPI2915 Scaled by: 3.7 Scaled by: 5 Scaled by: 5
Anolis equestris R59327 Scaled by: 15 Scaled by: 18 Scaled by: 23
Anolis equestris R59328 Scaled by: 16 Scaled by: 19 Scaled by: 23
Cordylus warreni R45805 Scaled by: 6.5 Scaled by: 9 Scaled by: 11
Platysaurus imperator R67614 Scaled by:5 Scaled by: 7 Scaled by: 9
Pseudocordylus melanotus R184420 Scaled by: 9 Scaled by: 13 Scaled by: 15
Pseudocordylus melanotus TMS143 Scaled by: 8 Scaled by: 10 Scaled by: 12
Cordylus giganteus R39384 Scaled by: 5 Scaled by: 7 Scaled by: 7
Cordylus giganteus TMS133 Scaled by: 4 Scaled by: 5 Scaled by: 6
Cordylus giganteus TMS137 Scaled by: 5 Scaled by: 6.5 Scaled by: 8

18
Crocodylus moreletti R8047 Scaled by: 5 Scaled by: 7 Scaled by: 8
Crocodylus niloticus TMS150 Scaled by: 6 Scaled by: 8 Scaled by: 9
Crocodylus ZA913 Scaled by: 0.75 Scaled by: 1.2 Scaled by: 1.4
Gerrhosaurus validus R44579 Scaled by: 11 Scaled by: 13 Scaled by: 16
Varanus niloticus VN1 Scaled by: 2.315 Scaled by: 2.88 Scaled by: 3.25
Varanus niloticus VN2 Scaled by: 2.2735 Scaled by: 2.72 Scaled by: 3
* Two different sized radius and ulna of Cynognathus was used for analyses.
Torsion is the twist of the longitudinal shaft of one end of the bone (proximal) relative to the
other end (distal) due to a strain acting upon the bone (Shah et al. 2006). Humeral torsion has been
attributed to fossorial behavior and is linked to the expansion of muscle attachment area (Meier et al.
2013), however this does not characterised solely fossorial taxa (Evans 1978). Humeral torsion was
calculated using the cross-product (vector product) of two vectors characterizing the proximal and distal
ends of humeral shaft (Jashashvili et al. 2011). The torsion angle was computed as the inverse cosine of
the product of two vectors, multiplied by 180 and then divided by pi (π = 3.141592), i.e., [(Acos(product
of vectors)*180)/3.141592].
MorphoTools 1.1 (Specht et al. 2007; Swiss NFS projects N° 205321-102024/1 and 205320-
109303/1; Lebrun 2008; Lebrun et al. 2010) was used to apply GM analyses on the landmark 3D
coordinates. First, a sample scheme was applied where each .stl and .ver files was specified so that
MorphoTools would recognise the landmark data. This was followed by conducting principal component
analyses (PCA) on the landmarks in order to assess configurational variation in the sample. MorphoTools
allows the landmarks to be altered in a common morphospace essentially by deforming the original
rendering along each principal component (Zelditch et al. 2004; Iqbal et al. In prep). In order to visualise
variability of landmark configuration in morphospace, each principal component (PC) was plotted and
deformed renderings at regular intervals were produced. The PC scores were analysed to illustrate
configurational relationships between elements using JMP 11 (SAS, SAS Institute Inc., 2014). Lastly, a

19
regression was performed in order to explain the predictive relationship of the variables to one another.
Logged centroid size was used as the independent variable in all regressions since it provides a useful
approximation of overall size and is independent of shape. When a PC of interest is not correlated with
logged centroid size, it reflects variance in the sample predominantly due to shape. For all statistical
testing in the study, statistical significance was achieved when p < 0.05.
Muscle attachment sites
Muscle attachment scars on original fossils (or renderings of fossils) were used to define, when
discernible, the extent of muscle attachment sites (Figure A7-A10). In some cases, this was not possible.
As an alternative, the right forelimb of a single fresh specimen, Crocodylus, from the School of
Anatomical Sciences at the University of the Witwatersrand was dissected and examined in order to infer
origin and insertion sites of muscle attachments in the fossil taxa under investigation. It is understood that
the musculoskeletal anatomy of Crocodylus may not entirely be suitable for representing the
musculoskeletal anatomy of the fossil taxa, but it provided a basis for inference when none was possible
otherwise.
Results
Geometric morphometric landmark-based analyses
Principal component analyses (PCAs) of landmark configurations were performed on the
standardized forelimb, where the F-ratio was the sum of squares reflecting different sources of variability.
For the humeri, PC1 (52.03%), PC2 (21.40%) and PC 3 (8.70%) explain most of the variation in the
sample where PC1 (Figure 2) corresponds to shape (r2 = 0.00, F-ratio = 0.05, p > 0.82) (Table 4, Figure
A1) and PC2 (Figure 4) corresponds to width size (r2 = 0.15, F-ratio = 3.29, p > 0.09) (Table 4, Figure
A2). The correspondence of PC1 to shape and PC2 to size is evident in the warp factor when the slider is
moved along respective PC axes and the wireframes/renderings are deformed accordingly. PC1 (37.92%,

20
r2 = 0.09, F-ratio = 2.06, p > 0.17) and PC2 (23.70%, r
2 = 0.00, F-ratio = 0.00, p > 0.98) explain the most
variation in radial configurations while PC3 accounts for 13.10% (Figure 6, Figure 8). PC1 (48.38%, r2 =
0.30, F-ratio = 8.40, p < 0.01), PC2 (23.51%, r2 = 0.00, F-ratio = 0.00, p > 0.98) and PC 3 (9.35%)
accounts for the variation in the ulnae (Figure 10, Figure 12).
Humerus
Plotting PC1 vs. PC2 for humeri, illustrates no overlap along PC1 for Thrinaxodon, however, it
lies on the axis that separates Cynoganthus and Varanus (digging reptile) from the fossorial mammals
(Figure 2), i.e., Thrinaxodon is closest to fossorial mammals. The digging and non-digging reptiles
overlap across PC1 (Figure 2). Cistecephalus overlaps with non-digging reptiles and digging reptiles
along PC1 (Figure 2). Cynognathus is found to have the lowest PC1 score and the arboreal reptiles have
the highest PC1 score (Figure 2). Cynognathus overlaps with the non-digging reptile, Pseudocordylus
melanotus along PC2 (Figure 2, Figure 4). The arboreal reptiles, Anolis equestris, overlap along PC2 with
fossorial mammals (Figure 2). A non-digging reptile, Cordylus warreni, overlaps with a digging reptile,
Cordylus giganteus, along PC1 and PC2 (Figure 2).
Cistecephalus shows no overlaps along PC2 and PC3 (Figure 4). Thrinaxodon overlaps with the
digging reptile, Varanus, along PC3 (Figure 4).There is no clear differentiation among the behavioural
groups as each quadrant has digging and non-digging species (Figure 2, Figure 4). Figure 3 illustrates
PC1 and Figure 5 PC2 for humeral displacement of the species under investigation with a humeral
rendering in anterior view. The series of renderings visualise reduction of the deltopectoral crest, as well
as decreased width at the proximal and distal ends.

21
Figure 2: Plot of PC1 (x-axis) vs. PC2 (y-axis) for humeri. Aequestris: Anolis equestris, arboreal reptile.
Cgiganteus: Cordylus giganteus, digging reptile. Cistecephalus, fossil. Cniloticus: Crocodylus
niloticus, digging reptile. Crocmorelleti: Crocodylus moreletti, digging reptile. Crocodile, digging
reptile. Cwarreni: Cordylus warreni, non-digging reptile. Cynognathus, fossil. Gvalidus:
Gerrhosaurus validus, digging reptile. Lasiorhinus_Wombat: Lasiorhinus kreffti, fossorial
mammal. Pimperator: Platysaurus imperator, non-digging reptile. Pmelanotus: Pseudocordylus
melanotus, non-digging reptile. Thrinaxodon: Thrinaxodon liorhinus, fossil. Varanus: Varanus
niloticus, digging reptile. Vombatus: Vombatus ursinus, fossorial mammal.
Figure 3: Anterior displacement of the humeral PC1 – to PC1 + from -0.2, -0.1, 0, 0.1, 0.2 respectively.

22
Figure 4: Plot of PC2 (x-axis) vs. PC3 (y-axis) for humeri. Aequestris: Anolis equestris, arboreal reptile.
Cgiganteus: Cordylus giganteus, digging reptile. Cistecephalus, fossil. Cniloticus: Crocodylus
niloticus, digging reptile. Crocmorelleti: Crocodylus moreletti, digging reptile. Crocodile, digging
reptile. Cwarreni: Cordylus warreni, non-digging reptile. Cynognathus, fossil. Gvalidus:
Gerrhosaurus validus, digging reptile. Lasiorhinus_Wombat: Lasiorhinus kreffti, fossorial
mammal. Pimperator: Platysaurus imperator, non-digging reptile. Pmelanotus: Pseudocordylus
melanotus, non-digging reptile. Thrinaxodon: Thrinaxodon liorhinus, fossil. Varanus: Varanus
niloticus, digging reptile. Vombatus: Vombatus ursinus, fossorial mammal.
Figure 5: Anterior displacement of the humeral PC2 – to PC2 + from -0.2, -0.1, 0, 0.1 respectively.

23
Radius
Thrinaxodon does not overlap with any species along PC1 and PC2 (Figure 6). However, it shares
the same quadrant as Cynognathus, Cistecephalus and Crocodylus, i.e., the therapsid fossil taxa are
grouped together in relation to the extant species (Figure 6). No overlap occurs for Cistecephalus along
PC1 (Figure 6), however, does overlap with digging reptiles along PC2 (Figure 8). The fossorial
mammals overlap with digging reptiles, Cordylus giganteus, Gerrhosaurus validus and Crocodylus
niloticus along PC1 for the radii (Figure 6). The arboreal species overlap with non-digging and digging
reptiles along PC1 and PC2 (Figure 6). Cynognathus overlaps with digging and non-digging reptiles
along PC2 (Figure 6).
Thrinaxodon does not overlap with any species, but lies closest to the extant reptiles in the
positive axes (Figure 8). The fossorial mammals overlap with Cynognathus and the digging reptiles,
Cordylus giganteus and Crocodylus, along PC3 (Figure 8). There is differentiation amongst the fossorial
mammals and the extant reptiles (Figure 6, Figure 8). Figure 7 illustrates PC1 and Figure 9 PC2 radial
displacement of the species under investigation with a posterior view, explaining a decrease in width of
the overall radial bone.

24
Figure 6: Plot of PC1 (x-axis) vs. PC2 (y-axis) for radii. Aequestris: Anolis equestris, arboreal reptile.
Cgiganteus: Cordylus giganteus, digging reptile. Cistecephalus, fossil. Cniloticus: Crocodylus
niloticus, digging reptile. Crocmorelleti: Crocodylus moreletti, digging reptile. Crocodile, digging
reptile. Cwarreni: Cordylus warreni, non-digging reptile. Cynognathus, fossil. Gvalidus:
Gerrhosaurus validus, digging reptile. Lasiorhinus_Wombat: Lasiorhinus kreffti, fossorial
mammal. Pimperator: Platysaurus imperator, non-digging reptile. Pmelanotus: Pseudocordylus
melanotus, non-digging reptile. Thrinaxodon: Thrinaxodon liorhinus, fossil. Varanus: Varanus
niloticus, digging reptile. Vombatus: Vombatus ursinus, fossorial mammal.
Figure 7: Posterior displacement of the radial PC1 – to PC1 + from -0.1, 0, 0.1 respectively.

25
Figure 8: Plot of PC2 (x-axis) vs. PC3 (y-axis) for radii. Aequestris: Anolis equestris, arboreal reptile.
Cgiganteus: Cordylus giganteus, digging reptile. Cistecephalus, fossil. Cniloticus: Crocodylus
niloticus, digging reptile. Crocmorelleti: Crocodylus moreletti, digging reptile. Crocodile, digging
reptile. Cwarreni: Cordylus warreni, non-digging reptile. Cynognathus, fossil. Gvalidus:
Gerrhosaurus validus, digging reptile. Lasiorhinus_Wombat: Lasiorhinus kreffti, fossorial
mammal. Pimperator: Platysaurus imperator, non-digging reptile. Pmelanotus: Pseudocordylus
melanotus, non-digging reptile. Thrinaxodon: Thrinaxodon liorhinus, fossil. Varanus: Varanus
niloticus, digging reptile. Vombatus: Vombatus ursinus, fossorial mammal.
Figure 9: Posterior displacement of the radial PC2 – to PC2 + from -0.1, 0, 0.1 respectively.

26
Ulna
Thrinaxodon overlaps with non-digging reptiles, Cordylus warreni and Pseudocordylus
melanotus (specimen R184420) along PC1 (Figure 10). The fossorial mammals do not overlap with any
species along PC1 (Figure 10). It is worth noting that the fossorial mammals are the only species to
exhibit an olecranon process on the ulna. Cynognathus (small) and the digging reptile, Crocodylus
moreletti R8047 overlap along PC1, and Cynognathus (large) overlap with the digging reptiles, Cordylus
giganteus (specimen TMS133) and Crocodylus, along PC1 (Figure 10). A non-digging reptile,
Platysaurus imperator, overlaps with a digging reptile, Crocodylus niloticus (specimen TMS150), along
PC1 (Figure 10). Cistecephalus overlap with digging reptiles along PC1 (Figure 10). Varanus niloticus
(specimen VN1) overlaps with Vombatus ursinus (specimen A1258) along PC2 (Figure 10, Figure 12).
This illustrates overlap amongst digging reptiles and fossorial mammals. There is minimal overlap along
PC2 between Cistecephalus and Cynognathus (small) (Figure 10).
Thrinaxodon overlaps with the fossorial mammal, Lasiorhinus kreffti, along PC2 (Figure 12). It
may be noted, that the therapsid fossils separate from extant species along PC2 (Figure 12). Gerrhosaurus
validus and Lasiorhinus kreffti overlap along PC2 (Figure 10, Figure 12). Explaining overlap does occur
between digging reptiles and fossorial mammals. The arboreal reptiles overlap with digging and non-
digging reptiles along PC2 (Figure 12). There is overlap along PC3 between arboreal reptiles and
fossorial mammals (Figure 12). In figure 10, there is clear separation amongst the fossorial mammals with
the therapsid fossils and the extant reptiles. However, figure 12 illustrates separation amongst the
therapsids fossils and the extant species, where the fossorial mammals overlap with the extant reptiles.
Figure 11 illustrates PC1 ulnae displacement of the species under investigation with a lateral view,
explaining the reduction of the proximal end and a decrease in width along the entire shaft for PC2
(Figure 13).

27
Figure 10: Plot of PC1 (x-axis) vs. PC2 (y-axis) for ulnae. Aequestris: Anolis equestris, arboreal reptile.
Cgiganteus: Cordylus giganteus, digging reptile. Cistecephalus, fossil. Cniloticus: Crocodylus
niloticus, digging reptile. Crocmorelleti: Crocodylus moreletti, digging reptile. Crocodile, digging
reptile. Cwarreni: Cordylus warreni, non-digging reptile. Cynognathus, fossil. Gvalidus:
Gerrhosaurus validus, digging reptile. Lasiorhinus_Wombat: Lasiorhinus kreffti, fossorial
mammal. Pimperator: Platysaurus imperator, non-digging reptile. Pmelanotus: Pseudocordylus
melanotus, non-digging reptile. Thrinaxodon: Thrinaxodon liorhinus, fossil. Varanus: Varanus
niloticus, digging reptile. Vombatus: Vombatus ursinus, fossorial mammal.
Figure 11: Lateral displacement of the ulnae PC1 – to PC1 + from -0.2, -0.1, 0, 0.1 respectively.

28
Figure 12: Plot of PC2 (x-axis) vs. PC3 (y-axis) for ulnae. Aequestris: Anolis equestris, arboreal reptile.
Cgiganteus: Cordylus giganteus, digging reptile. Cistecephalus, fossil. Cniloticus: Crocodylus
niloticus, digging reptile. Crocmorelleti: Crocodylus moreletti, digging reptile. Crocodile, digging
reptile. Cwarreni: Cordylus warreni, non-digging reptile. Cynognathus, fossil. Gvalidus:
Gerrhosaurus validus, digging reptile. Lasiorhinus_Wombat: Lasiorhinus kreffti, fossorial
mammal. Pimperator: Platysaurus imperator, non-digging reptile. Pmelanotus: Pseudocordylus
melanotus, non-digging reptile. Thrinaxodon: Thrinaxodon liorhinus, fossil. Varanus: Varanus
niloticus, digging reptile. Vombatus: Vombatus ursinus, fossorial mammal.
Figure 13: Lateral displacement of the ulnae PC2 – to PC2 + from -0.17, -0.1, 0, 0.1 respectively.
29
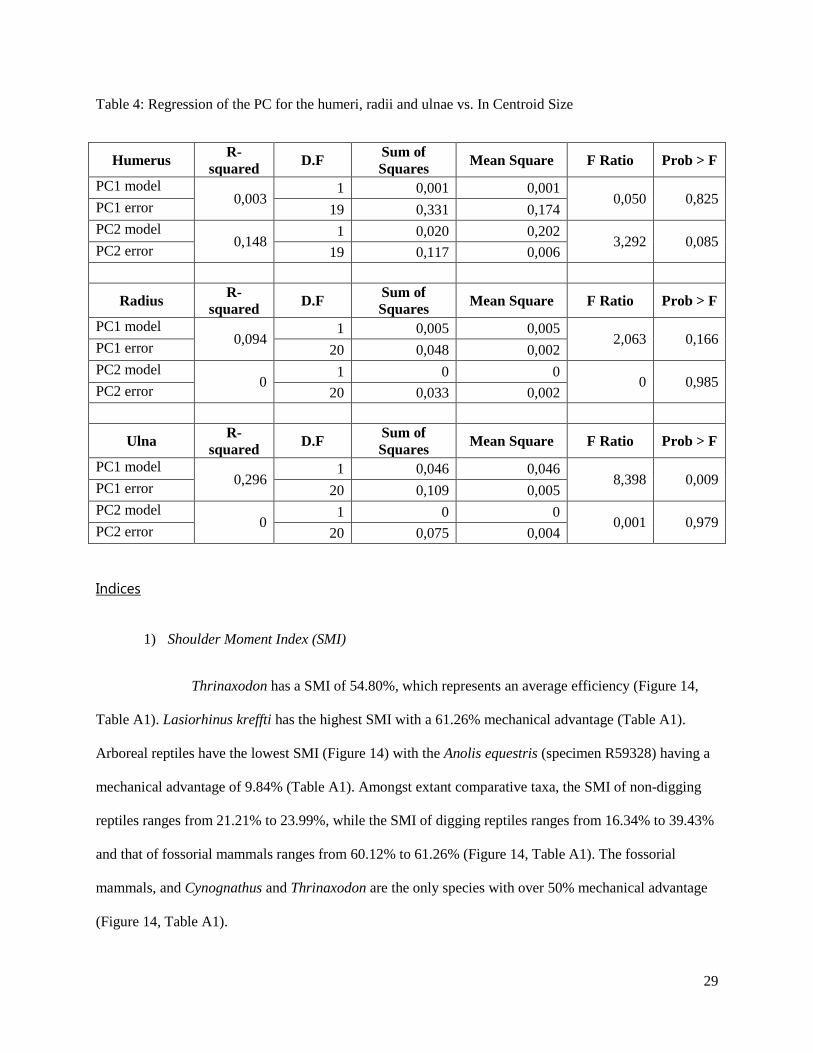
Table 4: Regression of the PC for the humeri, radii and ulnae vs. In Centroid Size
Humerus R-
squared D.F
Sum of
Squares Mean Square F Ratio Prob > F
PC1 model 0,003
1 0,001 0,001 0,050 0,825
PC1 error 19 0,331 0,174
PC2 model 0,148
1 0,020 0,202 3,292 0,085
PC2 error 19 0,117 0,006
Radius R-
squared D.F
Sum of
Squares Mean Square F Ratio Prob > F
PC1 model 0,094
1 0,005 0,005 2,063 0,166
PC1 error 20 0,048 0,002
PC2 model 0
1 0 0 0 0,985
PC2 error 20 0,033 0,002
Ulna R-
squared D.F
Sum of
Squares Mean Square F Ratio Prob > F
PC1 model 0,296
1 0,046 0,046 8,398 0,009
PC1 error 20 0,109 0,005
PC2 model 0
1 0 0 0,001 0,979
PC2 error 20 0,075 0,004
Indices
1) Shoulder Moment Index (SMI)
Thrinaxodon has a SMI of 54.80%, which represents an average efficiency (Figure 14,
Table A1). Lasiorhinus kreffti has the highest SMI with a 61.26% mechanical advantage (Table A1).
Arboreal reptiles have the lowest SMI (Figure 14) with the Anolis equestris (specimen R59328) having a
mechanical advantage of 9.84% (Table A1). Amongst extant comparative taxa, the SMI of non-digging
reptiles ranges from 21.21% to 23.99%, while the SMI of digging reptiles ranges from 16.34% to 39.43%
and that of fossorial mammals ranges from 60.12% to 61.26% (Figure 14, Table A1). The fossorial
mammals, and Cynognathus and Thrinaxodon are the only species with over 50% mechanical advantage
(Figure 14, Table A1).

30
Figure 14: Box plot of the Shoulder Moment Index (SMI) for therapsid fossils, fossorial mammals and
reptiles with different locomotor adaptations.
2) Humerus Robustness Index (HRI)
Thrinaxodon has a HRI of 15.33%, which is the third highest in the sample behind
Lasiorhinus kreffti (specimen J14051) at 17.42% and Vombatus ursinus (specimen A1258) at 16.48%
(Figure 15, Table A1). The arboreal reptiles, Anolis equestris, have the lowest HRI, 7.38% and 7.92%
(Figure 15, Table A1). Cynognathus and Cistecephalus have HRI’s of 13.16% and 14.61%, respectively
(Figure 15, Table A1). From the digging reptile group, Crocodylus (specimen ZA913) has the highest
HRI of 12.37% and Varanus niloticus (specimen VN1) has the second highest HRI of 11.81%, while the
other digging reptiles are lower in HRI’s, ranging around 9.0% HRI (Table A1). The non-digging reptiles
have even lower HRI’s ranging between 7.86% and 8.83% (Figure 15).
S
M
I

31
Figure 15: Box plot of the Humerus Robustness Index (HRI) for therapsid fossils, fossorial mammals and
reptiles with different locomotor adaptations.
3) Epicondyle Index (EI)
Thrinaxodon has the highest EI of 52.92% followed by Cynognathus at 50.31% and
Cistecephalus at 50.10% (Figure 16, Table A1). The fossorial mammals have an EI ranging between
42.98% and 46.50% (Figure 16). Anolis equestris, the arboreal reptiles, have an EI of 23.74% and 24.18%
(Figure 16, Table A1). There are only three digging reptiles that have EI % values in the 30s:
Gerrhosaurus validus at 34.71%, Varanus niloticus (specimen VN1) at 37.16% and Varanus niloticus
(specimen VN2) at 33.64% (Table A1). Amongst the digging reptiles, Crocodylus moreletti, has the
lowest EI at 20.75% (Table A1). The other reptiles, either digging or non-digging, have EI % values in
the 20s (Table A1).
H
R
I

32
Figure 16: Box plot of the Epicondyle Index (EI) for therapsid fossils, fossorial mammals and reptiles
with different locomotor adaptations.
4) Index of Fossorial Ability (IFA)
Thrinaxodon has an IFA of 2.06% and Cistecephalus has an IFA of 7.95% (Figure 17).
Lasiorhinus kreffti and Vombatus have the highest IFA of 20.40% to 23.11%, respectively (Figure 17,
Table A1). Two different individuals of Cynognathus ulnae were analysed. The larger ulna had an IFA of
3.60%, while the smaller ulna had an IFA of 2.83% (Figure 17, Table A1). The digging reptiles have an
IFA ranging between 1.28% and 4.99%, however, Crocodylus (specimen ZA913) has an IFA at 6.50%
(Table A1). Anolis equestris (specimen R59327) has an IFA of 2.45% and Anolis equestris (specimen
R59328) has an IFA of 5.63% (Table A1).
E
I

33
Figure 17: Box plot of the Index of Fossorial Ability (IFA) for therapsid fossils, fossorial mammals and
reptiles with different locomotor adaptations.
5) Ulna Robustness Index (URI)
Thrinaxodon has a URI of 6.95% (Figure 18). Cistecephalus has the highest URI at
12.64% and Crocodylus (specimen ZA913) has the second highest URI at 10.16% (Figure 18, Table A1).
Platysaurus imperator and Pseudocordylus melanotus (specimen R184420) have the lowest URI’s of
4.45% and 4.63%, respectively (Table A1). The URI’s for fossorial mammals, arboreal reptiles, digging
and non-digging reptiles overlap between 5.16% and 9.66% (Figure 18, Table A1).
I
F
A

34
Figure 18: Box plot of the Ulna Robustness Index (URI) for therapsid fossils, fossorial mammals and
reptiles with different locomotor adaptations.
Cortical thickness
1) Percentage Cortical Area (%Ct.Ar).
Thrinaxodon exhibits the third highest %Ct.Ar at 89.76% (Figure 19, Table A2). The
highest %Ct.Ar is exhibited by the non-digging reptile, Pseudocordylus melanotus (specimen R184420),
at 94.52% (Table A2). The lowest %Ct.Ar. is exhibited by Cynognathus at 49.13% (Figure 19, Table A2).
There is overlap amongst the arboreal reptiles, digging reptiles, fossorial mammals and the non-digging
reptiles, with a range between 75.02% and 91.12% (Figure 19).
U
R
I

35
Figure 19: Box plot of the percentage cortical area (%Ct.Ar) for humeral structure at 50% region of
interest.
2) Anteroposterior (AP) bending rigidity [Ix (mm4)]
Thrinaxodon has a scaled Ix at 5.31 mm4 (Figure 20, Table A2) and the highest (12.70
mm4) bending in the AP direction was found to be for the digging reptile, Crocodylus (specimen ZA913)
(Figure 20, Table A2). The arboreal reptiles had the lowest bending in the AP direction at 2.17 – 3.02
mm4 (Figure 20, Table A2). The non-digging reptiles had a scaled Ix range of 4.19 – 6.19 mm
4 (Figure
20).
3) Mediolateral bending rigidity [Iy (mm4)]
Thrinaxodon had a ML bending at 5.47 mm4 (Figure 20). The digging reptiles had the
highest bending in the ML (mediolateral) direction at 12.60 mm4 (Figure 20, Table A2). The arboreal
%C
t. A
r.

36
reptiles had the lowest ML at 2.04 mm4. The fossorial mammals had an ML range between 10.50 mm
4
and 11.27 mm4 (Table A2).
Figure 20: Box plot of the anteroposterior (AP) bending rigidity [ln Ix (mm4)] and mediolateral bending
rigidity [ln Iy (mm4)] for humeral structure at 50% region of interest. - Ix and - Iy
Thrinaxodon has an AP that is equal to its ML (Figure 21). The fossorial mammals ML (Iy) are
higher than its AP (Ix) (Figure 21). Whereas, Cynognathus and Cistecephalus have an AP value higher
than its ML (Figure 21). Most of the species under investigation have an AP equal to its ML (Figure 21).
This illustrates that Ix is a good indicator of Iy, i.e., as Ix increases for a species so does the Iy.
ln I
x (
mm
4)]
an
d l
n I
y (
mm
4)

37
Figure 21: Scatter plot of the anteroposterior (AP) bending rigidity [ln Ix (mm4)] versus mediolateral
bending rigidity [ln Iy (mm4)] for humeral structure at 50% region of interest, Iy = -0.239 + 1.047
* Ix, r2 = 0.98, F-ratio = 972.71, p < 0.0001
4) Rigidity index (Iy/Ix) and shape ratio (Imax/Imin)
Thrinaxodon had an Iy/Ix of 1.03 and a shape ratio (Imax/Imin) of 0.93 (Figure 22, Table
A2). Thrinaxodon overlaps with digging reptiles in the rigidity index and shape ratio (Figure 22). The
fossorial mammal, Vombatus ursinusA1258, had the highest rigidity index of 1.14 (Figure 22, Table A2).
The arboreal reptiles had the lowest rigidity index of 0.92 (Figure 22, Table A2). The highest shape ratio
was Crocodylus ZA913 of 0.99 and Anolis equestris R59327 had the lowest ratio of 0.92 (Figure 22).

38
Figure 22: Box plot of the ratio of second moments of area (Iy/Ix and Imax/Imin) at the midshaft (50%)
region of interest. - Imax/Imin and - Iy/Ix.
5) Polar moment of area, torsional rigidity (J)
Thrinaxodon had a J at 10.81 mm4 (Figure 23). The digging reptile, Crocodylus
(specimen ZA913), had the highest torsion (J) at 25.29 mm4 and the arboreal reptiles had the lowest J at
4.21 mm4 (Figure231, Table A2). Thrinaxodon overlaps with the digging reptiles (Figure 23).
I max/I
min
an
d I
y/I
x

39
Figure 23: Box plot of the polar moment of area, torsional rigidity (ln J) for humeral structure at 50%
region of interest.
6) Average bending rigidity (J/2)
Thrinaxodon had a J/2 at 5.41 (Table 2A). The highest value (J/2) was exhibited by the
digging reptile, Crocodylus (specimen ZA913) (Figure 24) at 12.65 (Table 2A). And the lowest bending
rigidity was found to be for the arboreal reptiles at 2.11 (Figure 24).
Ln
J

40
Figure 24: Box plot of the average bending rigidity (J/2) for humeral structure at 50% region of interest.
Torsion
Thrinaxodon has the highest torsion with an angle of 73.88° (Figure 25). Fossorial mammals have
an average torsion angle between 38.90° and 39.31° (Figure 25). Cistecephalus has a torsion angle of
44.45° which is the lowest angle amongst the fossil species under investigation (Figure 25). Reptilian
diggers have an angle ranging from 7.38° to 44.50° (Figure 25). From the four non-digging reptiles, three
species have angles ranging between 38.11° and 46.93°, while the fourth species (i.e., Platysaurus
imperator) has an angle of 72.22° (Figure 25). The two arboreal specimens, Anolis equestris, have an
angle of 48.89° and 70.80° (Figure 25).
J/2

41
Figure 25: Box plot of the torsion angle for fossil species and extant species where the latter are grouped
into behavioural categories.
Discussion
General configuration
The general shape of the Thrinaxodon humerus resembles that of fossorial species whether being
fossorial mammals or digging reptiles. This morphology relies on the fact that the epiphyseal ends are
both broad with slight torsion of the shaft which is a typical morphological characteristic of diggers
(Jenkins 1973; Kemp 1980; Kardong 2002; Sanchez-Villagra et al. 2004; Meier et al. 2013). Thrinaxodon
humerus shape is closest to that of fossorial mammals and furthest away from the arboreal reptiles along
PC1 (Figure 2). The humeral displacement (Figure 3) illustrates that the deltopectoral crest decreases
from fossorial to arboreal species. The decline in width of the deltopectoral crest reduces the area that is
available for muscle attachment. Musculoskeletal anatomy of the fossorial mammals as well as the
To
rsio
n A
ngle

42
digging reptiles is specialised for joint stability and increased force during activity (Grand and Barboza
2001). Fossorial species require powerful muscles that are attached to broad bony structures (Turnbull
and Reed 1967) on the epiphyses and short robust diaphyses (Warburton et al. 2013). These muscles are
needed in relation to the type of digging behaviour the species exhibits. The shortness of forelimb bones
relative to the body increases the mechanical advantage of attaching muscles during a function such as
digging (Hildebrand and Gloslow 2001).
The SMI provides an indication of how efficient the deltoid muscle is in relation to the bone
(Elissamburu and De Santis 2011). This index measures the area that is available for attachment of the M.
deltoideus. The longer the length of the deltopectoral crest in relation to the humeral length, the more
efficient the mechanical advantage of the deltoid will be (Elissamburu and De Santis 2011). Lasiorhinus
kreffti is a well-known fossorial mammal that has the highest mechanical advantage when compared to
the other extant species under investigation (Figure 14, Table A1). The SMI provides evidence of humeral
stability for body support and digging activity. The SMI for Cynognathus was over 50% and was similar
to that of Thrinaxodon and the fossorial mammal (Figure 14). This may reflect their large body size and
accounts for the stability of the body rather than the fossorial behaviour. Cistecephalus SMI is very
similar to that of digging reptiles and supports the assumption of fossorial behaviour for the dicynodont
(Figure 14). Thrinaxodon exhibited an average SMI that demonstrates the mechanical advantage of its
deltoid to be close to that of fossorial mammals (Figure 14).
Overlap along PC1 in quadrant 1 (positive x-axis and positive y-axis), verify that the digging and
non-digging reptiles, to some extent, share similarities in their humeral shape (Figure 2). Even though
Cordylus giganteus is a digging reptile and Cordylus warreni is a non-digging reptile, there is evidence
that they share shape (PC1) and width size (PC2) similarities in their humeri (Figure 2). This is in relation
to the specimens being in the same genus but different species. The width of the flexor, pronator and
supinator of the antebrachium is indicated by the EI (Elissamburu and De Santis 2011). Thrinaxodon had
the highest EI with close values for the humerus of Cynoganthus and Cistecephalus (Figure 16), which

43
indicates the area available for larger muscle attachment. The expansion of the distal humerus seen in the
fossils (Figure 16) may be related to the semi-sprawling posture evident in therapsids. The epiphyseal
ends are affected by the functional activity of the forelimb (Szalay 1994) and thus, most muscle
attachments, whether the origin or insertion, occur at the extreme ends. The other reptiles species, digging
and non-digging, ranged between 20% and 30% (Figure 16, Table A1). This illustrates that the width of
the epicondyle in relation to the length of the humerus is relative to the digging function as well as to
body support (Elissamburu and Vizcaino 2004).
For the radius, Thrinaxodon does not overlap with any of the species along PC1 and PC2,
however, it does lie in the same quadrant as Cistecephalus, Cynognathus and Crocodylus (Figure 6). This
reveals separation of the therapsid fossils with the extant species, i.e., evidence of a phylogenetic
relationship. The radius bears a fraction of the body weight (Argot 2001) and thus explains that
Thrinaxodon having semi-sprawled limbs share minimal similarities to reptiles that are sprawled limbed.
The difference between the radii is given by the width of the radial shaft (Figure 7, Figure 9). However, it
should be noted that radii are struturally columnar and may not reveal many structural differences
amongst species. The enlarged area for muscle attachment is necessary to be able to withstand resistance
from the ground during digging (Warburton et al. 2013). The arboreal species overlap with the non-
digging reptiles along PC1 and with the digging reptiles along PC2 (Figure 6). This is likely related to the
fact that all reptiles share similarities in limb structure. The fossorial mammals overlap with digging and
non-digging reptiles along PC3, which accounts for something other than shape and size (Figure 8).
The Thrinaxodon ulna lies closest to that of extant reptiles along PC1 (Figure 10), and illustrates
that fossorial mammals are an outlier in ulnar structure. This is due to mammals possessing a prominent
olecranon process that is absent in reptiles. The structure of the ulna, for the fossils and the reptiles except
Varanus, has a posterior proximal facet behind the articular facet and this structure would have the
function of the olecranon process. Varanus species have a small protruding structure on the posterior
portion of the proximal end. From the analyses of the extant Varanus ulna, this structure is not completely

44
ossified on the proximal epiphyseal end and suggests that either it may not have been fossilised in
Thrinaxodon, Cynognathus or Cistecephalus (e.g., not ossified), or it may have been absent. This small
bony process may account for the slight overlap along PC2 between the fossorial mammals and digging
reptile, Varanus (Figure 10) and could possibly explain a phylogenetic relationship. The fossil species,
however, may have had a cartilaginous olecranon or it could have been completely absent (Iqbal 2013).
Having said this, the extant reptilian species retained their primitive structure in the ulna and overlap
along PC1 (Figure 10).
The IFA is in relation to the mechanical advantage of the triceps that are attached to the olecranon
process of the ulna (Elissamburu and De Santis 2011). This index is a good statistic of fossoriality as it is
reflects force development for digging (Hildebrand 1985; Vizcaino et al. 1999; Vizcaino and Milne 2002;
Elissamburu and De Santis 2011). However, due to the reptilian species lacking an olecranon, there is
overlap between the reptilian diggers and non-diggers (Table A1). The fossorial mammals have the
highest IFA and Thrinaxodon has the lowest (Figure 17). Due to the lack of an olecranon and the
difference in width of the epiphyseal ends, IFA may not provide enough information to the extent of
Thrinaxodon exhibiting fossorial or reptilian features.
The PC1 ulna displacement (Figure 11) illustrates the decline of the olecranon process on the
proximal end, whereas the PC2 (Figure 13) explains the decrease in anteroposterior length along the ulna
shaft. The indication of the ulna robustness is given by URI and is in relation to the insertion of muscles
involved in pronation and supination of the antebrachium (Elissamburu and De Santis 2011). The highest
URI are the fossorial mammals, digging reptiles, Cistecephalus, Cynognathus and Thrinaxodon (Figure
18). This evidence proves that there is an increase in robusticity among the species from non-digging
reptiles to fossorial mammals (Figure 18). The URI can be use to distinguish among the different types of
digging activity in species (Elissamburu and De Santis 2011).

45
Internal morphology
Cortical bone thickness responds to the activity the bone endures (Meier et al. 2013). It was stated
by Magwene (1993), that non-mammalian therapsids had less dense bones as they were subjected to
greater bending and torsion levels (Botha 2003). However, Cistecephalus and Thrinaxodon exhibited
%Ct.Ar that overlapped with extant species (Figure 19, Table A2). HRI provides a signal for the
robustness of the humerus. This index is related to digging activity and body support during a function
(Elissamburu and Vizcaino 2004; Elissamburu and De Santis 2011). When compared to all species,
Thrinaxodon paired closely to the fossorial mammals with 15.33% robustness (Figure 15) and 3% more
than the digging reptiles (Table A1).
Depending on the type of burrower, the humeral diaphysis is either rounded or flattened
anteroposterior (Ix) (Turnbull and Reed 1967). The increase in AP and ML, relates to the more strain that
is applied to the bone (Carlson 2014). The fossorial mammals have the highest AP and ML, followed by
Cistecephalus, Cynognathus and the digging reptiles (Figure 20, Figure 21). This would suggest that the
digging species have a higher activity lifestyle than non-diggers or arboreal species. As the bone shortens
proximodistally, it widens mediolaterally at its epiphyses, which allows for the enlarged muscle
attachment areas of wrist flexors and extensors. Thrinaxodon (Figure 25) and the fossorial mammals
(Figure 23) both exhibits high torsion angles. However, the fossorial torsion angles overlap with the non-
digging and arboreal species. This may explain that torsion observed in extant reptiles is directly related
to their sprawling posture. It has been stated in previous research that cortical thickness and torsion have a
corresponding relationship (Evans 1978). The cortical thickness and torsion statistical evidence alone
supports the hypothesis that Thrinaxodon exhibit fossorial-like morphology in the forelimb.
Limitations
The mass of each muscle was not reported for and through literature it is apparent that this weight
as well as size in relation to the other muscles plays a role in whether the muscle attached to the bone is

46
well adapted for the function. As the muscle size differs across locomotor ability, the extent to which the
muscle functions in the specific activity is unknown, i.e., the muscle mass would increase from arboreal
to fossorial species. To account for this, a dissection from each behavioural category should be
undertaken, where the muscles mass in relation to the bone should be noted.
Some of the fossil taxa’s humeral medullary space may have been filled with sediment which
revealed little to no space in the centre during digital segmentation. And this demonstrated difficulties as
the cavity was needed for the analyses of the cross sectional properties. To overcome the difficulty in
visualising the medullar cavity, it may be advised to have a histological analyses for the cortical structure.
There have been many observational studies on the different types of digging behaviour in extant
species and these assumptions have been made for the fossil taxon. However, the type of digging
behaviour exhibited in the fossil form will remain unknown. The extent of digging may be better
understood by incorporating the manus and hindlimb into research.
Conclusions
The research conducted aimed to examine the extent to which the Thrinaxodon forelimb reflects
fossorial morphology or forms of reptilian gait. Ultimately, the morphology supported that Thrinaxodon
forelimb morphology is close to that of fossorial mammals. However, due to the semi-sprawled limb
posture, Thrinaxodon does share minimal forelimb modifications with reptiles in order to keep its trunk
(body) from dragging on the ground. The musculoskeletal anatomy of Thrinaxodon displays adaptations
to a fossorial lifestyle and as being the transitional species from a reptilian phase to a parasagittal gait as
seen in extant fossorial mammals. The goal of this study was to enhance insight into the functional
morphology of Thrinaxodon forelimb through comparisons with species of different locomotor
behaviour, which was investigated by analyses of the indices, the PCA, and the internal and external
examination. There are true differentiations between the reptilian and mammalian forelimb. However,
there is evidence of gradual change among the synapsid group (Cistecephalus, Thrinaxodon and

47
Cynognathus) to illustrate these changes from the primitive state to a modern state, i.e., from reptilian to
mammalian. Cynodonts exhibit a primitive sprawling or semi-sprawling gait and the musculoskeletal
similarities to reptiles are postural rather than behavioural. Analyses of more therapsid species, which
includes the hindlimb, would permit a more comprehensive interpretation of the locomotion, gait and
behaviour among the species. This study provided direct anatomical evidence that the limb configuration
of Thrinaxodon indicates the non-mammalian forelimb form had begun to show similarities to the
mammalian form.
Acknowledgements
I sincerely thank my advisors, Dr. Kristian Carlson and Dr. Fernando Abdala, for providing
support, assistance, guidance and expertise. This research was funded by The Palaeontological Scientific
Trust (PAST) and its Scatterlings of Africa programmes as well as the National Research Foundation
(NRF). I gratefully wish to thank Dr. Tea Jashashvili for all her assistance and expertise on helping and
guiding me on the torsion method, Avizo, VG Studio Max, Morphologika, MorpholTools and JMP. I
humbly wish to thank Prof. Paul Manger and Mr. Brendon Billings (School of Anatomical Sciences,
University of the Witwatersrand) for their help in organising the dissection material for this research. A
thank you goes to Dr. Jonah Chioneire and Miss Casey Staunton for help on Inkskape 0.48 and Prof.
Graham Alexander for guidance on the reptilian species. The curators and collection managers of the
following institutions are acknowledged for allowing access to their specimens: ESI, APES, SAS,
DNMNH, MCZ, ANWC, QM and TM. I would also like to thank the University of the Witwatersrand
and the Evolutionary Studies Institute for the opportunity to conduct this research.

48
References:
ABDALA, F. and RIBEIRO, A. M. 2010. Distribution and diversity patterns of Triassic cynodonts
(Therapsida, Cynodontia) in Gondwana. Palaeogeography, Palaeoclimatology, Palaeoecology
286: 202-217.
ABDALA, V. and MORO, S. 2006. Comparative mycology of the forelimb of Liolaemus sand lizards
(Liolaemidae). Acta Zoologica (Stockholm) 87: 01-12.
ABDALA, V. and DIOGO, R. 2010. Comparative anatomy, homologies and evolution of the pectoral
and forelimb musculature of tetrapods with special attention to extant limbed amphibians and
reptiles. Journal of Anatomy 217: 536-573.
ALEXANDER, G. and MARAIS, J. 2007. A guide to the reptiles of Southern Africa. Struik Publishers.
Cape Town. South Africa.
ARGOT, C. 2001. Functional-adaptive anatomy of the forelimb in the didelphidae, and the
paleobiology of the Paleocene marsupials Mayulestes ferox and Pucadelphys andinus. Journal of
Morphology 247: 51-79.
BLOB, R. W. 2001.Evolution of Hindlimb posture in Nonmammalian Therapsids: Biomechanical Tests
of Palaeontological Hypotheses. Palaeontology 27: 14-38.
BLOB, R. W. and BIEWENER, A. A. 1999. In vivo locomotor strain in the hindlimb bones of
Alligator mississippiensis and Iguana iguana: implications for the evolution of limb bone safety
factor and non-sprawling limb posture. The Journal of Experimental Biology 202: 1023-1046.
BORDY, E. M., SZTANO, O., RUBIDGE, B. S. and BUMBY, A. 2009. Tetrapod burrows in the
southwestern main Karoo Basin (Lower Katberg Formation, Beaufort Group), South Africa.
Palaeontologica Africana 44: 95-99.
49
BOTHA, J. 2003. Biological aspects of the Permian dicynodont Oudenodon (Therapsida: Dicynodontia)
deduced from bone histology and cross-sectional geometry. Palaeontologica Africana 39: 37-44.
BOTHA, J., LEE-THORP, J. and SPONHEIMER, M. 2004. An examination of Triassic Cynodont tooth
enamel chemistry using Fourier Transform Infrared Spectroscopy. Calcified Tissue International
74: 162-169.
BOTHA, J., ABDALA, F. and SMITH, R. 2007. The oldest cynodont: new clues on the origin and early
diversification of the Cynodontia. Zoological Journal of the Linnean Society 149: 477-492.
BRANCH, B. 1998. Field guide to Snakes and other reptiles of Southern Africa. Struik Publishers. Cape
Town. South Africa.
CARLSON, K. J., JASHASVILI, T., HOUGHTON, K. WESTAWAY, M. C. and PATEL, B. A. 2013.
Joint loads in marsupial ankles reflect habitual bipedalism versus quadrupedalism. PLOS One. 08:
01-09.
CARLSON, K. J. 2005. Investigating the form-functional interface in African apes, relationships between
principal moments of area and positional behaviours in femoral and humeral diaphyses. American
Journal of Physical Anthropology 127: 312-334.
CARLSON, K. J. 2014. Linearity in the Real World: An experimental assessment of nonlinearity in
terrestrial locomotion. Chapter 14. In: CARLSON, K. J. and MARCHI, D. (eds) Reconstructing
Mobility: Environmental, Behavioural, and Morphological Determinants. Springer. New York.
United States of America.
CLUVER, M. A. 1978. The skeleton of the mammal-like reptile Cistecephalus with evidence for a
fossorial mode of life. Annals of The South African Museum 76: 213-246.

50
DAMIANI, R., MODESTO, S., YATES, A. and NEVELING, J. 2003. Earliest evidence of cynodont
burrowing. Proceedings of the Royal Society of London: Biological Sciences 270: 1747-1751.
ELISSAMBURU, A. and VIZCAINO, S. F. 2004. Limb proportions and adaptations in caviomorph
rodents (Rodentia: Caviomorpha). Proceedings of the Zoological Society of London, Journal of
Zoology 262: 145-159.
ELISSAMBURU, A. and DE SANTIS, L. 2011. Forelimb proportions and fossorial adaptations in the
scratch-digging rodent Ctenomys (Caviomorpha). Journal of Mammalogy 92: 683-689.
EVANS, F. G. 1978. Relations between torsion properties and histology of adult human compact bone.
Journal of Biomechanics 11: 157-165.
FERNANDEZ, V., ABDALA, F., CARLSON, K. J, COOK, D. C., RUBIDGE, B. S., YATES, A. and
TAFFOREAU, P. 2013. Synchrotron Reveals Early Triassic Odd Couple: Injured Amphibian
and Aestivating Therapsid Share Burrow. PLOS One 08: 01-07.
GRAND, T. I. and BARBOZA, P. S. 2001. Anatomy and development of the koala, Phascolarctos
cinereus: an evolutionary perspective on the superfamily Vombatoidea. Anatomy of Embryology
203: 211-223.
HILDEBRAND, M. 1985. Digging in quadrupeds. Functional vertebrate morphology. Belknap Press.
Cambridge. United Kingdom.
HILDEBRAND, M. and GOSLOW, G. E. J. 2001. Analysis of Vertebrate Structure. John Wiley and
Sons, Inc. New York. United States of America.
HOPSON, J. A. 1987. The mammal-like reptiles: A study of transitional fossils. The American Biology
Teacher 49: 16-26.

51
IQBAL, S. 2013. Comparative study of the forelimb of the Early Triassic cynodont Thrinaxodon
liorhinus: Exploring burrowing anatomy. BSc Honours Thesis. University of the Witwatersrand,
Johannesburg, South Africa.
IQBAL, S., CARLSON, K. J., ABDALA, F. and FERNANDEZ, V. in prep. Fossorial adaptations in
the forelimb of the Early Triassic cynodont Thrinaxodon liorhinus. Intended for Journal
of Morphology.
JASHASHVILI, T., LEBRUN, R. and CARLSON, K. J. 2011. Variation in morphology and torsion
patterns of metatarsals in Pan. The 80th annual meeting of the American Association of Physical
Anthropologists, Minnesota. Minneapolis. United States of America. April 12-16, pg. 177.
JENKINS, F. A. 1971. The postcranial skeleton of African cynodonts: Problems in the early evolution of
the mammalian postcranial skeleton. Bulletin of the Peabody Museum of Natural History 36: 1
-216.
JENKINS, F. A. Jr. 1973. The functional anatomy and evolution of the mammalian humero-ulnar
articulation. American Journal of Anatomy 137: 281–298.
KARDONG, K. V. 2002. Vertebrates: Comparative Anatomy, function, evolution. McGraw-Hill. New
York. USA.
KARDONG, K. V. 2009. Vertebrates: Comparative Anatomy, function, evolution. Sixth Edition.
McGraw-Hill. New York. USA.
KEMP, T. S. 1980. The primitive cynodont Procynosuchus: structure, function and evolution of the
postcranial skeleton. Philosophical Transactions of the Royal Society of London Biological
Sciences 288: 217-258.

52
KEMP, T. S. 1983. The relationships of mammals. Zoological Journal of the Linnean Society 77: 353
-384.
KEMP, T. S. 2005. The origin and evolution of mammals. Oxford University Press. Oxford. New York.
United States of America. Pp. 60-74.
LAMPING, B. 2012. The inquisitive thief. University of Wisconsin. Milwaukee. United States of
America.
LEBRUN, R. 2008. Evolution and development of the strepsirrhine primate skull. Double Doctorate.
University of Zurich. Switzerland.
LEBRUN, R., De LEON, M. P., TAFFOREAU, P. and ZOLLIKOFER, C. 2010. Deep evolutionary roots
of strepsirrhine primate labyrinthine morphology. Journal of Anatomy 216: 368-380.
LIEBERMAN, D. E., POLK, J. D. and DEMES, B. 2004. Predicting long bone loading from cross
sectional geometry. American Journal of Physical Anthropology 123: 156-171.
LUO, Z. and CROMPTON, A. W. 1994. Transformation of the quadrate (Incus) through the transition
from non-mammalian Cynodonts to mammals. Journal of Vertebrate Palaeontology 14: 341-374.
MAGWENE, P. M. 1993. What’s bred in the bone: histology and cross-sectional geometry of mammal
-like reptile long bones-evidence of changing physiological and biomechanical demands.
Unpublished MSc thesis. Harvard University. Cambridge. United States of America.
MEERS, M. B. 2003. Crocodilian forelimb musculature and its relevance to Archosauria. The Anatomical
Record Part A 274A: 891-916.
MEIER, P. S., BICKELMANN, C., SCHEYER, T. M., KOYABU, D. and SANCHEZ-VILLAGRA, M.
R. 2013. Evolution of bone compactness in extant and extinct moles (Talpidae): exploring
humeral microstructure in small fossorial mammals. BMC Evolutionary Biology 13: 01-10.
53
MILNE, N., VIZCAINO, S. F. and FERNICOLA, J. C. 2009. A 3D geometric morphometric analysis of
digging ability in the extant and fossil cingulated humerus. Journal of Zoology 278: 1-09.
NASTERLACK, T., CANOVILLE, A. and CHINSAMY, A. 2013. New insights into the biology of the
Permian genus Cistecephalus (Therapsida, Dicynodontia). Journal of Vertebrate Palaeontology
32: 1396-1410.
NICHOLSON, K. E. and RICHARDS, P. M. 2011. Home range size and overlap within an introduced
population of the Cuban Knight Anole, Anolis equestris (Squamata: Iguanidae). Phyllomedusa
1: 65-73.
PALMER, D. 1999. The Marshall illustrated Encyclopedia of dinosaurs and prehistoric animals.
Marshall Editions. London. England.
O’ NEILL, M. C. and RUFF. 2004. Estimating human long bone cross-sectional geometric properties: a
comparison of noninvasive methods. Journal of Human Evolution 47: 221-235.
REILLY, S. M. and DELANCEY, M. J. 1997. Sprawling locomotion in the lizard Sceloporus clarkia:
quantitative kinetics of a walking trot. The Journal of Experimental Biology 200: 753-765.
RUBIDGE, B. S. 1995. Biostratigraphy of the Beaufort Group (Karoo Supergroup): South African
Committee for Stratigraphy Biostratigraphy Series. Department of Mineral and Energy Affairs,
Geological Survey 1: 45.
RUBIDGE, B. S. 2005. Re-uniting lost continents: Fossil reptiles from the ancient Karoo and their
wanderlust. South African Journal of Geology 108: 135-172.
RUBIDGE, B. S. and SIDOR, C. A. 2001. Evolutionary patterns among Permo-Triassic Therapsids.
Annual Review of Ecology and Systematics 32: 449-480.

54
RUFF, C. B. and LARSON, C. S. 2014. Long bone structural analyses and the reconstruction of Past
mobility: a historical review. Chapter 2. In: CARLSON, K. J. and MARCHI, D. (eds)
Reconstructing Mobility: Environmental, Behavioural, and Morphological Determinants.
Springer. New York. United States of America.
RUTA, M., BOTHA-BRINK, J., MITCHELL, S. A. and BENTON, M. J. 2013. The radiation of
cynodonts and the ground plan of mammalian morphological diversity. Proceedings of the Royal
Society Biological Sciences 280: 1-10.
SANCHEZ-VILLAGRA, M. R., MENKE, P. R. and GEISLER, J. H. 2004. Patterns of evolutionary
transformation in the humerus of moles (Talpidae, Mammalia): a character analysis. Mammal
Study 29: 163-170.
SHAH, R. K., TRIVDEI, B. D., PATEL, J. P., SHAH, G. V. and NIRVANI, A. B. 2006. A study of angle
of humeral torsion. Journal of the Anatomical Society of India 55: 43-47.
SIDOR, C. A. and SMITH, R. M. H. 2004. A new galesaurid (Therapsida: Cynodontia) from the lower
Triassic of South Africa. Palaeontology 47: 535-556.
SPECHT, M., LEBRUN, R. and ZOLLIKOFER, C. P. E. 2007. Visualizing shape transformation
between chimpanzee and human braincases. Vis Comput 23: 743-751.
SOLOMON, E. P., BERG, L. R. and MARTIN, D. W. 2011. Biology. Brooks/Cole. Cengage Learning.
Canada.
SZALAY, F. S. 1994. Evolutionary history of the marsupials and an analysis of osteological
characters. Cambridge University Press. New York. USA.
TURNBULL, W. D. and REED, C. A. 1967. Pseudochrysochloris, a specialised burrowing mammal
from the Early Oligocene of Wyoming. Journal of Palaeontology 41: 623-631.

55
VIZCAINO, S. F., FARINA, R. A. and MAZZETTA, G. 1999. Ulnar dimensions and fossoriality in
armadillos and other South American mammals. Acta Theriologica 44: 309-320.
VIZCAINO, S.F. and MILNE, N. 2002. Structure and function in armadillo limbs (Mammalia: Xenarthra:
Dasypodidae). Journal of Zoology 257: 117-127.
WARBURTON, N. M., GREGOINE, L., JACQUES, S. and FLANDRIN, C. 2013. Adaptations for
digging in the forelimb muscle anatomy of the Southern brown bandicoot (Isoodon obesulus) and
bilby (Macrotis lagotis). Australian Journal of Zoology 61: 402-419.
ZELDITCH, M. L., SWIDERSKI, D. L., SHEETS, H. D. and FINK, W. L. 2004. Geometric
morphometrics for biologists. Elsevier Academic Press. Kirkwood. New York. United States
of America.

i
Appendix 1
Table A1: The functional indices (SMI, HRI, EI, IFA and URI) calculated for the forelimb by measurement of the DLH, HL, TDH, DEH, OL,
FUL and TDU.
Species Specimen
number *
DLH
(mm)
HL
(mm)
SMI
(%)
TDH
(mm)
HL
(mm)
HRI
(%)
DEH
(mm)
HL
(mm)
EI
(%)
OL
(mm)
FUL
(mm)
IFA
(%)
TDU
(mm)
FUL
(mm)
URI
(%)
Thrinaxodon BPI7199 18.95 34.58 54.80 5.30 34.58 15.33 18.30 34.58 52.92 0.62 30.09 2.06 2.09 30.09 6.95
**Cynognathus
(small) BPI1675 - - - - - - - - - 2.30 81.29 2.83 7.38 81.29 9.08
**Cynognathus
(large) BPI1675 56.12 94.36 59.47 12.42 94.36 13.16 47.47 94.36 50.31 5.04 139.92 3.60 13.51 139.92 9.66
Cistecephalus BPI2915 10.63 26.21 40.56 3.83 26.21 14.61 13.13 26.21 50.10 2.46 30.94 7.95 3.91 30.94 12.64
Vombatus
ursinus M10000 77.09 127.63 60.40 14.44 127.63 11.31 54.85 127.63 42.98 31.39 153.84 20.40 12.19 153.84 7.92
Lasiorhinus
kreffti J14051 76.93 125.58 61.26 21.87 125.58 17.42 58.39 125.58 46.50 33.52 155.35 21.58 9.88 155.35 6.36
Vombatus
ursinus A1258 64.55 107.36 60.12 17.69 107.36 16.48 46.07 107.36 42.91 32.37 140.08 23.11 13.37 140.08 9.54
Varanus
niloticus VN1 17.45 55.28 31.57 6.53 55.28 11.81 20.54 55.28 37.16 1.24 47.88 2.59 3.26 47.88 6.81
Varanus
niloticus VN2 20.27 56.13 36.11 5.56 56.13 9.91 18.88 56.13 33.64 0.65 50.75 1.28 2.82 50.75 5.56
Crocodylus
moreletti R 8 047 6.34 22.70 27.93 2.22 22.70 9.78 4.71 22.70 20.75 0.46 17.15 2.68 1.38 17.15 8.05
Crocodylus ZA913 56.96 144.47 39.43 17.87 144.47 12.37 40.33 144.47 27.92 6.61 101.70 6.50 10.33 101.70 10.16
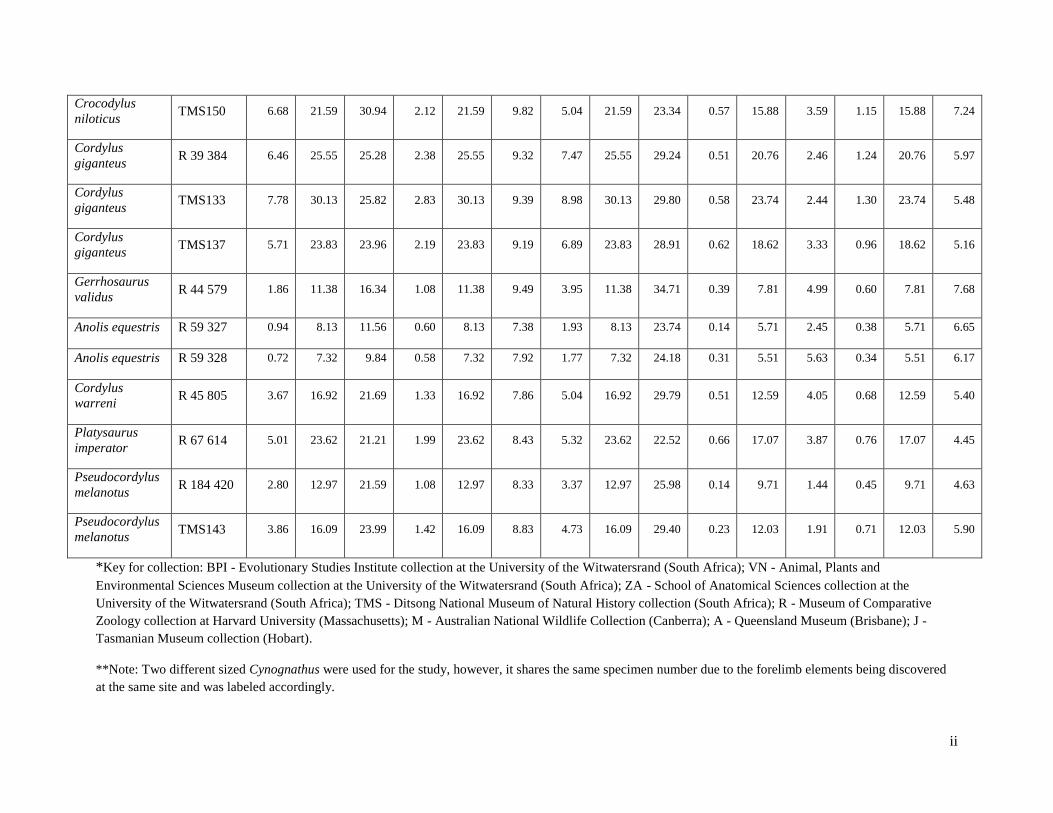
ii
Crocodylus
niloticus TMS150 6.68 21.59 30.94 2.12 21.59 9.82 5.04 21.59 23.34 0.57 15.88 3.59 1.15 15.88 7.24
Cordylus
giganteus R 39 384 6.46 25.55 25.28 2.38 25.55 9.32 7.47 25.55 29.24 0.51 20.76 2.46 1.24 20.76 5.97
Cordylus
giganteus TMS133 7.78 30.13 25.82 2.83 30.13 9.39 8.98 30.13 29.80 0.58 23.74 2.44 1.30 23.74 5.48
Cordylus
giganteus TMS137 5.71 23.83 23.96 2.19 23.83 9.19 6.89 23.83 28.91 0.62 18.62 3.33 0.96 18.62 5.16
Gerrhosaurus
validus R 44 579 1.86 11.38 16.34 1.08 11.38 9.49 3.95 11.38 34.71 0.39 7.81 4.99 0.60 7.81 7.68
Anolis equestris R 59 327 0.94 8.13 11.56 0.60 8.13 7.38 1.93 8.13 23.74 0.14 5.71 2.45 0.38 5.71 6.65
Anolis equestris R 59 328 0.72 7.32 9.84 0.58 7.32 7.92 1.77 7.32 24.18 0.31 5.51 5.63 0.34 5.51 6.17
Cordylus
warreni R 45 805 3.67 16.92 21.69 1.33 16.92 7.86 5.04 16.92 29.79 0.51 12.59 4.05 0.68 12.59 5.40
Platysaurus
imperator R 67 614 5.01 23.62 21.21 1.99 23.62 8.43 5.32 23.62 22.52 0.66 17.07 3.87 0.76 17.07 4.45
Pseudocordylus
melanotus R 184 420 2.80 12.97 21.59 1.08 12.97 8.33 3.37 12.97 25.98 0.14 9.71 1.44 0.45 9.71 4.63
Pseudocordylus
melanotus TMS143 3.86 16.09 23.99 1.42 16.09 8.83 4.73 16.09 29.40 0.23 12.03 1.91 0.71 12.03 5.90
*Key for collection: BPI - Evolutionary Studies Institute collection at the University of the Witwatersrand (South Africa); VN - Animal, Plants and
Environmental Sciences Museum collection at the University of the Witwatersrand (South Africa); ZA - School of Anatomical Sciences collection at the
University of the Witwatersrand (South Africa); TMS - Ditsong National Museum of Natural History collection (South Africa); R - Museum of Comparative
Zoology collection at Harvard University (Massachusetts); M - Australian National Wildlife Collection (Canberra); A - Queensland Museum (Brisbane); J -
Tasmanian Museum collection (Hobart).
**Note: Two different sized Cynognathus were used for the study, however, it shares the same specimen number due to the forelimb elements being discovered
at the same site and was labeled accordingly.
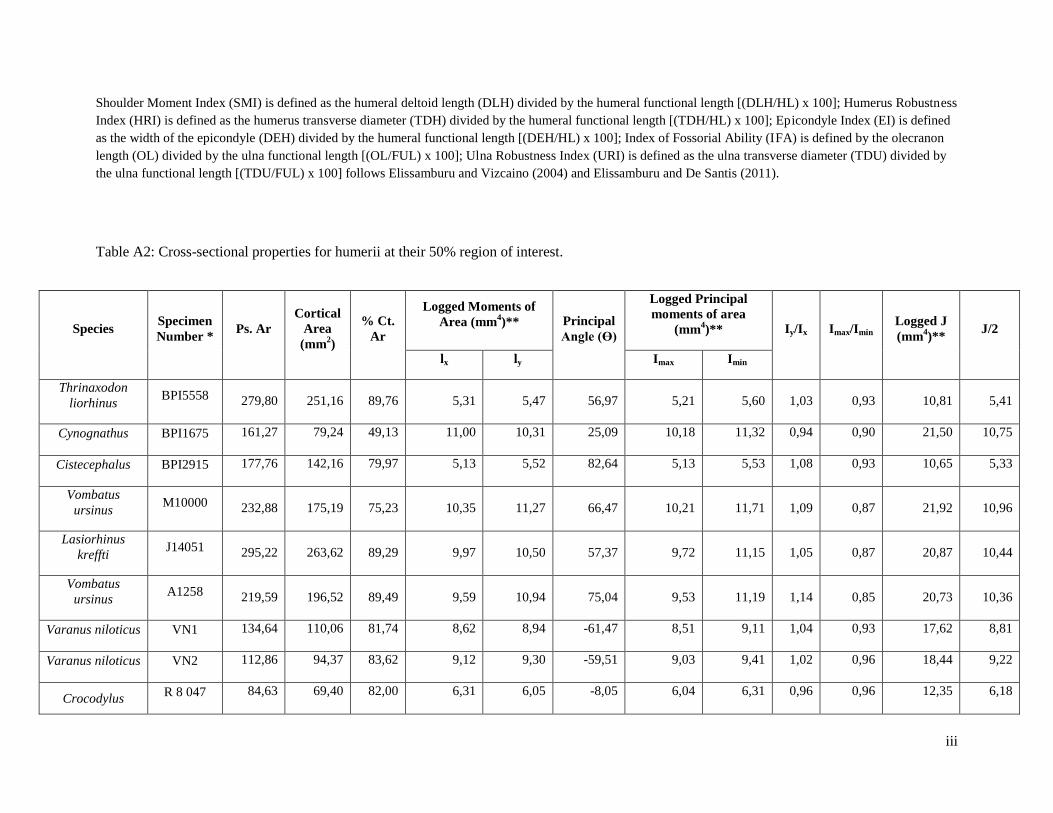
iii
Shoulder Moment Index (SMI) is defined as the humeral deltoid length (DLH) divided by the humeral functional length [(DLH/HL) x 100]; Humerus Robustness
Index (HRI) is defined as the humerus transverse diameter (TDH) divided by the humeral functional length [(TDH/HL) x 100]; Epicondyle Index (EI) is defined
as the width of the epicondyle (DEH) divided by the humeral functional length [(DEH/HL) x 100]; Index of Fossorial Ability (IFA) is defined by the olecranon
length (OL) divided by the ulna functional length [(OL/FUL) x 100]; Ulna Robustness Index (URI) is defined as the ulna transverse diameter (TDU) divided by
the ulna functional length [(TDU/FUL) x 100] follows Elissamburu and Vizcaino (2004) and Elissamburu and De Santis (2011).
Table A2: Cross-sectional properties for humerii at their 50% region of interest.
Species Specimen
Number * Ps. Ar
Cortical
Area
(mm2)
% Ct.
Ar
Logged Moments of
Area (mm4)** Principal
Angle (Ө)
Logged Principal
moments of area
(mm4)** Iy/Ix Imax/Imin
Logged J
(mm4)**
J/2
lx ly Imax Imin
Thrinaxodon
liorhinus BPI5558 279,80 251,16 89,76 5,31 5,47 56,97 5,21 5,60 1,03 0,93 10,81 5,41
Cynognathus BPI1675 161,27 79,24 49,13 11,00 10,31 25,09 10,18 11,32 0,94 0,90 21,50 10,75
Cistecephalus BPI2915 177,76 142,16 79,97 5,13 5,52 82,64 5,13 5,53 1,08 0,93 10,65 5,33
Vombatus
ursinus M10000 232,88 175,19 75,23 10,35 11,27 66,47 10,21 11,71 1,09 0,87 21,92 10,96
Lasiorhinus
kreffti J14051 295,22 263,62 89,29 9,97 10,50 57,37 9,72 11,15 1,05 0,87 20,87 10,44
Vombatus
ursinus A1258 219,59 196,52 89,49 9,59 10,94 75,04 9,53 11,19 1,14 0,85 20,73 10,36
Varanus niloticus VN1 134,64 110,06 81,74 8,62 8,94 -61,47 8,51 9,11 1,04 0,93 17,62 8,81
Varanus niloticus VN2 112,86 94,37 83,62 9,12 9,30 -59,51 9,03 9,41 1,02 0,96 18,44 9,22
Crocodylus R 8 047 84,63 69,40 82,00 6,31 6,05 -8,05 6,04 6,31 0,96 0,96 12,35 6,18

iv
moreletti
Crocodylus ZA913 133,29 121,46 91,12 12,70 12,60 11,39 12,59 12,70 0,99 0,99 25,29 12,65
Crocodylus
niloticus TMS150 115,91 71,00 61,26 5,49 5,45 42,25 5,31 5,67 0,99 0,94 10,97 5,49
Cordylus
giganteus R 39 384 89,46 60,78 67,94 6,64 6,58 -38,14 6,49 6,75 0,99 0,96 13,24 6,62
Cordylus
giganteus TMS133 92,89 59,98 64,57 7,27 7,14 -35,10 7,02 7,42 0,98 0,95 14,44 7,22
Cordylus
giganteus TMS137 80,79 54,83 67,87 6,67 6,40 -22,82 6,35 6,73 0,96 0,94 13,08 6,54
Gerrhosaurus
validus R 44 579 108,83 95,47 87,72 2,96 2,84 -16,77 2,83 2,97 0,96 0,95 5,80 2,90
Anolis equestris R 59 327 57,68 41,68 72,26 3,02 2,77 -1,79 2,77 3,02 0,92 0,92 5,78 2,89
Anolis equestris R 59 328 67,21 56,21 83,63 2,17 2,04 -2,64 2,04 2,17 0,94 0,94 4,21 2,11
Cordylus warreni R 45 805 82,34 72,74 88,34 5,05 5,02 -33,90 4,99 5,08 0,99 0,98 10,07 5,03
Platysaurus
imperator R 67 614 93,10 70,97 76,23 6,19 6,23 -49,52 6,09 6,34 1,01 0,96 12,44 6,22
Pseudocordylus
melanotus R184 420 73,62 69,58 94,52 4,19 4,16 -41,59 4,06 4,31 0,99 0,94 8,37 4,19
Pseudocordylus
melanotus TMS143 86,17 64,64 75,02 4,81 4,76 -40,10 4,64 4,95 0,99 0,94 9,60 4,80
*Key for collection: BPI - Evolutionary Studies Institute collection at the University of the Witwatersrand (South Africa); VN - Animal, Plants and
Environmental Sciences Museum collection at the University of the Witwatersrand (South Africa); ZA - School of Anatomical Sciences collection at the
University of the Witwatersrand (South Africa); TMS - Ditsong National Museum of Natural History collection (South Africa); R - Museum of Comparative
Zoology collection at Harvard University (Massachusetts); M - Australian National Wildlife Collection (Canberra); A - Queensland Museum (Brisbane); J -
Tasmanian Museum collection (Hobart).
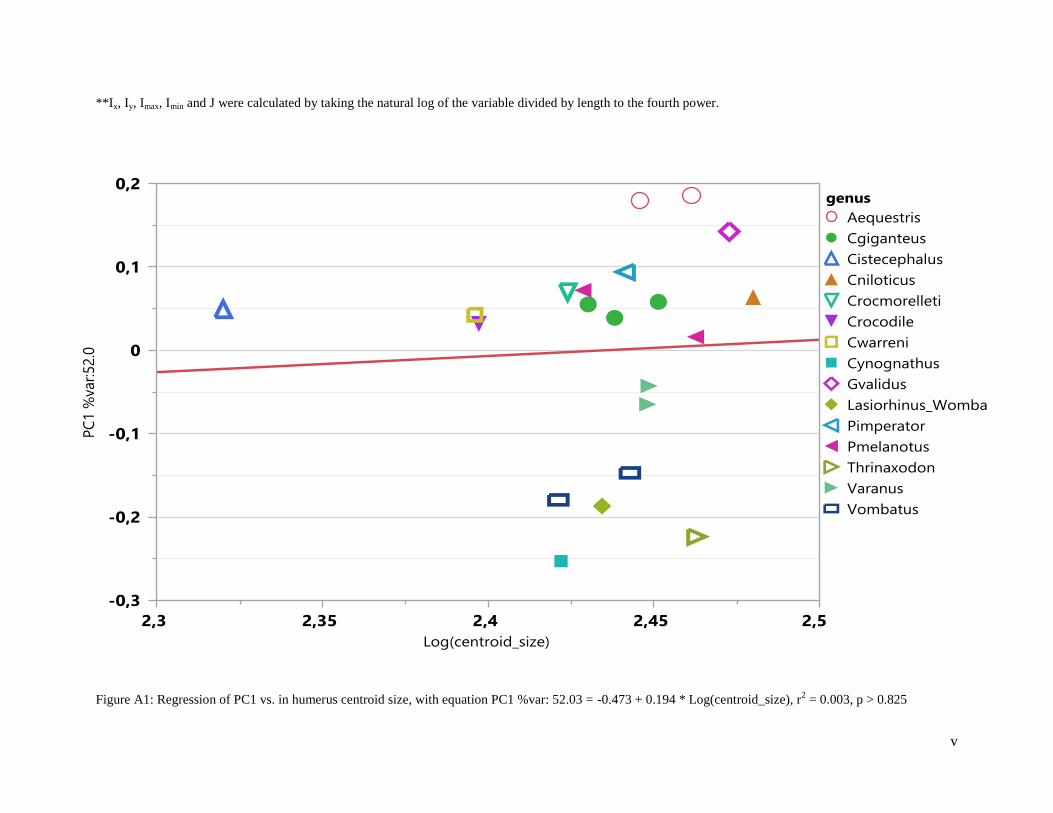
v
**Ix, Iy, Imax, Imin and J were calculated by taking the natural log of the variable divided by length to the fourth power.
Figure A1: Regression of PC1 vs. in humerus centroid size, with equation PC1 %var: 52.03 = -0.473 + 0.194 * Log(centroid_size), r2 = 0.003, p > 0.825

vi
Figure A2: Regression of PC2 vs. in humerus centroid size, with equation PC2 %var: 21.40 = -2.265 + 0.930 * Log(centroid_size), r2 = 0.148, p > 0.085
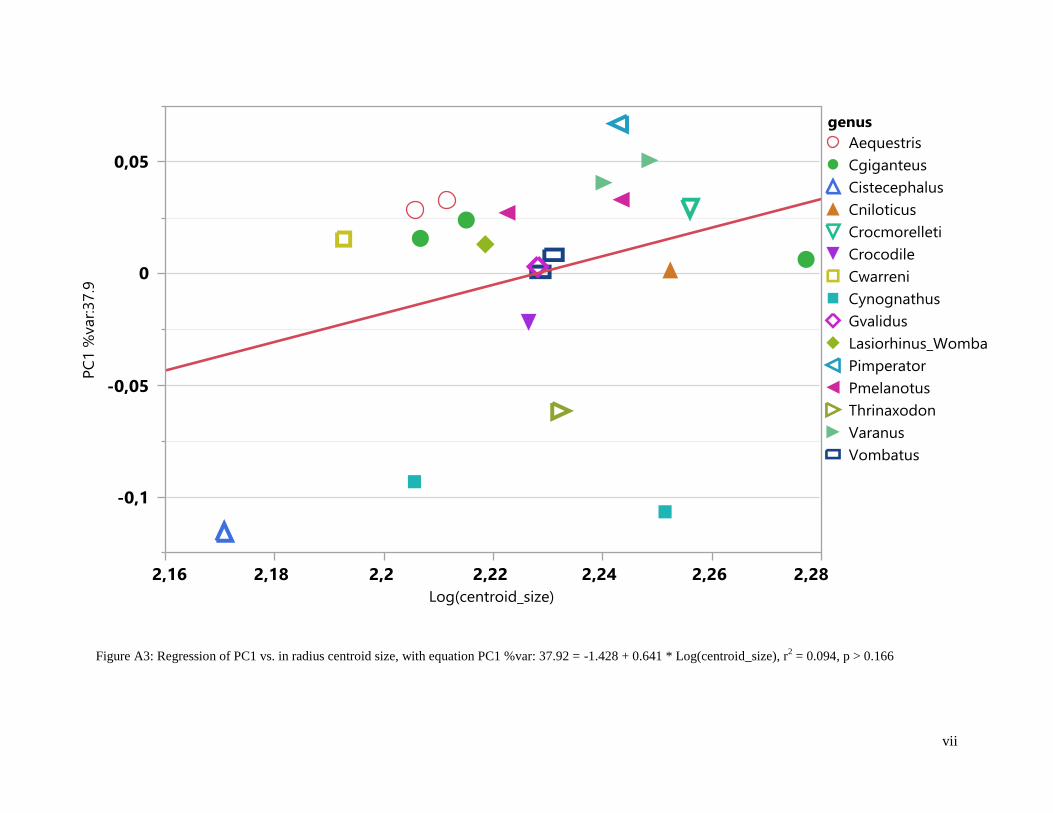
vii
Figure A3: Regression of PC1 vs. in radius centroid size, with equation PC1 %var: 37.92 = -1.428 + 0.641 * Log(centroid_size), r2 = 0.094, p > 0.166

viii
Figure A4: Regression of PC2 vs. in radius centroid size, with equation PC2 %var: 23.70 = -0.016 + 0.007 * Log(centroid_size), r2 = 0, p > 0.985

ix
Figure A5: Regression of PC1 vs. in ulna centroid size, with equation PC1 %var: 48.38 = -6.409 + 2.683 * Log(centroid_size), r2 = 0.046, p < 0.009

x
Figure A6: Regression of PC2 vs. in ulna centroid size, with equation PC2 %var: 23.51 = -0.048 + 0.020 * Log(centroid_size), r2 = 0, p > 0.979

xi
Appendix 2
List of Landmarks
Table A3: Humeral landmarks for taxa in the study.
Element View*
Position
Head Anterior 1. Head anterior most
Posterior 2. Head posterior most
Superior 3. Head lateral
Superior 4. Head medial
Anterior 5. Head central of the articulating surface
Tuberosity Superior 6. Lesser tuberosity dorsal (Posterior)
Superior 7. Lesser tuberosity ventral (Anterior)
Superior 8. Greater tuberosity posterior (dorsal)
Superior 9. Greater tuberosity anterior (Ventral)
Deltopectoral crest Lateral 10. Deltopectoral crest proximal (Under the head)
Lateral 11. Deltopectoral crest tip (Highest point)
Lateral 12. Deltopectoral crest contact with diaphysis (Lowest point)
Bicipital groove Superior 13. Proximal point bicipital groove
Entepicondylar Medial 14. Entepicondyle dorsal margin (Posterior projection)
Medial 15. Entepicondyle ventral margin (Anterior)
Medial 16. Contact of disto-medial-dorsal crest (Shaft meets the
curvature) – which start in the entepicondyle
Ectepicondylar Lateral 17. Ectepicondyle dorsal margin (Posterior – Above capitulum)
Lateral 18. Ectepicondyle ventral margin (Anterior – above capitulum)
Lateral 19. Proximal point of the disto-lateral crest (At the end of the
crest)
Distal articulation
condyle
Inferior 20. Distal articulation anterior (ventral-lateral)
Inferior 21. Distal articulation anterior (ventral-medial)
Inferior 22. Distal articulation posterior (dorsal-lateral)
Inferior 23. Distal articulation posterior (dorsal-medial)
Trochlea Inferior 24. Distal articulation anterior
Inferior 25. Distal articulation posterior
Inferior 26. Distal articulation deepest point
Diaphysis Posterior 27. Mid shaft posterior
Lateral 28. Mid shaft lateral
Medial 29. Mid shaft medial
*The view column represents the orientation of the bone when positioning landmarks.
Table A4: Radial landmarks for taxa in the study.
Element View*
Position
Head (Proximal end) Superior 1. Posterior margin
Superior 2. Anterior margin
Superior 3. Lateral margin
Superior 4. Medial margin

xii
Superior 5. Central of the articulating surface
Radial tuberosity 6. Central point
Distal articular surface Inferior 7. Posterior margin
Inferior 8. Anterior margin
Inferior 9. Lateral margin
Inferior 10. Medial margin
Diaphyseal location from
proximal end
11. Posterior margin of the 50% length
12. Anterior margin of the 50% length
13. Lateral margin of the 50% length
14. Medial margin of the 50% length
15. Posterior margin of the 75% length
16. Anterior margin of the 75% length
17. Lateral margin of the 75% length
18. Medial margin of the 75% length
*The view column represents the orientation of the bone when positioning landmarks.
Table A5: Ulnar landmarks for taxa in the study.
Element View*
Position
Olecranon Superior 1. Posterior margin
Superior 2. Anterior margin
Superior 3. Lateral (Radial notch)
Superior 4. Medial margin
Ulna-Trochlea notch Medial 5. Proximal anconeal process tip
Medial 6. Articulation deepest point
Medial 7. Distal point on keel of articulation
Medial 8. Lateral most margin
Medial 9. Medial most margin
Radial-Ulna notch Lateral 10. Tip of radial notch - Lateral most margin
Lateral 11. Medial most margin
Distal articular surface Inferior 12. Posterior margin
Inferior 13. Anterior margin
Inferior 14. Lateral margin
Inferior 15. Medial margin
Diaphyseal location from
proximal end
16. Posterior margin of the 50% length
17. Anterior margin of the 50% length
18. Lateral margin of the 50% length
19. Medial margin of the 50% length
20. Posterior margin of the 75% length
21. Anterior margin of the 75% length
22. Lateral margin of the 75% length
23. Medial margin of the 75% length
*The view column represents the orientation of the bone when positioning landmarks.

xiii
Appendix 3
Muscles
From the dissection of the reptile, Crocodylus, the muscle attachment for Thrinaxodon was
inferred with reference to the muscle scars that were observed during segmentation and landmark
analyses of the forelimb. References used for interpretation were Grand and Barboza (2001), Meers
(2003) and Abdala and Diogo (2010). However, it is noteworthy to state that Thrinaxodon being a
mammal-like reptile, is similar in forelimb structure to reptiles but shares similarity to mammals in their
muscle attachment. The muscle actions were inferred from the morphological perspective rather than the
physiological aspect.
M. latissimus dorsi which originates from the thoracodorsal fascia of the vertebrae, inserts on the
lateral side of the humeral head (Figure A7). This muscle is an extensor and retracts the humerus dorsally.
M. subscapularis is a stabiliser of the shoulder and originates on the medial surface of the
scapula. This muscle inserts on the articular capsule of the humerus.
M. scapulohumeralis caudalis originates from the caudal region of the scapula and inserts on the
proximal end of the humerus by convergence (Figure A7). It elevates and protracts the humerus as well as
stabilises the glenohumeral joint.
M. deltoideus scapularis takes its origin from the lateral surface of the scapula and inserts on the
lateral side of the proximal end of the humerus. This muscle acts as a stabiliser of the shoulder joint and
abducts the humerus. M. deltoideus clavicularis originates on the cranial margin of the scapula and inserts
on the deltopectoral crest (Figure A7). It protracts the humerus and is a flexor of the forearm.

xiv
Figure A7: Posterior view of Thrinaxodon humerus with muscles scars that were visible during
analyses. - Muscle Origin and - Muscle Insertion.
M. triceps brachii consists of five muscle heads which are the m. triceps longus lateralis, m.
triceps longus caudalis, m. triceps brevis cranialis, m. triceps brevis intermedius and m. triceps brevis
caudalis. The m. triceps brachii flexes the brachium and extends the antebrachium, which aids in support
of the reptilian flexed-limb posture. M. triceps longus muscles originate on the scapula and converge to
insert on the ulna (Figure A10). M. triceps brevis cranialis and m. triceps brevis caudalis originate from
the humeral head and insert into the deep tendons on the lateral epicondyle (Figure A8).
M. pectoralis originates on three different parts of the sternum and converges to insert on the
deltopectoral crest of the humerus (Figure A8). It is a powerful ventral flexor and adductor that is
responsible for retracting the humerus. Consequently, m. pectoralis has an important role in maintaining
flexed limb posture in reptiles (Meers 2003).
M. supracoracoideus longus is a muscle that protracts and adducts the humerus with an origin on
the cranial surface of the scapula and an insertion on the apex of the deltopectoral crest of the humerus.
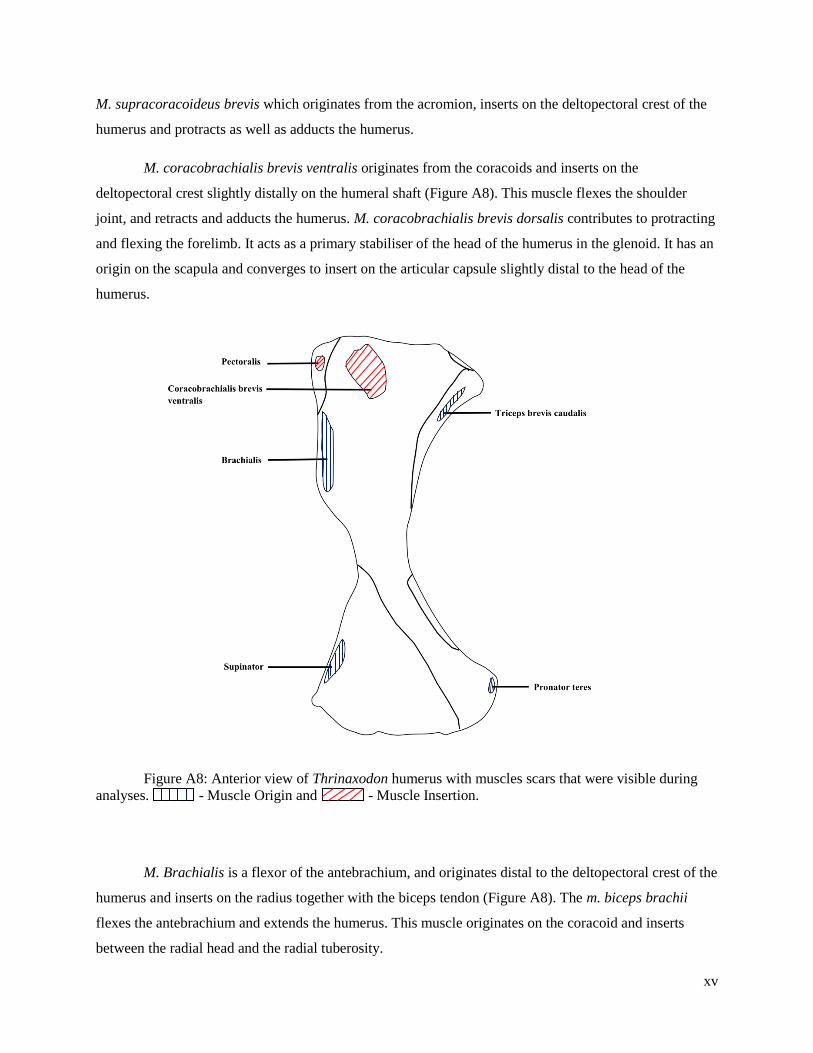
xv
M. supracoracoideus brevis which originates from the acromion, inserts on the deltopectoral crest of the
humerus and protracts as well as adducts the humerus.
M. coracobrachialis brevis ventralis originates from the coracoids and inserts on the
deltopectoral crest slightly distally on the humeral shaft (Figure A8). This muscle flexes the shoulder
joint, and retracts and adducts the humerus. M. coracobrachialis brevis dorsalis contributes to protracting
and flexing the forelimb. It acts as a primary stabiliser of the head of the humerus in the glenoid. It has an
origin on the scapula and converges to insert on the articular capsule slightly distal to the head of the
humerus.
Figure A8: Anterior view of Thrinaxodon humerus with muscles scars that were visible during
analyses. - Muscle Origin and - Muscle Insertion.
M. Brachialis is a flexor of the antebrachium, and originates distal to the deltopectoral crest of the
humerus and inserts on the radius together with the biceps tendon (Figure A8). The m. biceps brachii
flexes the antebrachium and extends the humerus. This muscle originates on the coracoid and inserts
between the radial head and the radial tuberosity.

xvi
The m. humeroradialis leaves a scar on the ventral surface of the humerus with an origin from the
proximal end of the humerus (Figure A7) and an insertion on the proximal end of the radius (Figure A9).
This muscle flexors the antebrachium.
The m. teres major elevates the humerus, originates on the lateral surface of the scapula and
inserts on the humerus proximally opposite the deltopectoral crest.
Figure A9: Anterior view of Thrinaxodon radius with muscles scars that were visible during
analyses. - Muscle Origin and - Muscle Insertion.
The m. supinator of the antebrachium originates from the epicondyle of the humerus (Figure A8)
and inserts on the shaft of the radius.
M. extensor carpi radialis longus and m. extensor carpi ulnaris longus originate on opposite ends
of the humeral epicondyles and insert in the wrist. The m. extensor carpi radialis brevis extends the wrist
and adducts the hand. The extensor muscles originate on the lateral surface of the forelimb and insert on

xvii
its medial surface, whereas the flexor muscles originate on the medial surface and insert on its lateral
surface.
M. Flexor carpi ulnaris originates on the epicondyle of the humerus and inserts on the wrist. The
m. flexor digitorum longus consists of m. flexor digitorum longus pars humeri, m. flexor digitorum longus
pars ulnaris and m. flexor digitorum longus pars carpalis. These muscles take their origin from the
epicondyle of the humerus, the ulna head and distal end of the ulna. It inserts and flexes the wrist and
hand.
The m. pronator teres originates on the epicondyle of the humerus (Figure A8) and inserts on the
shaft of the radius. This muscle pronates the antebrachium while flexing the radiohumeral joint which
maintains the sprawling posture. M. pronator quadratus pronates and stabilisers the antebrachium. It
originates on the shaft of the radius (Figure A9) and inserts on the shaft of the ulna (Figure A10).
Figure A10: Posterior view of Thrinaxodon ulna with muscles scars that were visible during
analyses. - Muscle Origin and - Muscle Insertion.